The Pullback Panic? Your Whole Plan Dies?!!!!!One red candle is all it takes to destroy your entire plan.
Why do we panic so fast? Why do we exit too early before a rally?
And worse: why do we FOMO back in at the worst possible time?
Hello✌️
Spend 3 minutes ⏰ reading this educational material.
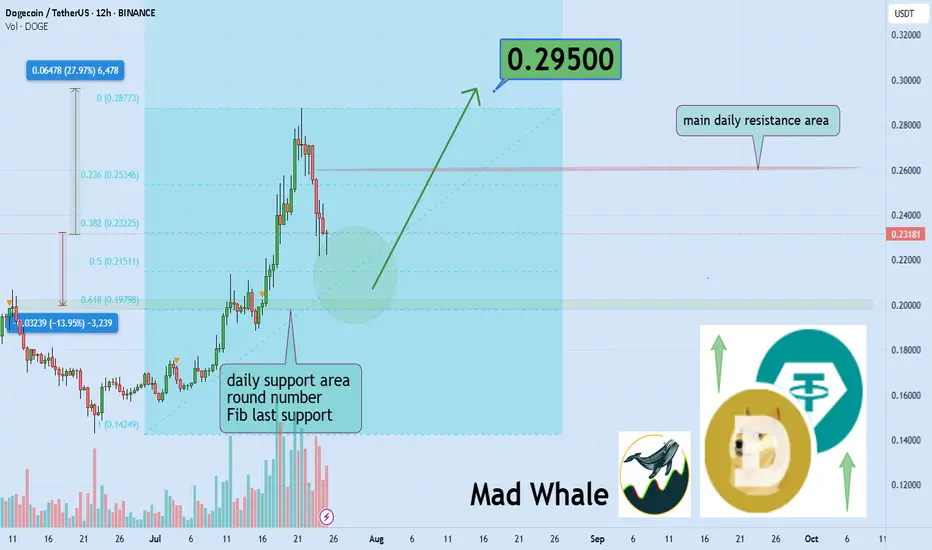
🎯 Analytical Insight on Dogecoin:
BINANCE:DOGEUSDT is approaching the key psychological level of 0.20, which also aligns with a strong daily support and the final Fibonacci retracement zone 🧭. Despite recent volatility, it continues to hold its mid-range Fib level, suggesting potential accumulation. If this support holds, a rebound toward the 0.30 resistance — a move of around 27% remains on the table 🎯.
Now , let's dive into the educational section,
🧠 The Victim Mindset in Crypto Markets
Here’s the uncomfortable truth.
Most traders believe they’re making rational decisions but in reality, they’re reacting emotionally to past pain.
One bad experience during a correction makes us fear all pullbacks.
Missing one big rally creates constant FOMO.
We can’t handle drawdowns but we accept buying tops again and again.
It’s not just you. This is how most retail traders operate and whales know it.
🐳 How Whales Profit From Our Fear
Whales never buy during hype. They buy during fear.
Mini pullbacks, shakeouts and false breakdowns are designed for one thing.
To make you exit so they can enter.
A red candle, a small wick, maybe a fake support break.
We sell out of fear, they buy the dip.
We FOMO back in too late.
Pullbacks are not just price moves. They are psychological traps.
📈 How to Break This Cycle
You don’t need to predict the future. You need to understand yourself.
Ask if this correction is technical or emotional.
Use confirmation from volume, OI and divergence.
Enter after traps, not inside them.
Question your feelings before every move.
You are not trading the chart. You’re trading your mind reacting to the chart.
📊 TradingView Tools to Escape the Fear Greed Cycle
TradingView gives you access to several practical indicators that can help protect your capital from emotional decision-making.
🔹 Fear and Greed Index (Crypto)
Simple but powerful. When the index drops below 30, most traders are in panic mode. That is exactly where whales accumulate, while we run away.
🔹 Open Interest Heatmaps
When open interest rises but price stays flat, it often signals an upcoming shakeout. One scary-looking red candle and the weak hands are gone.
🔹 Volume Profile and VPVR
Perfect for distinguishing between healthy corrections and manipulative dumps. If price pulls back but buying volume remains strong, it's not a real sell-off. It’s a trap.
🔹 Divergence Indicators like MACD or RSI
If RSI rises during a pullback, there’s a hidden bullish divergence. Exiting may be the worst thing to do.
🔹 Liquidity Maps
These show where stop losses and liquidation clusters are located. Often before any major move up, the market takes a detour to liquidate these levels.
Use these tools to stop reacting emotionally and start trading rationally.
📍 Final Thoughts
Small corrections are not the enemy.
Your emotional reaction to them is the real threat.
Before you panic-exit, ask yourself if this fear is justified or just mental conditioning.
The market always gives second chances but we rarely wait for them.
✨ Need a little love!
We pour love into every post your support keeps us inspired! 💛 Don’t be shy, we’d love to hear from you on comments. Big thanks , Mad Whale 🐋
📜Please make sure to do your own research before investing, and review the disclaimer provided at the end of each post.
Community ideas
Understanding ROI in Crypto: More Than Just a NumberHello, Traders! 👏
Return on Investment (ROI) is often the first metric new investors focus on when evaluating an asset, a strategy, or even their trading performance. It’s easy to see why. It's simple, intuitive, and widely used across both traditional finance and the cryptocurrency sector. One formula, and suddenly you have a "score" for your investment. Green is good. Red is bad. Right?
Well…Not quite.
In the crypto market, where price swings can be extreme, timelines are compressed, and risk profiles differ significantly from those in traditional markets, a simplistic ROI figure can be dangerously misleading.
A 50% ROI on a meme coin might look great, until you realize the token is illiquid, unbacked, and you're the last one holding the bag. Conversely, a 10% ROI on a blue-chip crypto asset with strong fundamentals might be significantly more meaningful in risk-adjusted terms.
In this article, we'll delve beyond the basic formula and break down what ROI really tells you, how to use it correctly, and where it falls short. Let's go!
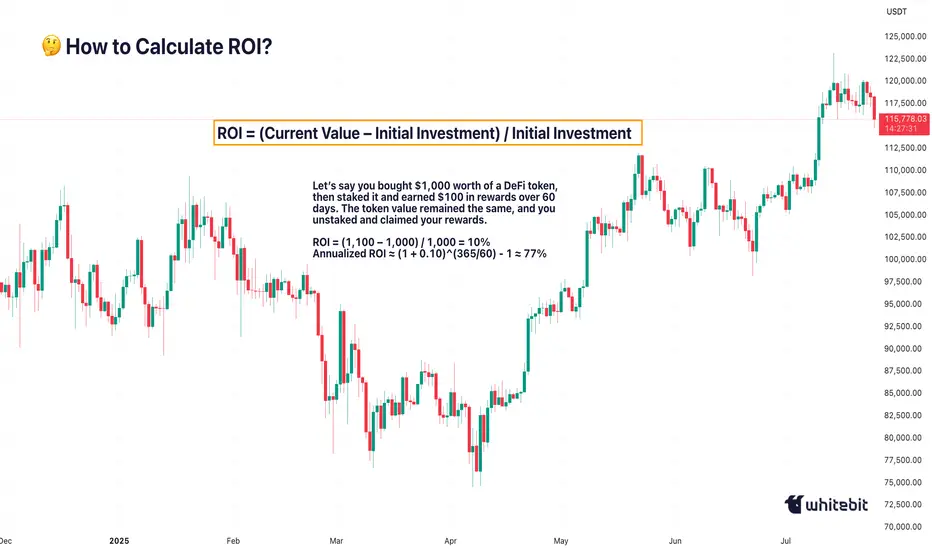
What Is ROI and How Do You Calculate It?
The Basic Formula for Return on Investment Is: ROI = (Current Value – Initial Investment) / Initial Investment.
Let’s say you bought ETH at $2,000 and sold it at $2,600: ROI = (2,600 – 2,000) / 2,000 = 0.3 → 30%. Seems straightforward. You made 30% profit. However, crypto is rarely straightforward.
What if you held it for 2 years? Or 2 days? What if gas fees, staking rewards, or exchange commissions altered your real costs or returns? Did you include opportunity cost and the profits missed by not holding another asset? ROI as a raw percentage is just the beginning. It’s a snapshot. However, in trading, we need motion pictures, full narratives that unfold over time and within context.
Why Time Matters (And ROI Ignores It)
One of the most dangerous omissions in ROI is time.
Imagine two trades: Trade A returns 20% in 6 months. Trade B returns 20% in 6 days.
Same ROI, very different implications. Time is capital. In crypto, it’s compressed capital — markets move fast, and holding a position longer often increases exposure to systemic or market risks.
That’s why serious traders consider Annualized ROI or utilize metrics like CAGR (Compound Annual Growth Rate) when comparing multi-asset strategies or evaluating long-term performance.
Example: Buying a Token, Earning a Yield
Let’s say you bought $1,000 worth of a DeFi token, then staked it and earned $100 in rewards over 60 days. The token value remained the same, and you unstaked and claimed your rewards.
ROI = (1,100 – 1,000) / 1,000 = 10%
Annualized ROI ≈ (1 + 0.10)^(365/60) - 1 ≈ 77%
Now that 10% looks very different when annualized. But is it sustainable? That brings us to the next point…
ROI Without Risk Analysis Is Useless
ROI is often treated like a performance badge. But without risk-adjusted context, it tells you nothing about how safe or smart the investment was. Would you rather: Gain 15% ROI on a stablecoin vault with low volatility, or Gain 30% ROI on a microcap meme token that could drop 90% tomorrow?
Traders use metrics such as the Sharpe Ratio (which measures returns versus volatility), Maximum Drawdown (the Peak-to-Trough Loss During a Trade), and Sortino Ratio (which measures returns versus downside risk). These offer a more complete picture of whether the return was worth the risk. ⚠️ High ROI isn’t impressive if your capital was at risk of total wipeout.
The Cost Side of the Equation
Beginners often ignore costs in their ROI math. But crypto isn’t free: Gas fees on Ethereum, trading commissions, slippage on low-liquidity assets, impermanent loss in LP tokens, maybe even tax obligations. Let’s say you made a 20% ROI on a trade, but you paid 3% in fees, 5% in taxes, and lost 2% in slippage. Your actual return is likely to be closer to 10% or less. Always subtract total costs from your gains before celebrating that ROI screenshot on X.
Final Thoughts: ROI Is a Tool, Not a Compass
ROI is beneficial, but not omniscient. It’s a speedometer, not a GPS. You can use it to reflect on past trades, model future ones, and communicate performance to others, but don’t treat it like gospel.
The real ROI of any strategy must also factor in time, risk, capital efficiency, emotional stability, and your long-term goals. Without those, you’re not investing. You’re gambling with better math. What do you think? 🤓
Flat, Quiet… and Full of Clues .Most traders only see the middle.
The acceleration. The “trend”. The movement.
But that’s just one-third of the story.
If you really want to understand the market’s rhythm,
you need to study how moves begin, evolve, and die.
Let’s break down the 3 key phases every market goes through —
again, and again, and again.
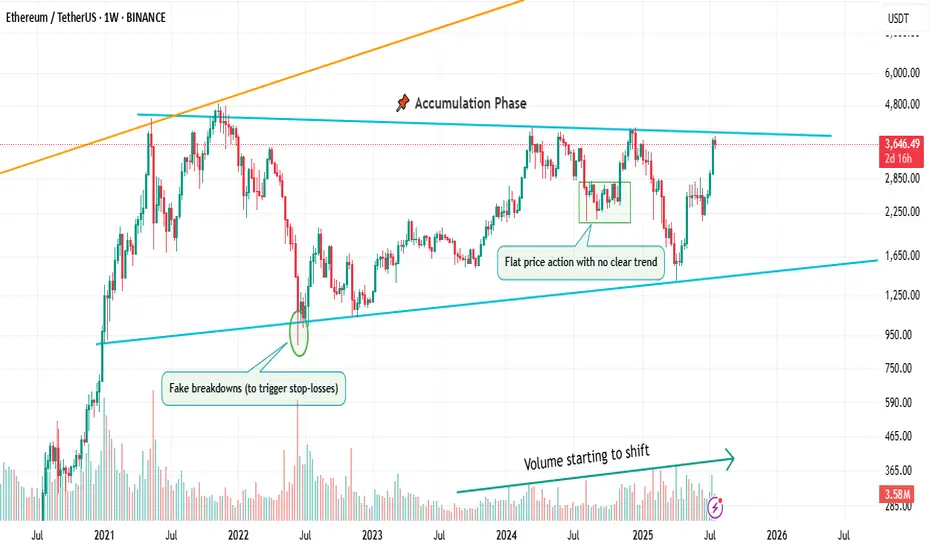
📌 1. Accumulation Phase
This is the part no one talks about.
Why? Because it’s boring. Choppy. Range-bound. Confusing.
Most traders get shaken out here.
But smart money? They’re quietly buying.
You’ll often see:
Flat price action with no clear trend
Fake breakdowns (to trigger stop-losses)
Volume starting to shift
Long wicks — both directions
This phase is a test of patience, not prediction.
And if you learn to read it well, you’ll start catching moves before they go parabolic.
🚀 2. Markup / Acceleration Phase
Here’s where everyone wakes up.
Momentum kicks in.
News gets bullish.
Breakouts start working.
Pullbacks are shallow.
And suddenly, everyone’s calling it a bull market.
But don’t be fooled.
This is not where smart money enters — this is where they ride the wave they already created.
Learn to:
Ride trends, not chase them
Add on pullbacks
Avoid FOMO entries
This is the fastest and most emotional part of the cycle — which means it rewards discipline, not excitement.
🧯 3. Distribution Phase
The party’s still on… but the hosts are quietly leaving.
Price starts to stall.
Breakouts stop working.
Volume gets heavy at the top.
And the same excitement that brought everyone in?
It’s now being used to sell into.
Distribution is sneaky.
It’s not an obvious top.
It’s a process — just like accumulation.
You’ll often see:
Lower highs forming quietly
False breakouts to trap buyers
Increasing volatility
Bullish news… with no follow-through
If you’re not paying attention, you’ll keep buying strength —
right before the rug gets pulled.
So what’s the lesson here?
Markets don’t just “go up or down.”
They prepare, move, then exhaust.
And if you learn to spot these transitions —
you’ll stop reacting late
and start positioning early.
That’s the real edge.
currently we are on the accumulation phase so in this idea I tried to show you the real story behind it and as well talk about the two others to beware of them also in the right moment I will talk about them , but for now let's focous on the current phase because we want to be part of the smart money and enjoy the next phase which is 🚀Markup / Acceleration Phase .
—
🧠 Save this post.
🔁 Revisit it when you’re confused.
📊 Because the chart isn’t random — it’s just cycling
And also remember our golden rule :
🐺 Discipline is rarely enjoyable , but almost always profitable. 🐺
🐺 KIU_COIN 🐺
The Markets, the Rabbi and the Goat...It’s funny how sometimes markets react like people in old jokes…
They scream when things get bad, then cheer wildly when things return to how they were — as if something amazing just happened.
Let me tell you one of those jokes.
It’s about a house, a rabbi… and a goat.
A man goes to the Rabbi:
“Rabbi, my house is too small. The kids are screaming, my wife’s yelling, I’m losing my mind!”
The Rabbi calmly replies:
“Bring in the chicken.”
Two days later:
“Rabbi, it’s worse!”
Rabbi:
“Now bring in the duck.
Then the pig.
And finally… the goat."
Now the house is in complete chaos. Smell, noise, no space to move or breathe.
The man returns, ready to break down:
“Rabbi, this is hell!”
The Rabbi smiles:
“Now take them all out.”
A few days later, the man comes back glowing:
“Rabbi… it’s incredible! So much space! So quiet! So fresh!”
📉 Now, 2025 markets
In April, Trump imposed tariffs.
Markets fall sharply. Analysts scream recession. Headlines go full drama.
Recently, “brand new deals” have been announced.
Markets explode to new all-time highs.
Applause. Celebration. “Stability is back.”
But if you read the fine print…
The deal is basically the same old deal. Renegotiated. Repackaged.
Just without the goat.

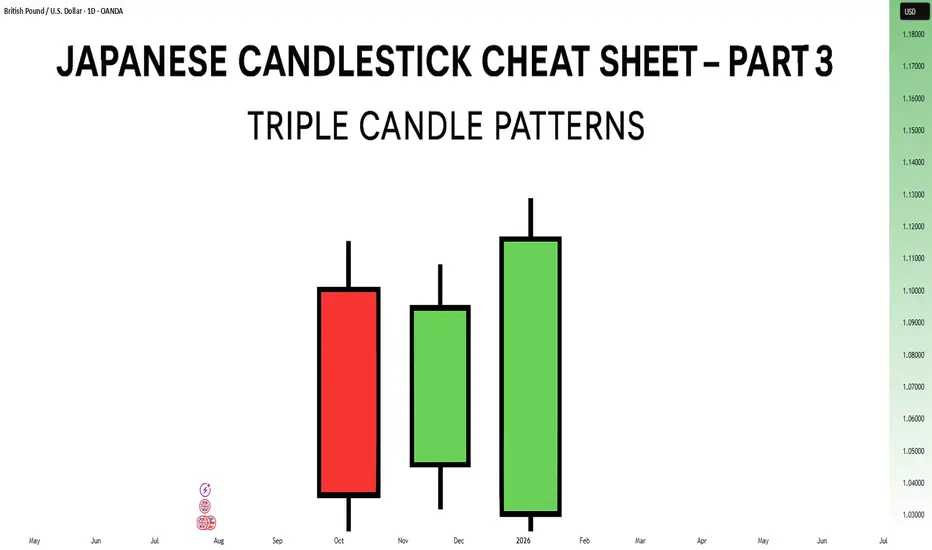
Japanese Candlestick Cheat Sheet – Part Three- 3 candle patternsSo far in this series, we've broken down single candle formations ( Part 1 ) and explored double candle signals ( Part 2 ) — the kind of patterns that give you quick, often powerful hints about the market’s mood.
But now it’s time to go a step further.
👉 In Part 3, we dive into triple candlestick formations — patterns that take more time to form, but often offer stronger confirmation and a more reliable narrative.
They’re like reading three full sentences from the market instead of just one or two words.
If you’re ready to spot momentum shifts (not noise), this lesson is for you.
Let’s decode the story behind formations like Morning Star, Three White Soldiers, and so on.
MORNING STAR
Bias: Bullish
What is the Morning Star pattern?
The Morning Star pattern consists of a bearish candle, a small-bodied middle candle, and a bullish candle, forming at the end of a downtrend to signal potential reversal. This pattern reflects a shift from seller dominance to buyer strength, as the middle candle marks a pause before a reversal. The Morning Star is a reliable signal that buyer interest is reemerging.
Understanding Morning Stars helps traders anticipate shifts in momentum, providing valuable entry points for new uptrends.
Meaning:
Found in downtrends; signals potential bullish reversal as buyers gain control, with strength confirmed by the third candle closing above the first.
BULLISH ABANDONED BABY
Bias: Bullish
What is the Bullish Abandoned Baby pattern?
The Bullish Abandoned Baby is a rare but powerful reversal pattern that consists of a bearish candle, a gapped doji, and a bullish candle. The middle doji reflects indecision, while the third bullish candle confirms the reversal. This pattern highlights a dramatic shift in sentiment, showing that buyers are prepared to take control.
Recognizing the Bullish Abandoned Baby can offer traders insights into pivotal market shifts.
Meaning:
Appears in downtrends; suggests a strong bullish reversal, as the middle doji shows indecision, with confirmation by a strong bullish move.
THREE WHITE SOLDIERS
What is the Three White Soldiers pattern?
The Three White Soldiers pattern consists of three consecutive bullish candles, each closing higher than the last, often appearing in downtrends to signal a potential bullish reversal. This pattern reflects sustained buying pressure, indicating that buyer sentiment is strong. Psychologically, it shows that buyers are steadily gaining confidence, pushing prices upward.
For traders, Three White Soldiers provide a clear signal of momentum, ideal for capturing emerging trends.
Meaning:
Found in downtrends; signals potential trend reversal, showing sustained buying strength, often signaling the start of a bullish trend.
MORNING DOJI STAR
What is the Morning Doji Star pattern?
The Morning Doji Star pattern is similar to the Morning Star, but with a doji as the middle candle, indicating greater indecision before a reversal. This pattern consists of a bearish candle, a doji, and a bullish candle, highlighting a transition from bearish to bullish sentiment. The doji reflects a moment when market sentiment is balanced, but the third candle confirms a bullish shift.
Interpreting Morning Doji Stars can help traders identify turning points in downtrends, providing valuable entry opportunities.
Meaning:
Appears in downtrends; signals potential bullish reversal, with indecision from the doji and confirmation by a strong bullish candle.
EVENING STAR
What is the Evening Star pattern?
The Evening Star is a three-candle pattern that appears at the top of an uptrend, signaling a potential bearish reversal. It consists of a bullish candle, a small-bodied middle candle, and a bearish candle, showing a transition from buyer control to seller strength. This pattern often appears at market peaks, where optimism is giving way to caution.
Understanding the Evening Star pattern helps traders anticipate downtrend formations, allowing them to time their exits.
Meaning:
Found in uptrends; signals potential bearish reversal as sellers gain control, confirmed if the third candle closes below the first.
BEARISH ABANDONED BABY
What is the Bearish Abandoned Baby pattern?
The Bearish Abandoned Baby is the bearish counterpart to the Bullish Abandoned Baby and consists of a bullish candle, a gapped doji, and a bearish candle. This pattern reveals a dramatic shift in sentiment from bullish to bearish, highlighting a sudden reversal at the top of an uptrend.
Recognizing the Bearish Abandoned Baby can offer traders insight into market tops and impending trend changes.
Meaning:
Appears in uptrends; indicates strong bearish reversal, as indecision in the doji is followed by selling strength.
THREE BLACK CROWS
What is the Three Black Crows pattern?
The Three Black Crows pattern consists of three consecutive bearish candles, each closing lower than the last, appearing in uptrends to signal potential reversal. This pattern reflects sustained selling pressure, indicating that sellers are gaining control. The Three Black Crows highlight a moment when buyer confidence wanes, marking the beginning of downward momentum.
For traders, this pattern provides a clear signal to avoid buying into weakening trends or even entering short trades.
Meaning:
Found in uptrends; signals potential bearish reversal, with sustained selling pressure often marking the start of a downtrend.
EVENING DOJI STAR
What is the Evening Doji Star pattern?
The Evening Doji Star is similar to the Evening Star, but with a doji as the middle candle, highlighting greater indecision. This pattern consists of a bullish candle, a doji, and a bearish candle, indicating a shift from bullish to bearish sentiment. The doji suggests that buyers are losing control, with sellers prepared to reverse the trend.
Understanding Evening Doji Stars allows traders to recognize market tops, helping them avoid overextended trends.
Meaning:
Appears in uptrends; signals potential bearish reversal, as the doji suggests indecision, confirmed by strong selling on the third candle.
Welcome Back! Gold Trading Strategy & Key Zones to WatchIn this week’s welcome back video, I’m breaking down my updated approach to XAU/USD and how I plan to tackle the Gold markets in the coming days. After taking a short break, I’m back with fresh eyes and refined focus.
We’ll review current market structure, identify key liquidity zones, and outline the scenarios I’m watching for potential entries. Whether you’re day trading or swing trading gold, this breakdown will help you frame your week with clarity and confidence.
📌 Covered in this video:
My refreshed trading mindset after a break
Key support/resistance and liquidity zones
Market structure insights and setup conditions
What I’ll personally avoid this week
The “trap zones” that might catch retail traders off guard
🧠 Let’s focus on process over profits — welcome back, and let’s get to work.

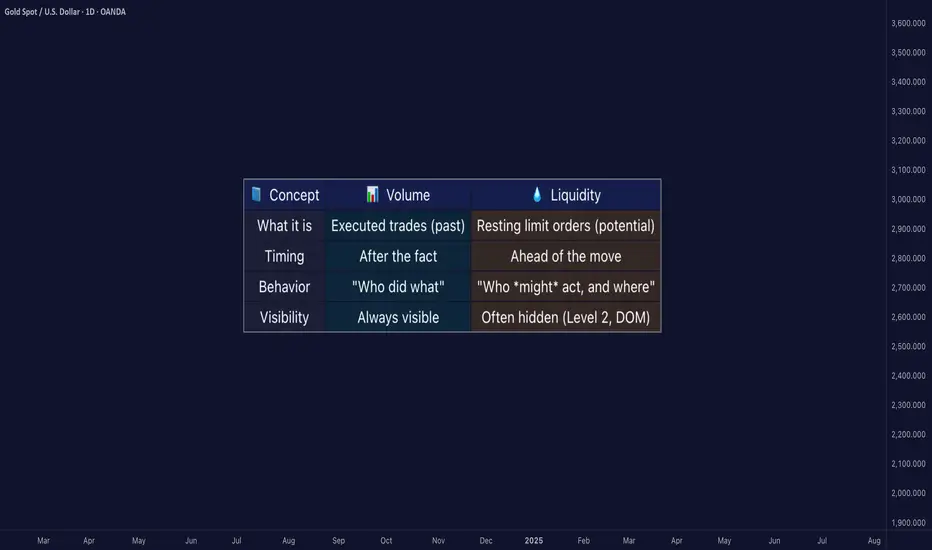
Liquidity ≠ Volume: The Truth Most Traders Never Learn█ Liquidity ≠ Volume: The Truth Most Traders Never Learn
Most traders obsess over volume bars, but volume is the footprint, not the path forward.
If you’ve ever seen price explode with no volume or fail despite strong volume, you’ve witnessed liquidity in action.
█ Here’s what you need to know
⚪ Volume Is Reactive — Liquidity Is Predictive
Volume tells you what happened.
Liquidity tells you what can happen.
█ Scenario 1: Price Jumps on Low Volume
❝ A price can jump on low volume if no liquidity exists above.❞
⚪ What’s happening?
The order book is thin above the current price (i.e., few or no sellers).
Even a small market buy order clears out available asks and pushes price up multiple levels.
Volume is low, but the impact is high because there’s no resistance.
⚪ Implication:
This is called a liquidity vacuum.
It can happen before news, during rebalancing, before session openings, on illiquid instruments, or during off-hours.
Traders often overestimate the strength of the move because they only see the candle, not the absence of offers behind it.
█ Scenario 2: Move Fails on High Volume
❝ A move can fail on high volume if it runs into a wall of offers or bids.❞
⚪ What’s happening?
There’s a strong surge of aggressive buying or selling (high volume).
But the order book has deep liquidity at that level — large resting limit orders.
The aggressive traders can’t chew through the liquidity wall, and price stalls or reverses.
⚪ Implication:
This is called liquidity absorption.
Market makers or institutions may intentionally absorb flow to stop a breakout.
Many retail traders mistake this for “fakeouts,” but it’s really liquidity defending a level.
⚪ What the Research Says
Cont, Stoikov, Talreja (2014): Price responds more to order book imbalance than trade volume.
Bouchaud et al. (2009): Liquidity gaps, not trade size, are what truly move markets.
Hasbrouck (1991): Trades only impact price if they consume liquidity.
Institutions don’t chase candles — they model depth, imbalance, and liquidity resilience.
⚪ Where the Alpha Lives
Liquidity tells you where the market is weak, strong, or vulnerable — before price moves.
Fakeouts happen in thin books.
Reversals occur at hidden walls of liquidity.
Breakouts sustain when liquidity follows the price, not pulls away.
If you understand this, you can:
Enter before volume shows up
Avoid chasing dead breakouts
Fade failed moves into empty space
█ Final Truth
Volume is the echo. Liquidity is the terrain. Alpha is in reading the terrain. You want to study the structure, because price moves toward weakness and away from strength. Learn to see where liquidity is, or where it’s missing, and you’ll see trading with new eyes.
-----------------
Disclaimer
The content provided in my scripts, indicators, ideas, algorithms, and systems is for educational and informational purposes only. It does not constitute financial advice, investment recommendations, or a solicitation to buy or sell any financial instruments. I will not accept liability for any loss or damage, including without limitation any loss of profit, which may arise directly or indirectly from the use of or reliance on such information.
All investments involve risk, and the past performance of a security, industry, sector, market, financial product, trading strategy, backtest, or individual's trading does not guarantee future results or returns. Investors are fully responsible for any investment decisions they make. Such decisions should be based solely on an evaluation of their financial circumstances, investment objectives, risk tolerance, and liquidity needs.
EV Stocks Are Back on Track: Who’s Got the Juice in 2025?This year is big for the EV sector so we figured let’s do a piece on it and bring you up to speed on who’s making moves and getting traction — both in the charts and on the road.
What we’ve got here is a lean, mean lineup of real contenders. Let’s go for a ride.
🚗 Tesla: Still King of the Road (for Now)
Tesla NASDAQ:TSLA isn’t just an EV company. It’s a tech firm, an AI shop, a robotaxi rollout machine, and an Elon-flavored media event every quarter. Even so, when it comes to margins, global volume, and name recognition, Tesla is still the benchmark everyone else is chasing.
In 2025, Tesla’s bounceback is fueled not just by EV hype but by its push into autonomous driving and different plays into the AI space.
The stock is down about 13% year-to-date. But investors love a narrative turnaround. Apparently, the earnings update didn't help the situation as shares slipped roughly 5%. Well, there's always another quarter — make sure to keep an eye on the Earnings Calendar .
🐉 BYD: The Dragon in the Fast Lane
BYD 1211 is calmly racking up sales, expanding across continents, and stealing global market share without breaking a sweat. The Chinese behemoth is outselling Tesla globally and doing it with less drama and more charge… literally .
Vertical integration is BYD’s secret weapon — they make their own batteries, chips, and even semiconductors. The West might not be in love with BYD’s designs, but fleet operators and emerging-market governments are. And that’s where the real growth is.
⛰️ Rivian: Built for Trails, Not Earnings (Yet)
Rivian NASDAQ:RIVN still feels like the Patagonia of EV makers — rugged, outdoorsy, aspirational. Its R1T pickup truck has cult status, but the company had to tone down its ambitions and revised its guidance for 2025 deliveries to between 40,000 and 46,000. Early 2025 projections floated around 50,000 .
The good news? Rivian is improving on cost control, production pace, and market fit. The bad news? It’s still burning cash faster than it builds trucks. But for investors betting on a post-rate-cut growth stock rally, Rivian may be the comeback kid to watch. It just needs a few solid quarters.
🛋️ Lucid: Luxury Dreams, Reality Checks
Lucid NASDAQ:LCID , the one that’ll either go under or make it big. The luxury carmaker, worth about $8 billion, came into the EV game promising to out-Tesla Tesla — with longer range, more appeal, and a price tag to match.
But here’s the rub: rich people aren’t lining up for boutique sedans, especially when Mercedes and BMW now offer their own electric gliders with badge power and a dealer network.
Lucid’s challenge in 2025 is existential. The cars are sleek, the tech is strong, but the cash runway is shrinking and demand isn’t scaling like the pitch deck promised.
Unless it nails a strategic partnership (Saudi backing only goes so far), Lucid could end up as a cautionary tale — a beautifully engineered one, but a cautionary tale nonetheless. Thankfully, Uber NYSE:UBER showed up to the rescue ?
💪 NIO : Battling to Stay in the Race
Remember when NIO NYSE:NIO was dubbed the “Tesla of China”? Fast forward, and it’s still swinging — but now the narrative is more about survival than supremacy. NIO's battery-swap stations remain a unique selling point, but delivery volumes and profitability are still trailing.
The company’s leaning into smart-tech partnerships and next-gen vehicle platforms. The stock, meanwhile, needs more than just optimism to get moving again — it’s virtually flat on the year.
✈️ XPeng: Flying Cars, Literally
XPeng’s NYSE:XPEV claim to fame used to be its semi-autonomous driving suite. Now? It's working on literal flying vehicles with its Land Aircraft Carrier. Innovation isn’t the problem — it's execution and scale.
XPeng is beloved by futurists and punished by spreadsheets. It’s still getting government love, but without a clear margin path, the stock might stay grounded.
🏁 Li Auto: The Surprise Front-Runner
Li Auto NASDAQ:LI doesn’t get the headlines, but it’s quietly killing it with its range-extended EVs — hybrids that let you plug in or gas up. A smart move in a country still building out its charging infrastructure.
Li is delivering big numbers, posting improving margins, and seems laser-focused on practicality over hype. Of all the Chinese EV stocks, this one might be the most mature.
🧠 Nvidia: The Brains of the Operation
Okay, not an EV stock per se, but Nvidia NASDAQ:NVDA deserves a spot on any EV watchlist. Its AI chips are running the show inside Tesla’s Full Self-Driving computers, powering sensor fusion in dozens of autonomous pilot programs, and quietly taking over the brains of modern mobility.
As self-driving becomes less sci-fi and more of a supply-chain item, Nvidia's value-add grows with every mile driven by data-hungry EVs.
🔋 ChargePoint & EVgo: Picks and Shovels
If you can’t sell the cars, sell the cables.
EV charging companies were once seen as the “safe bet” on electrification. Now they’re just seen as massively underperforming.
ChargePoint BOATS:CHPT : Still the leader in US charging stations but struggling with profitability and adoption pacing. Stock’s down bad from its peak in 2021 (like, 98% bad).
EVgo NASDAQ:EVGO : Focused on fast-charging and partnerships (hello, GM), but scale and margin pressures remain.
Both stocks are beaten down hard. But with billions in infrastructure funding still flowing, who knows, maybe there’s potential for a second act.
👉 Off to you : are you plugged into any of these EV plays? Share your EV investment picks in the comments!

The Edge Of The Fork - The Joker In Your PocketWOW!
\ \ First of all, I want to say THANK YOU for all the boosts, follows, and comments. You guys & gals give me the energy to continue this journey with you.\ \
Today, I want to show you that what we’ve learned with horizontal lines can also be applied to "Medianlines," or Forks.
Listen, I don’t want you to blow your brain with all the rules.
Not at the beginning of this journey, and not later on either.
Don’t ask yourself:
* when to use which Fork
* which swing to measure
* when to trade
* where to set your stop
* what if... bla bla bla
That’s not fun — that’s stress.
I don’t like stress — nobody does.
So let’s just chill and have fun here.
That’s my personal reason for doing all this Trading thing. I want to have fun — the money will take care of itself, just like the destination of a trail takes care of itself, as long as I keep putting one foot in front of the other. And that’s simple, right?
So let’s do it exactly the same way.
Just simple steps, connecting some dots, and BAM! — You’re there before you even know it §8-)
\ Let’s jump to the chart:\
Today, you’ll find out why Medianlines/Forks are a cousin of the horizontal Channel — but NOT the same.
Where are they different?
Forks are different because they’re capable of projecting the most probable path of price. And that’s a HUGE difference.
Yes, you can apply the full rule set of Forks to a horizontal Channel.
But the Channel CANNOT project the most probable path of price.
I hear you, I hear you: "No one and nothing can foresee the future. How is it even possible that Forks can?"
\ Here’s why:\
There’s a thing called "Statistical Importance." And it means that if something happens very often in the same way, we have a higher chance of seeing the same behavior again in the future.
And that’s what the inventor, Allan Andrews, discovered — and he created the rules around his findings.
\ A high probability that price will move in the direction of the projected path, as long as it stays within the boundaries of the Medianlines/Fork.\
That’s the whole "magic" behind Medianlines/Forks.
And the same applies to the "Behavior of Price" within and around Medianlines. That’s really all there is to it.
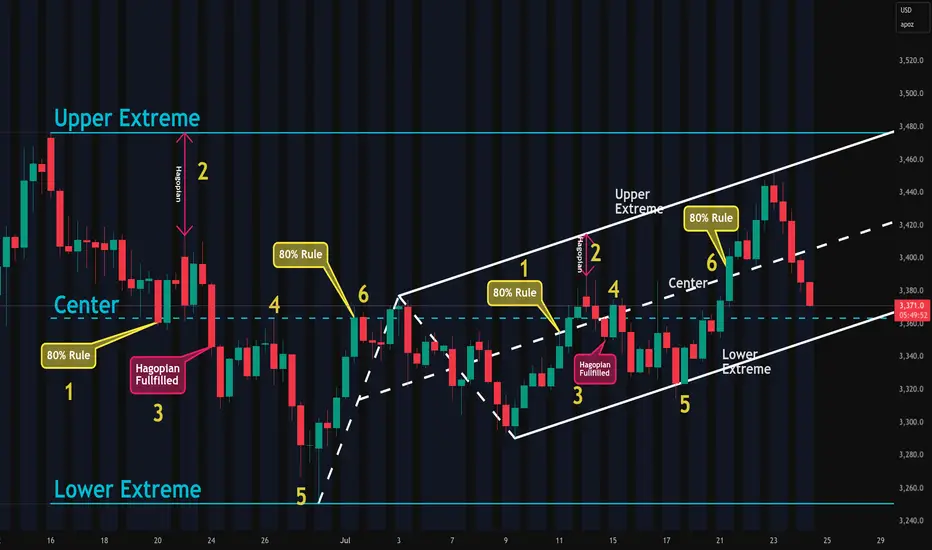
Look at the chart and compare the Channel and the Fork:
1. Price reaches the Centerline about 80% of the time
2. HAGOPIAN → price goes farther in the opposite direction than where it came from
3. HAGOPIAN’s rule fulfilled
4. Price reaches the Centerline again
5. Price reaches the other extreme
6. Price reaches the Centerline about 80% of the time
You’ll see the same behavior inside the Fork!
That’s beautiful, isn’t it? §8-)
And here’s a little Joker in your pocket — if you know the difference between the Channel and the Forks!
Do you know what it is?
Yep! You’d automatically know the direction to trade — giving you another 10% edge right out of the box — LONG TRADES ONLY. Because the Fork projects the most probable path of price to the upside, not down.
That's all folks §8-)
Like this lesson?
With a simple boost and/or a little comment, you load my Battery so I can continue my next step on the trail with you.
Thank you for spending your time with me §8-)
Trading Divergences With Wedges in ForexTrading Divergences With Wedges in Forex
Divergence trading in forex is a powerful technique for analysing market movements, as is observing rising and falling wedges. This article explores the synergy between divergence trading and wedges in forex, offering insights into how traders can leverage these signals. From the basics to advanced strategies, learn how you could utilise this approach effectively, potentially enhancing your trading skills in the dynamic forex market.
Understanding Divergences
In forex trading, the concept of divergence plays a pivotal role in identifying potential market shifts. A divergence in forex, meaning a situation where price action and a technical indicator like the Relative Strength Index (RSI) or Moving Average Convergence Divergence (MACD) move in opposite directions, often signals a weakening trend. This discrepancy is a valuable tool in divergence chart trading, as it may indicate a possible reversal or continuation of the current trend.
There are two primary types of divergence in forex—regular and hidden. Regular divergence occurs when the price makes higher highs or lower lows while the indicator does the opposite, often signalling a reversal. Hidden divergence, on the other hand, happens when the price makes lower highs or higher lows while the indicator shows higher highs or lower lows, typically suggesting a continuation of the current trend.
Trading Rising and Falling Wedges
Rising and falling wedges are significant patterns in forex trading, often signalling potential trend reversals. A rising wedge, formed by converging upward trendlines, often indicates a bearish reversal if it appears in an uptrend. Conversely, a falling wedge, characterised by converging downward trendlines, typically reflects a bullish reversal if it occurs in a downtrend.
Traders often look for a breakout from these patterns as a signal to enter trades. For rising wedges, a downward breakout can be seen as a sell signal, while an upward breakout from a falling wedge is often interpreted as a buy signal. When combined with divergences, this chart pattern can add confirmation and precede strong movements.
Best Practices for Trading Divergences
Trading divergence patterns in forex requires a keen eye for detail and a disciplined, holistic approach. Here are key practices for effective trading:
- Comprehensive Analysis: Before trading on divergence and wedges, be sure to analyse overall market conditions.
- Selecting the Right Indicator: Choose a forex divergence indicator that suits your trading style. Common choices include RSI, MACD, and Stochastic.
- Confirmation Is Key: It’s best to watch for additional confirmation from price action or other technical tools before entering a trade.
- Risk Management: Traders always set stop-loss orders to manage risk effectively. Divergence trading isn't foolproof; protecting your capital is crucial.
- Patience in Entry and Exit: Be patient as the divergence develops and confirm with your chosen indicators before entering or exiting a trade.
Strategy 1: RSI and Wedge Divergence
Traders focus on regular divergence patterns when the RSI is above 70 (overbought) or below 30 (oversold), combined with a rising or falling wedge pattern. The strategy hinges on identifying highs or lows within these RSI extremes. It's not crucial if the RSI remains consistently overbought or oversold, or if it fluctuates in and out of these zones.
Entry
- Traders may observe a regular divergence where both the price highs/lows and RSI readings are above 70 or below 30.
- After the formation of a lower high (in an overbought zone) or a higher low (in an oversold zone) in the RSI, traders typically watch as the RSI crosses back below 70 or above 30. This is accompanied by a breakout from a rising or falling wedge, acting as a potential signal to enter.
Stop Loss
- Stop losses might be set just beyond the high or low of the wedge.
Take Profit
- Profit targets may be established at suitable support/resistance levels.
- Another potential approach is to exit when the RSI crosses back into the opposite overbought/oversold territory.
Strategy 2: MACD and Wedge Divergence
Regarded as one of the best divergence trading strategies, MACD divergence focuses on the discrepancy between price action and the MACD histogram. The strategy is particularly potent when combined with a rising or falling wedge pattern in price.
Entry
- Traders typically observe for the MACD histogram to diverge from the price. This divergence manifests as the price reaching new highs or lows while the MACD histogram fails to do the same.
- The strategy involves waiting for the MACD signal line to cross over the MACD line in the direction of the anticipated reversal. This crossover should coincide with a breakout from the rising or falling wedge.
- After these conditions are met, traders may consider entering a trade in anticipation of a trend reversal.
Stop Loss
- Stop losses may be set beyond the high or low of the wedge, which may help traders manage risk by identifying a clear exit point if the anticipated reversal does not materialise.
Take Profit
- Profit targets might be established at nearby support or resistance levels, allowing traders to capitalise on the expected move while managing potential downside.
Strategy 3: Stochastic and Wedge Divergence
Stochastic divergence is a key technique for divergence day trading in forex, especially useful for identifying potential trend reversals. This strategy typically employs the Stochastic Oscillator with settings of 14, 3, 3.
Entry
- Traders may look for divergence scenarios where the Stochastic readings are above 80 or below 20, mirroring the RSI approach.
- This divergence is observed in conjunction with price action, forming a rising or falling wedge.
- Entry may be considered following a breakout from the wedge, which signals a potential shift in market direction.
Stop Loss
- Setting stop losses just beyond the high or low of the wedge might be an effective approach.
Take Profit
- Profit targets may be set at key support/resistance levels.
The Bottom Line
Divergence trading, coupled with the analysis of rising and falling wedges, offers a comprehensive approach to navigating the forex market. By integrating the discussed strategies with sound risk management and market analysis, traders may potentially enhance their ability to make informed decisions in the dynamic world of forex.
This article represents the opinion of the Companies operating under the FXOpen brand only. It is not to be construed as an offer, solicitation, or recommendation with respect to products and services provided by the Companies operating under the FXOpen brand, nor is it to be considered financial advice.

Pending Orders Are Not Set in Stone – Context Still MattersIn a previous educational article, I explained why I almost never trade breakouts on Gold.
Too many fakeouts. Too many emotional traps.
Instead, I stick to what works:
• ✅ Buying dips
• ✅ Selling rallies
But even these entries — placed with pending orders — are not automatic.
Because in real trading, price is not just a number — it’s a narrative.
And if the story changes, so should the trade.
________________________________________
🎯 The Setup – Buy the Dip Around 3400
Let’s take a real example from yesterday.
In my analysis, I mentioned I would look to buy dips near 3400, a former resistance now acting as support.
Price dropped to 3405, just a few points above my pending buy at 3402.
We saw a clean initial bounce — confirming that short-term support was real.
But I missed the entry by 30 pips.
So far, so good.
But here’s the important part — what happened next changed everything.
________________________________________
🧠 The Rejection Shifted the Entire Story
The bounce from 3405 was immediately sold into at 3420, a newly formed short-term resistance (clearly visible on the 15-minute posted chart).
After that, price started falling again — heading back toward my pending order.
📌 At that point, I cancelled the order. Why?
Because the context had changed:
• Bulls had tried once — and failed at 3420
• Sellers were clearly active and waiting above
• A second drop into my level wouldn’t be a clean dip — it would be retest under pressure.
The market was no longer giving me a “buy the dip” setup.
It was showing me a failed recovery. That’s a very different trade.
________________________________________
💡 What If It Had Triggered?
Let’s imagine that price had hit 3402 first, triggering my order.
Then rebounded, failed at 3420, and started dropping again.
Even then, I wouldn’t hold blindly.
Once I saw the rejection at 3420, I would have understood:
The structure had shifted.
The bullish case is weakening.
Exit early — breakeven or small controlled loss.
________________________________________
🔁 Sequence > Level
This is the most important principle:
• ✅ First down, then up = healthy dip → shows buyers are still in control
• ❌ First up, then down = failed breakout → shows selling pressure is stronger
Two scenarios. Same price. Opposite meaning.
That’s why you should look for:
Not just where price goes — but how it gets there.
________________________________________
🔒 Pending Orders Are Conditional
Many traders treat pending orders like traps:
“Just let price come to my level, and I’m in.”, but you should refine a little
✅ Pending orders should be based on a conditional expectation
❌ Not a fixed belief that the zone must hold
If the market tells a different story, remove the order.
No ego. No drama. Just process.
________________________________________
📌 Final Thought
Trading isn’t just about catching a price.
It’s about understanding price behavior.
First down, then up = strength.
First up, then down = weakness.
Let the market show its hand — then decide if you want to play.
Disclosure: I am part of TradeNation's Influencer program and receive a monthly fee for using their TradingView charts in my analyses and educational articles.
AMP Futures - How to view Deep level 2 data (DOM)In this idea we will discuss what is required in order for you to access deep level 2 data on the Depth of Market (DOM) using Tradingview.

Intro to what I call Algo TradingAlgorithmic training can mean different things to different people what I mean when I say the term algorithmic trading is just things that happen automatically.
Some guys have like these really complex formulas and based on like all this really advanced mathematics. If I'm being 100% honest i'm essentially looking at pictures on a chart and looking at the patterns.
But the pictures on the chart themselves are based on really advanced mathematical formulas or they can be at least or a combination of multiple mathematical formulas that then that the result of our represented by a picture on a chart.
So I look at the pictures on the chart I analyzed them really carefully and if it looks good I use artificial intelligence to code the idea so it happens automatically based on the rules that I set.

Liquidity Sweep + FVG + RSIThis BCH/USDT 2H chart illustrates a textbook example of a liquidity sweep and reversal, backed by RSI confluence. Price repeatedly tested a horizontal resistance level, eventually triggering a breakout trap — enticing late buyers just before reversing.
The false breakout swept buy-side liquidity, trapping retail longs above resistance. Immediately after, price dropped back below the key level and formed a Fair Value Gap (FVG) — a common area where smart money re-enters positions. This signaled distribution rather than continuation.
Adding to the bearish confluence, RSI showed overbought conditions during the sweep, reinforcing that momentum was exhausted. Once liquidity was taken and RSI began dropping, a strong bearish move followed.
📉This setup combines multiple Smart Money Concepts:
🔁Liquidity engineering
🔁Breakout trap
🔁Fair Value Gap re-entry
🔁RSI confirmation

XAUUSD | Flipped Long Too Early – Lessons From a £25k Drawdown 📝 Tutorial Description:
Today I flipped long after catching a clean short from 3,434.
The idea made sense: liquidity sweep, OB reaction, bullish BOS on 5m.
But the entry? Too early. Overleveraged. No HTF confirmation.
Ended up staring at a –£25,605 drawdown 😬
⸻
🔍 What Went Wrong:
• 🧠 Good Idea, Bad Timing:
Price did sweep lows and show signs of a reversal…
…but NY volume hadn’t kicked in yet, and the 5m BOS wasn’t locked in.
• 📉 No Higher Timeframe Confluence:
I didn’t wait for structure to shift on the 15m or 1H — just jumped in on a 5m bounce.
• 💥 Position Size WAY too heavy:
Even with a valid idea, risking £25k on one trade = recipe for disaster. I broke my own risk rules.
⸻
🎯 What I Learned:
1. Wait for full confirmation — not just a reaction wick
2. Scale in small first, add on confirmation
3. Stick to my risk % — don’t size up because I “feel confident”
⸻
🔖 Tags:
#XAUUSD #TradingMistake #SmartMoneyConcepts #Overleveraged #Drawdown #TradingLessons #5mTrap #EmotionalDiscipline
⸻
💬 Closing Note:
Flipping early isn’t the crime — flipping with no plan and too much size is.
This was a humbling one. Sharing so someone else doesn’t repeat it.

Simple Swing Trading Strategy with Smart Money Concept Explained
I will share with you the essential basics of swing trading forex gold with Smart Money Concepts.
You will learn how to do swing trading with the best SMC strategy.
I will teach you to c ombine order blocks, liquidity zones and imbalances to spot accurate entries and confirmation signals.
If you just started learning swing trading Forex with Smart Money Concepts, I strictly recommend trading with the trend only.
The cases and examples that we will discuss will be strictly trend-following ones.
Swing Trading with SMC in Uptrend
For swing buying any forex pair, we will look for the market that is trading in a bullish trend.
To confirm that the market is rising, you will need to execute structure mapping and find a forex pair that updates Higher Highs HH and Higher Lows HL.
Above is the example how I confirmed that GBPUSD is bullish with structure mapping. You can see that the pair consistently updates the highs.
Once you identified a bullish pair, your next step will be to find the zone from where the next swing move will follow.
According to the rules, the market remains in uptrend till the price is staying above or on the level of the last Higher Low HL.
Here is such a zone on GBPUSD.
It is based on the last Higher Low and current price levels.
We will assume that buying orders will concentrate within that area and from that a bullish rally will follow.
The problem is that this area is extremely wide, and we can not just buy randomly within.
Our next step will be to find liquidity zones within.
To buy, we need demand areas.
I found 4 price action based historic demand zones on GBPUSD.
We will need to wait for the test of one of these zones and then wait for an order block - a place where smart money are placing their buy orders.
The problem is that we don't know in which of these areas the order block is, so we will need to wait for tests of these zones and a consequent imbalance to confirm it.
To confirm a bullish imbalance for swing trading Forex, I recommend analyzing a 4H time frame after a test of a demand zone.
According to Smart Money Concepts, a bullish imbalance can be any sign of strength of the buyers : bullish breakout of a vertical/horizontal resistance, change of character, high momentum bullish candle, bullish price action pattern, etc.
An order block on GBPUSD was confirmed with a breakout of a resistance line of a falling channel on a 4H time frame.
That was the signal that Smart Money are buying, and that is your signal to open a swing long trade.
You place a buy position then with a stop loss below the order block and a target - at least a current high.
Swing Trading with SMC in Downtrend
For swing selling any forex pair, you will need to find a market that is trading in a bearish trend.
I suggest applying structure mapping to identify such a pair.
It simply should update Lower Lows LL and Lower Highs consistently.
USDCAD is trading in a bearish trend.
Structure mapping helps to easily confirm that.
Then, we will need to identify the zone from where the next bearish wave will start.
According to Smart Money Concepts structure mapping rules, the market remains bearish till the price is staying below or on the level of the last Lower High LH.
That's such a zone on USDCAD.
It is based on current prices and the last Lower High.
We will assume that selling orders will be distributed along the entire lenth of our zone.
Of course, we can not sell randomly within that zone because it is relatively extended.
Our next task will be to find liquidity supply zones within.
I found 2 price action based supply zones within our underlined area.
Before we sell, we will need to find an order block.
A place from where smart money are selling big.
To spot that, I suggest waiting for a test of one of our supply zones and wait for a bearish imbalance on a 4H time frame.
According to SMC, a bearish imbalance can be a bearish high momentum candle, a bearish CHoCH, a bearish price action pattern, a bearish breakout of a horizontal/vertical support , etc.
You can see that a lower supply zone was tested on USDCAD.
Our bearish order block confirmation is a bearish Change of Character, a formation of a high momentum bearish candle and a breakout of a rising trend line.
After that we can open a swing sell position and expect a bearish movement at least to a current low.
Stop loss should lie strictly above the order block.
TP should be at least a c urrent low.
That is how a trade should be executed on USDCAD pair.
Remember that there is no guarantee that the order block will be within a liquidity zone. You should learn to track the signs of smart money and their operations.
A proper combination of a trend analysis, liquidity zones and order block is the essential basis of a profitable swing trading Forex.
Mastering that, practice recognizing the imbalances and confirmations for spotting the best swing trading entries.
❤️Please, support my work with like, thank you!❤️
I am part of Trade Nation's Influencer program and receive a monthly fee for using their TradingView charts in my analysis.
Look First, Then LeapIn trading, how you prepare matters more than how you react. The phrase “Look first, then leap” reminds traders to avoid impulsive decisions and instead focus on proper analysis, planning, and risk control. Whether you're trading stocks, forex, crypto, or commodities, this principle can save you from painful losses and build a foundation for long-term success.
Let’s break down what it really means to “look first,” and how applying this mindset can improve your trading discipline.
✅Preparation Beats Emotion
Before entering any trade, a trader should ask: What is this trade based on? Logic or emotion?
🔹 Control Impulsive Decisions
Most losing trades happen when people act on gut feelings, FOMO, or after seeing a sudden price spike. But excitement is not a strategy; analysis is.
🔹 Check the Basics First
-What is the market trend? (uptrend, downtrend, or sideways?)
-Are you trading with or against the trend?
-Are there any upcoming news events that might impact the market?
Taking a moment to “look first” gives clarity and filters out low-probability trades.
✅ Trade Only When There’s a Setup
The best trades often come from waiting for the right moment, not forcing entries.
🔹 Identify Clear Patterns
Before jumping in, confirm your strategy setup:
-Is it a breakout or a fakeout?
-Are key support/resistance levels respected?
-Is volume supporting the move?
🔹 Use Confirmation Tools
Indicators like RSI, MACD, and moving averages can support your decision. Price action and patterns like triangle, channel, and flag also provide valuable clues.
Look first means not reacting to the first move; wait for the follow-through.
✅ Always Define Risk and Reward
Entering a trade without a defined stop-loss or target is like jumping into water without checking its depth.
🔹 Use a Risk-Reward Ratio
Before leaping into a trade, ask yourself:
-What am I risking?
-What can I gain?
Aim for a minimum risk-reward ratio of 1:2 or 1:3 to stay profitable even with a lower win rate.
🔹 Position Sizing Matters
Know how much of your capital to allocate. Using 1-2% of your capital per trade helps manage losses and avoid emotional pressure.
✅ Adjust for Market Conditions
Just because you’ve seen success in one type of market doesn’t mean your strategy will always work.
🔹 Trending vs. Ranging Markets
-Trend-following strategies work well in strong trends.
-Mean-reversion or breakout-fade strategies work better in sideways markets.
🔹 Check for Major News or Events
Earnings reports, central bank meetings, or geopolitical events can change everything in seconds. Before entering a trade, look at the calendar.
Adapting to market conditions is part of looking first.
✅ Use a Trading Plan, Not Just a Feeling
Every trade should follow a plan, not just “I think this will go up.”
🔹 What Should Your Plan Include?
Entry and exit rules
-Stop-loss and take-profit levels
-Criteria for valid setups
-Timeframes and trading hours
A plan brings structure and consistency, reducing emotional decisions.
✅ Journaling and Reviewing Trades
Looking first also means learning from the past.
🔹 Keep a Trading Journal
Log every trade entry, exit, reason, emotion, and outcome. This helps you spot mistakes and patterns in your behavior.
🔹 Review Regularly
After a drawdown or losing streak, review your last 10–20 trades. Was your strategy sound? Were you disciplined? Did you look before you leaped?
Improvement comes from reflection and correction.
✅ Be Mentally Ready Before Every Trade
Looking first also means checking your internal state.
🔹 Ask Yourself Before Trading:
-Am I calm and focused?
-Am I trying to recover a loss?
-Am I trading because I’m bored or emotional?
If your mindset is off, step away. A bad state leads to bad decisions—even with a good strategy.
✅Backtest and Practice Before Going Live
Before risking real money, test your setup thoroughly.
🔹 Why Backtesting Helps
It lets you see how your system performs on historical data. This builds confidence and filters out weak strategies.
🔹 Demo Trading Is Smart, Not Weak
Trading in a demo account before going live helps you learn execution, order management, and emotional control—without financial damage.
✅ Protect Capital First, Trade Second
Your first goal isn’t to make money, it’s to stay in the game.
🔹 Survive First, Then Thrive
Big losses can take weeks or months to recover. That’s why looking first is critical—it prevents careless trades that damage your capital.
✅Final Word: Be the Trader Who Waits
The market rewards those who are patient, disciplined, and prepared. Anyone can open a trade, but only those who look first truly understand what they’re doing.
Before your next trade, ask yourself:
“Do I have a clear reason, a defined risk, and the right mindset? Or am I just reacting?”
Because in trading, it’s not how many trades you take, it’s how many good trades you wait for.
In trading, success doesn't come from speed; it comes from clarity, preparation, and discipline. The principle “Look first, then leap” serves as a constant reminder to slow down, observe, analyze, and plan before taking action. It’s a mindset that separates the disciplined trader from the emotional speculator.
Every trade you take should be backed by logic, not impulse. Whether it’s identifying the right setup, managing your risk, or simply being patient enough to wait for confirmation, looking first gives you control in a world that thrives on chaos.
In the end, trading isn’t about making quick money—it’s about making the right decisions consistently. So before your next trade, take a breath, do your research, and ask yourself:
“Am I truly ready to leap, or do I need to look one more time?”
That one extra moment of reflection could be the difference between a lesson and a profit.
Cheers
Hexa🧘♀️
Chart Image Credit: TradingView

Your Technical Analysis Improved, But Your Account Didn't. Why?You're learning more. Your charts look cleaner.
But somehow... your losses just keep getting worse?
If that feels familiar, this breakdown might explain exactly why.
Hello✌️
Spend 3 minutes ⏰ reading this educational material.
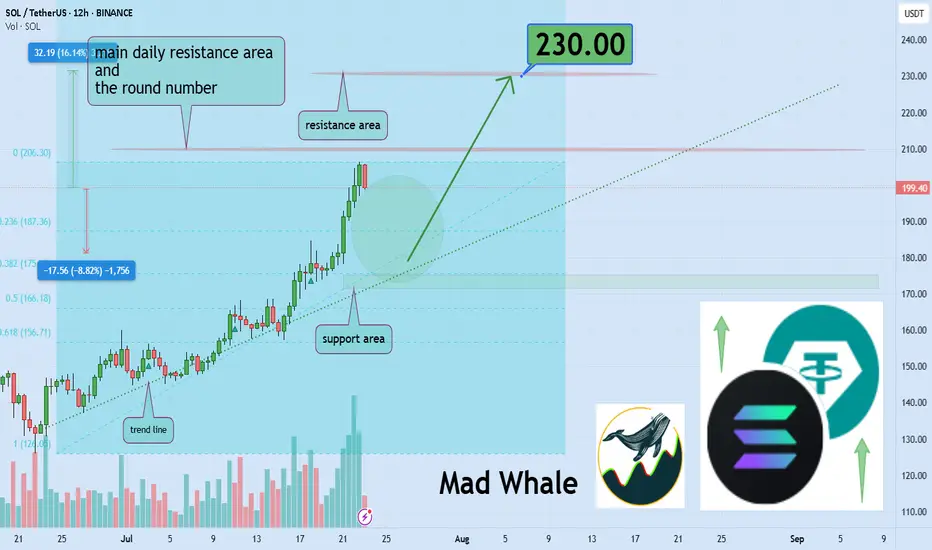
🎯 Analytical Insight on Solana:
BINANCE:SOLUSDT is testing a key trendline and daily support that aligns with Fibonacci levels 🔍. A clear break above the psychological resistance at $210 could trigger at least a 16% rally, targeting $230 🚀.
Now, let's dive into the educational section,
🧬 The Precision Trap
The better your analysis gets the narrower your entries become.
You start avoiding trades unless every single box is ticked. But guess what Markets don’t tick boxes. They break them.
Overanalysis creates tighter stops smaller buffers and a mind that’s too afraid to pull the trigger.
💰 The Hidden Greed in Smart Trades
Better analysis often brings a false sense of confidence. You expect more precision more profit.
This turns into silent greed masked as logic. Suddenly you risk bigger positions because this one is obvious.
But pros don't risk more when they’re more confident. They risk consistently.
💭 The Mind That Blocks Your Profits
You didn’t lose because you didn’t know. You lost because you knew too much and became a slave to it.
When your brain seeks confirmation not clarity it sabotages trades that were ready to work.
Don't let analysis chain you to hesitation.
🔄 Analysis or Addiction
Ask yourself honestly
Are you using your analysis to take action or to avoid it
Charts should guide you not paralyze you. If you need six signals to feel safe you’re not analyzing you’re hiding.
🧃 Every Chart Has a Bias
What looks like a sell to you might be a buy to someone else.
Why Perspective. Some buy the bounce others short the breakdown.
So if your top-tier analysis still leads to losses maybe it's time to stop upgrading tools and start upgrading your lens.
🧨 The Overanalysis Spiral
Your brain can’t juggle thirty signals. But most traders try anyway.
This doesn’t make you smarter. It makes you slower more anxious and emotionally drained.
Good trading isn’t about more info. It’s about clearer action.
🧱 The Mind That Won’t Let You Win
The more you lean on your indicators the more you fear breaking their rules.
You skip solid trades just because one tool says maybe not yet.
At that point it’s not risk management. It’s dependency. Let tools guide not dominate you.
🛠️ TradingView Tools That Help Or Hurt Your Mindset
It’s not about what tools you use. It’s how you use them.
Here are a few tools that when used right can actually improve both your decision-making and emotional control:
Session Volume and VWAP
Don’t just chase setups blindly. Check price versus VWAP. Often entries you feel are great are just late reactions to intraday rebalancing.
RSI and Auto Divergence
Don’t focus on RSI values alone. Use divergence indicators that highlight hidden bullish or bearish signals. Many traders miss moves by ignoring the tension RSI reveals.
Long Short Position Tool
Try using this for mental reps. Plot fake trades. Watch how the market behaves without risking capital. Over time you’ll train your brain not just your account.
These tools won’t fix your psychology but they’ll mirror it. And that’s where real change begins
🎯 Final Thoughts
Great analysts don’t trade everything they understand.
They understand what not to trade.
If better charts aren't bringing better results stop upgrading your screen and start rewiring your mindset.
✨ Need a little love!
We pour love into every post your support keeps us inspired! 💛 Don’t be shy, we’d love to hear from you on comments. Big thanks , Mad Whale 🐋
📜Please make sure to do your own research before investing, and review the disclaimer provided at the end of each post.
Protect Capital First, Trade SecondIn the world of trading, mastering technical analysis or finding winning strategies is only part of the equation. One of the most overlooked but essential skills is money management. Even the best trading strategy can fail without a solid risk management plan.
Here’s a simple but powerful money management framework that helps you stay disciplined, protect your capital, and survive long enough to grow.
✅1. Risk Only 2% Per Trade
The 2% rule means you risk no more than 2% of your total capital on a single trade.
-Example: If your trading account has $10,000, your maximum loss per trade should not exceed $200.
-This protects you from large losses and gives you enough room to survive a losing streak without major damage.
A disciplined approach to risk keeps your emotions under control and prevents you from blowing your account.
✅2. Limit to 5 Trades at a Time
Keeping your number of open trades under control is essential to avoid overexposure and panic management.
-A maximum of 5 open trades allows you to monitor each position carefully.
-It also keeps your total account risk within acceptable limits (2% × 5 trades = 10% total exposure).
-This rule encourages you to be selective, focusing only on the highest quality setups.
Less is more. Focus on better trades, not more trades.
✅3. Use Minimum 1:2 or 1:3 Risk-Reward Ratio
Every trade must be worth the risk. The Risk-Reward Ratio (RRR) defines how much you stand to gain compared to how much you’re willing to lose.
-Minimum RRR: 1:2 or 1:3
Risk $100 to make $200 or $300
-This allows you to be profitable even with a win rate below 50%.
Example:
If you take 10 trades risking $100 per trade:
4 wins at $300 = $1,200
6 losses at $100 = $600
→ Net profit = $600, even with only 40% accuracy.
A poor RRR forces you to win frequently just to break even. A strong RRR gives you room for error and long-term consistency.
✅4. Stop and Review After 30% Drawdown
Drawdowns are a part of trading, but a 30% drawdown from your account's peak is a red alert.
When you hit this level:
-Stop trading immediately.
-Conduct a full review of your past trades:
-Were your losses due to poor strategy or poor execution?
-Did you follow your stop-loss and risk rules?
-Were there changes in the market that invalidated your setups?
You must identify the problem before you continue trading. Without review, you risk repeating the same mistakes and losing more.
This is not failure; it’s a checkpoint to reset and rebuild your edge.
Final Thoughts: Survive First, Thrive Later
In trading, capital protection is the first priority. Profits come after you've mastered control over risk. No trader wins all the time, but the ones who respect risk management survive the longest.
Here’s your survival framework:
📉 Risk max 2% per trade
🧠 Limit to 5 trades
⚖️ Maintain minimum 1:2 or 1:3 RRR
🛑 Pause and review after 30% drawdown
🧘 Avoid revenge trading and burnout
Follow these principles and you won't just trade, you'll trade with discipline, confidence, and longevity.
Cheers
Hexa

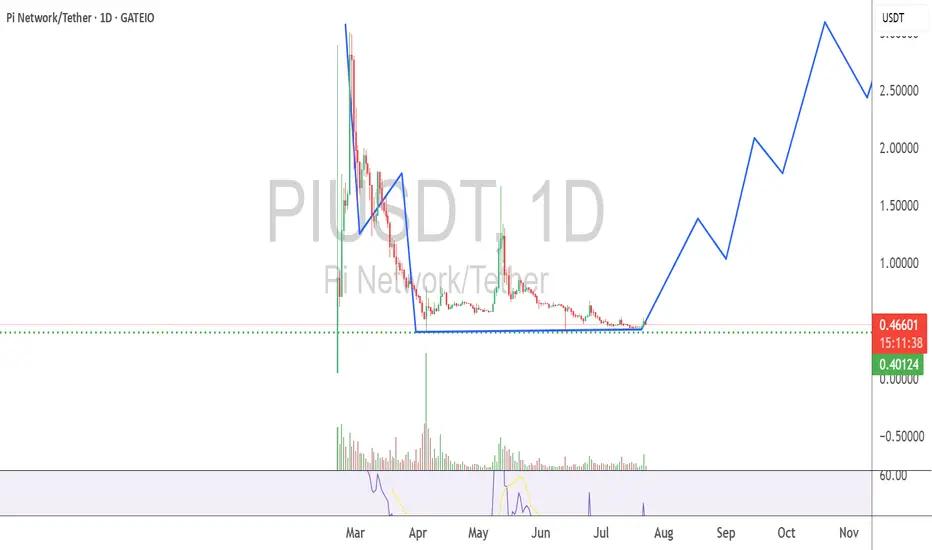
What does the future hold for Pi Network?Pi Network Coin (PI) is the native cryptocurrency of the Pi Network, a decentralized blockchain project designed to make cryptocurrency mining and usage accessible to everyday people via mobile devices. Unlike traditional cryptocurrencies like Bitcoin that rely on energy-intensive mining hardware, Pi Network allows users to mine PI coins on their smartphones using a lightweight, mobile-friendly process that does not drain battery life or require costly equipment.
What Could make Pi Network Grow (Factors affecting price)
Short-term price is highly volatile, influenced by token unlock schedules, exchange trading volumes, and speculative sentiment.
Medium-to-long term potential depends on the speed and success of Mainnet open trading launch, exchange listings on major platforms, and real-world PI ecosystem adoption including DeFi and decentralized applications.
Risks stem from regulatory uncertainties, possible high selling pressure from early miners, and slow token utility development.
Positive catalysts include expanding app ecosystem, mainstream exchange listings, and growing merchant/payment acceptance.
As of late July 2025, the PI price is subject to these dynamic factors, with market price hovering around $0.0006–$0.73 depending on exchange and trading pair, showing both significant upside if adoption accelerates and downside from current bearish technical pressures.
Gold CFD Trading: Practical Steps and Influencing Factors Gold CFD Trading: Practical Steps and Influencing Factors
Gold trading in forex offers a dynamic and potentially rewarding opportunity for traders. This article delves into the essentials of trading gold, from understanding its unique position as both a commodity and a financial asset to its price determinants and how to trade it.
Understanding Gold as a Trading Asset
In international gold trading, gold's role extends beyond being just a precious metal; it is a unique asset class. Its intrinsic value and universal appeal have made gold a cornerstone in financial markets for centuries. Unlike many other commodities, gold maintains its value not just in times of economic stability but also during volatility. This dual nature arises from its status as both a tangible commodity and a symbol of wealth, leading to its classification as a so-called safe-haven asset.
Investors often turn to gold when currencies and other markets face instability. Additionally, gold's relatively limited supply, juxtaposed with its consistent demand across industries and jewellery markets, ensures its lasting relevance in the trading world. Understanding these characteristics of gold is crucial for forex traders, as they form the foundation of its behaviour and pricing in the financial markets.
Fundamentals of Gold Trading
For those looking to learn to trade gold, it's essential to grasp the basics of how gold is traded. Primarily, gold trading is conducted through Contracts for Difference (CFDs), a popular derivative that allows traders to speculate on its price movements without owning the physical metal.
CFDs offer a flexible way to engage in gold trading, providing the ability to trade both rising and falling markets. This versatility is often cited as the best way to trade gold, especially for those who prefer short-term positions. Unlike gold stock trading, where investors buy shares in gold-related companies, gold CFD trading focuses directly on the price movements of the metal itself.
Via CFDs, gold is typically traded against the US dollar, denoted as XAU/USD. Here, XAU represents one troy ounce of gold, a standard unit of measurement in the precious metals market. Traders analyse market trends and use leverage to potentially enhance their opportunities. However, leverage is a double-edged sword, potentially magnifying losses.
Factors Influencing Gold Prices
Understanding the factors that influence gold prices is critical for anyone engaged in trading this precious metal. Here are key elements that traders usually monitor:
1. Economic Indicators: Key economic data such as GDP growth rates, employment figures, and inflation reports can significantly impact prices. Typically, weak economic performance or high inflation rates increase gold's appeal as a hedge against currency devaluation.
2. Monetary Policy: Central banks' decisions on interest rates and quantitative easing play a major role. Lower interest rates can decrease the opportunity cost of holding non-yielding assets like gold, thus boosting its demand.
3. Currency Strength: The strength of the US dollar is inversely related to gold prices. As gold is paired with the US dollar, rising USD will make gold cheaper.
4. Geopolitical Events: Political uncertainties and global crises often drive investors towards gold as a so-called safe-haven asset. Events causing economic instability can lead to a surge in prices.
5. Market Demand: Demand from industries like technology and jewellery and investment demand significantly influence prices.
6. Gold Trading News: News and reports related to mining, supply constraints, or large market transactions can immediately affect prices.
How to Trade Gold
Trading gold effectively requires a combination of well-chosen strategies, relevant indicators, and insights from trading signals. A comprehensive gold trading tutorial is a great starting point for understanding the mechanics of the market.
One of the best strategies to trade gold is following the trend. This involves identifying the direction of the market trend and making trades in alignment with this trend. For instance, if gold is on an upward trend, a trader might take a long position, and vice versa for a downward trend.
Regarding the best indicators for gold trading, traders often rely on tools like Moving Averages to identify trends, the Relative Strength Index (RSI) for overbought or oversold conditions, and MACD for momentum and trend changes.
Additionally, utilising gold trading signals can be effective. These signals, provided by market analysts or automated systems, offer assumptions on when to enter or exit trades based on market analysis. However, traders usually use these signals as a guide rather than a definitive command, combining them with their own research and risk management strategies.
Practical Steps for Gold Trading
Starting your journey in gold trading can be both exciting and challenging. Here are some practical steps to help you navigate this market:
- Educate Yourself: Before diving in, invest time in understanding the gold market. You can read books, watch webinars, and follow gold trading tutorials.
- Start Small: Begin with smaller investments to limit risk as you learn the ropes.
- Use Demo Accounts: Practice with demo accounts to gain experience without financial risk.
- Keep Up with News: Stay updated with global economic news, as they can significantly impact prices.
- Risk Management: Always use stop-loss orders to minimise potential losses.
- Review and Learn: Regularly review your trades to learn from successes and mistakes.
The Bottom Line
Embarking on your gold trading journey can be a transformative experience. With the knowledge and strategies outlined in this article, you can be well-equipped to navigate the market. Happy trading!
This article represents the opinion of the Companies operating under the FXOpen brand only. It is not to be construed as an offer, solicitation, or recommendation with respect to products and services provided by the Companies operating under the FXOpen brand, nor is it to be considered financial advice.

People don't like the truth! Let's be honest, people don't like honesty. They prefer ideas that affirm their own beliefs.
When I read articles and posts from newer traders, it's often from a place of "all in" diamond hands and the notion that things go up forever.
I've been a trader for over 25 years now, and the game isn't about making a quick buck, it's about making money over and over again. This got me thinking, the issue is when you deal with a small account you require leverage, small timeframes and of course the "shit" or bust mindset. If you lose a thousand dollars, $10,000 even $100,000 - what does it matter? That's no different than a game of poker in Vegas.
The idea of being 80% in drawdown, is alien to me. The idea of one trade and one win is also a crazy notion.
Instead of playing with the future, there is an easier way to work. This isn't about slow and boring, it's about psychology and discipline. 10% returns on a million-dollar account isn't all that difficult. Instead of aiming for 300x returns on an alt coin (due to the account size being tiny) You can make less of a percentage gain with a larger account size.
In terms of psychology - the word " HOPE " is used, way too often, it's used when you hope a stock or the price of Bitcoin goes up, it's used when you hope the position comes back in your favour, it's used when you want your 10,000 bucks to double.
This isn't trading, it's gambling.
The truth is, it's not the winners that make you a good trader. It's the way you deal with the losses.
Once you learn proper risk management, a downtrend in a market move is a 1-2% loss coupled with a new opportunity to reverse the bias.
As a disciplined trader, the game is played differently.
Let's assume you don't have $100k spare - prop firms are a great option, OPM = other people's money.
Remove the risk and increase the leverage, all whilst trading with discipline.
The market goes through many phases, cycles and crashes.
You don't always need something as catastrophic to take place, but if you are all in on a position. You need to understand that losses can be severe and long-lasting.
When everyone sees an oasis in the desert, it's often a mirage.
You only have to look at the Japanese lesson in 1989, when the Nikkei was unstoppable-until it wasn't. For that short space in time, everyone was a day trader, housewives to taxi drivers.
Everyone's a genius in a Bull market.
Then comes the crash. The recovery time on that crash?
34-years!!!
I have covered several aspects of psychology here on TradingView;
When it comes to trading, if you are able to keep playing. It's a worthwhile game. If you are gambling, it's a game whereby the house often wins.
Right now, stocks are worth more than their earnings. Gold is up near all-time highs, crypto, indices the same.
All I am saying is if you are all in. Be careful!
Disclaimer
This idea does not constitute as financial advice. It is for educational purposes only, our principal trader has over 25 years' experience in stocks, ETF's, and Forex. Hence each trade setup might have different hold times, entry or exit conditions, and will vary from the post/idea shared here. You can use the information from this post to make your own trading plan for the instrument discussed. Trading carries a risk; a high percentage of retail traders lose money. Please keep this in mind when entering any trade. Stay safe.
Power Law GrowthWhat you’re seeing is a Power‑Law Growth Corridor plotted over the weekly BTC/USDT price. In essence, it’s a dynamically‑sloped channel built on a power‑law fit of price vs. time, rather than the usual straight‐line
