TSLA - Use Technical principles To Help With Investment IdeaA look at TSLA & how technical analysis can be helpful in your decision making even if you're a longer-term investor.
In this video we take a look at a Butterfly pattern on Tesla and walk through what opportunities it presents for both bullish & bearish traders/investors.
Please leave any questions or comments below & I wish you guys a great trading week.
Akil
Community ideas

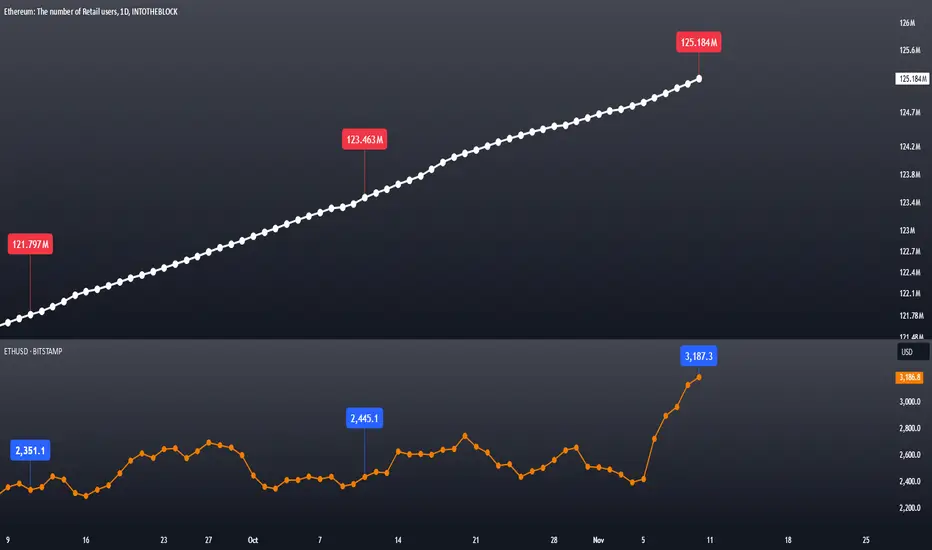
Ethereum Retail Investor Count Surges by 3.3 MillionEthereum Retail Investor Count Surges by 3.3 Million: The Road to an Altcoin Bull Run?
Analyzing Changes in Ethereum's Retail Investor Count
Over the past 60 days, we’ve observed a notable increase in the number of Ethereum retail investors. While the percentage increase may seem modest at 2.77%, this translates to approximately 3.3 million new retail addresses. With this rise over the past two months, the total number of retail investor addresses has reached 125.18 million.
Could Retail Investors Be the Catalyst for a Bull Market?
To answer this briefly: Yes.
In a bull run, new investors entering the market are expected to drive a significant increase in demand. When supply is limited or relatively scarce, as with Ethereum, this demand surge is anticipated to lead to a substantial price increase. Given that Ethereum is often seen as the “father of altcoins,” this trend holds even greater importance.
Why Is This So Significant?
The Key to an Altcoin Rally: Ethereum
Recently, Ethereum's price performance has lagged behind Bitcoin. In the last six months, for example, Bitcoin has gained 33%, while Ethereum's return has only been 10%. This discrepancy has left many altcoin investors disappointed. However, with Bitcoin dominance receding, we’re seeing Ethereum come back into the spotlight. Over the past week, while Bitcoin has risen around 19%, Ether has gained over 29%.
Following Ethereum's rally, the entire altcoin market is experiencing a period of relief and upward movement. This is why Ethereum's price trends and volatility are crucial for a potential altcoin bull run. Monitoring on-chain data here can provide critical insights.
How Can We Track This Data?
Conclusion
Through the IntoTheBlock & TradingView collaboration, you can track Ethereum's retail investor count under the "ETH_RETAIL" metric.
Observing whether there’s a corresponding increase in retail interest following the recent price surge can offer insight into the rally’s sustainability. If there’s no notable rise in the retail investor count, expecting a strong, lasting bull run might be overly optimistic. Thus, on-chain data sometimes serves as a leading indicator, and at other times, it confirms trends.
Thank you for reading.
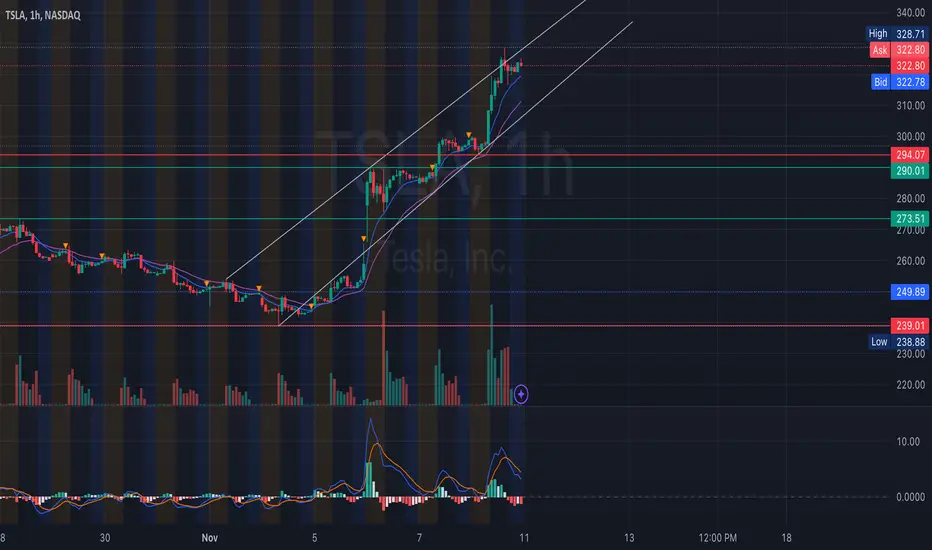
TSLA Rally: What's Next?Tesla is currently trading within an upward channel on the 1-hour chart. This channel suggests continued bullish momentum, but we should remain cautious of potential pullbacks as it approaches the upper trendline.
Price Action Analysis:
Channel Formation:
TSLA is respecting an upward trend channel. The current price action is near the upper boundary, indicating possible overextension and potential for a pullback.
Watch for a retest of the mid-channel trendline (around $318-$320) as a key support level. If it holds, it may provide a solid bounce opportunity for scalping.
Support and Resistance Levels:
Immediate Resistance: $328.71 (upper channel line). Breaking above this level with volume could push the price toward $335-$340.
Immediate Support: $322-$320 (mid-channel line and EMA support). If it breaks below this, expect a test of the $310-$312 area.
Key Levels Below: $294.07 is a strong support zone, aligning with previous consolidation and a psychological level.
Volume Profile:
Increasing volume with each leg up indicates strong buyer interest. However, be cautious of a volume divergence if we see decreasing volume on higher prices, suggesting weakening momentum.
MACD and Momentum Indicators:
The MACD on the 1-hour chart is extended but shows no signs of bearish crossover yet. Keep an eye on a potential bearish crossover, which could signal a short-term pullback.
RSI (not shown but inferred) is likely nearing overbought territory. Consider this when planning for scalp entries and exits.
Scalping Opportunities:
Look for quick scalps at the key intraday levels:
Long Entry: Around $320-$322 with a tight stop below $318, targeting a quick move back to $328.
Short Entry: If it rejects off $328-$330, consider a short scalp targeting the $320 support.
Swing Trade Ideas:
A strong daily close above $330 could set up a swing trade toward the $340 level, given the recent bullish momentum.
Conversely, a break below $320 could lead to a deeper pullback, targeting $310-$312 for a
swing entry.
Disclaimer:
This is for educational purposes only and not financial advice. Please perform your own research before making any trading decisions.
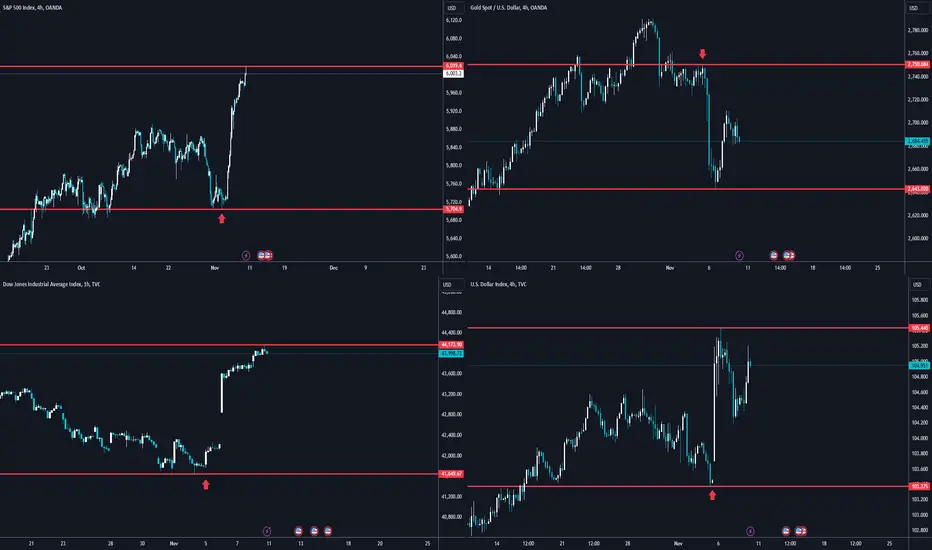
4 Winning Years Ahead for Traders Under TrumpOn November 5, 2024, the markets made it loud and clear—they’re excited about Donald J. Trump’s return to office. Stocks, the dollar, and other key assets all responded with strong moves that reflect investor confidence in what his policies might bring. Compare this to the last few years under Biden, and the difference is striking. The market barely budged during Biden’s presidency; even when he contracted COVID-19, it was business as usual. With Trump back, though, there’s an undeniable surge of optimism. Let’s look at what’s happening across the major assets and what it could mean for us traders in the days ahead.
S&P 500 (SPX)
The S&P 500 spiked from $5,704 to $6,018 on election night—a powerful rally that signals investor optimism. It seems the market is embracing Trump’s expected focus on tax cuts and pro-business policies. This kind of jump doesn’t happen without a reason; investors are clearly betting that Trump’s return will be good for corporate America and, by extension, for the economy.
Gold (XAU/USD)
In times of uncertainty, gold usually rallies as investors look for safe havens. But on election night, we saw the opposite: XAU/USD dropped from $2,750 to $2,643 per troy ounce. This decline tells us that investors feel less inclined to hedge their bets with gold, opting instead for assets tied to economic growth. When people pull out of safe havens, it's often a sign they’re feeling pretty good about what’s ahead.
U.S. Dollar Index (DXY)
The dollar had its own rally, with the DXY climbing from 103.3 to 105.4. This spike reflects confidence in the U.S. economy’s potential under Trump’s leadership. With the dollar gaining strength, it’s clear that investors expect strong economic fundamentals and possibly higher interest rates—both of which could keep the dollar in demand.
Dow Jones Industrial Average (DJI)
The Dow also rallied, jumping from $41,649 to $44,173. This boost is especially interesting because it reflects optimism in sectors like manufacturing, energy, and infrastructure—industries Trump has supported in the past. Investors are likely betting on policy moves that could provide a lift to U.S. industries, potentially driving corporate profits higher.
WTI Crude Oil (WTI)
Looking forward, I’m expecting WTI prices to come under pressure as Trump likely revisits his focus on domestic oil production. If he revives the “drill, baby, drill” approach, we could see supply levels increase, which would weigh on prices. This potential shift in energy policy is something to keep an eye on, as it could create fresh trading opportunities.
The Big Picture
From stocks to the dollar, the market’s reaction seems to signal that Trump’s return is seen as positive for growth and stability. Reflecting on his previous term, I remember trading seemed almost simpler—beyond economic reports, following Trump’s statements (especially on Twitter) often gave insight into market sentiment. We might be looking at a similar environment now.
Final Thoughts for Traders
Trump’s re-election sets the stage for market dynamics we’ve seen before, with a familiar blend of optimism and volatility. For traders, this could mean more straightforward strategies, particularly by keeping an eye on policy shifts and economic indicators. With Trump’s leadership back in play, I believe the next four years could be some of the best trading years we’ve seen. Whether you’re in stocks, commodities, or forex, it’s clear the market is responding—and as traders, there’s a lot we can take away from that.
FET | ALTCOINS | TOP ALT for coming ALTSEASONFETCH was one of my TOP altcoins for 2024, and has seen some more increases since my lst update. (Find the previous update here :)
THIS is the initial introduction to FETCH in January, when I identified this as a good buy for 2024:
I'm optimistic for the remainder of 2024; FETCH and other alts will see great increases as soon as BTC takes a breather and trades sideways for a few days.
_______________________
BINANCE:FETUSDT

S&P500: Very bullish after Trump's win! But...Market is still bullish, but momentum is weakening.
There's a clear support zone at between 5910 to 5950. This is where I forecast it will drop to if profit taking were to happen.
If you want to be trading short term, then make sure you see signs of reversal at the 4H chart...like bearish engulfing, tweezer top or double/triple top / H&S at the lower timeframes (1H or 15min).
Then move down to 5min to look for divergences or lower highs for entry.

TESLA FLASHES LONG TERM BULLISH SIGNAL!!! (November 7, 2024)In this video, I go over 3 potential scenarios of what could happen next to Tesla stock in the coming years.
This is all based around our 12 day & 18 day traders dynamic index, which has historically signaled to us the start of massive long-term rallies in the stock
Our red line on the traders dynamic index has officially broken into the "parabolic zone" for the first time in years on such time frames...
Watch the video to learn what could be just around the corner for Tesla!

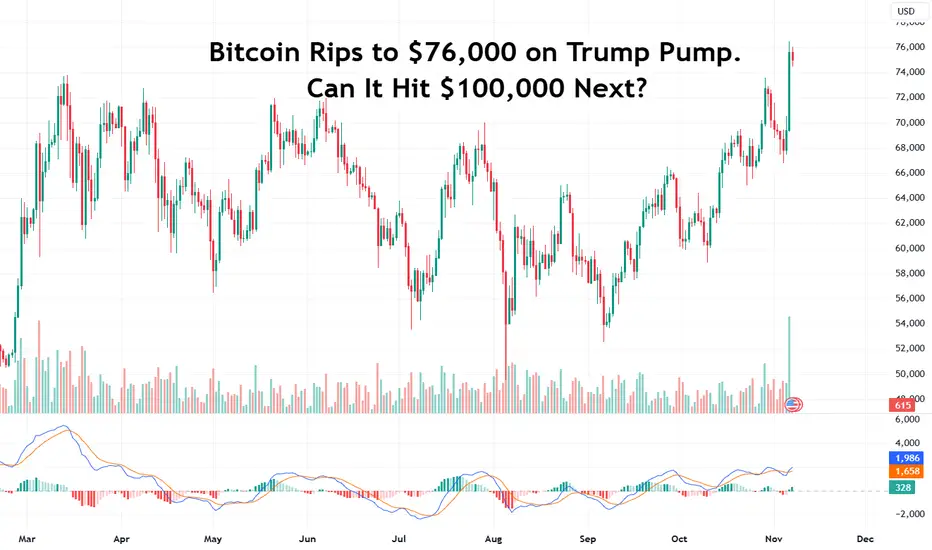
Bitcoin Rips to $76,000 on Trump Pump. Can It Hit $100,000 Next?Bitcoin BTC/USD was fully onboard with Donald Trump’s race to the White House. With much fanfare and celebration, the orange coin crossed $76,000 to hit a new record as the former President clinched the top spot in American politics in a stunning comeback, defeating Democrat Kamala Harris.
So, what’s with that big surge and what can you expect ahead for the crypto industry under a Trump presidency? Let’s find out.
Bitcoin BTC/USD , the original cryptocurrency, is in full beast mode now that former President Donald Trump has defeated Vice President Kamala Harris to win the White House. The price of Bitcoin rocketed to the rarefied air of $76,000 on Wednesday, gaining more than 9% on the day and catapulting its valuation to a record $1.5 trillion.
Bitcoin has been a centerpiece in Donald Trump’s campaigning efforts. It’s part technology, part investment — two things Trump loves and embraces. In fact, he seems enamored with the coin and went the extra mile for it. Not only has he reiterated his support for the crypto industry, but has vowed to make the US “the Bitcoin superpower of the world” and the “crypto capital of the world.”
Big-shot crypto players, such as Andreessen Horowitz and Gemini founders the Winklevoss twins are cheering Trump’s victory after they had endorsed him and spent lavishly on his campaign and on promoting pro-crypto candidates for Congress.
“We are on the brink of a new American Renaissance,” said Tyler Winklevoss in a post on X . “The crypto army is striking!”
Brian Armstrong, CEO of Coinbase COIN , also praised Trump’s election win. “Welcome to the new members of America's most pro-crypto Congress ever…” the crypto exchange boss said on X . “219+ pro-crypto candidates and counting have now been elected to the House & Senate.” “Tonight the crypto voter has spoken decisively.”
Hopes are high now and the agenda is already looking busy. Overjoyed crypto circles expect three main things from Trump:
1) To pass crypto-friendly laws and regulations that will help propel the industry ahead of its foreign competitors (China and Russia, mostly) in terms of business, mining and trading.
2) To fire Securities and Exchange Commission Chairman Gary Gensler “on day one.” Gensler is seen as a villain to the broader adoption of crypto both on Wall Street and in general. During Gensler’s tenure, the SEC has chased down crypto exchanges, such as Coinbase, Kraken and Crypto.com with more than 100 lawsuits.
3) To create a Bitcoin strategic reserve — a lofty ambition, which will make sure the US government never sells its Bitcoin (currently the US holds roughly 200,000 BTC). More on this below.
There’s already a bill introduced by Sen. Cynthia Lummis (R–Wyo.) to whip up a reserve with a target of 1 million Bitcoin over five years (200,000 BTC a year).
“For too long our government has violated the cardinal rule that every bitcoiner knows by heart: Never sell your bitcoin,” Trump has said during a campaign speech.
“If I am elected, it will be the policy of my administration, United States of America, to keep 100% of all the Bitcoin the US government currently holds or acquires into the future,” he said. Currently, the government every now and then auctions off its Bitcoin, which has been seized from criminals.
With that in mind, how is Trump and the Republicans broadly going to approach the next four years?
In short:
Pro-business
Pro-growth
Light regulations
Low taxes
Or, as Tesla TSLA CEO and vocal Trump backer Elon Musk expects, "The future is gonna be so 🔥"
Besides Bitcoin, how did the result of Election Day bump up other digital assets and crypto stocks?
Ethereum ETHUSD , the second-largest coin, got a 10% boost to its price, going over $2,800 a piece. Solana SOLUSD , an Ethereum rival, pumped to levels above $190 from under $170. Dogecoin DOGEUSD , the Shiba Inu-themed coin beloved by Musk, surged more than 30% in volatile trading and crossed 21 cents before paring back some of the gains to slide under the 20-cent threshold. In general, it was a good day for cryptocurrency markets .
Crypto stocks reacted with a sharp dash to higher grounds as well. Crypto exchange Coinbase COIN pumped 31% to notch its best day ever . Bitcoin-hoarding software firm MicroStrategy MSTR surged 13%, lifting its year-to-day gains to a whopping 276% increase.
Crypto miners’ stocks also participated in the rally. Riot Platforms RIOT gained 26% on the day, followed by Marathon Digital’s MARA 19% increase. Another Bitcoin miner, Core Scientific CORZ , closed up by 10% on the day.
Over to the exchange-traded fund space. The burgeoning crypto ETF space turned up some impressive figures. The pack of 11 spot Bitcoin ETFs collectively pulled in $612 million of net new money on Wednesday. The spot Bitcoin investment vehicles now command $26 billion in assets under management.
Ethereum ETFs, a bundle of 9 , picked up $52 million of daily net inflows, bringing the total amount of investments to $1.35 billion.
With that said, were you brave enough to chip in before the big Election Day? And do you think the door to $100,000 is now wide open? Drop your thoughts below and let’s whip up the discussion!
Important View: What Will Happen To BTC Now Trump Is President?Bitcoin has rallied significantly creating new highs as Trump has won votes around the US in the election.
This was expected as he is more or less a signal of economic growth and a risk on environment.
But, what's next?

Market Volatility Ahead - Election + FOMC PreviewThere's a lot going on this week with the election and FOMC among other things. Here are some key levels I'll be watching and what I expect to be influenced the most.

A market in waitingThe S&P 500 is a market in waiting for results from the presidential election and the Fed interest rate action. Unless there's something revealing on Tuesday the day of the presidential election, huge volatility would not be expected.

Can you envision S&P500 at 20k? This is why most investors fail!If you follow us through all those years then you know how fond we are of long-term patterns. Especially those of a multi-year perspective that can offer maximum reliability and as close to a flowless projection as it can get.
The current chart (1M time-frame) on the S&P500 index (SPX) is no exception and you might be no strangers to it as we've published it on April 10 2024 (see chart below) when the price was still at 5200 (against 5700 now):
That was at a time of high market uncertainty after a strong start to the year and as we were entering the bearish seasonality of Summer. This rise however should come as no surprise to those that can read charts and market behavior objectively. As we mentioned at the time, this is a long-term perspective that gives you the picture unfiltered with the facts only.
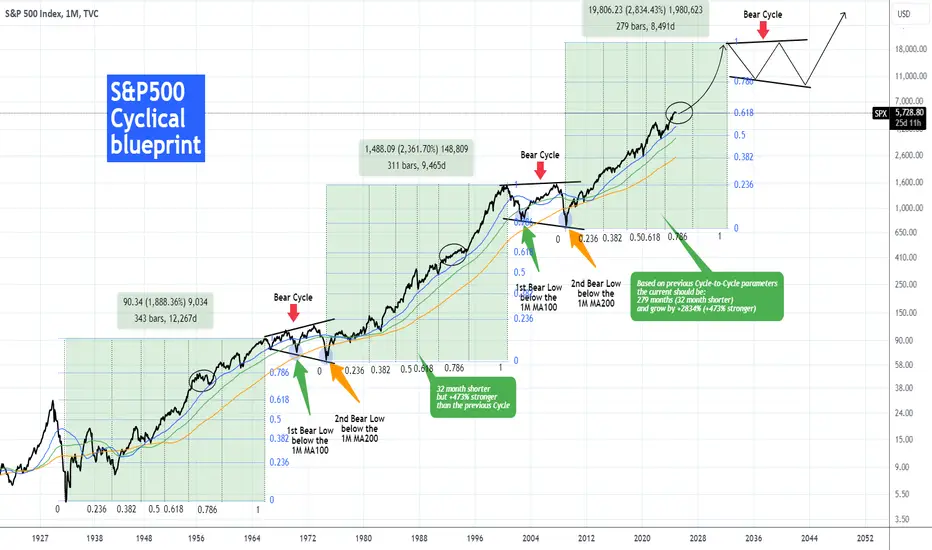
What you see on this chart is S&P's Cycle Analysis on a century wide scale from the rally in 1921 that led to the Great Depression. Since that 'mother of all recessions', the stock market started to create a pattern of clear systemic behaviors. Each time there are fundamentals involved that merely serve as 'reasons/ excuses' to fill out and complete this pattern.
** Great Depression: 1st Bull Cycle **
Following the 1932 Great Depression bottom, the 1st Secular Bull Cycle begun, that lasted for 28.5 years (343 months) rising by +1888%. Then the Secular Bear Cycle started in the form of a Megaphone pattern. Its 1st Low was formed below the 1M MA100 (green trend-line) and the 2nd Low (the Cycle's bottom) was formed below the 1M MA200 (orange trend-line).
** Vietnam War to High Inflation: 2nd Bull Cycle **
The 2nd Secular Bull Cycle lasted for almost 26 years (311 months) and saw +2361% growth. As per our blueprint, the Secular Bear Cycle was initiated once the 1M MA50 (blue trend-line) broke. Again the 1st Low was formed below the 1M MA100 and the 2nd Low below the 1M MA200.
** Post 2008 Housing Crisis: 3rd Bull Cycle **
With regards to the current Cycle, which is what most are interested at naturally, notice how the 1M MA50 has been supporting since late 2011. It emphatically held both on the September 2022 Low (Inflation crisis bottom) and the March 2020 Low (COVID crash bottom). This indicates again that as long as it supports, the Secular Bull Cycle will be extended.
Based on the previous Cycle-to-Cycle parameters the model suggests that the current Cycle should be a little than 23 years long (279 months, i.e. 32 month shorter than the previous) and rise by +2834% (+473% higher than the previous).
That gives us a rough target for the S&P500 of around 20000 estimated to take place by 2032!
** New updates: Price and Time Fibonacci levels **
What we've added on the current updated analysis relative to the on in April 2024, are the Fibonacci levels both on the x (time) and y (price) axis.
As you can see, the S&P is currently exactly on the 0.618 Fib price axis and between the 0.618 - 0.786 Fib time axis. That is a highly symmetric correlation with roughly the year 1992, right at the start of the Dotcom Bubble that led to the 2000 burst and subsequent crisis. The index was again on the 0.618 Fib price axis and within the 0.618 - 0.786 Fib time axis.
** Is A.I. the new Dotcom? **
It was the Internet Mania that accelerated the 1974 - 2000 Bull Cycle to its peak and this time it may be the A.I./ Blockchain/ Crypto etc Mania that may aggressively lead the current (2009 - 2032) Bull Cycle to the next Great Recession. Note that just like the Internet didn't go away because of a mere act of amazing greed (the Dotcom Bubble) but instead served as the backbone of the Age of Information and a new Economy (e-commerce, social media, digital investing etc), the A.I. Bubble that has started fueling the market since 2023 shouldn't be demonized when it pops and in our opinion won't go away but instead serve as the backbone of the next Age of Reality and Commerce (metaverse, augmented reality, robotics, artificial intelligence, electric vehicles etc).
It has to be said, that the current Bull Cycle is much more similar to the 1974 - 2000 one than the 1932 - 1965, which understandable as neither banking or trading was that evolved or matured as it got with the financial engineering of the 80s and beyond.
** Conclusion **
In any case and as we are concluding this publications, all the above projections based on this 'Cyclical blueprint' may be speculation theoretically but trends that keep repeating themselves over the decades are not. Technically those patterns filter out all news, fundamentals, geopolitical, macroeconomical noise and give rise to a pure behavioral perspective, the essence of traditional Economics.
So based on that model, are you also expecting to see 20000 in 8 years time?
-------------------------------------------------------------------------------
** Please LIKE 👍, FOLLOW ✅, SHARE 🙌 and COMMENT ✍ if you enjoy this idea! Also share your ideas and charts in the comments section below! This is best way to keep it relevant, support us, keep the content here free and allow the idea to reach as many people as possible. **
-------------------------------------------------------------------------------
💸💸💸💸💸💸
👇 👇 👇 👇 👇 👇
US T-Bonds - Will Buyers Continue To See Pain?Slowly we see the decline in price action and although it's a very choppy time we are in, the continuation to the downside, at least down to 115.30 going into the next weeks seem very reasonable.
Although bearish, placing shorts in market conditions like this is high risk.
It's worth, at times waiting for the market to draw to you.

Weekly FOREX Forecast: USD Is Strong Vs EUR, GBP, AUD NZDThis is an outlook for the week of Nov 4 - 8th.
In this video, we will analyze the following FX markets: USD Index, EUR, GBP, AUD, and NZD.
Enjoy!
May profits be upon you.
Leave any questions or comments in the comment section.
I appreciate any feedback from my viewers!
Like and/or subscribe if you want more accurate analysis.
Thank you so much!
Disclaimer:
I do not provide personal investment advice and I am not a qualified licensed investment advisor.
All information found here, including any ideas, opinions, views, predictions, forecasts, commentaries, suggestions, expressed or implied herein, are for informational, entertainment or educational purposes only and should not be construed as personal investment advice. While the information provided is believed to be accurate, it may include errors or inaccuracies.
I will not and cannot be held liable for any actions you take as a result of anything you read here.
Conduct your own due diligence, or consult a licensed financial advisor or broker before making any and all investment decisions. Any investments, trades, speculations, or decisions made on the basis of any information found on this channel, expressed or implied herein, are committed at your own risk, financial or otherwise.

Pfizer chart is predicting bad news for the worldPfizer is showing signs of accumulation past few months which means a markup phase is coming very soon. I am assuming the market already knows some major catalyst is in the pipeline.

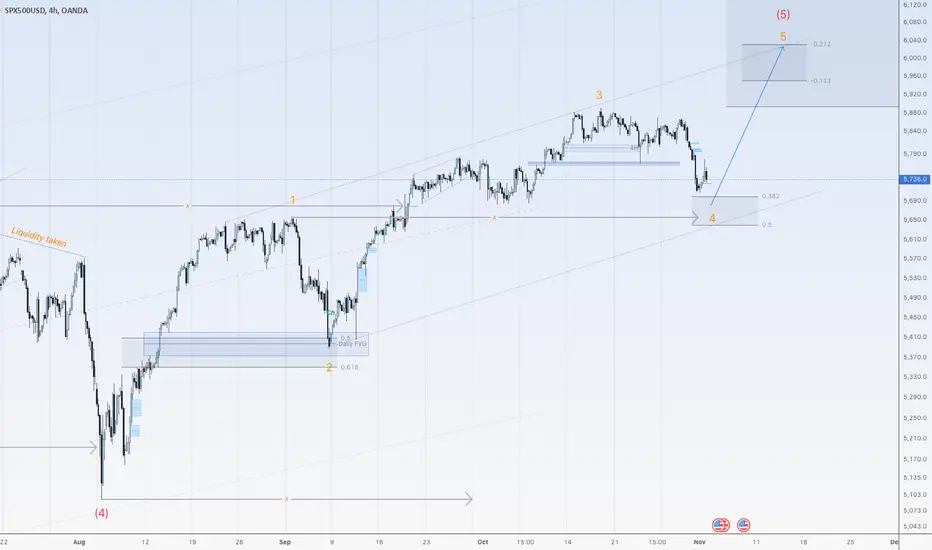
Correction down for SPX500USD is almost finishedHi traders,
Last week SPX500USD dropped and slowly went up again.
I think next week we could see the finish of the complex correction down (wave 4) and the last leg up to finish wave 5.
Trade idea: Wait for the complex correction down to finish and after a change in orderflow to bullish and a correction down on a lower timeframe you could trade (short term) longs.
If you want to learn more about wave analysis, please make sure to follow me, give a like and respectful comment.
This shared post is only my point of view on what could be the next move in this pair based on my analysis. I do not provide signals.
Don't be emotional, just trade!
Eduwave
How key markets have performed either side of a US electionI wanted to see how major markets have performed in the days before, during and after US elections. So I coded up a new spreadsheet. Here are the results...
Please note:
- Price data supplied by Refinitiv
- Most markets go back 8 elections
- US futures and VIX are the exception, which go back 6 elections
MS

AMD - ALTERNATE Bear Case - Confluence at $95Warning - before you come attacking me full force - this is an alternate bearish scenario for AMD - not my primary scenario, but I noticed a few things that I must point out.
1. 2 5-wave structures - Between Oct 2022 and Mar 2024 we completed 2 structures that can be counted in 5 waves, but the resulting pullback from Mar 2024 to Aug 2024 came back a bit deeper than I would have expected for an impulsive move. This is suspect.
2. ABC Corrections - a 3 wave correction can be seen all over the place but what I want to point out is the structure I outlined in point 1 above can be seen as impulsive. The pullback off the first 5-wave structure only retraced 38.2% - which is fine - but - that only works in a very bullish market - which we were in - but where's the follow through? After Mar 2024, there was a severe lack of follow through.
3. From Mar 2024 - we see a clear 3-wave correction - but now that we have the monster ABC correction outlined in point 2 above, measuring it puts the 61.8% internal retracement fib (the golden zone between 61.8-65%) at $95 AND if you measure the correction from Mar to Aug 2024 and project it from the pullback in early Oct 2024, you get a 100% extension target at.... $95 - coincidence? Well, that also happens to be the bottom of the Oct 2023 correction as well.
TL/DR? I'd be a heavy buyer at $95 if we get there.

Deciphering The Mysteries Within A TrendIn this video, I breakdown trend dynamics to help you understanding what is actually happening in a trend. I cover the following:
What is climatic activity?
What climatic activity means for a trend.
How to spot climatic activity with price action.
How to spot climatic activity with an indicator
How to measure trend strength with price action
How to measure trend strength with an indicator
When trading pullbacks, it is imperative to understand strength of trends. You do not want to enter a pullback at the end of a trend.

MOASS: BOOM!TLDR of video:
-MOASS is happening now
-Elliott Wave Idealized Target: 100K
-Ideal Target for your average retail investor: 1800 - 2400
-Psychologically, Wave 3, which we are in, is the most intense
-VWAP is your guide as price will stay above identified VWAP and will only touch it again once
MOASS is over
-Fibs are your guide as well
Expect price to begin running next week folks
We will break above identified VWAPS and that will be the surefire signal that MOASS has lifted off for the last time
SEE YOU AT THE TOP!!!

COUNTER-TREND TRADING...SAFE OR RISKY?....EURCAD LIVE EXAMPLEWhat is going on everybody! Hope you are having an amazing weekend so far! Just wanted to come on here and speak a little bit about one of my favorite trading subjects which is counter-trend trading! I personally do counter-trend trading as one of my trading strategies so I wanted to come on here and share a real life example of some things I look for and the mentality behind trading against the current trend of price
Hope you guys enjoy! Please boost and follow my page for more breakdowns! Appreciate you all!
Cheers!

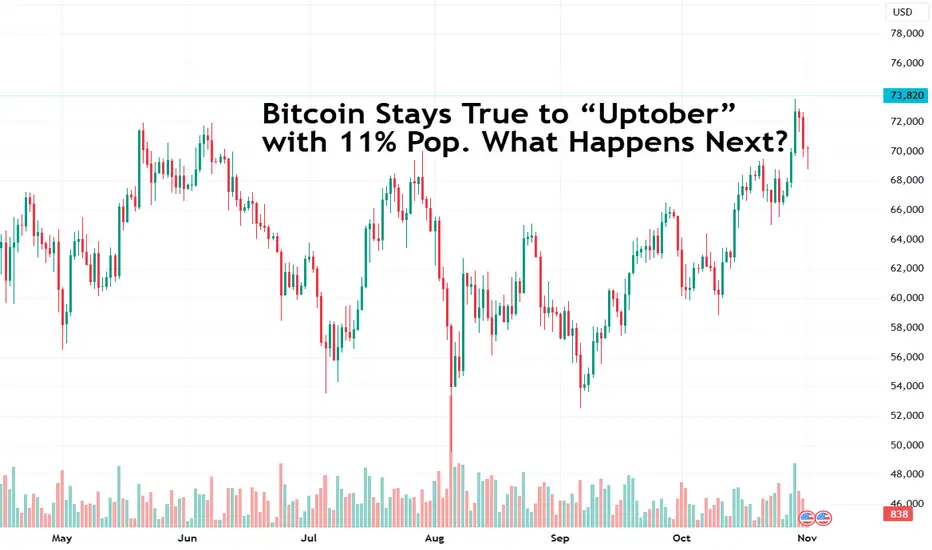
Bitcoin Stays True to “Uptober” with 11% Pop. What Happens Next?Bitcoin BTC/USD saw elevated demand in October as the surge nearly led to a new all-time high. Now the looming US election on November 5 is shaping up as a catalyst for growth, depending on who gets to become President of the United States.
Bullishness is in the air. The OG token — Bitcoin BTC/USD — pumped hard in yet another October. Staying true to the “Uptober” tradition , BTC added 11% over the month, kicking it all the way up to more than $73,000 , just a few hundred bucks shy of its record high logged in March .
The powerful surge is now taking a breather with prices diving back under the $70,000 threshold. But not for long, according to some analysts who are already living post November 5. What’s that? It’s the biggest event of the year — economically, politically, and … cryptolitically ?
Gloves on, bell rings, the main event is here — in the blue corner is Democrat Kamala Harris facing her red-shorts opponent, Republican Donald Trump. The current Vice President and the former President are squaring up for the top spot in American politics. And both have vastly differing viewpoints on crypto.
If we were to play favorites, it’s fair to say that Donald Trump is winning the hearts of the crypto faithful. Throughout his rallying and campaigning, he’s made it clear that he believes in Bitcoin’s growth potential. What’s more, he’s embraced digital assets in general and wants to see the market thrive in the world’s biggest economy.
The promises don’t stop there. Trump has vowed to make the US the “crypto capital of the world” and dig out all the remaining Bitcoins from within US grounds. He also pledged to set up a Bitcoin strategic reserve and fire Securities and Exchange Commission Chair Gary Gensler, who is seen as a roadblock to future crypto growth.
Hence the so-called “Trump trade,” which has been propelling the orange coin to higher places.
On the other end of the spectrum is Kamala Harris who has adopted a warm, but not that warm stance toward crypto. She’s all about casting a sweeping regulatory framework over the industry. The Democratic candidate has vowed to “encourage innovative technologies” like digital assets. Still better than President Joe Biden’s crackdown on the sector.
More interestingly, Trump has recruited a key player on his team. Elon Musk, the world’s richest guy (depending on the day) and CEO of Tesla TSLA , is a major donor to Trump’s campaign. He is looking to potentially get employed by the government as head of — can you guess? — Department of Government Efficiency, or DOGE (a nod to Musk’s beloved coin).
"I will create a government efficiency commission tasked with conducting a complete financial and performance audit of the entire federal government," Trump said at a rally back in September.
“I look forward to serving America if the opportunity arises. No pay, no title, no recognition is needed,” the eccentric billionaire wrote on his X platform .
How is that bullishness trickling into the markets? Besides the obvious price leap, options traders are ramping up their bets for $80,000 Bitcoin by the end of November. Implied volatility on November 5 is elevated — BTC options flag a 30% chance of a 10% swing in the price. Stay cool, stay ready.
On the ETFs front, exchange-traded funds that hold genuine Bitcoin and offer spot trading pulled in around $4 billion of net new money in October. The biggest winner of all 11 spot BTC ETFs is the BlackRock-owned iShares Bitcoin Trust, which holds more than $26 billion in assets.
Traders broadly (not just the crypto space) may be pricing in a Trump victory and scooping up some of the assets that are likely to do well under his term. But while Trump is ahead in prediction markets, he’s neck-and-neck with Harris in the national polls, making Election Day all the more uncertain.
With that said, Bitcoin is up 57% on the year, outperforming other large-cap assets, such as gold XAU/USD , up 35% in a stellar year of its own , and the S&P 500 SPX , up 20% year to date, also enjoying lots of buying appetite .
Whose side are you on and do you think we'll see a huge swing in the price of Bitcoin come November 5? Share your thoughts below!
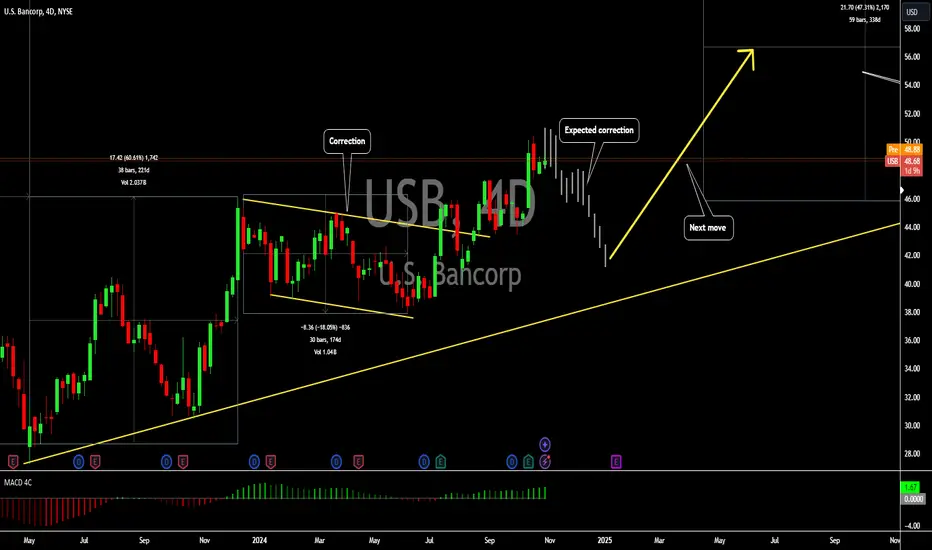
U.S. Bancorp Buy opportunity setting upU.S. Bancorp is a financial service holding company. The Company’s major lines of business are Wealth, Corporate, Commercial and Institutional Banking, Consumer and Business Banking, Payment Services, and Treasury and Corporate Support. The Company provides a range of financial services, including lending and depository services, cash management, capital markets, and trust and investment management services
FUNDAMENTAL METRICS
Exchange- New York stock exchange
Market capitalization- $75.73B
Basic EPS- $3.27
Total Net revenue- $28.1B
Net Income- $5.4B
Average common shares outstanding- 1.5B
Total assets- $663B
Deposits- $512B
Provision for credit losses -$2.3B
Dividends declared per share- $1.93
Financial metrics as at year ended Dec 31, 2023, Market cap as per 24.10.2024 Q4 EARNINGS SUMMARY (Date of release 16.10.2024) (Next report date Jan 16,2025)
1. Net income of $1,714 million and diluted earnings per common share of $1.03. Revenue missed analyst estimates by 1.0%. Earnings per share (EPS) exceeded analyst estimates by 4.5%.
2. There shall be a share buy back program of $5 billion.
3. The bank is focused on organic growth & broadening their reach. Not interested in mergers & Acquisitions currently. The bank's latest large investment was the acquisition of Union Bank, which closed in December 2022. This meaningfully expanded its presence in California.
4. Net revenue of $6,864 million, including $4,166 million of net interest income on a taxable-equivalent basis
5. Noninterest income of $2,817 million driven by year-over-year increases in:
i. Commercial products revenue of 12.1%
ii. Trust and investment management fees of 6.4%
iii. Payment services revenue of 3.1%
iv. Mortgage banking revenue of 7.6%
6. Non-interest expenses dropped by 1% compared to last year, but increased slightly by 0.4% compared to the last quarter, when accounting for previous notable expenses.
7. The bank's return on common equity was 17.9%, return on assets was 1.03%, and efficiency ratio was 60.2%.
TECHNICAL ANALYSIS RULES
1. Structure drawing (Trend line drawing on past price chart data)
2. Patterns identification (Naming patterns on past price chart data for future wave)- Corrective flag forming
3. Future indication (Reading indicator for future wave)- MACD 0 crossover to signal buys
4. Future wave (Drawing on future price chart using future indication from indicator)- highlighted
5. Future reversal point (Identifying trend reversal point on price chart using structure)- Target price $67.35 (top of bigger correction)
Look for the trade on lower timeframe by identifying impulses & correction as shown
Recommendation:
Buy price range: $44.8- $48
Target price: $67
Top Shareholders
The Vanguard group- 8.64%
BlackRock Institutional Trust Company- 4.85%
State Street Global Advisors- 4.26%
MUFG Bank- 4.22%
Charles Schwab Investment managers- 2.92%
Fidelity Management- 2.66%