Community ideas

TradingView and Coin Metrics: New Era in Crypto Asset AnalysisHello investors and trading enthusiasts!
Today, we bring you a great news that'll take your crypto analysis up another notch.
Coin Metrics, renowned in crypto financial intelligence, has now integrated its dataset into the TradingView platform. Coin Metrics brings robust data on crypto networks, enriching the decisions of traders and investors with accurate information.
Through this partnership, over 50 million TradingView users now have access to even more detailed and comprehensive information to analyze crypto assets.
How to access Coin Metrics data?
Type "COINMETRICS:" into the asset search field:
📈 Examples
Bitcoin - Sum of unique addresses that were active on a given day
Ethereum - Newly created addresses with a non-zero starting balance
This integration is more than just data; it is a strategic collaboration to explore new markets and create innovative use cases in the world of digital assets . For more details, visit the official Coin Metrics website .
We hope you found this as amazing as we did. We'd love to know in the comments what you think of this new integration.
Additionally, if you have any suggestions for future improvements or implementations on Tradingview, just drop us a message.
Congratulations on being part of the world's largest community of Traders and Investors!
- TradingView Team ❤️❤️❤️
GBPUSD: Important Breakout Time To ShortPrice has broken out of a very solid support zone which price has been bouncing off multiple times.
As you can see, the price is making a pullback to the support turned resistance zone.
I believe a rejection from this zone could lead the price to fall towards the pullback support
I'm bearish biased

Bullion Ballet: Trading the Gold Platinum RatioGold is the favoured precious metal. Its demand reflects consumer consumption of jewellery, investment demand, and monetary policy conditions. In a previous paper , Mint Finance highlighted these factors in detail.
Platinum is also a precious metal, used to create jewellery and to a small extent as a form of investment. Crucially, unlike gold (6% industrial demand), platinum (73% industrial demand) is used more extensively for industrial applications.
As gold and platinum share the source of jewellery demand, their performance is generally positively correlated.
However, due to the distinct sources of demand as well as the extent to which each precious metal is used for each application, the correlation can break. These periods can offer tactical trading opportunities to benefit from the relative performance of CME Group’s precious metals suite. Particularly in a key ratio called the Gold to Platinum Ratio (“GPR”) which measures the price of gold relative to platinum.
WHAT DRIVES THE GOLD-PLATINUM-RATIO
The GPR is affected by monetary policy. Though the ratio does not show a distinct impact upon the first-rate cuts by Fed, rapid rate cuts in response to economic crises such as recessions can cause it to rally.
The GPR increases during recessions due to investor preference for gold during times of crisis.
Interestingly, the ratio has been rising since 2008 as gold price reaches new record highs, while platinum currently faces a cyclical downturn.
RECESSION MAY BE UNLIKELY
While the GPR faces the potential to increase during a potential recession, there are signs that a recession may be unlikely in the US. US spending remains resilient and has contributed to faster than expected GDP growth in 2023. While growth slowed heading into Q4 2023, it is still expected to expand at a strong 2% in the quarter.
Moreover, the January BLS nonfarm payrolls report showed a massive 353k new jobs added. Wage growth was strong at 0.6% MoM, double the analyst estimate. Strong labour market and consumer spending in the US point to a healthier than expected economy.
INDUSTRIAL SLOWDOWN WILL STILL HAMPER PLATINUM DEMAND
In 2023, 33% of platinum’s demand came from industrial sources according to data from the World Platinum Investment Council . Platinum is used as a catalyst for several crucial industrial chemical processes. In addition, automotive demand represents a further 40% of total platinum demand.
In the automotive industry, platinum is used in catalytic converters to reduce emissions. This has been a recent driver of platinum demand due to rising emissions standards and the so-called platinum-for-palladium substitution.
In short, palladium is a Platinum Group Metal (PGM) which can be used interchangeably in automotive applications. The surge in palladium prices prompted many automakers to replace it with platinum. These changes will be in place for the lifetime of a car’s production so this trend will benefit platinum for an extended period.
While platinum is a standout among the so-called Platinum Group Metals (PGM), the industry has been facing a downturn over the past 2 years with prices sharply lower. Ample above-ground inventories as well as low investment demand has hampered platinum performance.
This downturn may not be permanent. Higher automotive demand and growth in hydrogen vehicles are expected to be long-term growth drivers for platinum.
For 2024, the World Platinum Investment Council forecasts a smaller supply deficit than 2023. This is largely due to lower industrial and investment demand as well as improved supply.
Anglo American, one of the largest producers of refined platinum stated that it expects PGM production to improve, which means ample supply.
During 2023, production was hampered in South Africa. Going forward, PGM’s are meant to be a major driver for the mining giant, so efforts to improve production are under way and management also expects prices to recover. However, continued cost pressures may force miners to scale back production.
Overall, the slowdown in chemical and petroleum demand as well as ample supply will limit Platinum’s performance in 2024, though price does face upside potential in the medium-to-long term.
BENEFITS OF TRADING THE RATIO
Platinum faces a mixed outlook in 2024, while there are several long-term demand growth drivers pushing price up, it faces uncertain but bearish production and demand outlooks for 2024.
Similarly, gold is benefiting from heightened geo-political risk and strong central bank demand but faces resistance as prices reaches new record highs and a recession looks unlikely. Mint Finance covered some of these factors in detail in a previous post .
While the outlook for both precious metals alone is uncertain, a trade on the back of the GPR favours gold.
Not only has the ratio been on an uptrend for the past decade, it has outperformed both gold and platinum prices.
Moreover, the ratio is not prone to overly large corrections. The largest drawdown in the ratio was smaller than the largest drawdown in gold and platinum prices.
HYPOTHETICAL TRADE SETUP
To express a position on GPR, investors can opt to use CME Group’s suite of precious metals future. Margin offset of 50% is available for a trade consisting of 1 gold (GC) contract and 2 platinum (PL) contracts. Executing a trade on the May futures contracts (GCK2024 and PLK2024), requires margin of:
(Margin for Gold Leg + 2 x Margin for Platinum Leg) = (USD 8,300 + 2 x USD 2,800) = USD 13,900 – margin offset of 50% = USD 6,950.
CME options on gold and platinum point to a bullish outlook for both but gold positioning is more bullish than platinum. As of 5/Feb, Gold options have a put/call ratio of 0.48 while platinum options have a put/call ratio of 0.75.
Consider the following hypothetical trade setup:
Entry: 2.275
Target: 2.530
Stop Loss: 2.100
Profit at Target: USD 23,013
Loss at Stop: USD 15,803
Reward to Risk: 1.46x
This position benefits when:
• Gold price rises faster than platinum.
• Gold price falls slower than platinum.
The position loses when:
• Gold price rises slower than platinum.
• Gold price falls faster than platinum.
MARKET DATA
CME Real-time Market Data helps identify trading set-ups and express market views better. If you have futures in your trading portfolio, you can check out on CME Group data plans available that suit your trading needs tradingview.sweetlogin.com
DISCLAIMER
This case study is for educational purposes only and does not constitute investment recommendations or advice. Nor are they used to promote any specific products, or services.
Trading or investment ideas cited here are for illustration only, as an integral part of a case study to demonstrate the fundamental concepts in risk management or trading under the market scenarios being discussed. Please read the FULL DISCLAIMER the link to which is provided in our profile description.

Chainlink - Did We Just Witness Wykoff Accumulation?To all my fellow traders, speculators and gamblers, its been some time since my last post.
I hope you've all been well, and most importantly, bathing in huge profits :)
It seems like Chainlink followed textbook Wykoff Accumulation Schematics.
Not the most perfect schematics, notably PS ( Prelim Support) falling a little short of the soon to be Resistance Lines.
In addition, BU only touched the resistance turned support once before rocketing up.
However the first PS does line up with the BU and subsequent SOS (Show Of Strength)
Phase A includes a number of additional ST ( Secondary Test) which is common after the SC (Selling Climax) stage. The selling Climax should've marked the lowest point, but price action made a lower low after the AR (Auto Rally) But it was merely a 19c difference.
Price still stayed within the TR(Trading Range) and bounced from the support lines.
The AR also marked the highest point within the trading range.
These are all minor discrepancies as price action continued to follow Wykoff theory.
We had multiple touches of the Support / Resistance lines, along with a perfect Spring (Final Shakeout/Bear Trap), Test and LPS, followed by a BU + SOS.
It took approximately 533 days from the SC (Selling Climax) to the TR (Trading Range) breakout,
The longer the accumulation period, the stronger the "Spring".
Does this mean price will continue north? Not necessarily, we've all seen these schematics fail. After all, Chainlink is up over 305% since the $4.65 Spring/Shakeout/Bear Trap lows.
That would've made an awesome long entry.
However, price is still way below its $53 ATH, so anything is possible.
Having a quick look we could see that price is currently at resistance levels.
A break from the 19$ range could initiate further upside.
Like the majority of the market, the crypto king (BTC) will probably dictate Chainlinks next move.
If we are to follow Wykoff theory, we could expect further upside.
I made a post back in May 22' private post titled "Link... Whales have been accumulating"
I remember reading many articles at the time that stated big players were buying up Chainlink.
Price action also found support at various Fibonacci levels, in addition to strong buy signals.
RSI Levels were at record lows, in addition to a whopping 90% correction at the time.
Unfortunately, I never got around to publishing that idea, it would've made a fantastic post.
I am no expert on Wykoff theory, so I've included information taken from various online sources.
Hopefully it helps, Much love and lots of profits to you all.
What is Wyckoff Accumulation?
Each cycle in the market begins with accumulation. This phase is marked by a range trend, where the market is relatively stable and rangebound. During this phase, institutional investors buy the stock at lower prices. Also, the volume tends to decline in this phase because the buying interest gradually absorbs the selling pressure.
Another way to confirm accumulation is to look at the support level. You may notice higher lows, indicating that the buyers are gaining power. Slowly, the trading volume begins to rise. This is a key indicator of the shift in sentiment and suggests a breakout trend.
As the accumulation progresses, you may see signs of strength in the price action, where the asset breaks above the trading range’s upper boundary.
This breakout often indicates that the market is ready for an upward move.
During the Wyckoff Accumulation process, smart money builds substantial positions at favourable prices before the broader market realizes the potential for an upward move.
The accumulation may resemble a “compressed spring” on the chart.
The longer it is, the better the indication of a breakout.
Markup: The second phase of accumulation is the markup, which follows a breakout.
According to Wyckoff, traders should find entry points through the pullback zones in this phase.
Wyckoff Events
PS— Preliminary Support , where substantial buying begins to provide pronounced support after a prolonged down-move. Volume increases and price spread widens, signalling that the down-move may be approaching its end.
SC— Selling Climax, the point at which widening spread and selling pressure usually climaxes and heavy or panicky selling by the public is being absorbed by larger professional interests at or near a bottom. Often price will close well off the low in a SC, reflecting the buying by these large interests.
AR— Automatic Rally , which occurs because intense selling pressure has greatly diminished. A wave of buying easily pushes prices up; this is further fueled by short covering. The high of this rally will help define the upper boundary of an accumulation TR.
ST— Secondary Test , in which price revisits the area of the SC to test the supply/demand balance at these levels. If a bottom is to be confirmed, volume and price spread should be significantly diminished as the market approaches support in the area of the SC. It is common to have multiple STs after a SC.
Springs or shakeouts usually occur late within a TR and allow the stock’s dominant players to make a definitive test of available supply before a markup campaign unfolds. A “spring” takes price below the low of the TR and then reverses to close within the TR; this action allows large interests to mislead the public about the future trend direction and to acquire additional shares at bargain prices.
A terminal shakeout at the end of an accumulation TR is like a spring on steroids.
Shakeouts may also occur once a price advance has started, with rapid downward movement intended to induce retail traders and investors in long positions to sell their shares to large operators.
Test — Large operators always test the market for supply throughout a TR (e.g., STs and springs) and at key points during a price advance. If considerable supply emerges on a test, the market is often not ready to be marked up. A spring is often followed by one or more tests; a successful test (indicating that further price increases will follow) typically makes a higher low on lesser volume.
SOS — Sign Of Strength , a price advance on increasing spread and relatively higher volume. Often a SOS takes place after a spring, validating the analyst’s interpretation of that prior action.
LPS—Last Point of Support , the low point of a reaction or pullback after a SOS. Backing up to an LPS means a pullback to support that was formerly resistance, on diminished spread and volume. On some charts, there may be more than one LPS, despite the ostensibly singular precision of this term.
BU—“Back-Up” . This term is short-hand for a colourful metaphor coined by Robert Evans, one of the leading teachers of the Wyckoff method from the 1930s to the 1960s. Evans analogized the SOS to a “jump across the creek” of price resistance, and the “back up to the creek” represented both short-term profit-taking and a test for additional supply around the area of resistance. A back-up is a common structural element preceding a more substantial price mark-up, and can take on a variety of forms, including a simple pullback or a new TR at a higher level.
Each Phase Explained.
Phase A: Phase A marks the stopping of the prior downtrend. Up to this point, supply has been dominant. The approaching diminution of supply is evidenced in preliminary support (PS) and a selling climax (SC). These events are often very obvious on bar charts, where widening spread and heavy volume depict the transfer of huge numbers of shares from the public to large professional interests. Once these intense selling pressures have been relieved, an automatic rally (AR), consisting of both institutional demand for shares as well as short-covering, typically ensues. A successful secondary test (ST) in the area of the SC will show less selling than previously and a narrowing of spread and decreased volume, generally stopping at or above the same price level as the SC. If the ST goes lower than that of the SC, one can anticipate either new lows or prolonged consolidation. The lows of the SC and the ST and the high of the AR set the boundaries of the TR. Horizontal lines may be drawn to help focus attention on market behaviour.
Sometimes the downtrend may end less dramatically, without climactic price and volume action. In general, however, it is preferable to see the PS, SC, AR and ST, as these provide not only a more distinct charting landscape but a clear indication that large operators have definitively initiated accumulation.
In a re-accumulation TR (which occurs during a longer-term uptrend), the points representing PS, SC and ST are not evident in Phase A. Rather, in such cases, Phase A resembles that more typically seen in distribution (see below). Phases B-E generally have a shorter duration and smaller amplitude than, but are ultimately similar to, those in the primary accumulation base.
Phase B: In Wyckoffian analysis, Phase B serves the function of “building a cause” for a new uptrend (see Wyckoff Law #2 – “Cause and Effect”). In Phase B, institutions and large professional interests are accumulating relatively low-priced inventory in anticipation of the next markup. The process of institutional accumulation may take a long time (sometimes a year or more) and involves purchasing shares at lower prices and checking advances in price with short sales. There are usually multiple STs during Phase B, as well as upthrust-type actions at the upper end of the TR. Overall, the large interests are net buyers of shares as the TR evolves, with the goal of acquiring as much of the remaining floating supply as possible. Institutional buying and selling imparts the characteristic up-and-down price action of the trading range.
Early on in Phase B, the price swings tend to be wide and accompanied by high volume. As the professionals absorb the supply, however, the volume on downswings within the TR tends to diminish. When it appears that supply is likely to have been exhausted, the stock is ready for Phase C.
Phase C: It is in Phase C that the stock price goes through a decisive test of the remaining supply, allowing the “smart money” operators to ascertain whether the stock is ready to be marked up. As noted above, a spring is a price move below the support level of the TR (established in Phases A and B) that quickly reverses and moves back into the TR. It is an example of a bear trap because the drop below support appears to signal resumption of the downtrend. In reality, though, this marks the beginning of a new uptrend, trapping the late sellers (bears). In Wyckoff's method, a successful test of supply represented by a spring (or a shakeout) provides a high-probability trading opportunity. A low-volume spring (or a low-volume test of a shakeout) indicates that the stock is likely to be ready to move up, so this is a good time to initiate at least a partial long position.
The appearance of a SOS shortly after a spring or shakeout validates the analysis. As noted in Accumulation Schematic #2, however, the testing of supply can occur higher up in the TR without a spring or shakeout; when this occurs, the identification of Phase C can be challenging.
Phase D: If we are correct in our analysis, what should follow is the consistent dominance of demand over supply. This is evidenced by a pattern of advances (SOSs) on widening price spreads and increasing volume, as well as reactions (LPSs) on smaller spreads and diminished volumes. During Phase D, the price will move at least to the top of the TR. LPSs in this phase are generally excellent places to initiate or add to profitable long positions.
Phase E: In Phase E, the stock leaves the TR, demand is in full control and the markup is obvious to everyone. Setbacks, such as shakeouts and more typical reactions, are usually short-lived. New, higher-level TRs comprising both profit-taking and acquisition of additional shares (“re-accumulation”) by large operators can occur at any point in Phase E. These TRs are sometimes called “stepping stones” on the way to even higher price targets.
Who Was Richard Wykoff?
Richard Demille Wyckoff (1873–1934) was an early 20th-century pioneer in the technical approach to studying the stock market. He is considered one of the five “titans” of technical analysis, along with Dow, Gann, Elliott, and Merrill.
At age 15, he worked as a stock runner for a New York brokerage.
Afterward, while still in his 20s, he became the head of his firm.
He also founded and, for nearly two decades, wrote and edited The Magazine of Wall Street, which, at one point, had more than 200,000 subscribers.
Wyckoff was an avid student of the markets, as well as an active tape reader and trader.
He observed the market activities and campaigns of the legendary stock operators of his time, including JP Morgan and Jesse Livermore.
From his observations and interviews with those big-time traders, Wyckoff codified the best practices of Livermore and others into laws, principles, and techniques of trading methodology, money management, and mental discipline.
Mr. Wyckoff observed numerous retail investors being repeatedly fleeced.
Consequently, he dedicated himself to instructing the public about “the real rules of the game” as played by the large interests, or “smart money.”
In the 1930s, he founded a school that would later become the Stock Market Institute.
The school's central offering was a course that integrated the concepts that Wyckoff had learned about identifying large operators' accumulation and distribution of stock with how to take positions in harmony with these big players.
His time-tested insights are as valid today as they were when first articulated.
Speculative Setup, DYOR.

Best Editors' Picks of 2023We present our awards for the best Editors' Picks of 2023! This marks our second year of recognizing outstanding open-source Community scripts. From the 84 picks in 2023, our PineCoders have cast their votes, highlighting three exceptional indicator scripts and one outstanding library. Each author of these noteworthy entries will receive 100,000 TradingView coins.
The awardees:
• Intrabar Analyzer by KioseffTrading
• Machine Learning: Lorentzian Classification by jdehorty
• Harmonic Patterns Based Trend Follower by Trendoscope
• SimilarityMeasures by RicardoSantos
Congratulations to the winners, and a heartfelt thank you to all Pine Script™ coders who contribute their open-source publications to our Community scripts . We eagerly anticipate another year of remarkable scripts in 2024!
What are Editors' Picks ?
The Editors' Picks showcase the best open-source script publications selected by our PineCoders team. Many of these scripts are original and only available on TradingView. These picks are not recommendations to buy or sell anything, nor to use a specific indicator. Our aim is to highlight the most interesting recent publications to encourage learning and sharing in our community.
Any open-source Community scripts can be picked if they're original, provide good potential value to traders, include helpful descriptions, and comply with the House Rules.

BITCOIN forming the first 4H Golden Cross in 5 months!Bitcoin (BTCUSD) is about to form a Golden Cross on the 4H time-frame, which will be the first such formation in almost 5 months (since September 18 2023)! Regardless of the time that has passed since its last occurrence (which is a strong parameter), that pattern alone is a strong enough bullish signal for the short-term.
This can be the signal that can trigger a strong rally back to January's High but within the technical context of the dominant medium-term pattern that is none other than an Inverse Head and Shoulders (IH&S). That is a technical bullish reversal pattern that is formed on market bottoms.
It could be no coincidence that the last 4H Golden Cross (chart on the right) was formed while BTC was completing an Inverse Head and Shoulders. The standard target of such patterns is the 2.0 Fibonacci extension level. As you see on October 20 2023 that was exactly where the price consolidated and it happened to be a Resistance level from a former High.
The 2.0 Fib on the current IH&S happens to be only marginally above the 49000 Resistance and that is our Target for the short-term.
Do you agree that the emergence of a 4H Golden Cross and the Inverse Head and Shoulders can take the price back to January's High? Feel free to let us know in the comments section below!
-------------------------------------------------------------------------------
** Please LIKE 👍, FOLLOW ✅, SHARE 🙌 and COMMENT ✍ if you enjoy this idea! Also share your ideas and charts in the comments section below! This is best way to keep it relevant, support us, keep the content here free and allow the idea to reach as many people as possible. **
-------------------------------------------------------------------------------
💸💸💸💸💸💸
👇 👇 👇 👇 👇 👇

TradingView Community Awards 2023Our 2023 Community Awards have arrived! It's time to shine light on the standout traders, the ones who have not only shared consistent ideas on our network, but have also expanded their influence and captivated our trading community with countless boosts, follows, and comments.
Below, you'll find the profiles of our winners. This includes the top achievers who not only made it to our Editors' Picks but also bagged a free Premium plan! And let's not forget our second and third-place stars, who are also getting their well-deserved spotlight. Make sure to check out and follow these remarkable authors! 🌟🏆📈👇
🏆 Most popular ideas:
These are the ideas that created the most engagement from our community in 2023. Check out how they stood the test of time. 🔥📈💡
🥇 Gold
- Bitcoin Price prediction
🥈 Silver
- NVDA: Short of the Century (Update)
🥉 Bronze
- Will the price of gold continue to rise?
🏆 Most Valuable Pine Scripts
Dive into the most valuable Pine Scripts of 2023 on TradingView. They're game-changers, loaded with innovative features to enhance your trading. Check them out and level up your strategies! 🌲📊🚀
🥇 Gold
🥈 Silver
🥉 Bronze
Bonus: Best Pine library
🏆
🏆 Best Educational Ideas
Packed with wisdom and top-notch strategies, these ideas are gold mines for anyone keen to learn. Dive in and boost your trading know-how!📖💡
🥇 Gold
- Trading like a Pro with Heiken Ashi
🥈 Silver
- Fitting patterns to your bias?
🥉 Bronze
- Investing in Crypto
🏆 The Top Chatters
Our most active chatters of 2023 on TradingView! Think of them as the Chatty Cathys and Talkative Toms of the TradingView social network.🎙️😄
🥇 Gold : tradingview.sweetlogin.com
🥈 Silver : tradingview.sweetlogin.com
🥉 Bronze : tradingview.sweetlogin.com
🏆 Top Live Streamers
These are the superstars turning screens into stages, dishing out live trading drama and wisdom. Tune in to their channels for a front-row seat to the action! 🎥🎤
🥇 Gold : tradingview.sweetlogin.com
🥈 Silver : tradingview.sweetlogin.com
🥉 Bronze : tradingview.sweetlogin.com
🏆 Top Commenters
Spotlight on 2023's Top Comments on ideas at TradingView! These gems are more than just words; they're mini-masterpieces of wit and wisdom. 💬📊🤓
🥇 Gold : tradingview.sweetlogin.com - Nayanstock
🥈 Silver : tradingview.sweetlogin.com - Kabuci
🥉 Bronze : tradingview.sweetlogin.com - Juggy…
🏆 Top Editors’ Picks
Take a look at 2023's stars on TradingView, consistently featured in Editors' Picks! They're the maestros of the market, delivering quality insights and analyses time and again. Follow their work for a steady stream of top-notch trading wisdom. 🔮📈🧙♂️
🥇 Gold : tradingview.sweetlogin.com
🥈 Silver : tradingview.sweetlogin.com
🥉 Bronze : tradingview.sweetlogin.com
And there you have it! Our 2023 community award winners. Now, let’s all have a fantastic 2024 together. Godspeed!
Team TradingView 📈🌲

BTC Market Cycle | Repetitive and Predictable Market CycleThe Bitcoin market cycle can be easily predicted by studying historical data. Whenever you seek an idea of where the market is heading, you can always look at the past to gauge the future. However, this doesn't guarantee that the predictions stated here will unfold exactly as described; it's a PREDICTION, not a fact.
Let's examine the chart displayed here. The market cycle repeats itself every four years, with our chart divided into four cycles, the fourth being the current cycle we are in. Every four years, Bitcoin undergoes a major event known as Halving, where the number of blocks containing Bitcoins is halved every four years. We started with 50 Bitcoins released in a block every 10 minutes; in 2012, that amount was reduced to 25 BTC. In the following cycle, it was halved again, and this will continue to happen every four years until all Bitcoins are mined. Currently, we are heading towards the fourth halving event, which will see the number of blocks released reduced to 3.125 BTC.
Due to this event, the price of Bitcoin appreciates in value every four years. This is driven by supply and demand, as fewer Bitcoins are mined than in the previous four years (reduced supply), creating scarcity and increasing demand. The mining difficulty also increases, causing miners to be reluctant to sell the Bitcoins they've mined, contributing to the price increase.
On our chart, we have three completed cycles that look almost identical. The cycles consist of a bull market where the price experiences a significant increase, followed by a bear market where the price drops in the range of 80–85%. This is followed by the first expansion, where we see a slight price increase, followed by the first accumulation phase. Prices move up and down within a specified range during this phase, also known as the consolidation phase. We then move on to the second expansion and the second accumulation, usually forming just before or within the halving period.
This not only shows us that the market cycles are similar but also allows us to predict future events. At the time of writing this, we are three months away from the fourth halving, and it appears we have entered the second accumulation phase, as seen in the past three cycles. Prices should trade in a specified range for a few months after the halving. When you examine the halving events on the chart, you can observe that we usually enter the bull run somewhere between 6 to 8 months after the halving. Based on that, we can predict that the next bull run will start between October and December 2024, lasting until the fourth quarter of 2025.
In the past, the cycles have been accurate, and we can expect the same unless a global catastrophic event occurs, as seen in March 2020 during the COVID-19 pandemic. In that phase, there was no second expansion as all markets crashed. It is my opinion that this led to the bull run not reaching its full potential. Had we experienced the second expansion, the price would have moved slightly higher before the second accumulation phase, leading to an extended bull run pushing the price near or above $100k.
My price prediction at the end of the cycle, assuming world events stay normal, is to see Bitcoin in the range of $120–150K.
What do you think the price of Bitcoin at the end of 2025 will be? Like, share, and feel free to leave a comment. Let me know if you agree or disagree with this analysis.

Community challenge: Share Your Best Trading Idea!Hey there, fellow investors and trading enthusiasts!
We're starting the year with an exciting opportunity to reward the wisdom and experience that each of you brings to the table.
With markets reaching new highs, and the economy continuing its unpredictable nature, it's a perfect time to talk about the markets. After all, it's this volatility that makes the markets interesting, right?
Whether you're a seasoned veteran or a newbie eager to learn, your perspectives are incredibly valuable, and now you can even win an exclusive reward for sharing them!
What's your prediction for a breakthrough trade this year? Comment below and share your thoughts.
Three lucky participants with the most insightful comments will win the super-exclusive TradingView mug 🎁
Remember, if a comment resonates with you or sparks an idea, feel free to like or reply to it!
We can't wait to read your comments! 🔥
GBPCHF H4 | Bearish continuationGBPCHF could fall towards an overlap support and continue the downtrend, reversing to our take profit level.
Sell entry is at 1.09333 which is an overlap support level.
Stop loss is at 1.09998 which is an overlap resistance level.
Take profit is at 1.08063 which is a swing-low support that aligns with the 61.8% Fibonacci retracement level.
High Risk Investment Warning
Trading Forex/CFDs on margin carries a high level of risk and may not be suitable for all investors. Leverage can work against you.
Stratos Markets Limited (www.fxcm.com):
CFDs are complex instruments and come with a high risk of losing money rapidly due to leverage. 66% of retail investor accounts lose money when trading CFDs with this provider. You should consider whether you understand how CFDs work and whether you can afford to take the high risk of losing your money.
Stratos Europe Ltd, previously FXCM EU Ltd (www.fxcm.com):
CFDs are complex instruments and come with a high risk of losing money rapidly due to leverage. 70% of retail investor accounts lose money when trading CFDs with this provider. You should consider whether you understand how CFDs work and whether you can afford to take the high risk of losing your money.
Stratos Trading Pty. Limited (www.fxcm.com):
Trading FX/CFDs carries significant risks. FXCM AU (AFSL 309763), please read the Financial Services Guide, Product Disclosure Statement, Target Market Determination and Terms of Business at www.fxcm.com
Stratos Global LLC (www.fxcm.com):
Losses can exceed deposits.
Please be advised that the information presented on TradingView is provided to FXCM (‘Company’, ‘we’) by a third-party provider (‘TFA Global Pte Ltd’). Please be reminded that you are solely responsible for the trading decisions on your account. There is a very high degree of risk involved in trading. Any information and/or content is intended entirely for research, educational and informational purposes only and does not constitute investment or consultation advice or investment strategy. The information is not tailored to the investment needs of any specific person and therefore does not involve a consideration of any of the investment objectives, financial situation or needs of any viewer that may receive it. Kindly also note that past performance is not a reliable indicator of future results. Actual results may differ materially from those anticipated in forward-looking or past performance statements. We assume no liability as to the accuracy or completeness of any of the information and/or content provided herein and the Company cannot be held responsible for any omission, mistake nor for any loss or damage including without limitation to any loss of profit which may arise from reliance on any information supplied by TFA Global Pte Ltd.
The speaker(s) is neither an employee, agent nor representative of FXCM and is therefore acting independently. The opinions given are their own, constitute general market commentary, and do not constitute the opinion or advice of FXCM or any form of personal or investment advice. FXCM neither endorses nor guarantees offerings of third-party speakers, nor is FXCM responsible for the content, veracity or opinions of third-party speakers, presenters or participants.

Tesla Triangle Bottoming Out
NASDAQ:TSLA currently has two major confluences that I've been watching develop over the last few weeks.
Firstly, coming off the 6 month high of mid July, Tesla has retraced to the Fibonacci 0.618.
Secondly, A classic triangle is now clear.
Triangles break out either to the top or the bottom. However, there are multiple confluences that are pushing me towards a (short term) Long position for a breakout:
#1: The Psychological. It's been very trendy to short Tesla as of late. According to CNN , short sellers lost 12.2b in liquidity shorting Tesla last year. I suspect retail and algos are looking for a buy opportunity.
#2: Long Term Technicals. There are only so many people on this planet that can afford high quality electric vehicles. But, the Model 3 and Model Y is now within reach of most consumers. However, electric vehicles are starting to show some previously unknown issues with a mass market. CBS News reports that Tesla owners can expect to find a 30% reduction in range in temperatures below freezing. For many Americans, this can be hard to swallow, especially for those commuting 50-60 miles a day for work.
#3: Adam Jonas. Adam Jonas cut his bullish price target from 380 to 345 this morning citing multiple factors including, "Global EV momentum is stalling. The market is oversupplied (and not enough) demand."
#4. Price Action. I'll go into this a bit more below with my expectations.
I see two scenarios playing out long term, but first lets set the baseline:
618 fibonacci is extremely stable, and it near perfectly lines up with the price action triangle. Tesla earnings are two days. I suspect we'll see intraday tomorrow as people anticipate the report but nothing drastic. Cybertruck has been delivering for the past few months and I expect we'll see a Christmas sales bump missed in the October report as prices continue to drop.
If the earnings report is positive (It most likely is) We will absolutely see a retracement to the 0.5. As there is (currently) little price action to support a resistance of the 0.5, it's possible that it could push past and there could be a retest towards late November through early December trade chop.
Anything beyond that would be ultra speculative, but two likely scenarios will play out after the move up:
First and what I believe to be most likely, We'll see another retracement to 618 and a bottom side triangle breakout. Fibonacci velocity resistance on the same high & low shows weak support.
Combine this negative sentiment towards luxury goods and vehicles in general ( highest delinquency in 30 years ) and we very well could setup for a false or full on breakout of this triangle.
Second and personally less likely, we setup for a mini bull flag as price action consolidates and breakout at the top.
Any way it swings will be interesting. I'll be keeping an eye on other confluences that appear as the retracement plays out to make a more accurate guestimate.
Cheers
-T

EURUSD Analysis Today: Technical and Order Flow Analysis ! In this video, I will be sharing my EURUSD Analysis Today by providing my complete technical and order flow analysis so you can watch it to possibly improve your forex trading skillset.

EURGBP H4 | Potential bullish breakoutEUR/GBP is trading close to a pullback support and could potentially break above a descending trendline to make a bullish rise to the upside.
Buy entry is at 0.85700 which is a potential bullish breakout level (wait for price to break through the descending trendline for confirmation).
Stop loss is at 0.85350 which is a level that sits under a pullback support.
Take profit is at 0.86150 which is a pullback resistance that aligns close to the 38.2% Fibonacci retracement level.
High Risk Investment Warning
Trading Forex/CFDs on margin carries a high level of risk and may not be suitable for all investors. Leverage can work against you.
Stratos Markets Limited (www.fxcm.com):
CFDs are complex instruments and come with a high risk of losing money rapidly due to leverage. 66% of retail investor accounts lose money when trading CFDs with this provider. You should consider whether you understand how CFDs work and whether you can afford to take the high risk of losing your money.
Stratos Europe Ltd, previously FXCM EU Ltd (www.fxcm.com):
CFDs are complex instruments and come with a high risk of losing money rapidly due to leverage. 70% of retail investor accounts lose money when trading CFDs with this provider. You should consider whether you understand how CFDs work and whether you can afford to take the high risk of losing your money.
Stratos Trading Pty. Limited (www.fxcm.com):
Trading FX/CFDs carries significant risks. FXCM AU (AFSL 309763), please read the Financial Services Guide, Product Disclosure Statement, Target Market Determination and Terms of Business at www.fxcm.com
Stratos Global LLC (www.fxcm.com):
Losses can exceed deposits.
Please be advised that the information presented on TradingView is provided to FXCM (‘Company’, ‘we’) by a third-party provider (‘TFA Global Pte Ltd’). Please be reminded that you are solely responsible for the trading decisions on your account. There is a very high degree of risk involved in trading. Any information and/or content is intended entirely for research, educational and informational purposes only and does not constitute investment or consultation advice or investment strategy. The information is not tailored to the investment needs of any specific person and therefore does not involve a consideration of any of the investment objectives, financial situation or needs of any viewer that may receive it. Kindly also note that past performance is not a reliable indicator of future results. Actual results may differ materially from those anticipated in forward-looking or past performance statements. We assume no liability as to the accuracy or completeness of any of the information and/or content provided herein and the Company cannot be held responsible for any omission, mistake nor for any loss or damage including without limitation to any loss of profit which may arise from reliance on any information supplied by TFA Global Pte Ltd.
The speaker(s) is neither an employee, agent nor representative of FXCM and is therefore acting independently. The opinions given are their own, constitute general market commentary, and do not constitute the opinion or advice of FXCM or any form of personal or investment advice. FXCM neither endorses nor guarantees offerings of third-party speakers, nor is FXCM responsible for the content, veracity or opinions of third-party speakers, presenters or participants.

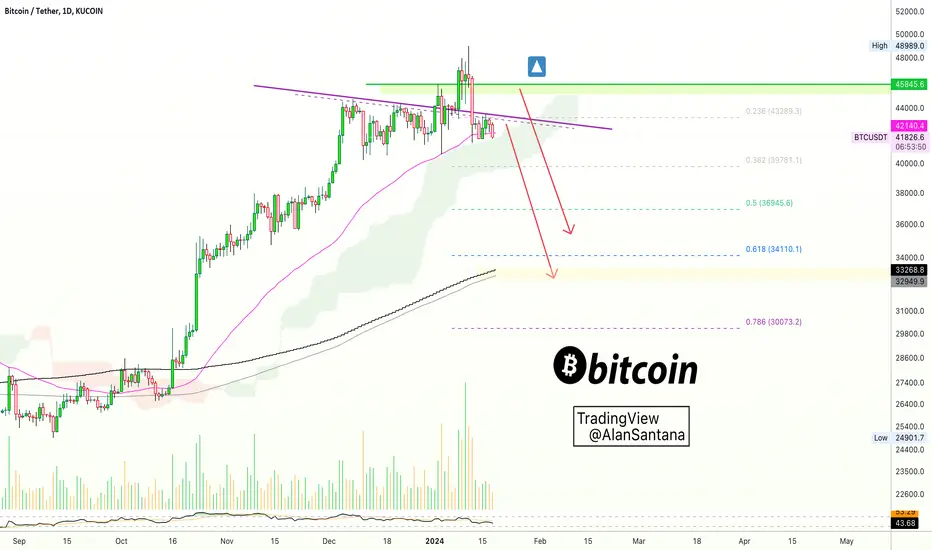
🅱️ Bitcoin Moving Below EMA50 Confirms Major CrashThis is not a drill... I repeat, this is not a drill!
Bitcoin is moving once more below EMA50 after a very weak bounce 16-January.
Moving daily below EMA50 simply confirms the upcoming correction without a shadow of doubt. This move is support by low volume and a weak RSI.
This signal only confirms when the day closes below $42,142 (EMA50).
While this is likely to happen today or fast, it can also take its time.
We are looking at the 20th of January, on or around this date (near) for the next major move to fully develop —based on Astrology (planetary movements).
Seeing these bearish signals, no doubt the next major move is down.
Prepare for a correction...
This is not a surprise we've been expecting this for months.
All related markets are also bearish.
The signals are coming from all across.
Prepare accordingly.
We still have some time left.
Thank you for reading.
Namaste.
Live stream - Morning Market ReviewJoin FXCM senior market specialist Russell Shor for a general review of the financial markets.

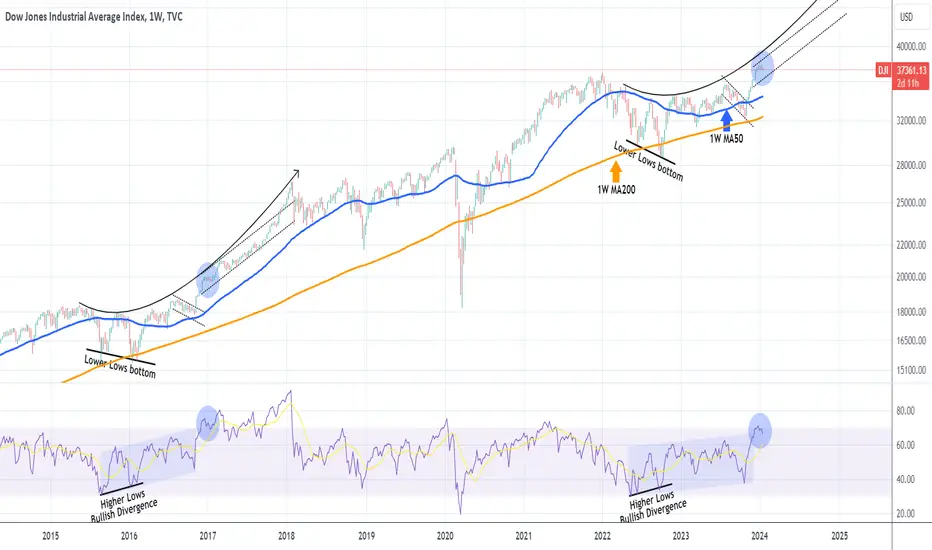
DOW JONES Why you don't want to miss this rally.Dow Jones (DJI) is pulling back on a technical correction as the 1W RSI got overbought (above the 70.00 mark) on the December 26 1W candle. That was basically the first time since June 01 2021 it got overbought and that time also gave a technical pull-back.
What draws our attention more than that time though is the December 19 2016 pull-back when the 1W RSI was again overbought. The difference here is that the price action and patterns that preceded that pull-back/ consolidation are very similar. A Lower Lows bottom on the 1W MA200 (orange trend-line) that took place on a 1W RSI Higher Lows Bullish Divergence, gave way to a break and sustainable rise above the 1W MA50 (blue trend-line). Following the current pull-back/ consolidation we are at, a very strong Channel Up took place.
As a result, even though the sentiment is bearish on the short-term, possibly until the January 31 Fed Meeting, it is clear that the long-term trend is bullish. Every such correction has high probabilities from now on to be a buy opportunity. The target can be as high as 43000 within 2024.
-------------------------------------------------------------------------------
** Please LIKE 👍, FOLLOW ✅, SHARE 🙌 and COMMENT ✍ if you enjoy this idea! Also share your ideas and charts in the comments section below! This is best way to keep it relevant, support us, keep the content here free and allow the idea to reach as many people as possible. **
-------------------------------------------------------------------------------
💸💸💸💸💸💸
👇 👇 👇 👇 👇 👇
USDCHF:The Confluence of Trends and FundamentalsHey Traders, in today's trading session we are monitoring USDCHF for a buying opportunity around 0.85300 zone, USDCHF is trading an uptrend and currently is in a correction phase in which it is approaching the trend at 0.85300 support and resistance area.
From a technical perspective, USDCHF exhibits a clear uptrend, and its current correction phase positions it near the critical support and resistance area at 0.85300. Traders will be closely monitoring this level for potential entry points.
Now, let's add a fundamental layer to our analysis. Recent economic indicators, especially the Consumer Price Index (CPI), play a pivotal role in shaping currency dynamics. Examining the previous CPI figures (3.1%, 3.2%, 3.7%) in contrast to the latest readings (3.4%, 3.1%, 3.2%), we observe a nuanced inflationary pattern. This trend suggests a potential strengthening of the US dollar, aligning with the Federal Reserve's dual mandate of price stability and maximum employment.
Considering the CPI data within the broader economic landscape, traders may anticipate increased speculation regarding the Federal Reserve's monetary policy. A growing inflationary environment could prompt the Fed to adopt a more hawkish stance, signaling potential interest rate adjustments in the future. This shift in monetary policy can significantly influence currency valuations, contributing to a possible strengthening of the USD against its counterparts.
In conclusion, as we navigate the intricacies of the forex market, keeping a watchful eye on both technical and fundamental factors is essential. The alignment of a favorable technical setup with evolving fundamental narratives enhances the overall decision-making process for traders.
Trade safe,
Joe.

Live stream - Morning Market ReviewJoin FXCM senior market specialist Russell Shor for a general review of the financial markets.

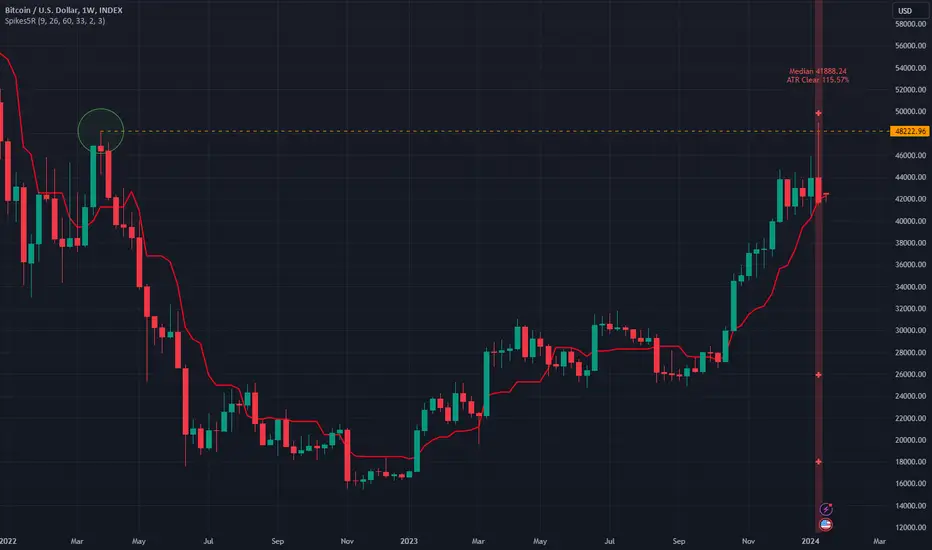
Bearish Bitcoin Spike on the Weekly"Buy the rumor/Sell the news" is a phenomenon as old as markets. It was like betting on the sun not to rise tomorrow.
I have talked to many Bitcoin enthusiasts who are perplexed by this occurrence. They were assured by various Twitter personalities that this week would see the largest inflow of capital into Bitcoin ever, price would rise, and if they just bought prior to the news they would make tremendous gains. This was never going to happen.
With the close of the prior eventful week's candle we now have a confirmed price Spike on the INDEX:BTCUSD Weekly. On Wednesday amid the "buy the news" nonsense price briefly surpassed a major high set in March 2022 only to retrace the entire ETF launch and then return to the bottom of the prior range. This is a very bearish signal from which price does not typically recover.
The first level of Support will be found around 32.2k; the 50% Retracement of the rally since November 2022. The most ironic, and most likely outcome, is that price retraces the entire ETF hype rally.
Breaking the ETF news high would of course resume the trend upward but at this point despite the memes circulating Twitter trying to reassure all to HODL that is a very low probability with the price action we have seen.
I remain short Bitcoin via pre-existing ETFs such as AMEX:BITI and will be adding to them during the coming week.
Wall Street is not coming to save your longs...
Is it time to buy China stocks? BABA? TME? PDD?Many Chinese stocks are quietly breaking out.
News headlines from other aspects of investing and world politics are drowning out these bullish setups.
Breakouts observed in some leading names.

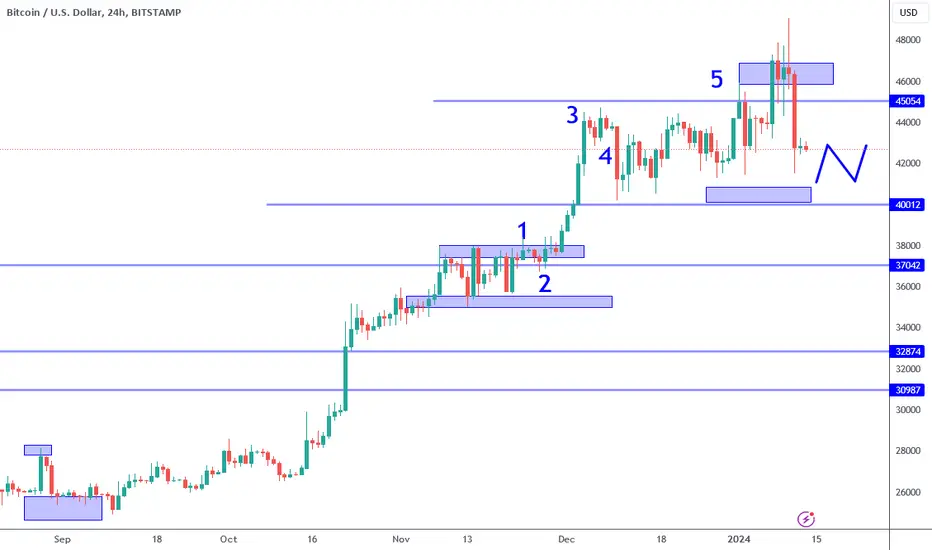
Bitcoin: 40K Break Trend Change?Bitcoin rejects the 50K resistance area and goes from 49K to 41,500 over a two day period. If you have been following my analysis on here you should NOT be surprised. I have been highlighting the extreme risks above 46K in my articles AND my streams since the beginning of the month. Is this an adequate pullback to buy into? I will address that now.
The first question that we must consider is: has anything changed in terms of trend? From a technical perspective, NOT YET. The 40K support is still intact, and until this level is clearly compromised, it is still within reason to anticipate the overall support to hold. One thing to keep in mind though, there is a large red candle coming off a major resistance level and this means momentum is bearish. IF this momentum continues, 40K can break at which point a change in trend would be in play.
For this reason, BEFORE considering any swing trades on the long side, I will WAIT for a complex reversal pattern (see illustration on chart). This can appear in the form of a classic double bottom or failed low in the 40K AREA. A couple of green inside bars is NOT enough in this situation because of the recent surge in momentum. Typically inside bars in this configuration are often momentum continuation patterns which at the moment favors the bears.
In previous reports and streams I have specifically mentioned the relevance of the monthly time frame and potential of a bearish C wave developing. IF 40K breaks, this further confirms that argument. A bearish C wave can potentially lead to a test of 15K (this can take months to play out). It is important to be cognizant of this scenario particularly for investors who plan to dollar cost average into the next pullback. Don't make the mistake to getting too big too soon.
There is no way to know if 15K will be tested, maybe the bottom of C turns out to be 30K, or maybe Wave C never unfolds at all, and 40K holds. The point is, don't get married to any opinions bullish OR bearish. Avoid getting swept up into the nonsense machine (the internet). You only need a few components of information to make reasonable decisions. Start with having a repetitive way to identify trend and changes of trend, and second the same for KEY support and resistance levels. These two components alone can improve decision making because they help you align with market intent.
This game is NOT about "thinking" and being right. It is about ADJUSTING as the market processes new information. Unless you are ahead of the information curve, you have to accept that the market is ALWAYS right. It can do whatever IT wants, WHENEVER it wants for ANY REASON. Charts help to isolate a probable range of scenarios which you can reference to better quantify risk. The more you over think it, the greater the chance that you lose.
Thank you for considering my analysis and perspective.
Live stream - The Week Ahead - Daily Pitch Int. with Darius AnucNikkei225, China50, ASX200, DJIA, S&P500, Nasdaq100, DAX40, FTSE100, DXY, Gold, Silver,WTI Oil,NatGas,Sugar,Bitcoin,BitcoinCash,Ethereum,Polkadot,AUDUSD,AUDJPY,NZDJPY, CHFJPY,USDJPY,USDCHF,USDCAD,GBPUSD,EURNZD,EURJPY,EURUSD.
