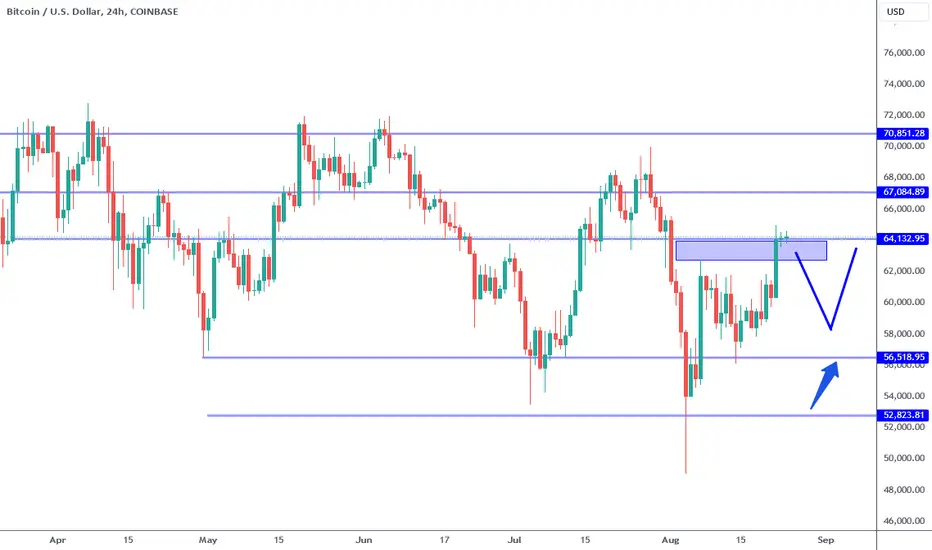
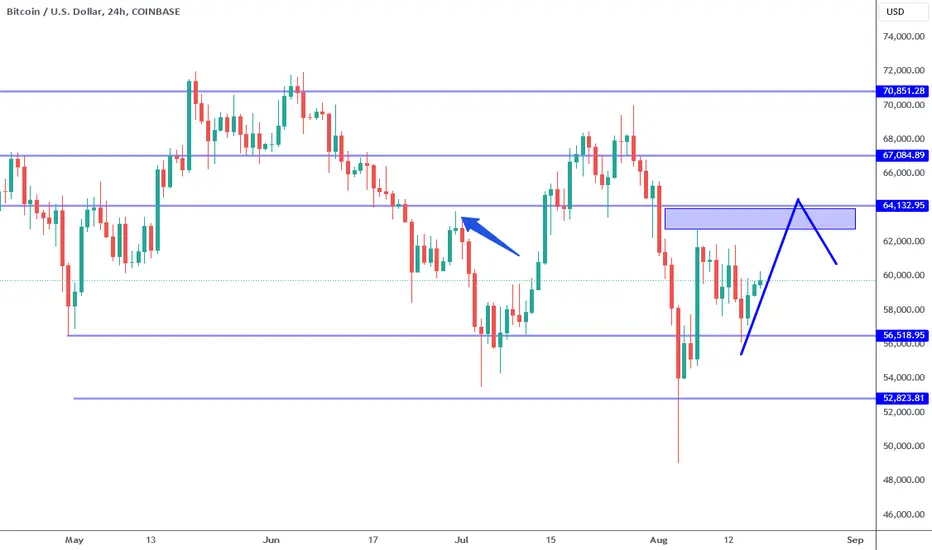
Bitcoin: Resistance Now Back To Support?Bitcoin rejected the 56K support and is now testing 64K resistance. Read my previous article to learn how I described this scenario a week in advance. With price at a proven resistance, along with a couple of inside bars suggests momentum continuation higher BUT how much higher? With the coming week typically being the SLOWEST week of the year, expectations should be LOW as far as seeing a push back into the high 60KS. Based on the recent price history along with considering the broader context, I am anticipating the 64K resistance area sticks and price is more likely to see the 60K support over the coming week.
Why this scenario over the countless possibilities? My reasoning is simple: the broader context has proven to be a range bound environment. In a range or consolidation, relevant support and resistance levels have a greater tendency to hold. That is the expectation, but whether the MARKET decides to agree with that is another story. This is precisely why having a routine way to CONFIRM the price action is key (this is what my Trade Scanner Pro is all about). The market is currently at a resistance, IF price action confirms a sell signal, the next support is around the 60K area (see arrow). I anticipate buying activity to confirm in such an area.
To use this information effectively, you must have certain things figured out. For example, if you are a day trader, it is reasonable to look for sell signals across smaller time frames near the 64K area. Risk can range from 150 to 400 pts (1 min to 5 min time frame) while profit objectives can range from 200 to 500 points max. This is all determined by the parameters of the time frame you operate within. Getting short now and expecting a test of 60K because "its a big move" does NOT account for the associated risk and profit objectives of your relative time frame (Trade Scanner Pro calculates all of this).
As I mentioned in my previous article, play the support/resistance levels or don't play at all. This is ESPECIALLY important this coming week which is typically the slowest of the year in terms of average volume. Slows grinds one way or the other, sharp movements one way or the other, lack of follow through, fake outs are all very common occurrences in such an environment. In my opinion, play small, recognize when you are WRONG fast and do NOT cling to hope. For beginners especially, if there is any time to take time off, this is the week.
If you must trade, at least trade on paper and learn while protecting yourself from a very highly random market.
For the majority of participants, this is a game of CHANCE not skill. The reason is they are misinformed into believing they are cultivating a skill which in reality has NOTHING to do with the outcome of their trade or action. For example, being able to read oscillators, interpreting news and recognizing patterns, etc. Like a slot machine, no matter how good you get at interpreting the animations, fancy images, sounds and buttons, you will have absolutely no effect over the outcomes of your bets. Does it have to be this way in the markets? No, but it is all a function of the quality of the information you choose to consume. Not all information carries the same value.
Here's something to consider: IF most of the population has access to the same information as you, chances are it offers NO advantage which means your outcomes are likely random. The skill in this game is being able to recognize value that is overlooked by the broader population while being flexible enough to adjust to changes that only price itself can convey. If you are having a hard time, you are most likely believing the misinformation that you consume.
Thank you for considering my analysis and perspective.
Community ideas
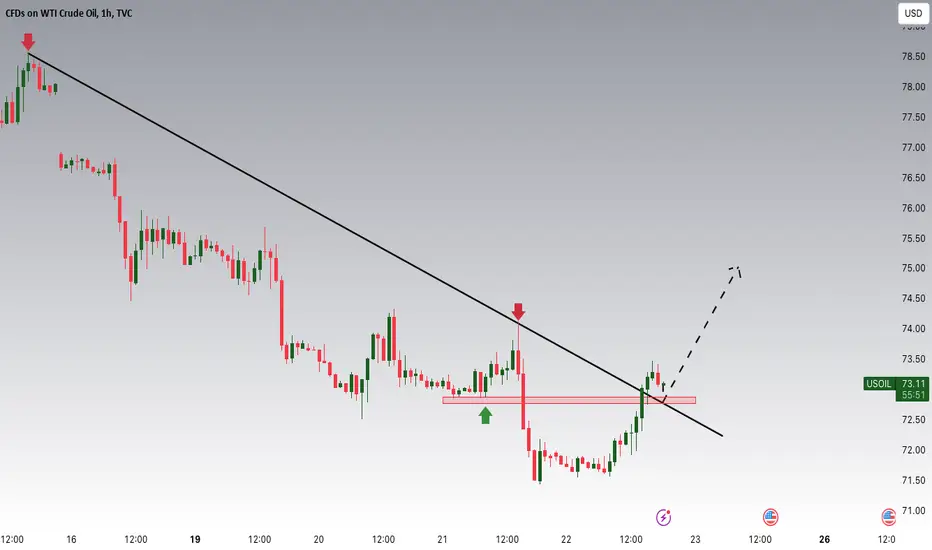
USOIL Potential UpsidesHey Traders, in today's trading session we are monitoring USOIL for a buying opportunity around 72.80 zone, USOIL was trading in a downtrend and currently in a correction phase in which it is approaching the retrace area at 72.80 support and resistance area.
Trade safe, Joe.
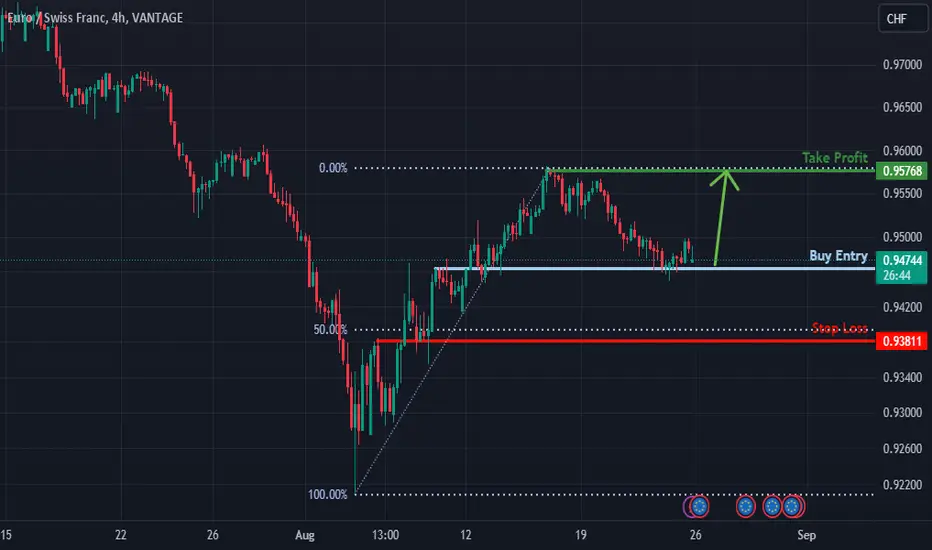
Bullish rise?EUR/CHF is reacting off the support level which is an overlap support and could rise from this level to our take profit.
Entry: 0.94637
Why we like it:
There is an overlap support level.
Stop loss: 0.93811
Why we like it:
There is an overlap support level which lines up with the 50% Fibonacci retracement.
Take profit: 0.95768
Why we like it:
There is a pullback resistance.
Please be advised that the information presented on TradingView is provided to Vantage (‘Vantage Global Limited’, ‘we’) by a third-party provider (‘Everest Fortune Group’). Please be reminded that you are solely responsible for the trading decisions on your account. There is a very high degree of risk involved in trading. Any information and/or content is intended entirely for research, educational and informational purposes only and does not constitute investment or consultation advice or investment strategy. The information is not tailored to the investment needs of any specific person and therefore does not involve a consideration of any of the investment objectives, financial situation or needs of any viewer that may receive it. Kindly also note that past performance is not a reliable indicator of future results. Actual results may differ materially from those anticipated in forward-looking or past performance statements. We assume no liability as to the accuracy or completeness of any of the information and/or content provided herein and the Company cannot be held responsible for any omission, mistake nor for any loss or damage including without limitation to any loss of profit which may arise from reliance on any information supplied by Everest Fortune Group.
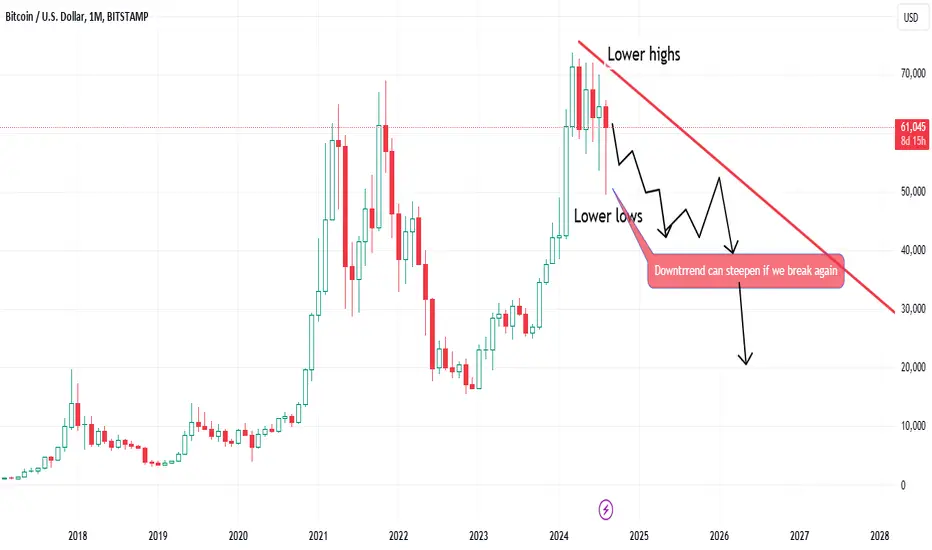
Will the BTC downtrend continue? BTC has down trended for 6 months. When you look at the smaller charts it's less obvious because it's messy but when you look at the monthly chart it's clear as can be.
The upside wicks are all lower. The downside wicks are all lower. We've made a series of lower lows and lower highs since the false breakout.
If we break again, we're going to go through the level I marked as the critical break level while we were at the high.
Read old post here;
Real make or break level for BTC now. Would be a very good look for it if it could break the downtrend, but if we can't we might be getting close to the obvious yank on this.
We might have been a through a 6 month period of baiting. Bringing in the bulls before the turn. If that's what's happening, we'd be close now.
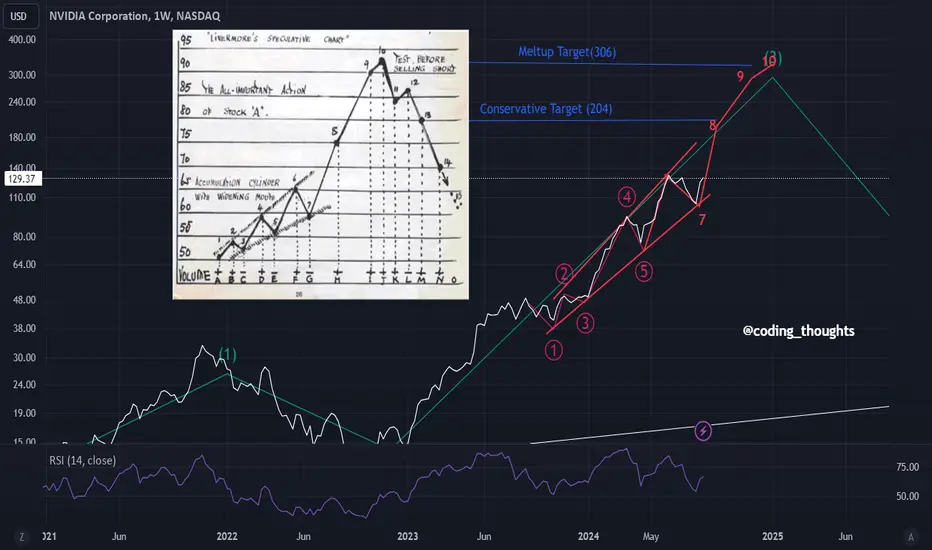
NVIDIA, parabolic move in progressIn my previous posts on NVIDIA, i mentioned that we are heading north and its likely going to get steep as we move ahead.
The larger term view is we are going to complete larger Wave 3(multi-year) and we are in last wave 5 of wave 3(Please refer to my other chart for larger term view).
Now i have tried to put Livermore Speculative chart on same chart and as of now its following it. I have two targets. These targets are 204 and 306 which i got from fibonacci levels.
This is not a trade recommendation or financial advise. Kindly consider proper risk management.
If you like the idea, kindly like, share and subscribe. :)
USDJPY - Trading The Ascending Triangle BreakoutAfter a nearly 2,000 pip plunge, USDJPY has found support & has started to reverse.
We ended the week not only violating an important level of previous structure resistance, but we also had a breakout & are currently retesting an ascending triangle.
This sets us up for a potential bullish (short-term) continuation opportunity & in this video I'll show you where I'm looking for price to potentially go to next.
Questions, Comments, or Views on this pair, please leave them below as I love to talk trading.
Hope you guys have a great weekend & keep you eyes out for more videos from me on this space.
Akil

Crypto and Bitcoin Market Update - Price Forecasts and MoreIn this video, I cover where I think the markets go next, including Bitcoin, ETH and Solana.
And how the NASDAQ:IBIT has become similar to the !CME in terms of how price tends to fill any gaps.
Nobody else is talking about this, but see for yourself and start tracking the IBIT gaps on a 4 Hour chart -- You'll be amazed.
I also share potential paths, likely a dip first, then push higher toward ATH.
And a new study I've been refining based on liquidity and timing cycles, showing we're very close to a major move upward in Bitcoin and the rest of the market.
Howerver, I feel the biggest bang for your $ will be BTC, SOL, and ETH from here.
Let me know what you think, and please like the video.

BUY NZDCAD - trade explained in detailTrader Tom, a technical analyst with over 15 years’ experience, explains his trade idea using price action and a top down approach. This is one of many trades so if you would like to see more then please follow us and hit the boost button.

Entering into a resistance zone, watching for support to hold Ahoy, fellow chart sailors! 🚢
Looks like we're steering into some resistance waters at the moment. Here's the treasure map for today:
The Resistance: We're bumping up against a notorious resistance level. Will it be the plank or will we sail through?
Support Ahoy: Keep your telescopes on the support lines. If we start to sink, these are the levels where we might find some buoyancy.
Volume Waves: Keep an eye on the trading volume. A surge could mean we're about to discover new lands (breakout), or it might just be a siren's song.
Signal Flags: My indicators are fluttering in the wind. The RSI is hinting we might be overbought, but the MACD still waves the bullish flag. What flags are you flying?
Trading Tactics:
Bullish Buccaneers: If you're on the long voyage, maybe set your stop-loss anchors just below the key support.
Bearish Brigands: If you're looking to short, wait for the cannons to confirm a breach below support.
What's your game plan as we sail through this resistance? Drop your thoughts below! Let's navigate these waters together. 🌊
Keep your wits about you and may your trades be ever in your favor!
Let's share our charts and insights. After all, a rising tide lifts all boats!

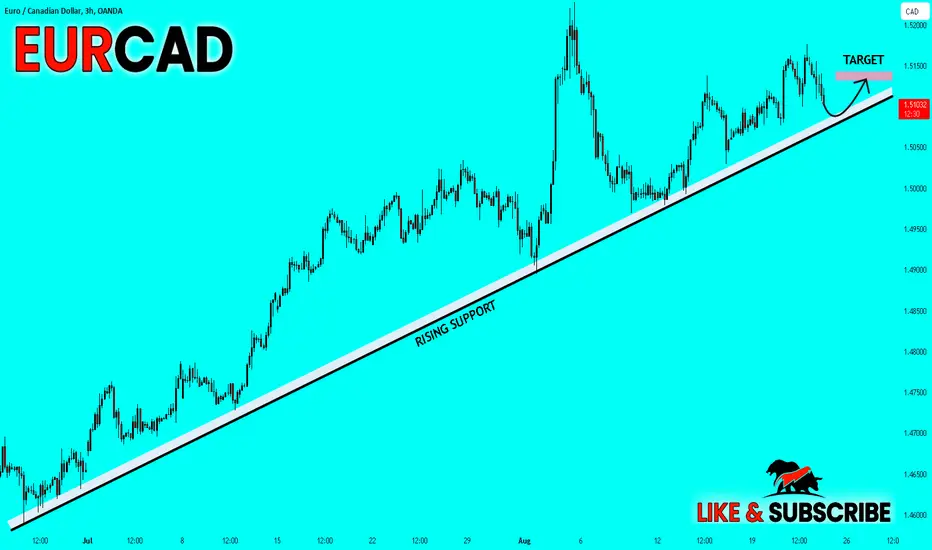
EUR_CAD LONG FROM RISING SUPPORT|
✅EUR_CAD is trading along the rising support
And as the pair will soon retest it
I am expecting the price to go up
To retest the supply levels above at 1.5138
LONG🚀
✅Like and subscribe to never miss a new idea!✅
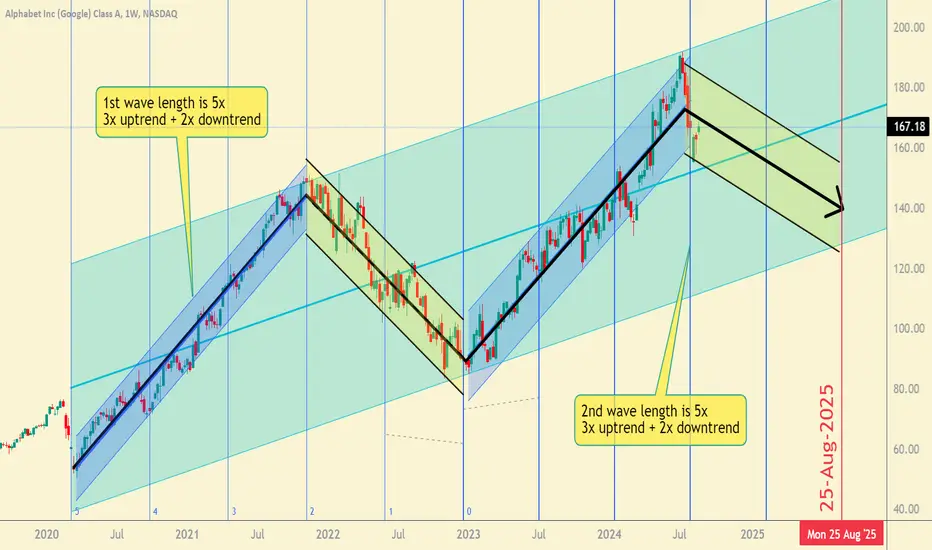
GOOG Analysis: Short Opportunity on the Horizon?Hello Traders,
I'm sharing my analysis for GOOG, breaking it down in the simplest way possible.
Wave Patterns:
The previous upward trend lasted 3x as long as the recent downtrend, which was 2x. By dividing the last uptrend into three equal periods (3x), I projected the future downtrend (2x) to mirror the previous wave structure (5x total: 3x uptrend and 2x downtrend). Based on this, I expect the downtrend that began on July 8, 2024, to potentially conclude around August 25, 2025.
Regression Channel:
I've drawn the main regression channel on the weekly chart. GOOG's price recently bounced from the channel's upper deviation line, dropping from 190 to 155, which is near the channel's middle line. I anticipate it could reach 175 before continuing downward, forming a new downtrend.
Conclusion:
Given these observations, I see a promising short opportunity, targeting the channel's lower deviation at 127.
Let's keep a close watch on this setup!
NASDAQ:GOOG
AMD Rose 20% in Two Weeks. Here Is What Its Chart ShowsAdvanced Micro Devices NASDAQ:AMD has gained some 20% in the past two weeks, rising in part on news of plans to buy privately held server maker ZT Systems for $4.9 billion. Where does technical analysis say the stock might go from here?
The ZT acquisition, which AMD announced on Monday, appears to be all about keeping up with Wall Street darling Nvidia NASDAQ:NVDA in the hot area of generative artificial intelligence, or “AI.”
Chips designed by firms like AMD and NVDA perform all of the calculations that make generative AI possible. They are the brains of a network that stitches a multitude of servers together inside a data center.
AMD is buying ZT for its expertise in this space, paying 75% cash and 25% stock in a deal the company expects to close next year.
The company said in a statement announcing the deal that it plans to divest the part of ZT that manufactures servers, which is currently ZT’s primary revenue-producing business. AMD appears to just want ZT’s AI people.
Now, AMD seems unlikely to catch Nvidia any time soon in the data center/cloud/AI race. But the ZT deal could help the company remain No. 2 in the space, biding its time and staying relevant and competitive.
AMD has already come a long way since Lisa Su took over as president and CEO in 2014 (and as board chair in 2022).
First it was PCs and CPUs, as AMD over time stole market share from once-dominant Intel $NASDAQ:INTC. Next AMD focused on gaming, GPUs and the data center.
Now the company is taking aim at generative AI, once again doggedly pursuing an industry giant (NVDA) that has a big lead -- and an even bigger reputation. The game afoot only grows more complex, and the technology more advanced as time goes on.
AMD’s Fundamentals
As for fundamentals, AMD still has two months until it reports results for the current quarter in late October.
Last month, the company posted second-quarter earnings that beat the Street on both the top and adjusted bottom lines, with 9% year-over-year sales growth.
For the current quarter, the Street currently expects to see 32% year-on-year earnings growth and 16% revenue gains. If achieved, the results could represent AMD’s hottest quarter for sales growth since 2022, as well as its best earnings growth in even longer than that.
Of course, AMD’s data center will have to lead if that’s going to happen, and Wall Street would like to see the company’s gap with Nvidia close just a bit among the firm’s higher-tech chips.
AMD’s Technicals
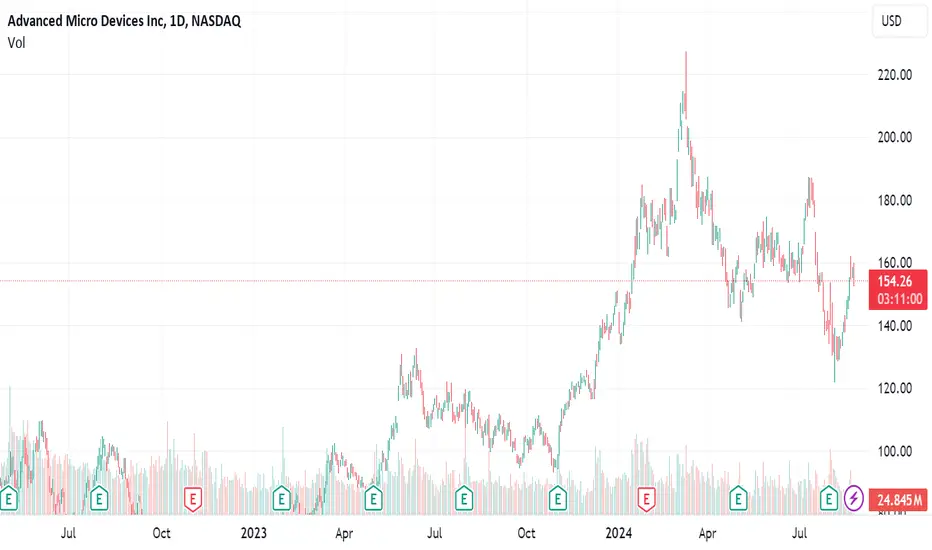
In the meantime, what might AMD’s chart tell us? Let’s take a look at where things stood as of Tuesday:
The chart above shows a so-called “falling wedge” pattern, which historically denotes a bullish reversal.
This pattern began back in March and continues to the present. Readers will also note that AMD has just retaken its 50-Day Simple Moving Average (the blue line in the chart above) and is now trying to retake its 200-day Simple Moving Average (the red line) as well. That makes the 200-Day SMA the stock’s current pivot point -- $156.78 as of Tuesday.
In support of this set-up, AMD has a Relative Strength Index reading of 60, as denoted by the gray line above. That’s strong but not technically overbought, and is still rising in the chart above.
We also have a Daily Moving Average Convergence/Divergence indicator (MACD) where the histogram of AMD’s 9-Day Exponential Moving Average (or “EMA,” denoted by the blue bars at the bottom of the chart above) is already in positive territory.
Meanwhile, AMD’s 12-day EMA (the black line above) has already crossed over the 26-Day EMA (the gold line). This crossover is typically a bullish sign, and would mean even more if the two averages were already in positive territory to go along with the stock’s positive 9-Day EMA.
That's not very far from happening. Perhaps a push above the 200-Day SMA would bring in some capital if portfolio managers felt forced to increase their exposure.
(Full disclosure: Moomoo Markets Commentator Stephen Guilfoyle was long both AMD and NVDA at the time of writing this column.)
This article discusses technical analysis, other approaches, including fundamental analysis, may offer very different views. The examples provided are for illustrative purposes only and are not intended to be reflective of the results you can expect to achieve. Specific security charts used are for illustrative purposes only and are not a recommendation, offer to sell, or a solicitation of an offer to buy any security. Past investment performance does not indicate or guarantee future success. Returns will vary, and all investments carry risks, including loss of principal. This content is also not a research report and is not intended to serve as the basis for any investment decision. The information contained in this article does not purport to be a complete description of the securities, markets, or developments referred to in this material. Moomoo and its affiliates make no representation or warranty as to the article's adequacy, completeness, accuracy or timeliness for any particular purpose of the above content. Furthermore, there is no guarantee that any statements, estimates, price targets, opinions or forecasts provided herein will prove to be correct. Moomoo is a financial information and trading app offered by Moomoo Technologies Inc. In the U.S., investment products and services on Moomoo are offered by Moomoo Financial Inc., Member FINRA/SIPC.
TradingView is an independent third party not affiliated with Moomoo Financial Inc., Moomoo Technologies Inc., or its affiliates. Moomoo Financial Inc. and its affiliates do not endorse, represent or warrant the completeness and accuracy of the data and information available on the TradingView platform and are not responsible for any services provided by the third-party platform.
Nvidia Q2 2024 Earnings PreviewAI Juggernaut Nvidia’s highly anticipated Q2 2024 earnings report is just one week away, scheduled for release after the market closes on Thursday, 29 August, at 6.20 am (AEST).
Q2 performance expectations
Revenue: $28.544 billion
Revenue growth: 211.31% year-on-year (YoY)
Earnings per share (EPS): $0.64.
Highlights of the previous quarter
Expectations are high for Nvidia’s Q2 earnings, given the company’s leadership in several key growth markets. Over the past year, Nvidia has experienced significant demand across various end markets, driven primarily by data centres and gaming.
In data centres, the adoption of AI and machine learning has propelled strong sales of Nvidia’s specialised GPUs and networking products. Additionally, the company has benefited from shifting enterprise workloads to the cloud. NVidia’s gaming segment continues to thrive, supported by the rise of eSports, game streaming services, and blockbuster game releases optimised for NVIDIA hardware.
What to expect
Nvidia’s data centre segment, which includes sales of GPUs, networking gear, and AI software, is expected to grow further as major hyperscale customers like Amazon AWS, Microsoft Azure, and Alphabet GCP increasingly adopt Nvidia chips for AI workloads.
Ongoing demand for Nvidia’s latest GPUs for gaming and creative applications is anticipated to remain a key driver of revenue growth.
Nvidia’s automotive computing platforms are gaining traction with more electric and autonomous vehicle manufacturers, further boosting demand for the company’s chips. Additionally, the company’s Omniverse 3D simulation platform has seen triple-digit customer growth over the past year, indicating potential future gains in enterprise software.
Potential challenges to watch for
Supply chain constraints: while improving, may still limit upside potential. If foundry and component shortages persist, Nvidia might struggle to meet elevated demand, which could disappoint investors.
A slowdown in the PC market: due to challenging macroeconomic conditions may weaken performance in the graphics segment, dampening overall earnings growth.
Economic uncertainty: could also curb business spending if conditions deteriorate, disproportionately affecting Nvidia's data centre and enterprise segments.
Increasing competition: from companies like AMD and Intel, which are also investing heavily in AI-focused chips, along with big tech and automotive firms developing their own AI chips, could potentially reduce demand for Nvidia’s offerings.
Despite these risks, Wall Street remains bullish on Nvidia stock heading into the Q2 earnings report. Investors are focused on Nvidia’s long-term potential in AI, high-performance computing, autonomous vehicles, and the metaverse. Success in these areas is expected to drive share price momentum post-earnings.
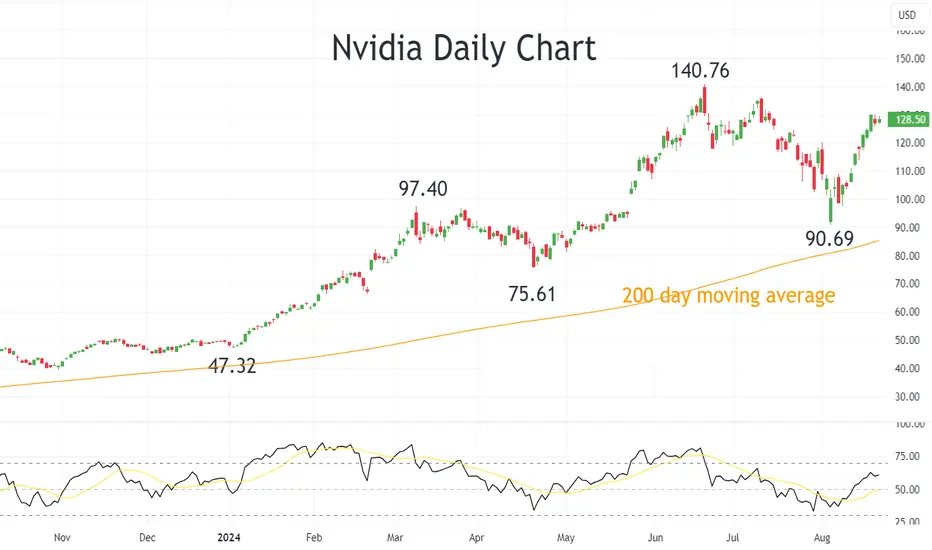
Nvidia Technical Analysis
Nvidia’s share price is up over 159% year-to-date and has almost fully recovered its 35% drop from June to August. The recovery puts Nvidia’s all-time high of $140.76 firmly in focus in the lead-up to next week's earnings, with a sustained break above here opening the way for a push towards $150. On the downside, there is a strong band of support at $100 before the $90.69 low of early August. Not far below here resides the 200-day moving average at $85.26.
Gold at a Crossroads: Breakout or Sharp Correction Ahead for XAU1. Daily Time Frame (1D)
Channel Formation: The daily chart shows an ascending channel, indicating a consistent upward trend. This structure suggests that gold has been gradually gaining strength over time, with higher highs and higher lows.
Key Levels:
2,507.90: Price is hovering near this key resistance, close to the upper boundary of the channel. This is also near a 15M Liquidity Zone (LQZ), making it a potential reversal point if the price cannot break through decisively.
2,500.953 and 2,477.895: These are marked as 4H Liquidity Zones (LQZ), providing support within the current channel. A drop below these levels could signal a deeper pullback towards the Daily LQZ at 2,352.710.
2. 4-Hour Time Frame (4H)
Continuation Pattern: The 4H chart mirrors the ascending channel visible on the daily chart. The price is currently testing the resistance area, and there is potential for a pullback if it fails to break above.
Liquidity Zones:
2,507.180: This is a 15-minute LQZ, very close to the current price.
2,500.953: A more significant 4H LQZ is just below the 15M LQZ. The confluence of these zones adds weight to the potential for a reversal or a strong move if this area is breached.
3. 15-Minute Time Frame (15M)
Rejection and Potential Correction: On the 15-minute chart, there is a small rising wedge pattern that appears to be breaking down, indicating a potential short-term reversal. The price is rejecting the upper boundary of the wedge, suggesting that a correction could follow.
Trade Opportunity: A break below 2,500.953 (15M LQZ) could lead to a sharper move down towards 2,477.895 (4H LQZ). This aligns with the larger time frame structures, adding credibility to this potential move.
4. 5-Minute Time Frame (5M)
Immediate Reaction: The 5-minute chart shows a rejection of the upper boundary of the ascending channel and a possible small head and shoulders pattern developing. This further supports the bearish outlook in the very short term.
Potential Targets: If the pattern plays out, a move towards 2,500.953 and below would align with the bearish scenarios on the higher time frames.
Conclusion
Short-Term Bearish Bias: Across all time frames, there's a consistent pattern of the price rejecting key resistance areas, particularly near 2,507.90 (15M LQZ) and 2,500.953 (4H LQZ). This suggests that the price may correct downward before any further attempts to break higher.
Watch for Confirmations: If the price breaks below the 4H LQZ at 2,477.895, it could indicate a deeper pullback, possibly towards the daily LQZ at 2,352.710. However, a strong bounce from the current support levels could resume the upward trend.
This analysis aligns with the multi-touch confirmation approachand the rule of three, which emphasizes the importance of repeated touches on a trendline or key level before confirming a breakout or reversal.

USDJPY 20m Short-term Short Analysis
Strategy preconditions
USDJPY 20m chart, the downtrend strength has not completely depleted, we can still take some final Short trades before potential ranging or reverse begins.
There are 2 Short strategies to go about, the first one is more risky while the second is safer and more rewarding.
1. Directly enter Short around the 20m resistance level 145.544, as the blue prediction shows. SL can be set below the "Caution level", TP at 144.520, do not be greedy for this trade, since the market can reverse quickly. I sense already that the momentum starts slowing down. This trade is more risky because we'll ignore additional LTF downward BOS confirmation, instead, we take Short directly when the 20m resistance is reached.
2. if we see that before the market reaches the 20m resistance, it has formed a relatively more bumpy and slower pattern shown by the purple prediction, we then wait for a clean LTF downward BOS confirmation and pullback prior to our Short entry. SL can be set above the entry area, and TP in this case can be more greedy at 1H level 144.147, which seems pretty clean in 20m chart as well.
Cautions
For the second strategy, if the "Caution level" is reached before any LTF downward BOS confirmation has formed, we must abandon this strategy, and start re-analysing the whole thing. In that case, I think the market will start ranging.
For the first strategy, if the "Caution level" is reached first, then it is a loss.
I know that the downtrend on 20m chart seems promising, but do NOT be greedy and think about some daily TP far below. We only take profit that we do understand.

Is the USD selloff too aggressive? Bond yields suggest soTraders continue to sell the US dollar in anticipation of a dovish speech from Jerome Powell on Friday. To the point where we wonder if this could be a case off "sell the rumour, buy the fact". Matt Simpson takes a quick look at the USD dollar index and bond yields.

BLUE DART EXPRESS | 100% returns | Breakout of 9-year resistanceBLUE DART EXPRESS
Monthly time frame
Breakout from 9-year white resistance trend line
Breakout from perfect cup & handle pattern
Stock riding above 20-, 50- & 200-month moving averages
RSI > 60, indicating bullish momentum
MACD crossover done and is above the 0 line, indicating bullish momentum
Volumes have been good since Apr 2020, implies heavy buying
Weekly time frame
Retest of the white resistance trend line almost complete
Stock riding above 20-, 50- & 200-week moving averages
RSI > 60, indicating bullish momentum
MACD above the 0 line, indicating bullish momentum
Daily time frame
Stock consolidating along the white resistance trend line
Stock has made a higher low (Dow theory)
Stock price converging along 20- & 50- day moving averages, breakout possible
RSI > 50, indicating bullish momentum
MACD is about to cross the 0 line, indicating momentum build up
Conclusion
Entry: 8,000
Stop Loss: 6,700
Target 1: 9,600
Target 2: 12,150
Target 3: 16,275
Fundamentals
ROCE = 19.2% {Ideal > 15}
ROE = 22.7% {Ideal > 15}
Stock PE (65) = Industry PE (65) {Stock not overvalued}
Int Coverage = 5.81 {Ideal > 2}
CF Operations / EBIT = 1.83 {Ideal > 1}
Debt to equity = 0.78 {Ideal value < 1}
Promoter stake has remained consistent over the years > 75%

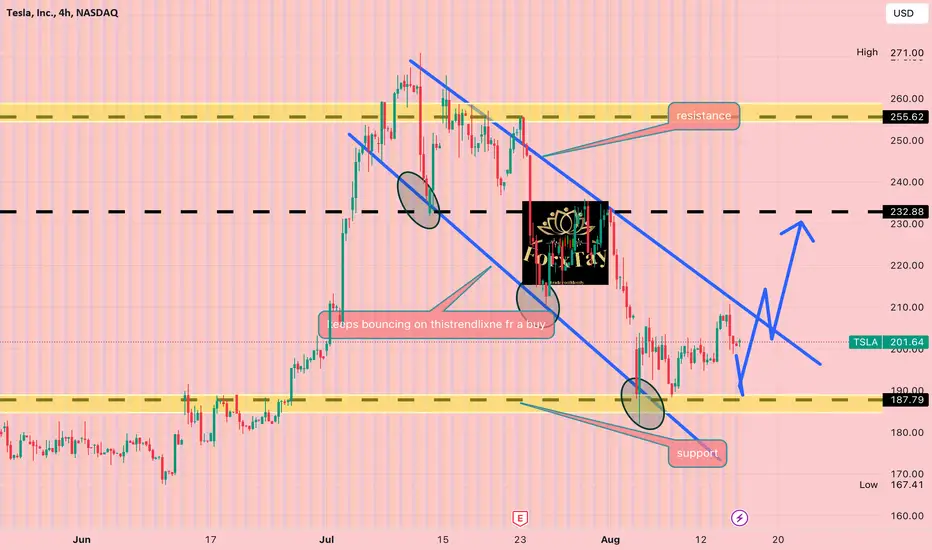
TESLA SUPERCHARGER STATIONS THINKING OF GOING BIG''TESLA is building the unique destination for Tesla owners, including a two story restaurant with a seating for over 200 diners and separate theater area that accommodates up to 77 guest" TESLA Canada said and Tesla hs recently published its first job opening for the diner. Technically this is in a rising wedge and I am long from the current support. BUYS ARE COMING
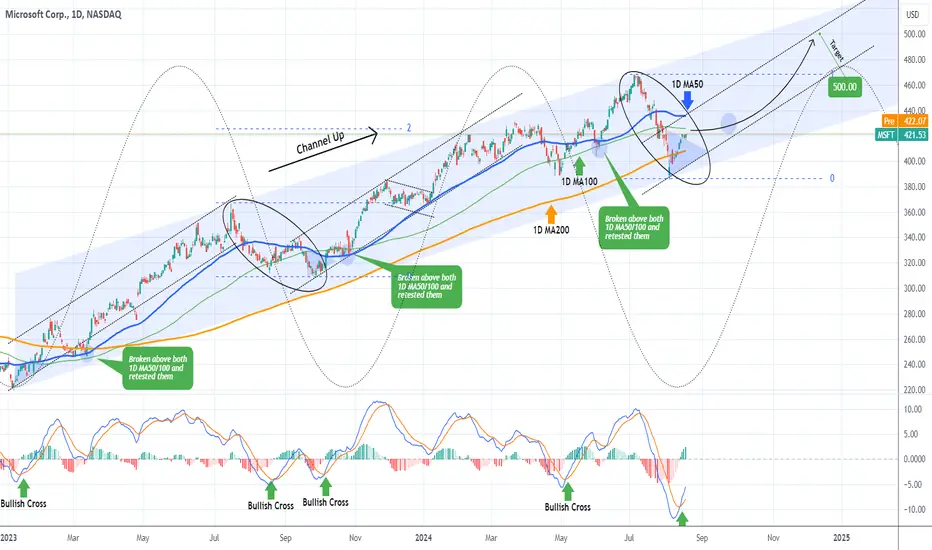
MICROSOFT Targeting $500 before the end of the year.Microsoft (MSFT) has made a new long-term bottom and recovered almost all of August's losses. That bottom is technically the Higher Low of the 20-month Channel Up that started in January 2023.
The price is currently consolidating below the 1D MA100 (green trend-line) and if broken, it will confirm the new Bullish Leg. In the previous (2) Bullish Legs of this Channel Up, the price tends to re-test the 1D MA50/100 cluster to confirm it as the new long-term Support after the break-out, so expect that to take place at some point.
Having though formed a new 1D MACD Bullish Cross, we can assume that this is already a safe level to buy for the long-term, as every Bullish Cross below 0.0 has technically been a confirmed buy level. Our Target for the end of the year is $500, which is still technically a 'modest' one as it is considerably below the 2.0 Fibonacci extension, which priced the March Higher High.
-------------------------------------------------------------------------------
** Please LIKE 👍, FOLLOW ✅, SHARE 🙌 and COMMENT ✍ if you enjoy this idea! Also share your ideas and charts in the comments section below! This is best way to keep it relevant, support us, keep the content here free and allow the idea to reach as many people as possible. **
-------------------------------------------------------------------------------
💸💸💸💸💸💸
👇 👇 👇 👇 👇 👇
Bitcoin: Play Support/Resistance Or Stay Away.Bitcoin has established a higher low off the 56K support area as anticipated in my previous article. From here a test of the 62 to 64K resistance area is within reason over the coming week. No matter what information you consume, the price action at this time is clear: Bitcoin is still INSIDE a broad consolidation. This means UNTIL it can demonstrate a breakout one way or the other with conviction, it is best to anticipate the consolidation to continue. This means paying attention to action around notable support/resistance levels that are relevant to your strategy time frame.
In the markets, there is a tendency for "history to repeat itself". I understand this to mean the human behavioral element behind the price action. I mention this because if you notice, the low 64K area has numerous repetitive reactions over the previous few months (see arrow). The reason why does not matter, what matters is that there is a particular kind of price action around a level that can be anticipated in the near future. How you utilize this information will depend on your strategy specifically. For example, if you are looking for day trades you may not use it the same way as someone looking for swing trades, etc.
Another aspect to keep in mind is the fact that we are now entering into the SLOWEST time of the year in terms of participation and volume. Weeks 3 and 4 of August are usually slow, erratic and very tough to navigate particularly on smaller time frames. Volume usually returns back to normal by the first week of October. This is NOT precise, but a tendency that I have observed over the years. This means it is usually better to be more selective about setups, take more time off and/or paper trade more. Low volume does not imply bearishness per se, but it can increase the chances of slow grinds either way, lack of follow through, price spikes that fake out, etc.
Play the support/resistance or don't play at all. When operating on smaller time frames you can consider this situation from both sides. Look for confirmation of momentum continuation patterns on the long side until price reaches the 62 to 64K area. From there look for confirmations of bearish reversals. "Confirmations" is synonymous with "signals" generated by my Trade Scanner Pro.
When markets consolidate like this, technical analysis can help immensely when it comes to evaluating potential, risk and probability. I repeat this often, this is NOT about forecasting the future, it is about using previous information to identify potential and measuring the associated risk. This is what CONTEXT is all about and where trade ideas begin. To have chance of winning you must be able to anticipate while at the same time account for the possibility of being wrong. This is NOT about hunches, feelings, opinions or logic. It is all about being a good "listener" of the market because it is ALWAYS right.
Thank you for considering my analysis and perspective.
Lessons From my Losses August 19th 2024 Today the price action again was not ideal. I talk about not getting into trades based on FOMO and overtrading, which I did today. I am a little upset with myself as I was not disciplined. I showed a trade with great confirmation on the 15-minute chart I missed. Let me know what you guys think in the comments and tell me about how your trading went today!

Gold futures could hit $3k as this pattern emerges Textbook Cup & Handle pattern (yellow) is in progress.
The target for this pattern is located at the depth of the "Cup" added to the breakout point.
So, the gold futures price eyes $3,000.

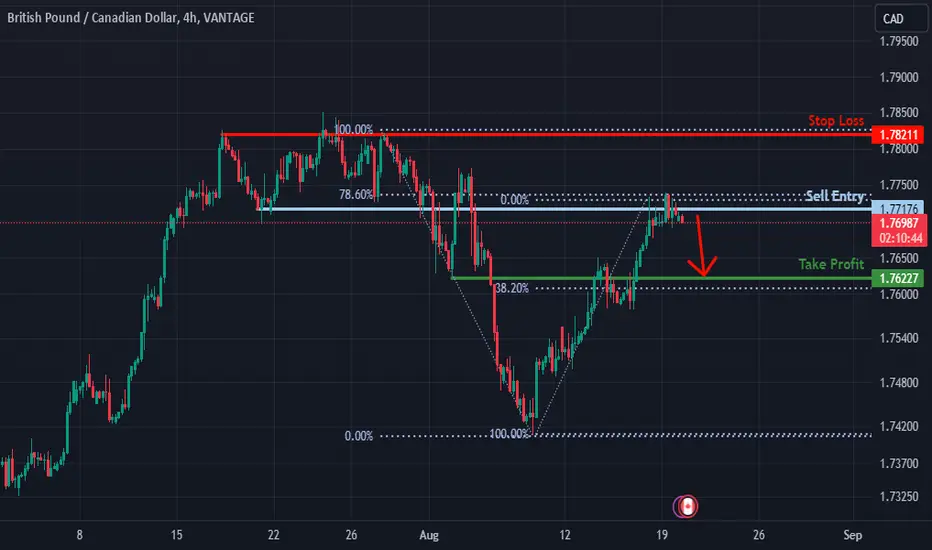
Bearish reversal?GBP/CAD is reacting off the resistance level which is a pullback resistance that lines up with the 78.6% Fibonacci retracement and could reverse from this level to our take profit.
Entry: 1.77176
Why we like it:
There is a pullback resistance level which aligns with the 78.6% Fibonacci retracement.
Stop loss: 1.78211
Why we like it:
There is a pullback resistance level.
Take profit: 1.76227
Why we like it:
There is an overlap support level which aligns with the 38.2% Fibonacci retracement.
Please be advised that the information presented on TradingView is provided to Vantage (‘Vantage Global Limited’, ‘we’) by a third-party provider (‘Everest Fortune Group’). Please be reminded that you are solely responsible for the trading decisions on your account. There is a very high degree of risk involved in trading. Any information and/or content is intended entirely for research, educational and informational purposes only and does not constitute investment or consultation advice or investment strategy. The information is not tailored to the investment needs of any specific person and therefore does not involve a consideration of any of the investment objectives, financial situation or needs of any viewer that may receive it. Kindly also note that past performance is not a reliable indicator of future results. Actual results may differ materially from those anticipated in forward-looking or past performance statements. We assume no liability as to the accuracy or completeness of any of the information and/or content provided herein and the Company cannot be held responsible for any omission, mistake nor for any loss or damage including without limitation to any loss of profit which may arise from reliance on any information supplied by Everest Fortune Group.