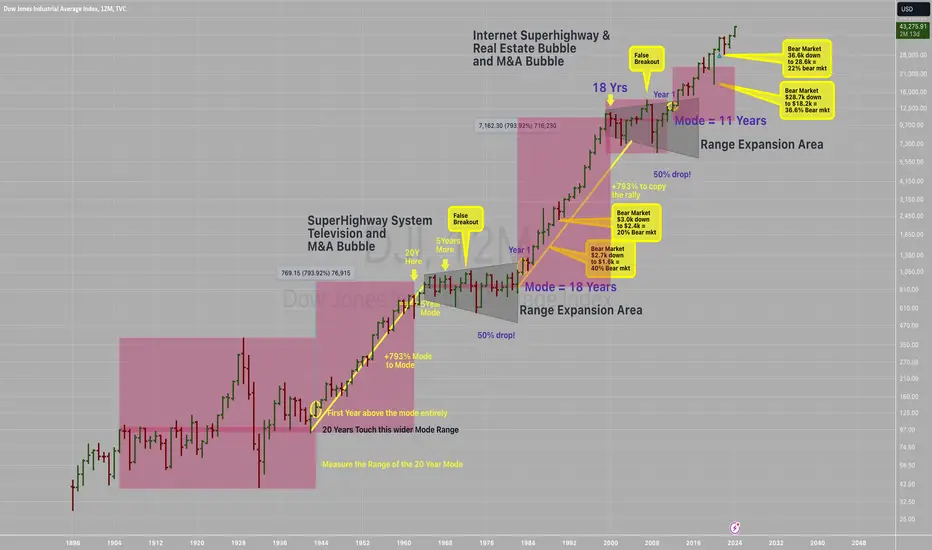
Update to Dow Jones Industrials Time At Mode Back in 2015 I had published a chart with annual data for the Dow Jones Industrials. I will provide a link at the bottom.
The research for this patterning is something I did myself by hand using pencil and paper back in the 1980's. These patterns show up in all time frames.
There is plenty of room to enhance the research on this technique and a group of us gather in the chat rooms here at TradingView to discuss new trades that set up and point out when trades expire.
Notice how these two grey boxes (which are both 50% drops in price) that expand wider in time from the 1960's to the 1980's and the 2000-2010's had a multi-year trend, followed by a monster crash (1987 was 40% and 2000 was 37%) and then just two+ years later there was a secondary bear market of 20% in 1990 and 22% in 2022. Keep in mind this is just for the DJ:DJI and not the Nasdaq Composite or S&P500 which were greater corrections.
The 11-year time frame of the 1999-2011 pattern allows for an 11-year rally from 2012 (which was year 1 of the 11-year rally) shows that time expired. As you can see from the 1943-1962 trend, a smaller 5-year mode formed at the end of the 20 year trend and then the market peaked in 1972-1973 when time expired for the second, smaller mode.
I had to reconstruct this chart after the data for the previous chart changed symbol. See the link below to see the original.
I look forward to your additional research onto this pattern and its implications to the idea that we are in a similar period to 1993-1994 with rally years of 1996, 1997, 1998, 1999 and 2000 ahead of us.
All the best,
Tim
October 19, 2024 3:31PM EST
Community ideas
Tracking Inflation with this Ratio - Crude Oil vs Gold RatioThe Fed is using this Crude Oil vs Gold ratio in tracking inflation.
The one in white is the inflation and the one in yellow is the Crude Oil vs Gold ratio.
We saw that when inflation peaked at 9% in June 2022, so did this ratio.
Although we recently saw a cut in interest rates, the yields are now moving higher, and gold has maintained its high point.
This makes us wonder: will inflation move toward the 2% target, or is it still at risk of rising further?
Micro WTI Crude Oil Futures & Options
Ticker: MCL
Minimum fluctuation:
0.01 per barrel = $1.00
Disclaimer:
• What presented here is not a recommendation, please consult your licensed broker.
• Our mission is to create lateral thinking skills for every investor and trader, knowing when to take a calculated risk with market uncertainty and a bolder risk when opportunity arises.
CME Real-time Market Data help identify trading set-ups in real-time and express my market views. If you have futures in your trading portfolio, you can check out on CME Group data plans available that suit your trading needs tradingview.sweetlogin.com

Bitcoin Breakout or Pullback Zone Before Heading Higher? In this video we examine the current Bitcoin chart at resistance.
Most likely, we retrace here for a bit and then push higher into the next resistance zone of around $70k and possibly to retest the previous ATH zone @72k - 74k.
Lots of sell pressure at the previous ATH which can also be seen on the Total Market Cap, using our Order Block Detector.
Not much happening now and until we can find the money flow and volume to push up.
Many people likely waiting for the election on Nov 5th, which coincides with the market cycle low according to our Market Cycle models (based on Hurst's research).
Let me know your thoughts below, and please like the video.
- Brett

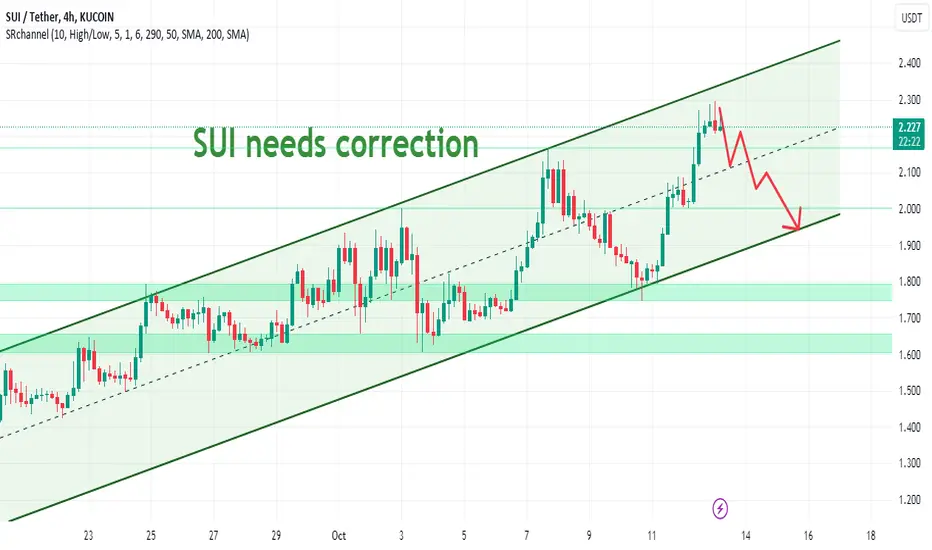
SUI needs small correction to continue again...Currently, SUI is moving near the Resistance lines and the Potential Reversal Zone; as you see in 4h channel. SUI has been increase about 360% in two months. It seems that according to the good news that has come for the Sui project, the increase of the SUI token may continue, but it will experience a correction to increase again.
I expect SUI correction can be 20% - 30%. Follow the chart.
Enter: 2.25
TP1: 2.15
TP2: 2.0
TP3: 1.95
SL: 2.40
** Please follow your strategy and updates; this is just my Idea, and I will gladly see your ideas in this post.
Traders could veer towards the yen with risk events loomingIt is no coincidence that VIX futures have been creeping higher in recent weeks despite Wall Street hitting record highs, as traders are presumably hedging downside risk as we approach the US election. And that means it may not take much to spook traders out of bullish bets with markets at frothy levels, and that could see the yen strengthen as a safety play. Matt Simpson takes a technical look at yen pairs of interest.

6 stocks to add to your portfolio for huge upward potentialI believe at least 5 stocks from these 6 stocks will offer more than 100% return in 2 to 3 years. Regarding TSLA I will be waiting for better entries.
Disclaimer: Not a financial advice. Do your own analysis.

CANE and WEAT LONGboth broken long term trendlines to the upside.
Additionally, CANE is in season. MASSIVE inverse HS on CANE with 275% upside potential 2-5 yrs
Please watch video for a more detailed explanation

EURAUD FORECASTThis is the pair which I look with a close eye today, I like how the structure are developing, all things has confirmed so let's look how this pair will move. In this video I covered important scenarios this pair may develop.

BUY NZDJPY - trade explained in detailTrader Tom, a technical analyst with over 15 years’ experience, explains his trade idea using price action and a top down approach. This is one of many trades so if you would like to see more then please follow us and hit the boost button.
We are proud to be an OFFICIAL Trading View partner so please support the channel by using the link below and unleash the power of trading view today!
tradingview.sweetlogin.com

Event-Driven Strategy using Bitcoin Weekly FuturesCME: Bitcoin Weekly Futures ( MIL:BFF )
On Thursday, October 10th, The Bureau of Labor Statistics (BLS) reported that the Consumer Price Index for All Urban Consumers (CPI-U) increased 0.2% on a seasonally adjusted basis, the same increase as in August and July. Over the last 12 months, the all-items index increased 2.4% before seasonal adjustment.
However, the headline CPI came in ahead of the 0.1% monthly gain and 2.3% year-over-year rate expected by analysts polled by Dow Jones. As a result, both the US equity markets and cryptocurrencies slipped on Thursday.
While the year-over-year headline CPI is the lowest since February 2021, digging into the category data reveals sticky inflation. Noticeable data includes:
• Food: +2.3% YoY. However, Eggs jumped 39.6%, while “nonconcentrated juices + soft drinks” category was up 15.3%.
• Motor vehicle insurance: +16.3% YoY
• Video discs + other media: +11.6% YoY
• Admission to sporting events: +10.3% YoY
• Health insurance: +7.5% YoY
High prices affect day-to-day life and contradict the notion of low inflation. The fact is that prices have gone up a lot in the past few years. Even though they rise more slowly now, the absolute price levels remain high. Examples from my personal experiences:
• The $9 price tag for 1-1/2 dozen eggs caused me to reduce purchase to 1-dozon for $5. I still remember the good old days of 99-cent per dozen large eggs.
• I watched a WNBC match featuring Indianapolis Fever and Catlin Clark in the summer. A seat close by the basketball court costs $200. Adding up hotel stay, fuel cost and a $50 T-shirt, this felt like a vacation budget.
• A recent doctor’s visit required copayment of $100. Six months ago, the same clinic charged $75. This is a 33.3% increase.
Event to Watch: The Next Fed Rate Decision
Retrospectively, it appears that the Federal Reserve acted a bit too aggressively with the supersized 50-bp rate cut in September. With the sticky inflation data, the Fed’s next move on November 7th is uncertain.
According to CME Group’s FedWatch Tool, as of October 11th, the futures market expects the Fed to cut 25 basis points at the next FOMC meeting, with an 88.4% probability. Gone are the odds of another supersized cut. Meanwhile, the probability of a no-cut increases to 11.6%.
www.cmegroup.com
Driven by the lowered expectation on Fed rate cuts, on Thursday, the Dow Jones Industrial Average closed down 0.14% to 42,454, and the S&P 500 slipped 0.21% to settle at 5,780. Meanwhile, the Nasdaq composite shaved up 10 points (-0.05%) and closed at 18,282.
The cryptocurrency market has a more pronounced reaction. Bitcoin gave up the psychologically important $60K level, lost $1,442 (or -2.36%) and settled at $59,564. Meanwhile, ETHER gave up $57.2 (or -2.38%) and closed at $2,356.
However, market sentiments are still very bullish. By Friday, strong Q3 earnings reported by JPMorgan and Well Fargo helped push the stock market up again, with the S&P 500 breaking 5,800 and making its 45th all-time high in 2024.
In my opinion, Bitcoin futures would be a good instrument for event-driven trades on the Fed rate decisions, given its higher volatility.
Introducing Bitcoin Friday Futures
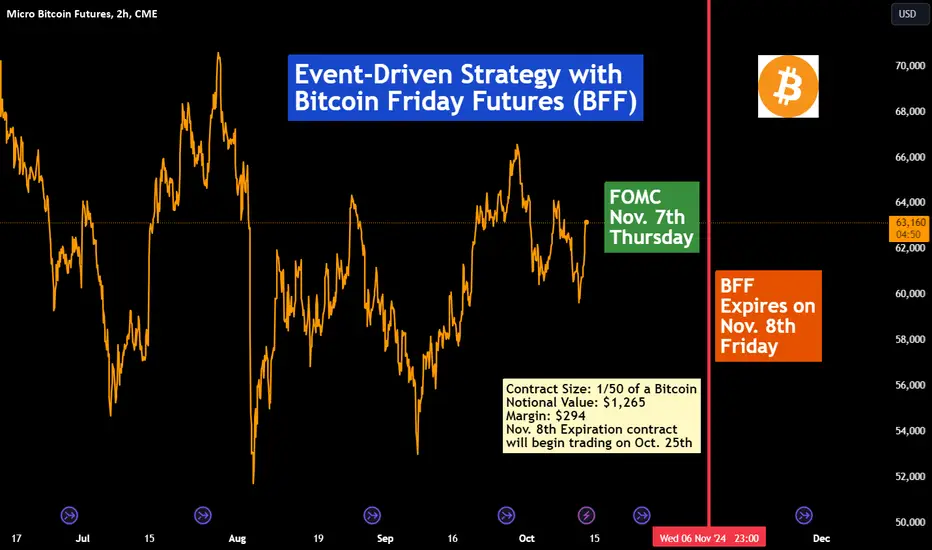
Bitcoin Friday futures ( MIL:BFF ) are weekly, USD-settled contracts that offer a more precise way to gain bitcoin exposure and manage risk relating to such exposure. Each contract represents 1/50 of a bitcoin, ensuring capital efficiency and accessibility. The contract size of BFF is 1/5 of that of Micro Bitcoin Futures ( NYSE:MBC ), which is 1/10 of a Bitcoin.
These shorter-dated contracts expire and settle to the CME CF Bitcoin Reference Rate New York Variant (BRRNY) every Friday at 4:00 p.m. New York time and may track the spot price of bitcoin more closely.
Futures contracts traditionally expire on a monthly or quarterly basis, such as BTC and MBT, whereas BFF will settle weekly every Friday. Because of this shorter duration, BFF will have a shorter cost of carry resulting in a price that may more closely track bitcoin’s spot price.
Bitcoin futures price = bitcoin spot price + financing costs to carry the position to expiration
Two consecutive Fridays will be listed at any time. A new BFF contract will be listed every Thursday at 6:00 p.m. New York time such that market participants will be able to trade the nearest Friday plus the next two Fridays giving traders the choice to hold or not hold exposure over the weekend depending on their preference.
Trade Setup using BFF for the FOMC Event
The Federal Open Market Committee will release its next rate decision at 2:00 PM Eastern Time on Thursday, November 7th.
The BFF contract expiring Friday, November 8th will begin trading at 6:00 PM Eastern Time on Thursday, October 24th.
A trade could be set up on or after October 24th, and closed by November 7th or 8th, after the market reacts to the Fed decision and before contract expiration.
While the market overwhelmingly expects the Fed to cut 25 bps, new data could change the expectations dramatically in the next four weeks. The most important data points are:
• BLS Nonfarmed Payroll and Unemployment, November 1st
• US Presidential Election, November 5th
Separately, the next BLS CPI release will be on November 13th, after the BFF November 8th contract. We could use the BFF November 15th contract to trade on that event.
As an educational writeup, I do not offer a personal view on the future direction of BFF prices. With basic information provided here, traders could apply their own view to set up a trade on BFF.
Generally, if the Fed cuts rates in December, stocks and cryptocurrencies could get a lifting as lower rates reduce the cost of capital. Meanwhile, if the Fed pauses and decides on no-cuts, the uncertainty on interest rate trajectory could cause risk capital to fall.
Happy Trading.
Disclaimers
*Trade ideas cited above are for illustration only, as an integral part of a case study to demonstrate the fundamental concepts in risk management under the market scenarios being discussed. They shall not be construed as investment recommendations or advice. Nor are they used to promote any specific products, or services.
CME Real-time Market Data help identify trading set-ups and express my market views. If you have futures in your trading portfolio, you can check out on CME Group data plans available that suit your trading needs tradingview.sweetlogin.com
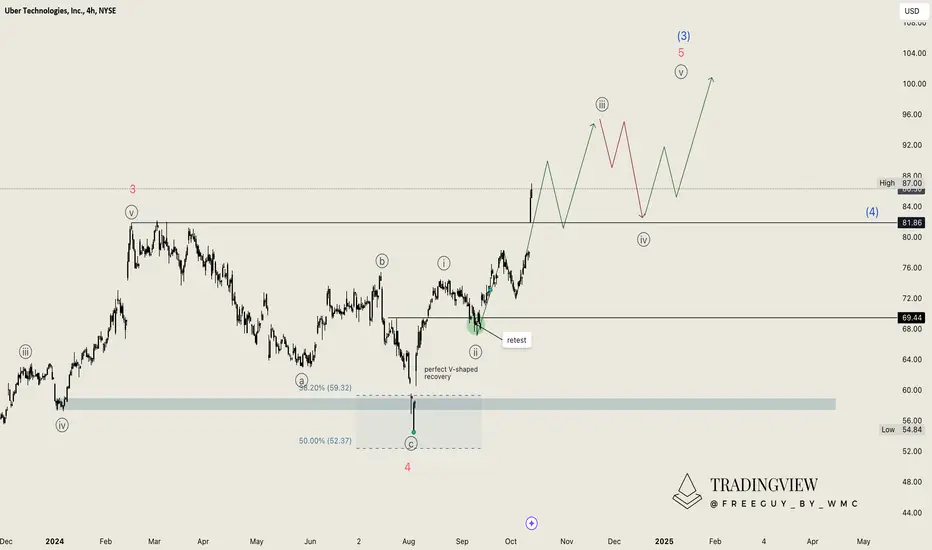
Uber (UBER): Missed the Rally? Here comes new opportunitiesIt's been a while since we last looked at Uber, and the stock has moved perfectly since then. Uber reacted exactly as expected to our desired area, but unfortunately, we didn’t buy any shares at the time. If you did, congratulations – this position is now up 60.8%!
Shares of rideshare companies Uber Technologies and Lyft surged on Friday, following Tesla's underwhelming Robotaxi reveal. Uber has shifted its focus away from developing autonomous vehicles and is instead concentrating on expanding its marketplace for riders and drivers. This shift has created a robust network effect, making it increasingly difficult for competitors to match Uber's scale, according to a recent report by Business Insider.
Uber’s asset-light business model, which doesn't involve owning or maintaining vehicles, has been financially successful, generating $1.7 billion in free cash flow in the second quarter. Now, Uber has reached a new all-time high, and if we look back at the chart, it's easy to see a clear and powerful pattern. After entering our desired area, Uber made a sharp V-shaped correction, followed by a key level retest. In a short period, NYSE:UBER turned bullish, marking a complete turnaround.
We will be closely watching Uber Technologies' upcoming earnings report, scheduled for October 31, 2024. After this event, we’ll update our chart and look for possible new opportunities.
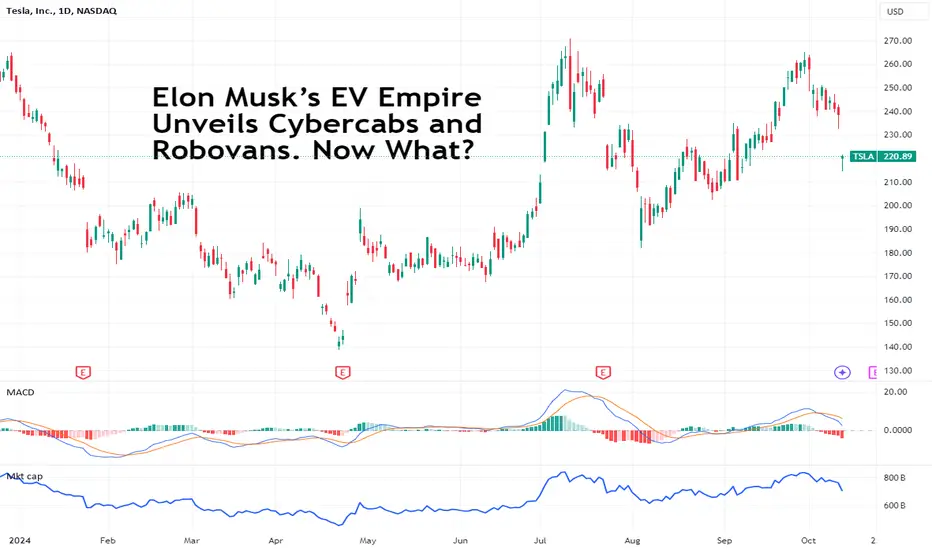
Elon Musk’s EV Empire Unveils Cybercabs and Robovans. Now What?Highly-anticipated Robotaxi event offered a glimpse into what Elon Musk touted as “the future” — a driverless almond-shaped Cybercab robotaxi with no steering wheel or pedals and a Robovan that can ferry up to 20 people (but looks like a giant sliding toaster ). Both are futuristic and flashy. But can they generate revenue and keep Tesla churning out profits? That’s the question investors were asking while they pressed hard on the “Sell TSLA shares” button.
Tesla (ticker: TSLA ) is introducing a new era. Years after it had released a new product (the Cybertruck in 2019), the electric-vehicle maker, towering over the EV space , is expanding its product suite with not one but two new sick wheels. Rolling up to the stage in one of them — a robotaxi called “Cybercab” — Elon Musk, Tesla’s chief executive, unveiled the driverless two-seater cab and an autonomous van conveniently called Robovan.
“You could fall asleep and wake up at your destination,” Musk said on stage after he arrived one hour late. “There’s no steering wheel or pedals so I hope this goes well.”
The other big reveal was a Robovan/Robobus that can pick up a total of 20 people at a time. The Robovan is especially odd-looking, which, according to Musk, is intentional. “We want to change the look of the roads,” said Musk. “The future should look like the future.”
The icing on the cake was a new version of Optimus — Tesla’s humanoid robot. In its latest form, Optimus was spotted pouring drinks at the venue and dancing in fish tanks while flexing jacked forearms.
Happening at the Warner Brothers movie set in Los Angeles, the hotly-awaited invite-only event had managed to sneak in 50 Cybercab prototypes and multiple humanoid robots.
Of the few details laid out around the business model — the Cybercab is going to cost less than $30,000 with an operating cost of 20 cents a mile. “We expect to be in production with the Cybercab … in probably — well, I tend to be a little optimistic with time frames — but in 2026. Before 2027,” Musk said.
How would that work? Musk is hoping that there will be millions of Cybercabs available to rent out from the owners through the Tesla app. “Your average passenger car is only used 10 hours a week,” he noted. “If they are autonomous they could be used five times more, maybe 10 times more.” Thus, it seems like Musk is betting on new owners looking to convert their vehicles into autonomous taxis, earning them a passive income.
But there’s a long way to go — this new way of transportation requires regulatory approval and regulators don’t exactly have a reputation for being open-minded to new ideas.
According to Elon Musk, Tesla’s future hinges on autonomous driving. Driverless vehicles are central to the continued growth and success of the EV maker. So much so that Musk has previously said that Tesla’s market cap could hit $30 trillion, or about 40 times the current valuation (or 10 times the market cap of Apple (ticker: AAPL ), the world's most expensive company .) For reference, the entire S&P 500 index is worth $50 trillion today.
Tesla’s market worth may skyrocket 40 times but it won’t be today. The neon-filled scene giving futuristic vibes and Musk touting the new products as game-changers didn’t inspire investors to rush in and shove their cash into Tesla shares.
Some key details were missing and that prompted investors to take a cautious stand. First off, from over 2 hours of livestreamed content , the presentation was just about 20 to 30 minutes and didn’t discuss anything about self-driving safety. No deep dives into the business model on the side of revenue or market share for driverless taxis. And with Musk’s broken promises — he had said that millions of robotaxis will be ferrying passengers in 2020 — investors went mild instead of wild.
First trades at the opening bell in New York on Friday saw Tesla shares drop more than 10%. Was the event mostly razzle-dazzle and lots of glam and glitz? Or was there any real substance behind?
Share your thoughts below!
Nvidia's Stellar Surge: A Reflection of AI's AscendanceNvidia's meteoric rise in recent months is a testament to the burgeoning artificial intelligence (AI) revolution. As tech giants race to integrate AI into their products and services, the demand for Nvidia's high-performance computing chips has skyrocketed. The company's stock has surged by an impressive 25% in the past month alone, and it's on the brink of breaking its all-time high.
Nvidia's dominance in the AI hardware market can be attributed to its cutting-edge graphics processing units (GPUs), which are ideally suited for the complex computations involved in AI tasks. These chips have proven to be indispensable for training and deploying large-scale AI models, such as those used in natural language processing, computer vision, and generative AI.
As tech earnings season approaches, investors are closely watching Nvidia's performance. The company's financial results will provide valuable insights into the strength of demand for its products and the overall health of the AI market. Analysts are anticipating a strong earnings report, fueled by continued growth in data center sales and increasing adoption of Nvidia's AI solutions.
One of the primary drivers of Nvidia's success has been the accelerated development of AI technologies by leading tech companies. Meta, Alphabet, Microsoft, Oracle, and OpenAI, among others, have been investing heavily in AI research and development. These companies are racing to introduce new AI-powered products and services, such as chatbots, virtual assistants, and generative AI tools. To support these initiatives, they require powerful hardware infrastructure, including Nvidia's GPUs.
The growing demand for AI chips has created a significant opportunity for Nvidia. The company has been expanding its manufacturing capacity and investing in research and development to maintain its technological edge. Additionally, Nvidia has been exploring new markets, such as autonomous vehicles and healthcare, where AI is expected to play a crucial role.
While Nvidia's future prospects appear promising, it's essential to acknowledge the potential risks and challenges that could impact the company's growth. These include intense competition from other chip manufacturers, fluctuations in the global semiconductor market, and the possibility of regulatory hurdles related to AI development.
Despite these risks, Nvidia's strong market position and the increasing importance of AI suggest that the company is well-positioned to capitalize on the ongoing technological revolution. As AI continues to transform industries and society as a whole, Nvidia's high-performance computing chips are likely to remain a critical component of the AI ecosystem.

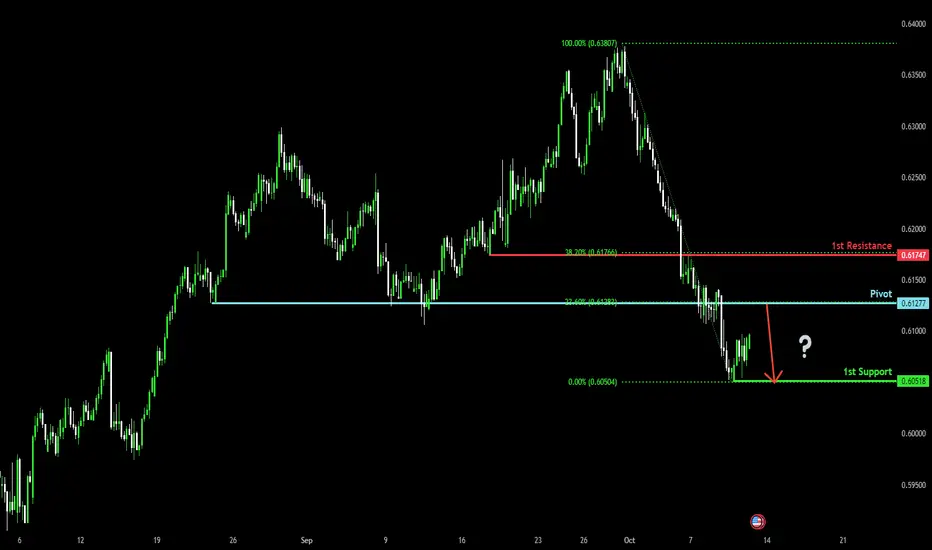
The Kiwi has a strong bearish momentum, could it fall further?The price is rising towards the pivot which acts as a pullback resistance and could fall to the the 1st support level which is a pullback support.
Pivot: 0.6127
1st Support: 0.6051
1st Resistance: 0.6174
Risk Warning:
Trading Forex and CFDs carries a high level of risk to your capital and you should only trade with money you can afford to lose. Trading Forex and CFDs may not be suitable for all investors, so please ensure that you fully understand the risks involved and seek independent advice if necessary.
Disclaimer:
The above opinions given constitute general market commentary, and do not constitute the opinion or advice of IC Markets or any form of personal or investment advice.
Any opinions, news, research, analyses, prices, other information, or links to third-party sites contained on this website are provided on an "as-is" basis, are intended only to be informative, is not an advice nor a recommendation, nor research, or a record of our trading prices, or an offer of, or solicitation for a transaction in any financial instrument and thus should not be treated as such. The information provided does not involve any specific investment objectives, financial situation and needs of any specific person who may receive it. Please be aware, that past performance is not a reliable indicator of future performance and/or results. Past Performance or Forward-looking scenarios based upon the reasonable beliefs of the third-party provider are not a guarantee of future performance. Actual results may differ materially from those anticipated in forward-looking or past performance statements. IC Markets makes no representation or warranty and assumes no liability as to the accuracy or completeness of the information provided, nor any loss arising from any investment based on a recommendation, forecast or any information supplied by any third-party.
The dollar surge takes a breather, pullback pending?We finally saw the USD rebound I was beating the drum about back in September. But now it's hit a decent resistance zone, I weigh up its potential to hold its ground or producer a deeper pullback. Markets covered include the USD index, EUR/USD and gold.
MS.

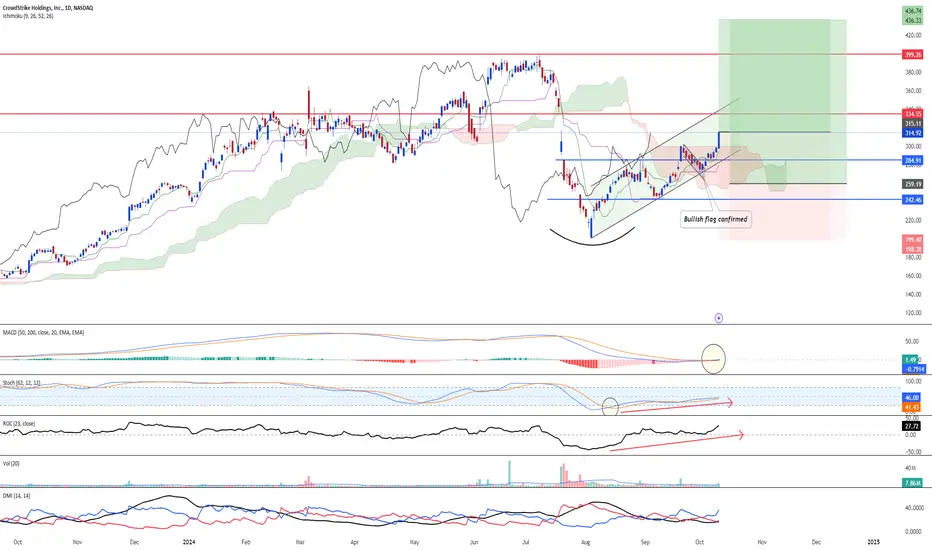
Crowdstrike is striking hot with upside rally NASDAQ:CRWD selling seems to be over and is forming an upward channel right now. Buying pressure is seen with the support of rising volume. Furthermore, long-term MACD is coming back with positive histogram and the mid-term stochastic is showing a confirmation of oversold crossover signal. 23-period ROC is back above the zero line and hence, momentum from the short to long-term are flashing upside.
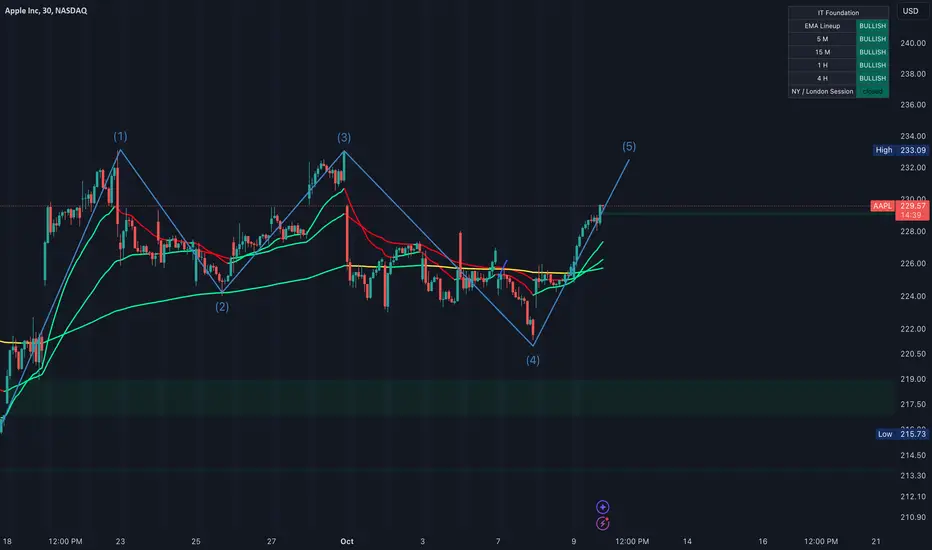
$AAPL Identifying a Macro 5-Wave Structure In this updated chart, I’m highlighting what appears to be a macro 5-wave structure based on Elliott Wave Theory: Here’s the breakdown:
1. Wave 1 starts from a low point and pushes up strongly, initiating the trend.
2. Wave 2 corrects back but does not fully retrace Wave 1, maintaining the overall upward trend.
3. Wave 3 is a powerful impulsive wave that surpasses Wave 1’s high, as expected in Elliott Wave theory.
4. Wave 4 is a corrective phase, with a shallower retracement compared to Wave 2.
5. Wave 5 is currently unfolding, moving upward and potentially marking the final push in this trend before we enter a larger correction or a reversal.
The next step would be to watch for signs of an A-B-C corrective wave once Wave 5 is completed.
Thoughts?
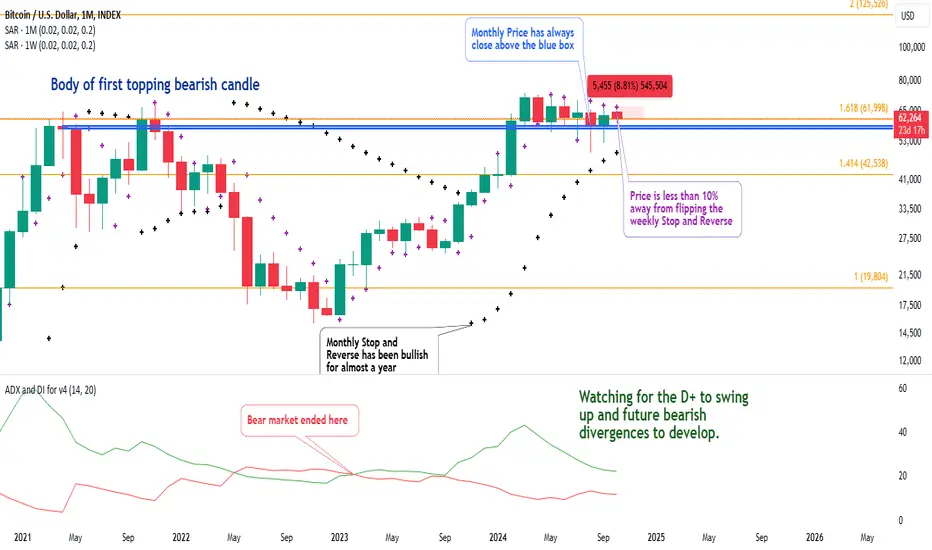
Bitcoin Monthly chart about to be fully bullishIntroduction
Bitcoin has been winding up above its previous top for many months. If you check the chart habitually or have been in an altcoin that has been bleeding out while bitcoin has been going sideways this has been a very painful time for you. Somethings got to give very soon.
Indicators
The most important indicators for this chart are going to be the weekly and monthly Stop and Reverse Indicator. These are desiged to approach price action from a previous high or low and when price action hits the SAR the next Sar begins from the previous high or low.
For example, when the price action rises to hit a SAR that is above it the next SAR appears beneath it at the value of the previous low. It then will approach the price action based on its formula.
From Wikipedia
the concept draws on the idea that "time is the enemy". Thus, unless a security can continue to generate more profits over time, it should be liquidated. The indicator generally works only in trending markets, and creates "whipsaws" during ranging or, sideways phases. Therefore, Wilder recommends first establishing the direction or change in direction of the trend through the use of parabolic SAR, and then using a different indicator such as the Average Directional Index to determine the strength of the trend.
Right now price has been going sideways and the Monthly SAR is beneath price action. Given the total context this is bullish. The Weekly SAR is above price action. So price is being compressed between two different indicators that have been programed potentially into countless of bots and algos to determine bias. Countless other traders have alerts that will signal when the monthly or weekly SAR are touched by price action so they can reassess the charts.
I have simplified the ADX to just the DI+ and the DI-. My linked idea will show I called the end of the bull market down to the week it ended. Since the bear market ended we don't see anything to concerning with the DI +/-. We are not in bear territory and our bias is still bullish. As price goes sideways and up I expect to see an upswing in DI+ and downside to DI-
In a macro bull on the bullish time frame you actually add to your positions when the weekly time frames are bearish. We can see price action is currently bearish on the weekly time frame as the DI- is above the DI+. This is when you buy if you have "strong hands"
Price Action
Large moves require structure and they require wind up. If you have been focused on the daily or weekly charts you might have missed the fact that bitcoin has clearly been creating structure on top of its previous high . So long as it continues to do so the bias is more upside. Price can wind up below a previous high before legging upward or downward. But so long as it closes above the previous high we continue to set a higher high.
What to look for
Its quite simple. We are looking for price action to, on a monthly basis, stay above the blue box and continue to go sideways and then up. We are also looking for the weekly SAR to flip and then both monthly and weekly SAR will be bullish.
From there the next major target is for bitcoin to roughly double at the 2.0 Fib level around 125K. Anything above the 2.618 fib level for the next market cycle top is too greedy for me. Of course, if bitcoin closes a monthly chart below the blue box, of hits the monthly SAR and flips that to bearish then this idea is negated.
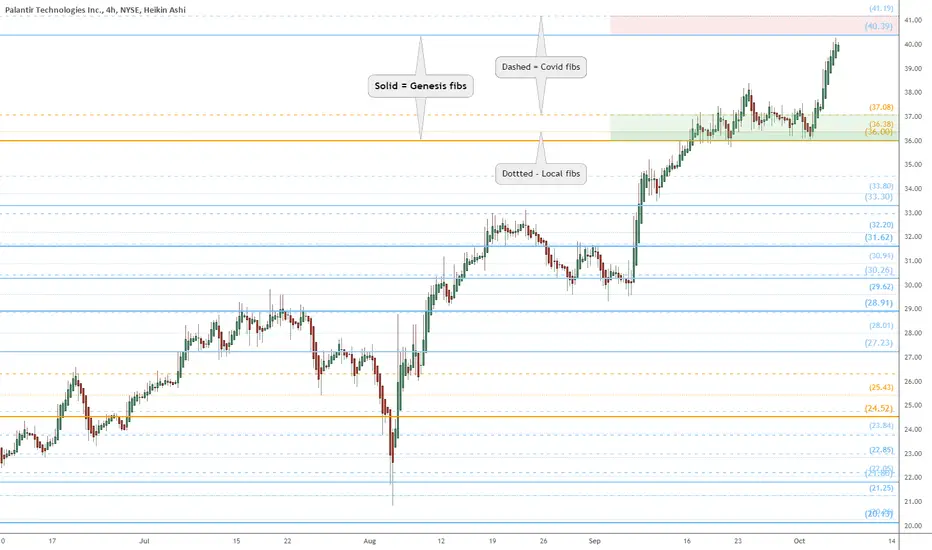
PLTR heads up at $40.39: look for Pullback or Break-n-RetestPLTR has been climbing fast.
Now at a key resistance zone.
Likely to get a pullback here.
$ 40.39 - 41.19 is the exact resistance.
$ 36.00 - 37.08 is a strong support zone.
$ 43.11 - 43.73 is next resistance above.
===================================
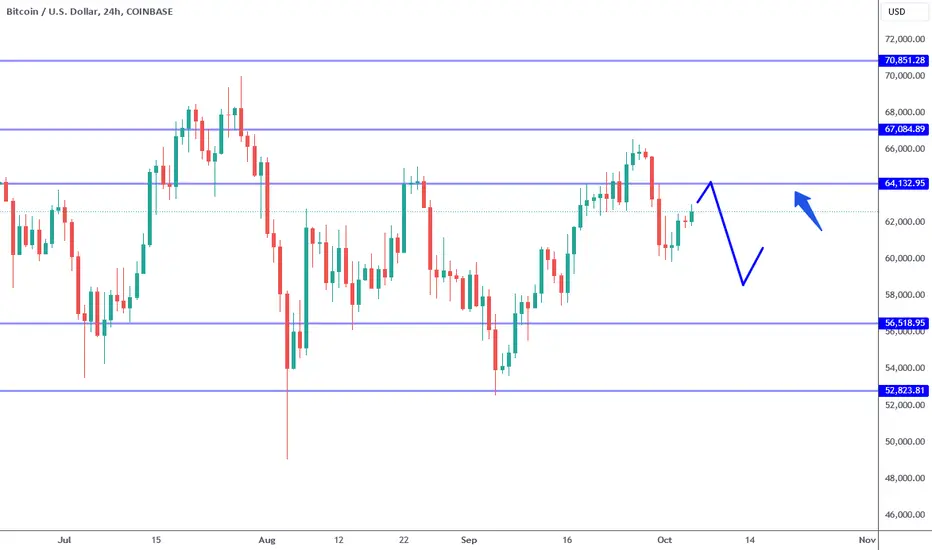
Bitcoin: Avoid Getting Caught In This.Bitcoin has retraced further than anticipated from my previous analysis (went to 60K instead of 64K support). There was never any price confirmation to go long on this time frame so you should have been able to avoid getting caught on the wrong side of such a move. While there appears to be a bullish correction of that move in progress now, it is important to prepare for the coming resistance where a lower high may unfold over the coming week (64K previous support/new resistance).
The arrow on my chart points to the 64K resistance area. This location is notable for two important reasons: price can present a bearish reversal there on this time frame, and retest the level again as a profit objective in the near future. The illustration on my chart shows how I am anticipating the price action will play out in this regard. Keep in mind, this is NOT any kind of guarantee, it is what I believe has a greater possibility compared to a narrow range of scenarios over a short time horizon (click on previous articles to see how my illustrations play out).
The whole point of sharing this analysis is to help you prepare for what the market can throw at you over the coming week. The key to using this information effectively is evaluating price action around these levels in search of CONFIRMATION (Trade Scanner Pro was made of this purpose). For example, over the previous week, Bitcoin broke the 64K anticipated support without ever confirming. There was never a reason to justify risk here, and every reason to step aside. Having a decision making model of this nature not only helps you to adjust to unexpected changes, but also avoid unnecessary losing positions.
In terms of current momentum, there was an inside bar breakout at 62,300 (previous high) and a long signal in play. This type of opportunity is best managed by smaller time frame strategies (day/swing trades). This is far from an attractive investment level, especially since there is only about 1K points before first resistance (64K). I consider this location as one of elevated risk, especially compared to the possibility of retesting 60K support again to be followed by a bullish signal. The second bullish signal (off 60K) would be the lower risk/higher probability play. This is just a possible scenario that I will be prepared for IF Bitcoin presents and confirms it, this is NOT a forecast.
Whether you are an investor or trader, you must have a way to objectively make decisions. A set of criteria to identify an opportunity, confirm entries, project exits and define risk. The time horizon that you choose will be an important factor that will shape how you process this information. As complex as all of this may sound, the goal is to accomplish this all while using as little information as possible. This is the LEAST you can do in a market environment where we as the retail trader/investor have NO advantage whatsoever. Otherwise you are simply stuffing your money into a glorified slot machine.
Thank you for considering my analysis and perspective.
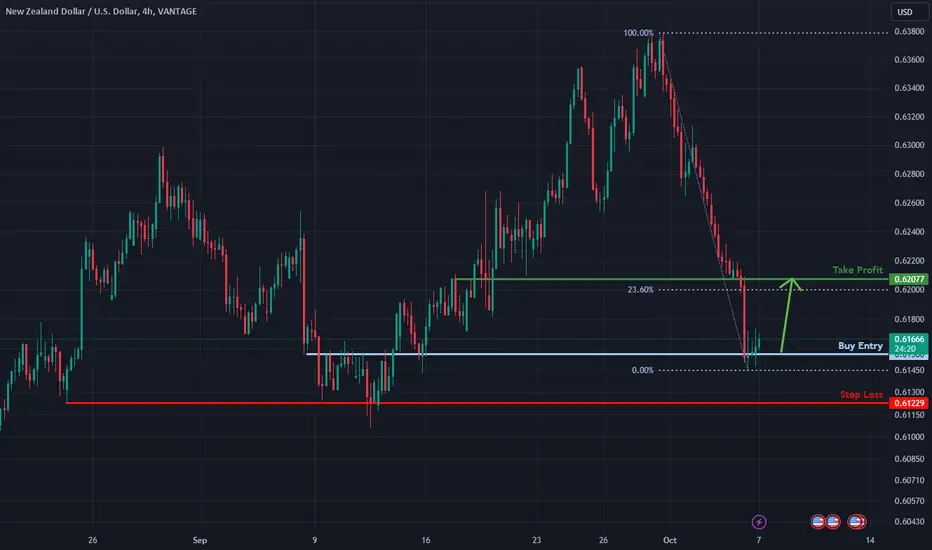
Potential bullish rise off overlap support?NZD/USD is reacting off the support level which is an overlap support and could rise from this level top our take profit.
Entry: 0.6156
Why we like it:
There is an overlap support level.
Stop loss: 0.6122
Why we like it:
There is a pullback support level.
Take profit: 0.6207
Why we like it:
There is a pullback resistance that is slightly above the 23.6% Fibonacci retracement.
Enjoying your TradingView experience? Review us!
Please be advised that the information presented on TradingView is provided to Vantage (‘Vantage Global Limited’, ‘we’) by a third-party provider (‘Everest Fortune Group’). Please be reminded that you are solely responsible for the trading decisions on your account. There is a very high degree of risk involved in trading. Any information and/or content is intended entirely for research, educational and informational purposes only and does not constitute investment or consultation advice or investment strategy. The information is not tailored to the investment needs of any specific person and therefore does not involve a consideration of any of the investment objectives, financial situation or needs of any viewer that may receive it. Kindly also note that past performance is not a reliable indicator of future results. Actual results may differ materially from those anticipated in forward-looking or past performance statements. We assume no liability as to the accuracy or completeness of any of the information and/or content provided herein and the Company cannot be held responsible for any omission, mistake nor for any loss or damage including without limitation to any loss of profit which may arise from reliance on any information supplied by Everest Fortune Group.
PEPE + BNB Will Moon Just Like ETH Did In 2017 17 year experienced trader here sharing my thoughts to help the crypto community.
As everyone knows this is a very important time for the market as we are approaching the end of the 3rd year of the 4 year cycle . Year 4 has always been ALTSEASON . The charts I am sharing with you are setting up to have HUGE runs into 2025. In teh video I share with you my reasoning on why this meme coin and BNB will explode higher just like ETH did back in 2017 . ETH was the the daddy back then and now MEME coins are the hot narratives (look at how many meme coins that Binance have listed) and there is a reason for it . Meme coins are bring in heavy trading volume for exchanges creating good revenue and they also bring in new crypto people to the community , we have seen xrp bring in millions of people , then we seen DOGE bring in millions of people then SHIB and then PEPE . Each ALTSEASON it has been a new meme coin that helps bring in and grow the crypto community so this time will be no different . This time we have new coins like NEIRO that can moon also but that is for another video .
Do not sleep on these coins and if u need any help or have any questions please just send me a message and I will be happy to try my best to help .
Have a great weekend
MartyBoots

$AMD Chart Setup: A Strategic Play Ahead of Advancing AI Event.As we approach AMD’s highly anticipated Advancing AI event this Thursday, the market may soon see the company in a whole new light. Historically, these events tend to prompt a "sell the news" reaction, giving us the opportunity to front-run the event throughout the week.
The chart is setting up nicely with a confirmed wedge breakout, supported by strong bullish volume on both daily and weekly candles. If the stock goes flat or even sells off ahead of the event, it could present a bullish opportunity for us to capitalize on, if it continues to run, could be a short opportunity as the move could be priced in.
My positions are as follows:
Calls over $171.21, with targets at $177.55 and $185.
Puts under $164.42, with targets at $162.58 and $154.49.
Let’s stay sharp and position ourselves for what could be a pivotal moment for NASDAQ:AMD this week. Cheers.
