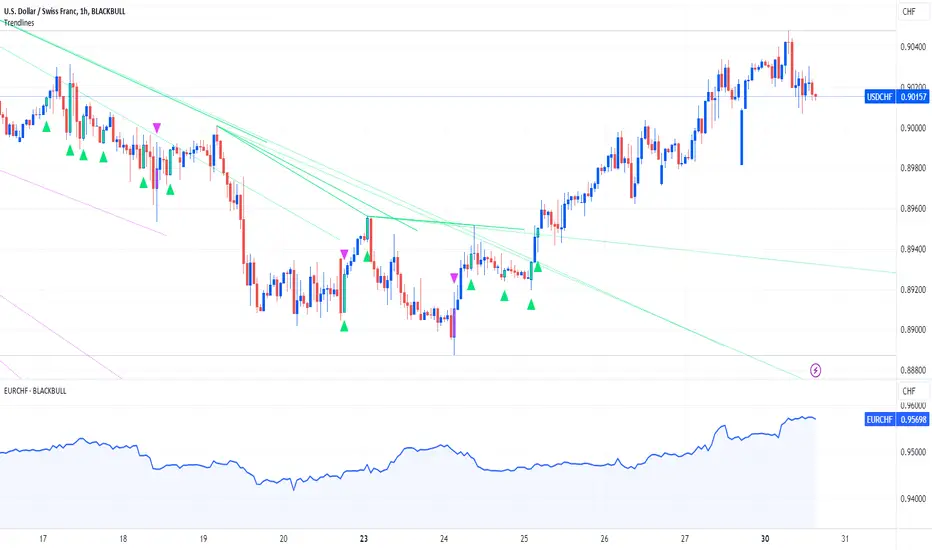
Swiss Franc Rides High on Investor Flight to Safety?Investor flight to safety might provide a favorable outlook for the Swiss franc this week.
Swiss franc against the USD and GBP might be the most interesting considering the Fed and the Bank of England (BoE) hold their policy meetings this week, where they are both expected to keep rates exactly where they are. These pauses by the Fed and BoE might contrast too sharply with the Swiss National Bank (SNB), whose Vice-Chairman made some hawkish comments over the weekend, pushing back against expectations that the SNB is done with its rate hikes, and cause some rumblings in the USDCHF and GBPCHF.
Investor risk-aversion has already caused the Swiss franc to hit a high not seen since 2015 against the Euro. Euro Area inflation is also due this week, so this pair might also be appropriate to watch this week.
Regarding the Middle East conflict, latest developments have seen Israeli Prime Minister Benjamin Netanyahu deny they would agree to ceasefire, drawing parallels to US retaliation to the terrorist attacks of 9/11. In this way, we might expect drawn out conflict, and the desirability of the Swiss franc rising.
Community ideas
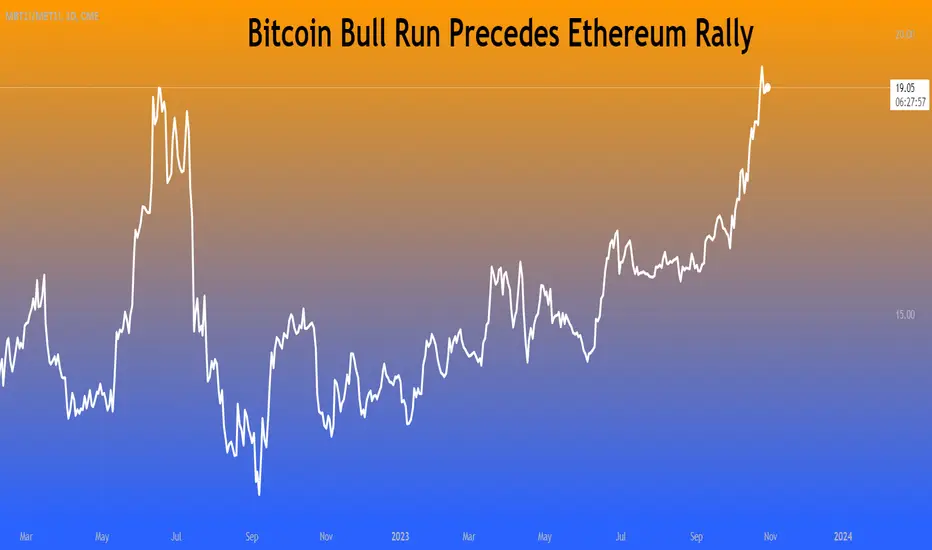
Bitcoin Bull Run Precedes Ethereum RallyDays of triple digit volatility and rampant amateur speculation are gone. Unlike the overblown enthusiasm which defined the peak of 2021, investors now are more measured and discerning.
2023 has been defined by (a) discrete and information fuelled rallies followed by unprecedented low volatility, and (b) rise of traditional finance entrants in digital assets.
Bitcoin (BTC) has rallied sharply relative to Ethereum (“ETH”), pushing BTC-ETH ratio to its highest level since 2021. Several factors point to a potential reversal in the ratio. Investors can deploy CME Micro BTC and Micro ETH Futures to harness gains from eventual reversion.
BTC surged 20% during the past week driven by excitement over the anticipated approval of a BTC Spot ETF. Large liquidations triggered as BTC prices rose on its re-emergence as a haven asset as discussed in a previous paper .
BITCOIN IS A HAVEN (AGAIN)
In October, BTC’s correlation with gold rose while correlation with Nasdaq-100 has inverted suggesting that investors consider BTC as a haven rather than a risk-on asset.
The case for BTC as a haven derives from its limited supply. Every four years, the number of BTCs minted as a mining reward, halves and will eventually halt, leading to a fixed supply.
BTC has played its role as a haven previously. In March this year, during the US regional banking crisis, BTC surged 40%. BTC also rallied 20% at the start of Russia-Ukraine conflict but soon pared those gains. Given the repeated pullback in its prices, question around BTC’s ability to deliver as a safe haven remains.
Assigning BTC a haven status could be a tad bit too early. It is a new asset. It faces regulatory ambiguity. It remains under-invested relative to traditional safe havens like gold and treasuries.
Notwithstanding that BTC is new, it is the most popular and widely tested cryptocurrency. Flow of assets from riskier crypto to the safety of BTC during rising uncertainty partly contributes to haven flows into BTC.
SHORT SQUEEZE ACCENTUATED BITCOIN’S RALLY
Recent rally was punctuated by heavy deleveraging in BTC derivatives. During the long squeeze in August, 64,000 BTCs were liquidated. In the following period, only half of these long positions returned.
These positions were not spared either as large liquidations occurred on October 17th and 23rd leading to unwinding of more than 60,000 BTC.
Source: Glassnode
The size of liquidation was like those in Jan 2023 when prices definitively broke above the $20k range, suggesting that this washout may be adequate to cement a major psychological price level.
AWAITING A BTC SPOT ETF
The latest development in the BTC spot ETF saga comes as an appeals court upheld the ruling against SEC’s rejection of Grayscale’s spot ETF application based on concerns that market manipulation is not addressed sufficiently.
The court held that SEC’s decision was arbitrary, capricious, and unenforceable. This time around, the SEC stated it will not be appealing any further.
The SEC’s easing stance is also echoed in the modest feedback response to other spot ETF applications. Many now believe that all spot BTC ETFs will be approved together and probably before the deadline of January 10th.
Approval of spot BTC ETFs is expected to make the asset available to a wider audience in a familiar Tradfi product structure making BTC go “mainstream.”
Spot ETFs will spur greater demand for spot BTC from ETF manufacturers. When gold ETF was first listed, incremental fund flows translated into higher demand for physical gold.
ETF listing and BTC price run is not a given as regulatory concerns remain. Prices have struggled to sustain ETF excitement driven rallies not once but thrice in 2023 due to slow developments compounded by a harsh macro backdrop.
The risk that the current rally will pullback persists. Earlier this week, price action was significantly influenced by investors speculating on the approval of Blackrock spot ETF (IBTC). The rumours have been spurred by the listing, delisting, and relisting of the ticker on Depository Trust and Clearing Corporation (DTCC) website.
BITCOIN BULL RUN PRECEDE ALTCOIN RALLIES
In stark contrast to BTC’s rally, other major cryptocurrencies have lagged pushing BTC dominance to its highest since 2021.
ETH has rallied 15% over the past week. ETH underperformance relative to BTC has pushed the ratio between them to levels unseen since 2021.
Altcoin underperformance is unusual. During past BTC rallies, ETH price tops lagged BTC tops by a month. This is a consequence of capital rotation within crypto.
In past rallies, asset rotation can be seen in three distinct waves starting with (1) increase in BTC capital, (2) ETH rotation, followed by (3) increasing stablecoin flows.
MARKET METRICS AND ON-CHAIN SIGNALS
A raft of market metrics points to bullish sentiment in crypto markets due to resilient Long-Term Holders (LTH), limited profits at current levels, and strained supply which is expected to be exacerbated by demand from spot ETFs.
More importantly, market metrics indicate a higher bullish sentiment for ETH.
FUTURES AND OPTIONS POSITIONING
Leveraged funds have built up net short positioning over the last few weeks in BTC futures. Contrastingly asset managers have setup net long positioning. In options, BTC full size options have a bullish P/C ratio of 0.51 and Micro BTC options have a P/C ratio of 0.76.
In contrast, leveraged funds bullish on ETH have switched from net short to net long positioning last week. Full size ETH options have bullish P/C ratio of 0.38 and Micro ETH options have P/C ratio of 0.38.
Overall, leveraged funds and option markets are more bullish on ETH compared to BTC.
TRADE SETUP
BTC prices may pullback relative to ETH in the short term given price divergence. CME’s suite of crypto futures can be deployed to harness gains from this trend reversal.
The hypothetical spread posited in this paper consists of two legs: (1) long position in Micro ETH futures expiring on November 24th ( METX3 ) and, (2) short position in Micro BTC futures expiring on the same date ( MBTX3 ).
Each lot of Micro ETH futures provide exposure to 0.1 ETH while each lot of Micro BTC futures provides exposure to 0.1 BTC. To balance notional values, nineteen lots of METX3 are required for each lot of MBTX3 at current prices
● Entry: 19.090
● Target: 17.58
● Stop Loss: 20.000
● Profit at Target: USD 276
● Loss at Stop: USD 169
● Reward to Risk: 1.6x
MARKET DATA
CME Real-time Market Data helps identify trading set-ups and express market views better. If you have futures in your trading portfolio, you can check out on CME Group data plans available that suit your trading needs tradingview.sweetlogin.com
DISCLAIMER
This case study is for educational purposes only and does not constitute investment recommendations or advice. Nor are they used to promote any specific products, or services.
Trading or investment ideas cited here are for illustration only, as an integral part of a case study to demonstrate the fundamental concepts in risk management or trading under the market scenarios being discussed. Please read the FULL DISCLAIMER the link to which is provided in our profile description.
A Traders’ Playbook – Defence remains the best form of attack Equity continues to trade heavily, and while we are getting to a point of extreme fear, the price action, and the bearish momentum in EU, AUS200 and US equity indices, suggest this is still a sellers’ market. While we have some big catalysts due this week, I still think we must navigate a passage of darkness before we see light in this tunnel.
The geopolitical backdrop in the Middle East remains a dominant market consideration and the market still sees an increasing risk the conflict will not be contained with other players stepping into the conflict.
A near 3% rally in Brent crude on Friday testament to those worries, with the move above $90 seeing traders bid up gold to $2006, with gold's role as the preeminent portfolio hedge once again confirmed. A move into the April/May supply area of $2050 seems perfectly feasible, and the bullish momentum in the price, and the ease by which we’ve seen gold push through well-watched resistance levels, suggests the path of least resistance remains higher and pullbacks should be well supported.
The BoJ meeting could be a real curveball and while the odds are we see it proving to be a low-volatility event, if the BoJ does tweak the YCC cap to 1.5% it could trigger a wave of selling through global long-end bonds (yields higher). This would likely see sizeable gyrations play through all markets, with the JPY – which has stolen the crown from the CHF as the no.1 geopolitical FX hedge – likely to rally hard. Gov Ueda has aimed to be more predictable than former gov Kuroda, so with recent press suggesting a tweak to YCC could be on the cards, the prospect of change to policy is 50:50.
We also get the US Treasury Quarterly Refunding activity throughout the week. To those who aren’t fixed-income traders, this can be an event that isn’t too well-known. As we saw in August, when the Treasury Department detailed increased auction size in its financing plans, it proved to be a key driver behind US Treasury yields rising sharply from 4%. Once again, this event does have the potential to create some big vol in bonds, which could spill over into FX and equity markets. This time around, could we see lower increases in supply, which in turn supports USTs?
Staying in the US, while the FOMC meeting can never be ignored, traders get a thorough read on the US labour market and wages/earnings. On the docket, we get ADP payrolls, the Employment Cost Index, JOLTS job openings, Unit Labour Costs, jobless claims, and nonfarm payrolls. US swap pricing has a 25bp hike in December priced at a 20% chance, so big numbers in this report could see that probability rise, which would likely see the USD break out of the current sideways consolidation.
Corporate earnings get another run past traders, with 24% of the S&P500 market cap reporting. Apple is the marquee name to report, with the options market pricing a move on the day at 3.7% - the market focused on iPhone demand and consumer trends in China. Rallies have been sold of late, with price now below the 200-day MA for the first time since 2 March 2022.
It promises to be another lively week – good luck to all.
The marquee event risks for the week ahead:
Month-end flows – talk is pension funds and other asset managers rebalancing in favour of selling of USDs.
China manufacturing and services PMI (31 Oct 12:30 AEDT) – the market sees the manufacturing index at 50.2 (unchanged) and services index at 51.8.
EU CPI (31 Oct 21:00 AEDT) – while EU growth data seems the more important factor, we could see some volatility in the EUR on this data point. The market consensus is for headline CPI to come in at 3.1% and core CPI at 4.2%. EURCAD is trending higher, and I like it into 1.4750.
BoJ meeting (31 Oct – no set time) – the BoJ should increase their inflation estimates, but the focus will fall on whether there is an adjustment or even full removal of Yield Curve Control (YCC). This is where the BoJ currently cap 10-yr JGB yields (Japan Govt bonds) at 1%. The consensus sees no change to YCC at this meeting, but there is a 50:50 chance we see the cap lifted to 1.5% - an action which could see JGBs sell off (higher yields) and see global bond yields higher in symphony. It could also see the JPY rally strongly.
US consumer confidence (1 Nov 01:00 AEDT) – The market expects the index to pull back to 100.0 (from 103.0) – unlikely to cause to much of a reaction across markets unless it’s a big miss.
US Treasury November Refunding (30 Nov at 06:00 & 1 Nov 12:30 AEDT) – the US Treasury Department (UST) will offer its gross financing estimates for Q42023 (currently $850b) and end-of-quarter targets for its cash balances. It is likely that the gross borrowing estimate will be lowered to $800b, perhaps even lower. The lower the outcome the more USTs should rally and vice versa.
On 1 Nov we will see the UST announce the size of upcoming bond auctions across the 2-, 3-, 5-, 7-, 10- and 30-year bond maturities. The market expects auction sizes to increase across ‘the curve’ by around $1-2b for each maturity. As we saw in August, the higher we see these taken the greater the likely reaction in US Treasuries and subsequently the USD.
FOMC meeting (2 Nov 05:00 AEDT) – The market ascribes no chance of a hike, so guidance from the statement and Powell’s press conference is key. One can never overlook a Fed meeting, but in theory, we shouldn’t learn too much new information and this should be a low-drama event.
BoE meeting (2 Nov 23:00 AEDT) – UK swaps price a 4% chance of a 25bp hike at this meeting, and around a 1 in 3 chance of a 25bp hike by Feb 24. The split in the voting could also be important, with most economists leaning on a 6:3 split. The market feels like the BoE are done hiking, with cuts starting to be priced by June.
US ISM manufacturing (2 Nov 01:00) – The consensus is for the index to come in at 49.0 (unchanged). Consider that the diffusion index has been below 50 since October 2022, so a reading above 50.0 could be modestly USD positive.
US JOLTS job openings (2 Nov 01:00) – Last month we saw a big increase in job openings and further evidence the US labour market is tight. The consensus this time around is for 9.265m job openings (from 9.61m) – risky assets will want to see this turn lower again with reduced job openings.
US nonfarm payrolls (3 Nov 23:30 AEDT) – With so many labour market and wage/earnings data point due out this week, the US NFP report is the highlight. After last month’s blowout 336k jobs print, the current consensus is for 190k jobs, the U/E rate at 3.8% and average hourly earnings at 4%.
Brazil Central Bank meeting (2 Nov 08:30 AEDT) – The BCB should cut by 50bp.
Earnings – This week we see earnings from UK, EU and US listed names coming in thick and fast - 24% of the S&P500 market cap report this week. Numbers from HSBC (Monday), Caterpillar (Tuesday) AMD (Tuesday), Qualcomm (Wednesday), Apple (Thursday) should get the attention.

Can You Explain Your Trading Strategy in 3 Sentences?Can you explain your trading strategy in 3 sentences or less?
Go ahead and give it a try in the comments below.
This is an important exercise for any trader of investor as it demonstrates mastery of an existing strategy. Meaning, if a trader knows their strategy inside and out, and has practiced it or modified it over a period of time, they also can explain it quickly and succinctly.
• Are you a swing trader? What criteria determines a trade?
• Are you a value investor? What metrics do you use?
• Are you an algorithmic trader? What code powers your trading?
All of these questions and more go into explaining your trading strategy, which is ultimately the process you're using to trade markets. However, it's often observed that new traders don't have a strategy. Instead, their trades are impulsive and random. As a community, we can use the comments section below to showcase our individual levels of expertise, helping new traders along the way and watching pro traders innovate.
We look forward to seeing what everyone writes in the comments below.
In addition, the more people who share, the more we can learn.
Be sure to like, follow, and comment on the traders who have the most interesting answers. You may find a great follow and improve your social feed here.
- TradingView Team

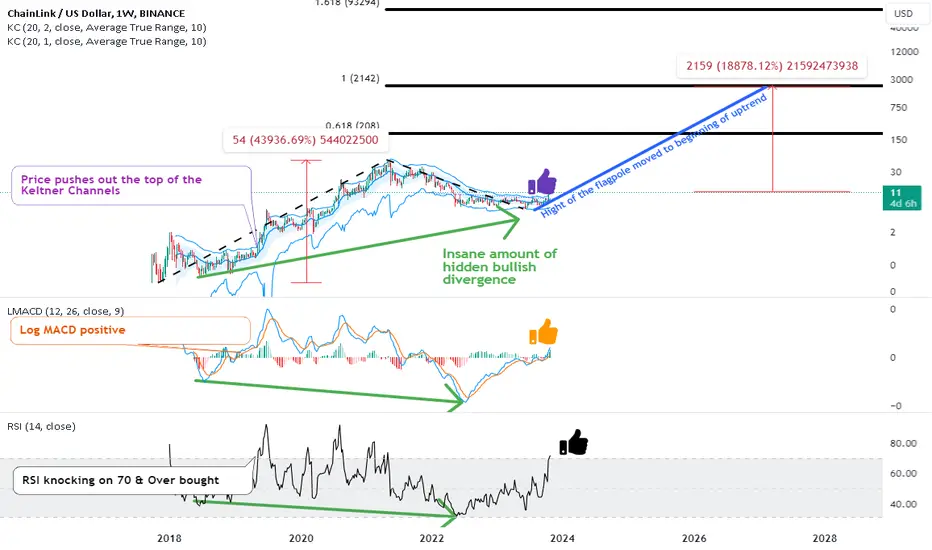
Five year view on LinkLink was one of the darlings of the last bull run. It’s story includes crazy volatility, stories of “Link Marines” blowing out Zues Capital out after its short and distort narrative fell apart. I suspect Link will once again be a darling of this new bull cycle.
cointelegraph.com
Analysis
The meat of the idea is from the main chart. We have hidden bullish divergence on the log MACD as well as the RSI. Hidden bullish divergence suggest a uptrend will continue. There is a higher low on the price but a lower low on the indicator. The green arrows show that very clearly.
The RSI getting to above 70 can signal overbought on a time frame but it can also signal that the bulls are in control of the price action. The log MACD is above zero once again. Both are very bullish indications that momentum is shifting fully bullish.
I favor using two Keltner channels, one set with the ATR at 1 and one set at 2. It helps be visualize when price is in between and make some conclusions. In order to “break” a weekly Keltner channel we need months if not years of price action creating a formation we can play.
I am just going to keep it as simple as possible. Link had a Elliot wave impulse and has completed its ABC correction. That is the structure we need to break the Keltner channel and push it upward. The chart below shows that twice link lost over 60% of its value when it corrected. So there are going to be discounts on the way back up. These relative bear markets lasted several hundred days and that can really weaken people’s hands.
Since we are using elliot wave the primary targeting technique I am using is major fib extension levels. I have only shown a couple on the main chart for simplicity but I expect action at almost all major fib lines. Stalls, retraces, all the normal drama.
Looking to buy the lower half of the Keltner channels seemed to have worked out for long term investors between 2018 and 2021. It was only when we put in the lower high at point B that strategy meant you were out of the money for a long time.
My plan
I plan on having Link be a major holding going forward. I plan on watching some tokens against Link (sol, xmr, ftm, etc) and trying to do some rotations or buying the alts when they have bullishness against link. In the long run I hope to pull close to 200x out of link with no margin.
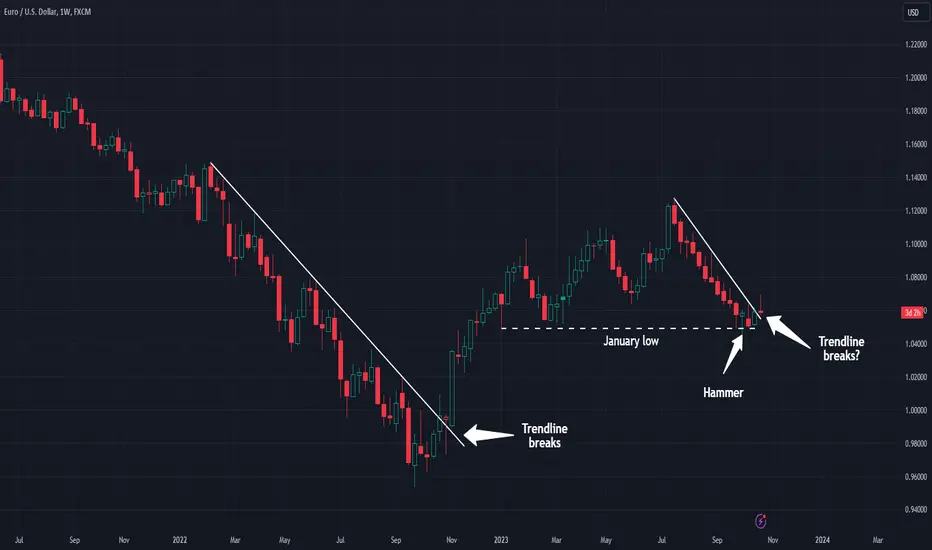
The Euro May Have BottomedThe Euro has faced steady selling pressure since July, but now there may be signs of the currency bottoming against the greenback.
The first pattern on today’s chart is the falling trendline along the weekly highs. EURUSD has been pushing above that resistance this week. Notice how it started rallying a year ago after breaking a similar trendline.
Second is the January low around 1.048. The currency pair fell under that level in early October but recovered. The results were a false breakdown and a hammer candlestick. Chart watchers may view both as bullish reversal patterns.
This setup could keep traders on alert for a potential rally given upcoming events like gross domestic product (GDP) Thursday morning, the Federal Reserve meeting on November 1 and non-farm payrolls on November 3.
TradeStation has, for decades, advanced the trading industry, providing access to stocks, options, futures and cryptocurrencies. See our Overview for more.
Important Information
TradeStation Securities, Inc., TradeStation Crypto, Inc., and TradeStation Technologies, Inc. are each wholly owned subsidiaries of TradeStation Group, Inc., all operating, and providing products and services, under the TradeStation brand and trademark. TradeStation Crypto, Inc. offers to self-directed investors and traders cryptocurrency brokerage services. It is neither licensed with the SEC or the CFTC nor is it a Member of NFA. When applying for, or purchasing, accounts, subscriptions, products, and services, it is important that you know which company you will be dealing with. Please click here for further important information explaining what this means.
This content is for informational and educational purposes only. This is not a recommendation regarding any investment or investment strategy. Any opinions expressed herein are those of the author and do not represent the views or opinions of TradeStation or any of its affiliates.
Investing involves risks. Past performance, whether actual or indicated by historical tests of strategies, is no guarantee of future performance or success. There is a possibility that you may sustain a loss equal to or greater than your entire investment regardless of which asset class you trade (equities, options, futures, or digital assets); therefore, you should not invest or risk money that you cannot afford to lose. Before trading any asset class, first read the relevant risk disclosure statements on the Important Documents page, found here: www.tradestation.com .
ETH ecosystem to fund initial stage of crypto bullrunWhen markets rotate the money has to come from somewhere. Money can move in and out of one sector of the economy into the other, like money moving from industrials into technology or from fiat into precious metals. Money can also move around within a macro system from its constituent sub-systems. In the case of crypto, think we will see the Ethereum ecosystem beggared while money flows out of it into other ecosystems.
In order to try and stay ahead of the rotations into and out of crypto and into and out of the various layer one projects within crypto I turn to the best tool I have, which is the charts. Once we have the layer one blockchain we care about we can look at other layer projects that ride on top of the layer one to move up the risk curve for more volatility as we see fit.
ETH/Bitcoin
Bitcoin is the biggest single slice of the crypto by fame and market cap. The double top threat is pretty clear at this point. The black double top appears to be an eve and eve with the difference between the first and second peak about 3.12% That is about as textbook as we could want to see. We just have to start breaking the neckline of the formation and we should start to see more volatility in the pair.
Eth Dominance
ETH.D is likewise in a double top but this one is a bit further away from the neckline. The targeting is much the same. Due to the structures of the uptrend I think that 40% draw down is very reasonable and realistic.
XRPETH
XRP appears to be in a ascending triangle against ETH with a target close to 2x if full performance is reached.
Solana/ETH
Solana is suppose to be an Ethereum killer and in the long run I think it will live up to its name. I think it has a couple of years for the ecosystem to mature before It does. A major sign of strength will be if this W pattern performs to target. That would have Sol putting up over twice the gains than eth does in the initial stages of this move.
Polkadot ETH
Dot has been moving sideway for the last 4 months and has created some bullish divergence on the weekly chart. I think we will see it slowly erode share out of eth.
Kadena Eth
One of my favorite layer ones to watch and maybe trade before I see my long term set up is Kadena. It is poised ot have a W pattern that pops it over 100% against eth.
Cronos Eth
Cro seems to be another coin in a wedge against eth. The target this cycle is over 300% away from the current level.
ADA ETH
Oh, look, it is another coin in a bullish falling wedge against ETH. Sure reaching the previous ATH might take a decade or so, but that is a decade to favor ADA over eth.
Doge Meme Coin Versus Eth
Want to consider something that at first glance seem moronic or hilarious? Doge has the structure to 70x eth over the next couple of years.
Final thoughts
The Eth team has done a lot to make their system more affordable to use. As price goes down the ease of use goes up and the adoption goes up. Ethereum is in the process of turning itself into a volume trade and not a profit margin trade. That might be a good thing for cryptocurrency as a whole but I am chasing alpha. Crypto gives me more potential alpha than equities so I play here. If the alpha is leaving eth then I am going to leave as well, no matter how good it could be for the world or the ecosystem. Daddy can't pay for his girls food and clothes if he doesn't get that alpha.

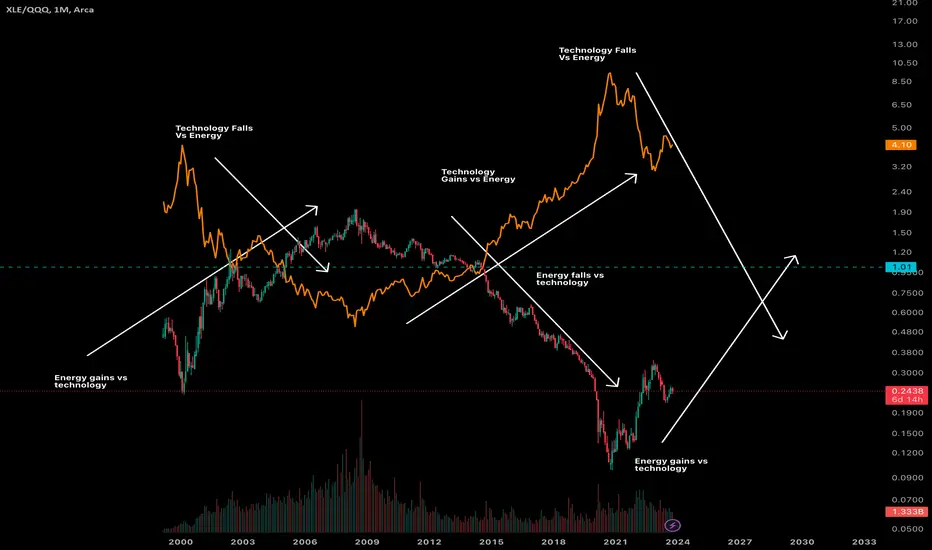
Technology to Energy RatioEverything is cyclical. Every asset has its own cycle eventually in its own time. From Crypto to Real estate and Technology.
I crossed compared the Energy sector to the Technology Sector. XLE/QQQ
Then overlaid the Technology Sector to the Energy Sector QQQ/XLE
As you can see there is many clues where one will always outperform the other.
You just have to hold these assets where one is gaining vs the other.
One asset will suck the liquidity of the other and visa versa until one completes the cycle then it repeats
Hard assets are primed for outperformance.
Happy Investing
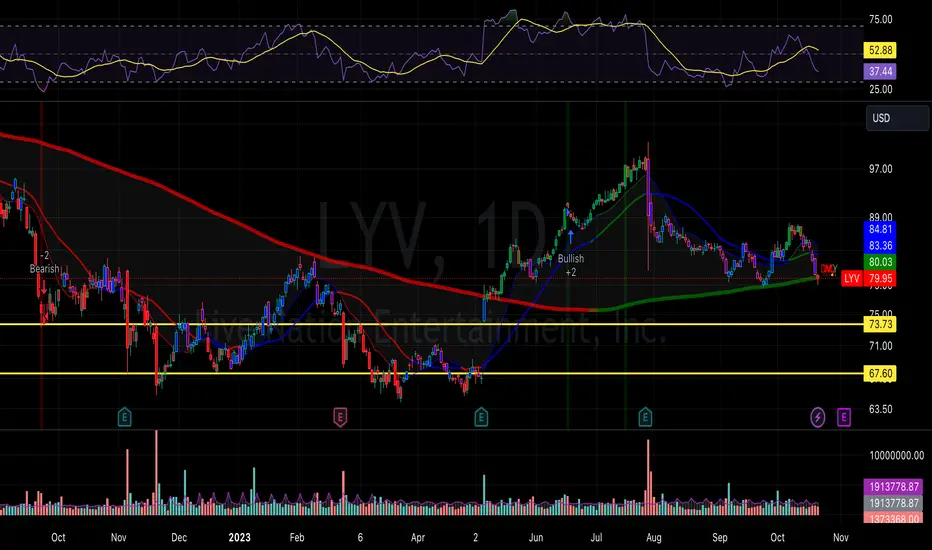
Long Term Investment Thesis for LYVLooking for long term investments is always a challenge. Thing is you need to know what you are looking for. It makes a difference to find a company that is oversold and is sitting on the 200 moving average. I have an idea that we have a gap to close between the yellow lines. I think but, time will tell, that this stock possibly could break through to those yellow lines in order to fill the gap and fill the orders that are out there within that gap.
This stock is a company that has high director ownership at 32% which tells me they believe in their company. As I dive deeper, this company is constantly increasing their employees yearly to where they are now at 28,000 employees.
As far as the Market Value 18.40B and Enterprise Value 19.68B this company has two numbers that are close. However, they do have more debt than cash but it is close.
This stock is in the niche that has plenty of growth room and they are kicking it within the entertainment business and selling tickets online.
This is a company that is in the entertainment niche. They have cornered a market and many in the USA have used this company if they have attended college sports and events or any other venues that need and use a web based ticket collection agency. This company owns and operates TicketMaster which has taken the whole process of paper tickets to be replaced, bought, sold, exchanged via web based. This stock has been trading in the same range over the past 5 years for the most part. It has been going higher over time but, the markets have been off due to the corrections with in the market. This particular stock is set to go higher over time with many analysts putting $107 and higher price tags.
The insider ownership of the directors is nearly 32% ownership and their Market Cap is 18.40B whereas the Enterprise Value is 19.68 B, which are very closely aligned. The earnings per shares is $1.07. They have continuously been hiring new employees due to their growth over the years.
This stock is:
Live Nation Entertainment, Inc. operates as a live entertainment company. NYSE:LYV
It operates through Concerts, Ticketing, and Sponsorship & Advertising segments. The Concerts segment promotes live music events in its owned or operated venues, and in rented third-party venues; operates and manages music venues; produces music festivals; creates and streams associated content; and offers management and other services to artists.
The Ticketing segment manages the ticketing operations, including the provision of ticketing software and services to clients for tickets and event information through its primary websites livenation.com and ticketmaster.com, as well as through other websites, mobile apps, retail outlets, and call centers; and provides ticket resale services.
This segment sells tickets for its events and third-party clients in various live event categories; offers ticketing services for arenas, stadiums, amphitheaters, music clubs, concert promoters, professional sports franchises and leagues, college sports teams, performing arts venues, museums, and theaters.
The Sponsorship & Advertising segment sells international, national, and local sponsorships and placement of advertising, including signage and promotional programs; rich media offering that comprise advertising related with live streaming and music-related content; and ads across its distribution network of venues, events, and websites.
This segment also manages the development of strategic sponsorship programs, as well as develops, books, and produces custom events or programs for specific brands.
It owns, operates, or leases entertainment venues in North America and internationally. The company was formerly known as Live Nation, Inc. and changed its name to Live Nation Entertainment, Inc. in January 2010.
Live Nation Entertainment, Inc. was incorporated in 2005 and is headquartered in Beverly Hills, California.
I personally buy stocks when I see setups in charting that I like which is just my style of investing. I have attached a detailed daily chart with RSI (37.44) that is showing this stock is oversold meaning that it is unloved at the moment but, most of the market is too but, it is not as cooled off as I would like to see it. I’m personally looking for it to go closer to RSI of about 30. It is also beginning to reach a critical point of touching the 200 moving average line in which I will watch to see if it continues to hold there or proceeds to break through to the downside. If it continues to hold and stay within that price range for the next week. That indicates to me that a buying trend is beginning to form. The Volume and MACD is also showing a huge sell off so, I want to see that level off some as well. I do not plan to buy into this stock until I see the MACD cross upward and at minimum 5 days of similar stock price range with stronger buying volume than the current selling off volume. I personally am also looking at a gap that I know has orders still waiting to be filled where buyer and/or sellers are waiting to get this stock at $73.73 to $67.60 price range. Generally, not always, gaps have to be filled at some point in time. I’m looking for the stock to drop into this range before I enter it. I might be late and disappointed if the markets take off and this one continues higher but, that is where I’m looking to enter. I just wanted to share this company with the group because I see much here and personally have used this company to buy all my sporting event and concert event tickets over the past 5+ years.
I know we can’t pin point “the bottom” but, I like to buy all the bottoms now that I understand how to read charts in order to have a better dollar cost average for long term stock investing. The reason I dollar cost average the bottoms, is because my personal psychology drives me crazy to see huge losses in my portfolio. Happy stock hunting and investing, y’all!
Live stream - Tech Giants Deliver Earnings, Canada Interest RateNikkei225, China50, ASX200, DJIA, S&P500, Nasdaq100, DAX40, FTSE100, DXY, Gold, Silver, Copper, WTI Oil, Sugar, Bitcoin, Bitcoin Cash, Ethereum, AUDUSD, AUDNZD, AUDCAD, NZDUSD, USDJPY, USDCAD, USDMXN, GBPAUD, GBPUSD, EURJPY, EURUSD.

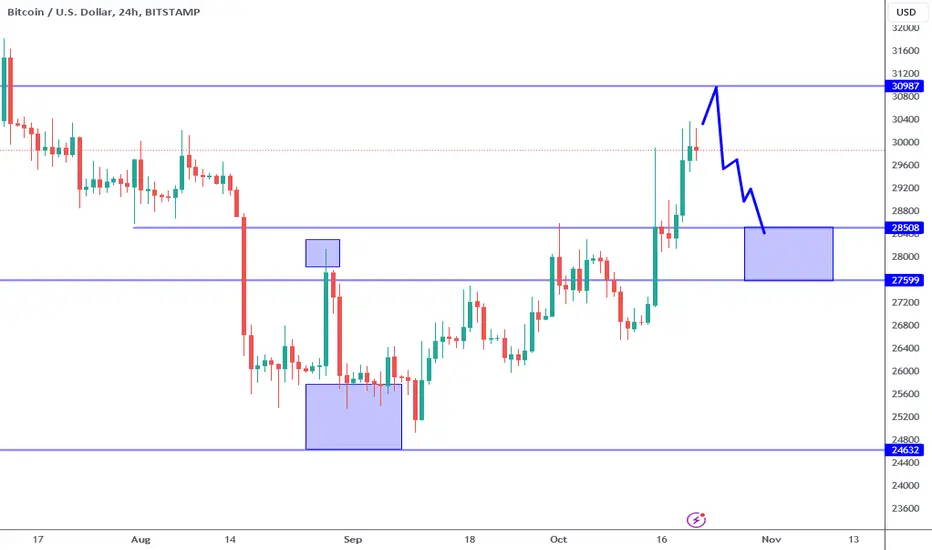
Bitcoin: Poised To Break 30K?Bitcoin short squeeze continues to the 30K resistance. In terms of momentum this move is significant and should shape smaller time frame strategies, BUT the bigger picture is another story. New resistance is the 31K AREA, new support is 27.5 to 28.5 AREA.
Based on the new developments in price structure, I suspect a potential test of 31K BUT I believe a break is low probability. A test of the 28.5 to 27.5 support area is more likely in my opinion over the coming week.
The bullish move (sparked by fake news apparently) appears to be a short squeeze. These type of moves are NOT sustainable over the long run and is nothing more than traders getting shaken out of short positions.
Gold has also expressed a similar move almost touching 2K. We can sit here and entertain ourselves as to "why" this may be and why it should continue. We can also watch Youtube videos featuring rocket ships on their title thumbnails (how original!). The REALITY is interest rates are at their highs (see US10Y). As long as money is getting more expensive to borrow, the probability of Bitcoin going beyond 31K is LOW.
Sure this may also be money looking for safety, but it is most likely temporary. Sustainable rallies and asset bubbles are driven by cheap money, NOT temporary catalysts based on fear.
IF Bitcoin cannot clear 31K decisively over the next week, then I will be looking for the test of the newly established support 28.5 to 27.5K (see drawing on chart). I would consider shorting this to be aggressive since it is against price structure. Waiting for bullish setups around 28K would be conservative. Either way, day trades or swing trades are most appropriate at these levels, these are not attractive levels for investing.
Thank you for considering my analysis and perspective.
VIX Clears 20-21, On Capitulation WatchAfter the VIX sagged to under 13 at times in the third quarter, October has brought about the bears and higher volatility, as if on seasonal cue. The S&P 500 peaked in late July right when many mega-cap tech stocks reported second-quarter earnings results. The AI-fueled rally that gave equities legs following the SVB crisis in mid-March finally lost steam.
The S&P 500 is now a stone's throw away from "correction territory" off the 4607 rebound peak a few months ago. The psychological level to watch is 4146 (-10%). As of this writing, equity futures point to an SPX near 4200 - below its rising 200-day moving average and testing the breakout point from late May. What could surprise some bulls would be a break under 4200 followed by a snapback higher.
All eyes are on the VIX. Wall Street's "fear gauge" has jumped to 23 this morning. While not screaming panic, the Volatility Index is at its loftiest level since March. The Q3 high of 31 could be in play, but I also notice that a series of lower highs has been the trend since way back in January of 2022 (39). Thus, it's reasonable to assert that the high 20s on the VIX could be the peak this go around. Of course, bullish stock seasonality really takes hold following this week (though pre-election years tend to see somewhat weaker Novembers compared to all years).

Inflation SupercycleOn the afternoon of October 3rd, 2023 something unprecedented happened in the U.S. Treasury market. For the first time ever, bear steepening caused the 20-year U.S. Treasury yield and the 2-year U.S. Treasury yield to uninvert.
Bear steepening refers to a scenario in which long-duration bond yields rise faster than short-duration bond yields, as bond yields rise across the term structure. In all past instances, inverted yield curves have normalized due to bull steepening . The probability that bear steepening would cause an inverted yield curve to normalize is so low that, until now, most term structure models excluded the possibility of it ever happening. In this post, I'll explain why this anomalous event is a major stagflation warning.
The chart above shows that the 10-year Treasury yield has been rising much faster than the 3-month Treasury yield throughout 2023, narrowing the once-deep yield curve inversion.
Since a yield curve inversion indicates that a recession is coming, and bear steepening indicates that the market is pricing in higher inflation for the short term, and even more so, for the long term, then bear steepening during a yield curve inversion indicates that high inflation may persist even during the recessionary phase. High inflation during the recessionary period is what defines stagflation . Since very strong bear steepening is normalizing a deeply inverted yield curve, the combination of these events is a warning that severe stagflation is likely coming.
High inflation has caused Treasury yields to surge at an astronomical rate of change. Bond prices, which move in the opposite direction as yields, have sharply declined causing destabilizing losses. The effects of these massive bond losses are not even close to being fully realized by the broad economy.
The image above shows a bond ETF heatmap with year-to-date returns. Large losses have been mounting across numerous bond ETFs. Long-duration Treasury ETF NASDAQ:TLT has declined by more than 18% this year. Click here to interact with the bond ETF heatmap
Despite the extreme pace of monetary tightening, many central banks are still struggling to contain inflation. Inflationary fiscal spending and ballooning debt-to-GDP levels are confounding central bank monetary policy efforts. In Argentina, for example, inflation continues to spiral higher despite the central bank raising interest rates to 133%.
The chart above shows that the central bank of Argentina has hiked interest rates to 133%. Despite this extreme interest rate, the country's inflation rate continues to spiral higher. In an inflationary spiral, there is no upper limit to how high interest rates can go.
As the Federal Reserve tightens the supply of the U.S. dollar -- the predominant global reserve currency -- all other countries (with less demanded fiat currency) generally must tighten their monetary supply by a greater degree in order to contain inflation. If a country fails to maintain tighter monetary conditions than the Federal Reserve, then the supply of that country's (lesser demanded) fiat currency will grow against the supply of the (greater demanded, and scarcer) U.S. dollar, causing devaluation of the former against the latter. In effect, by controlling the global reserve currency, the Federal Reserve is able to export inflation to other countries. This phenomenon is explained by the Dollar Milkshake Theory .
The forex chart above shows FX:USDJPY pushing up against 150 yen to the dollar. The longer the Bank of Japan continues to maintain significantly looser monetary conditions than the Fed, the longer the yen will continue to devalue against the U.S. dollar.
The meteoric rise in bond yields is particularly concerning because it has broken the long-term downtrend, signaling the start of a new supercycle. After hitting the zero lower bound in 2020, yields have rebounded and pierced through long-term resistance levels.
The chart above shows that the 10-year U.S. Treasury yield broke above long-term resistance, ending the period of declining interest rates that characterized the monetary easing supercycle.
We've entered into a new supercycle, one in which lower interest rates over time are a thing of the past. The new supercycle will be characterized by persistently high inflation. It will start off insidiously, with brief periods of disinflation, but over the long term it will accelerate higher and higher, ultimately causing today's fiat currencies to meet the same fate that every fiat currency in history has met: hyperinflation.
* * *
Important Disclaimer
Nothing in this post should be considered financial advice. Trading and investing always involve risks and one should carefully review all such risks before making a trade or investment decision. Do not buy or sell any security based on anything in this post. Please consult with a financial advisor before making any financial decisions. This post is for educational purposes only.

Pinefest #1This Pinefest was closed October 28 2023. Congratulations to its winner, alexgrover with this script .
█ CHALLENGE
Create three functions that will return the exact value where two data series intersect: crossValue(source1, source2)
crossoverValue(source1, source2)
crossunderValue(source1, source2)
When a cross occurs, the functions must return the intersection's value. When no cross occurs, they must return na .
█ SUBMISSIONS
Prepare your entry as a private open-source script publication, including a detailed description explaining to its audience how it works and can be useful, just like public scripts published in Community Scripts . Your private publication must comply with our Script Publishing Rules .
Submit your entry as a comment in the Comments section below, with a link to your private publication. This way, all TradingViewers can view submissions. Note that publishing links to private publications is against House Rules; we make an exception for our Pinefest submissions.
No public script publications will be accepted as entries. Participants who publish their entries publicly will be disqualified, and their publication will be hidden. Entries must be your own work. Calls to functions of previously published libraries (by you or others) are allowed, as is the use of a private library accompanying your entry.
You have one week to submit your entry. Submission deadline: 28 Oct 2023, 12:00 UTC
If you have questions about this Pinefest, please post a comment below.
█ EVALUATION CRITERIA
A PineCoders committee will evaluate all submissions based on the following criteria:
• Submission date
• Solution to the challenge
• Code efficiency
• Code readability
• Description
• Visuals
• Script usability
• Compliance with our Script Publishing Rules
In case two or more publications reach an identical final evaluation, the earliest submission will win. Committee decisions are final.
█ REWARDS
The winner of this Pinefest will receive 500 USD and publish their script publicly in our Community Scripts . Their publication will also be awarded an Editors' Pick , for which the winner will receive an additional 100 USD . Authors of the five highest-scoring submissions will be awarded TradingView merchandise.

NFLX Price Soars 12% after Strong ReportYesterday's closing price was 345.83, but this morning, NFLX's price rose above USD 390 per share in premarket trading. The reason is a strong report:
→ earnings per share = USD 3.73, expected = USD 3.49;
→ revenue = USD 8.54 billion, a year ago = USD 7.9 billion.
→ the main surprise is that the number of subscribers grew by an impressive 8.76 million in the third quarter (about 6 million were expected). The number of subscribers worldwide is approaching 250 million.
Given the increase in demand for its service, Netflix has decided to raise the price of its basic plan in the US to USD 11.99 per month from USD 9.99, and raise the price of its premium subscription to USD 22.99 per month from USD 19.99. This could attract more earnings per share in the future, which is what has helped NFLX's price soar.
From the technical analysis point of view:
→ NFLX price returns to the ascending channel that was in effect in 2023 and seems to be becoming relevant again. The false breakout pattern could become a support zone in the future.
→ NFLX price exceeded USD 370 per share.
Since early September, NFLX has been a laggard in the NASDAQ index, but after the report it may become one of the leaders. "While we have much work to do to build out this business, we're making good progress and laying the foundation for what we believe should be a multibillion-dollar revenue stream over time," Netflix executives wrote in a letter to shareholders.
Resistance to a powerful bullish impulse may come from:
→ psychological level of USD 400;
→ level at USD 412 – during the summer, the level provided support. But it was broken on September 13-14, and with a bearish gap, which could slow down the rally if the price of NFLX reaches this level. Also note that here is the Fibo resistance level of 50% of the decline A→B.
According to TipRanks, analysts have a target price of USD 454 for NFLX, but given its recent performance, the forecast could be raised.
This article represents the opinion of the Companies operating under the FXOpen brand only. It is not to be construed as an offer, solicitation, or recommendation with respect to products and services provided by the Companies operating under the FXOpen brand, nor is it to be considered financial advice.

The Life of Bitcoin: The definitive Historical Count Pt.3This is Part 3 of my epic series breaking down every major, relevant Segment in Bitcoins' price history, and explaining how they fit into the 'Historical Elliot Wave Count.' In short, what this Count implies is nothing less than astonishing: Essentially Bitcoin has just completed a decade long, (Running Triple Three) Wave 2 Correction and is now in an extremely powerful Wave 3 that should take the price to over 10 Million $ per coin, with the bulk of this appreciation (if not all) occurring within the next 5-10 years. See my published chart (which preceded the series) to view what the massive, Wave 2 Correction looks like when zoomed out, as well as a bit of the rationale that supports this Count:
Snapshot
Published Chart
Also, for more context as to what this series is all about, have a look at parts 1 and 2:
The Life of Bitcoin: The definitive Historical Count Pt.1
The Life of Bitcoin: The definitive Historical Count Pt.2
To date, the historical chart can be seperated into six Segments, I will be continuing to dedicate a post (a part of the series) to each of them. The term Segment should be taken loosely to mean a Section of the market data eligible for Classification as a Wave to be included in a larger Count. In this post, Segment 3 will be the focus. Again, I will continue to build upon the theme of speaking from a Direct perspective (analyzing one piece of the puzzle under a microscope), yet also gradually bridge the gap with an InDirect perspective (how the pieces of the puzzle all fit together, and how such necessarily informs the conclusions about any given piece). With the above in mind, consider that the start of every Segment or Wave is the end of another, thus why I thought it would be valuable to include a brief revisiting of Segment 2. Before jumping into Segment 3, I will again include a small taste of the flavor of the times.
Title for this Segment: "Venture Capital continues to flood into Bitcoin, Wall Street takes note"
In Post 2, we spoke about the fall of Mt. Gox, and whispers of the 'Tech guys' dipping their toes in the water amidst Bitcoins first ever prolonged bear market (before the 2013 rise it was a highly illiquid market). Throughout this bear market, government-confiscated Silk Road coins were continually auctioned off, serving to dampen all attempts at a trend-changing rally. It was amidst this backdrop that Bitcoin found its' first 'buyer of last resort' in Tim Draper, in this sense, he was basically the Michael Saylor of the times.
Without batting an eye, Draper, again and again, packed the trunk with three digit coins, instilling a confidence in the space the new, immature market had never seen. Not only did this buying have a very real effect on the supply-demand dynamic of an asset that aims to be the future of money, but it also influenced others in the shadows to begin to publicly speak out not just about their own positions but more importantly, their intentions to support the space with the Capital it would need to grow into the powerhouse it has now become. Draper (in addition to Andreesan, Hickey, Pantera, and a few others), was the first domino to fall: Segment 3 was characterized by all the rest following suit, piling into the space continuing to build out the Wallet, Exchange, and Merchant-Proccessing infrastructure. Similarly, Barry Silbert continued to bet big on Bitcoin offering the first 'legitimate' investment vehicle, a work-around of sorts that allowed money to flow in (which otherwise could not have using 'shady' overseas exchanges), forcing Wall Street to at least acknowledge the nascent asset. Ultimately, the CME would mark the top of the rise offering the first ever Bitcoin Futures market.
There were also another two topics dominating the 'flavor of the times' that bares mentioning: The Bitcoin Fork Wars Ethereum Mania. In the beginning of Segment 3, all attention was on what would be the culmination of a raging debate amongst the Bitcoin community: The block size debate. As the price began to rise from the ongoing influx of money mentioned earlier, uncertainty around how the block size debate would be resolved (or rather which approach, or combination of approaches, would win out, and how) loomed and served as the cold water to be poured on every potential acceleration of the new bull market. In the essence of staying on track with this post, I will condense the sequence of events to this brief summary: The decision by Bitmain to hard fork the Bitcoin Protocol resulting in a distinct coin Bitcoin Cash, the failure of an 'industry led' attempt to force a block size increase into the adoption of Segregated Witness ('SegWit2X'), and the adoption of Segregated Witness by Litecoin (as well as the threat of a 'User Activated Soft Fork') all contributed to any uncertainty the market migh have had about this ongoing debate being removed, thus leading to the 2017 blow off top.
Alongside all of this, Ethereum had become a household name, enabling and encouraging huge speculation to enter the market. Most of this speculation came from retail investors, who were intoxicated by the marketing of a more exotic Bitcoin, but this version had a 'boy genius' figurehead, providing a founder they could worship like the Tech Companies they were familiar with investing in. Prompted by the sound financial advice of CNBC and others (sarcasm), the crowd followed into Ethereum, ICOs, Ripple, and others setting the stage for the eventual popping of the bubble.
Of course, there was much more happening at the time, but hopefully the above should suffice in giving at least a feel for what occurred during this Segment. Now, let's get to the meat and potatos and dig into some charts. Segments 1 and 2 required many snapshots to cover, alternatively, going forward my analysis will likely be more consice as the stage has, for the most part, been set. I was able to condense both the Time and Wave Type analysis of Segment 3 into one main Chart Snapshot (which should also be the image in the published chart), this represents the complete picture of Segment 3 analyzed *from a Direct perspective*, it is the last snapshot. The first few snapshots help provide some preliminary techniques that help inform how both Segments 2 and 3 were counted, and how they each fit together and fit within the larger Historical Count.
Chart Snapshots (see below for a short description and/or any relevant notes):
-'Where' to begin Segment 3.
The ability to discern 'where' a Segment begins and ends is one of the most overlooked requisite skills needed to master the Elliot Wave Principle. Similar
to determing 'Where to begin your Count' in Part 1, getting this right is crucial, it establishes what will help serve as the foundation for your analysis.
-Where the price data connects 'Cleanly' (incorrect approach to determining the beginning of Segment 3).
-'Exposed Points' Duration, Degree,
Structure, and Type in and of the
Segments.
-Snapshot of the Published Chart.
