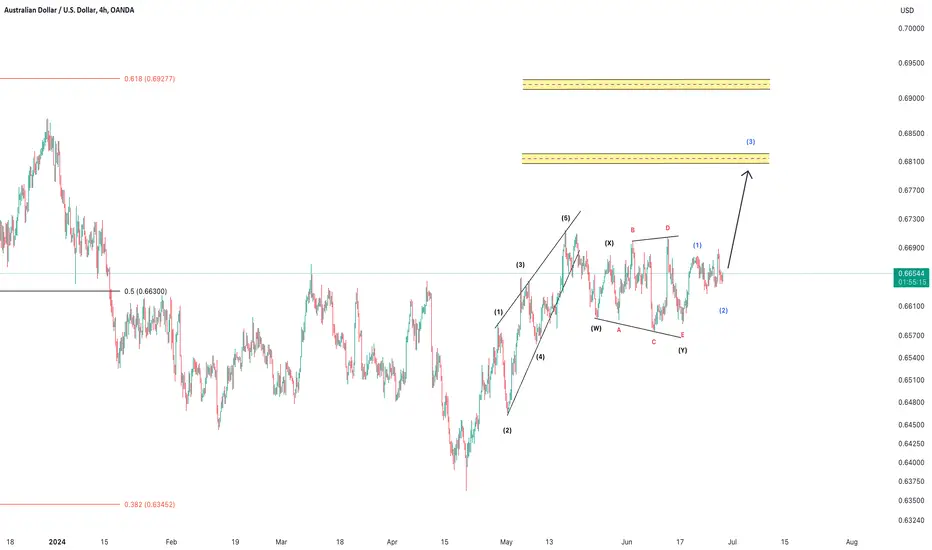
AUD/USD swing trade setup
This AUD/USD pair could completed its correction already
Wave (1) = diagonal
Wave (2) = complex correction W-X-Y (expanded triangle)
Wave 1-2 (expanded flat completed last night 26/6/2024) of 3
If this wave count is valid, possible short term target (days-weeks) are
1) 0.68
2) 0.694
Price should not go lower than 0.664
If it goes lower than 0.658 -> this idea will be invalidated
Looking at DXY, this bullish idea may be possible
Community ideas
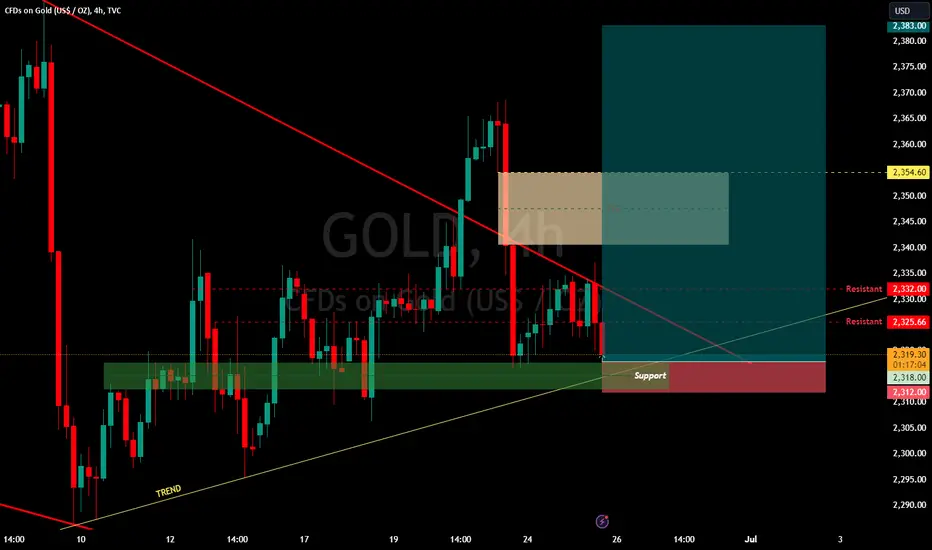
GOLDTrend Analysis
Downward Trend Line: There is a red downward trend line indicating that gold has been in a downtrend. This line acts as a resistance level.
Support Zone: There is a green support zone around the $2,318.00 level. This indicates that there is buying interest around this price, and it has historically acted as a support level.
Resistance Levels
First Resistance: Around $2,325.66.
Second Resistance: Around $2,332.00.
These resistance levels indicate where selling pressure has previously been strong enough to halt upward price movement.
Fair Value Gap (FVG)
A Fair Value Gap is highlighted in a beige rectangle from approximately $2,340.00 to $2,354.60. This gap suggests an area where the price might move quickly if it enters this zone, potentially due to a lack of liquidity or previous rapid price movement.
Price Action
Current Price: As of the latest data on the chart, gold is trading at $2,319.26.
Recent Movement: The price recently bounced off the support zone but faced resistance near $2,332.00, aligning with the downward trend line.
Potential Scenarios
Bullish Scenario: If the price can break above the resistance at $2,325.66 and subsequently the downward trend line, it may target the next resistance level at $2,332.00. A break above this level could lead to a move towards the Fair Value Gap, potentially reaching the upper boundary around $2,354.60.
Bearish Scenario: If the price fails to hold the support level at $2,318.00, it might move lower, with the next significant support level potentially being around $2,312.00. Further bearish movement could target levels below $2,310.00.
Key Levels to Watch
Support: $2,318.00, $2,312.00.
Resistance: $2,325.66, $2,332.00, $2,354.60 (FVG zone).
Ichimoku Watch: Nvidia Eyeing Ichimoku Cloud Support In three successive days of selling, triggered after a bearish outside reversal formed on Thursday last week from all-time highs of $140.76, Nvidia (ticker: NVDA) has shed approximately -15.0% from the peak.
The company’s market value dropped more than US$500 billion to US$2.91 trillion, consequently pulling the chipmaker back to third place after briefly becoming the most valuable company in the world and surpassing Microsoft (ticker: MSFT) and Apple (ticker: AAPL).
Behind the sell-off is a combination of the CEO, Jensen Huang, selling almost US$100 million worth of shares a handful of days before (and after) it became the world’s most valuable company, along with worries about the company’s effect on the broader stock market indexes, and profit-taking after what has been a meteoric rise.
Ichimoku Cloud Support
As can be seen from Nvidia's daily chart, the stock’s recent movement has easily crossed below the Conversion Line (blue at $129.40) and is fast approaching the Base Line (red at $116.28), which could deliver support.
However, should further downside develop, the Ichimoku Cloud support (made up of the Leading Span A at $122.95 and the Leading Span B at $108.23) could be seen as a logical downside target for sellers in this market at the moment. You will also see that the chart offers support at $96.77 around the Ichimoku support zone.
Price Direction?
While it is unlikely that the party is over for Nvidia, the current correction will likely be viewed as an opportunity to get in at cheaper prices. Dip buyers, therefore, may seek suitable support levels to enter this market long. The combination of support just below $100.00 at $96.77 and the Ichimoku Cloud support area could be worthy of the watchlist.

Nvidia - Massive rejection soon!NASDAQ:NVDA is clearly overextended after the +1.000% rally and ready for a correction.
Trees simply do not grow to the sky. And neither do stocks, especially Nvidia. I know that a lot of people are calling price targets of $250 and beyond, but we still have to respect gravity and the nature of fear and greed. Nvidia is simply overextended a retesting a 6 year resistance trendline. I do expect a correction between -20% and -30%, but also -60% is definitely possible.
Levels to watch: $120, $50
Keep your long term vision,
Philip - BasicTrading

BTC Update after the Nuke. Current thoughts and potential tradeBitcoin just dipped into 58k level, through a significant keylevel and imbalance.
Will it go up? Will it go down? I am discussing in the video.

GBPJPY - BIG BULLISH CONTINUATION OPPORTUNITY Here's a big potential bullish trend continuation opportunity on the GBPJPY using structure and price action.
In this video I walk you through the 4-step I.P.D.E. process used to set up the trading idea & talk about different ways to both get in & out of the trade.
We'll probably revisit this opportunity as it develops so make sure you watch this space.
If you have any questions or comments about the setup (or anything else) please leave it in the comment section below as I do read each and every one.
I wish you a great week in the markets - Akil

TSLA : its now or never!TSLA is coiling to make a large directional move.
The Question is...up or down?
With August appraoching quickly, this could be a key pivotal shift in TSLA business model
Once they announce their ROBO - TAXI, this could be a huge winning success for the company and stock .
A ROBO - TAXI could be a mega disruption for many sectors and companies.
I think theres a strong chance that investors are going to start bidding up this name ahead of that 1st week of August in anticipation of the massive launch.
Keep in mind with every new launch comes hiccups and capital expenditures so its not always smooth sailing.
Lets face it though...no other company has attempted this yet and if anyone can have success it would be Elon.
I also think now that Elons pay package has been approved, he really is incentivized to grow this business.
Will his Optimus Robot be the new taxi, uber or Lyft drivers?

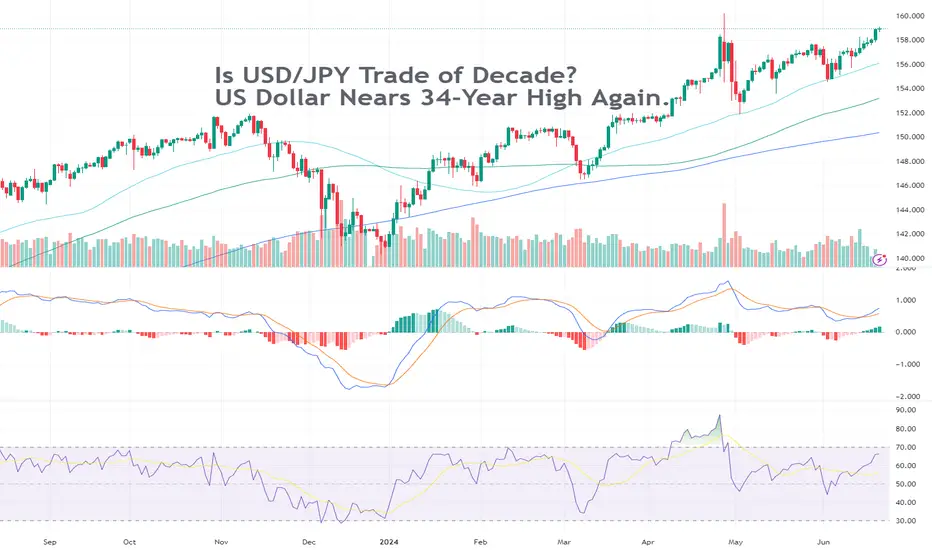
Is USD/JPY Trade of Decade? US Dollar Nears 34-Year High Again.If you’re a ‘90s baby, the yen is the weakest you’ve ever seen it. Putting it back with the cool guys in forex town isn’t going to be easy. In this Idea, we discover why.
Yen Languishes in 34-Year Lows
The Japanese yen is trading at a 34-year low against the stronger US dollar. This means that the volatile USD/JPY pair is flying high. Very high. To many, this is the opportunity of a lifetime — pop a short, load up on the leverage and go for the jugular (to use Soros slang ). Only that it’s not as easy as it looks.
So not-easy that there’s even a term for that. It’s called “widow maker trade” and it describes those unfortunate souls who dare to bet against the Bank of Japan in hopes of anticipating the right direction. It’s so difficult to predict the path of Japan’s interest rates that many have seen their fortunes wiped out in trying to do so.
So why’s the yen so badly hurt? Until recently, Japan’s central bank was the only one in the world to flaunt negative interest rates. It was holding on to an easy-money regime to stimulate economic growth — low to negative rates encourage businesses and consumers to borrow cheap money and spend it on whatever they want.
Biggest Loser on Forex Board
But this loose money policy has a downside — it makes the local currency highly unattractive. The Japanese yen is the biggest loser among the major currencies on the forex board so far in 2024. It’s down more than 13% against the dollar this year.
Against that backdrop, in March, the Bank of Japan abandoned its negative rate regime and hiked interest rates for the first time since 2007. The shift provided little relief to the yen.
The USD/JPY this week blasted beyond ¥159 and extended its winning streak to seven days in a row. But bulls’ efforts to carry the exchange rate above the ¥160 milestone might meet an archnemesis.
Japanese officials have been monitoring the speculative moves around the yen and have said many times they’re ready to intervene by buying boatloads of it. Traders, however, have already seen this play out. And they've seen the aftermath, too.
A Failed InterYention
In late April, the Japanese yen tumbled beyond the key ¥160 level to the dollar, hitting ¥160.20 — a low last seen in 1990. Japan then decided to lean against the skyrocketing dollar and sank as much as $60 billion going long the yen and shorting the dollar.
Briefly, the yen rose about 5% before bargain-hungry traders were back for more.
Moral of the story? The downturn of the yen is predictable and until the Bank of Japan introduces a more aggressive policy to buck the trend, it may remain vulnerable to attacks.
More of the Same?
Meanwhile, bullish traders are excited to try their hand at shooting the dollar-yen pair to a fresh 34-year high. It must be noted, however, that the exchange rate is overstretched and overbought. This skews the risk-reward ratio and makes the upside look fairly limited, at least in the short term. Or does it?
Zoom out, and you’ll see the yen was trading at ¥300 to the dollar back in the ‘70s. And that’s not something Japan wants to see now. A cheap yen is generally good for exports but it makes imports a lot more expensive. And that’s where the Asian economy is getting its technology, energy, cars, and many foods from.
Japanese officials, namely the Ministry of Finance, remain tight-lipped about any potential intervention. What’s more, the Bank of Japan joins the silence with no forward-looking guidance on future interest rate hikes.
And all this means one thing — yen volatility is bound to continue as traders engage in some extra spicy speculation fundamental price discovery.
Long or Short?
If you’re in the trade, which side are you on? Are you long the dollar-yen or short it? Let us know in the comments below!
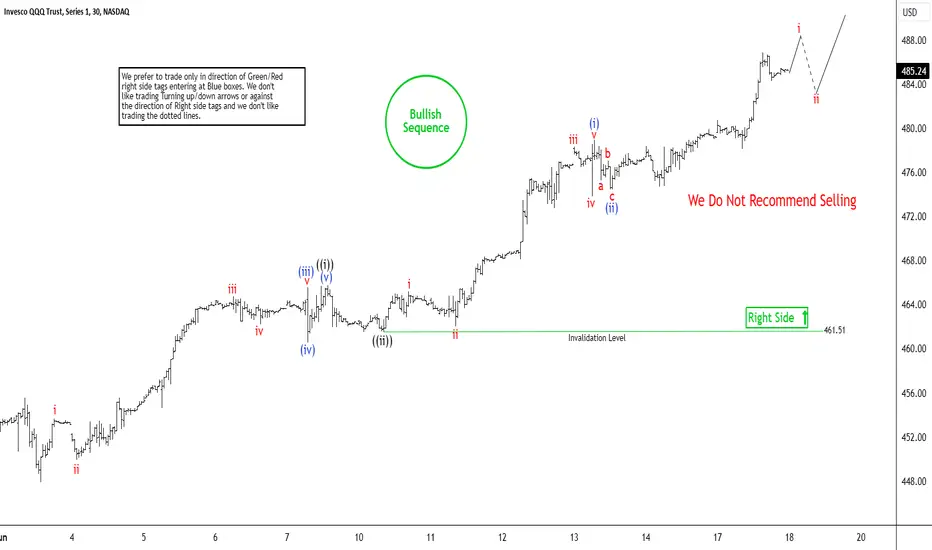
Elliott Wave Expects Nasdaq 100 (QQQ) to Continue HigherShort Term Elliott Wave in Nasdaq 100 ETF (QQQ) suggests it shows a bullish sequence from 4.20.2024 low favoring more upside. Up from 4.20.2024 low, wave 1 ended at 461.5 and pullback in wave 2 ended at 443.06. The ETF has extended higher in wave 3. Internal subdivision of wave 3 is unfolding as a nesting impulsive structure. Up from wave 2, wave (i) ended at 455.58 and wave (ii) ended at 447.9. Wave (iii) higher ended at 465.55 and pullback in wave (iv) ended at 460.54. Last leg wave (v) ended at 465.74 which completed wave ((i)) in higher degree. Pullback in wave ((ii)) ended at 461.5 and the ETF has extended higher.
Up from wave ((ii)), wave i ended at 465.19 and wave ii dips ended at 462.03. Then it rallied higher in wave iii towards 478.28 and wave iv pullback ended at 473.80. Last leg wave v ended at 478.95 which completed wave (i) in higher degree. The ETF then pullback in wave (ii) towards 474.42. Near term, as far as it stays above 461.51, expect pullback to find support in 3, 7, or 11 swing for further upside.
TSLA / NVIDIA / INTC - The rotation trade?TSLA has been upderperfing the market, but is now showing some signs of potential life since Elon musks pay package was approved.
A bullish breakout pattern is on watch.
NASDAQ:INTC looks ready for a bullish move. Just like NASDAQ:ADBE & NASDAQ:TSLA popped on earnings, it looks like NASDAQ:INTC could be the next oversold S&P500 stock to bounce.
If we see any weakness in NASDAQ:NVDA we may see capital rotate into other cheaper semis.
S&P500 setting nee ATH.

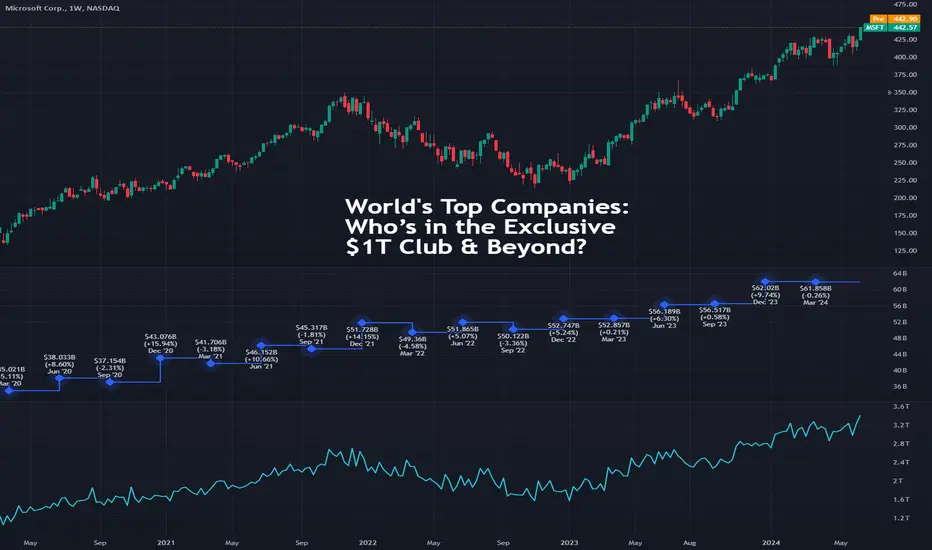
World's Top Companies: Who’s in the Exclusive $1T Club & Beyond?But wait, it gets even more exclusive than a mere $1 trillion! There’s a $2 trillion club with just a single player and a super-duper hyper-elite ultra club of $3 trillion. Can you name the participants?
Being part of the world’s biggest companies isn’t easy. It may look easy — these corporate giants gain billions of dollars in market cap before you make your morning cup of coffee (especially if you’re drowsy after a late-night options trading action).
In this Idea, we look at the dynamic docket of the world's most expensive companies, neatly stacked up in the TradingView Top companies list .
The world has never seen so much money concentrated in a few select companies. Fun fact: all of them had humble beginnings like starting out of a garage and trying to get clients through cold calling — but ended up changing the world with things like the iPhone.
Today, a total of seven companies are worth $1 trillion or more each and three of them boast a valuation of over $3 trillion each. Can you guess the common theme across all? It starts with “A” and ends with “I”.
Artificial intelligence (AI) has been popping these stocks to record highs for months now. And there’s no sign of slowing down the insane growth. All of these companies, except for one that’s not based in the US, are listed in the broad-based S&P 500 index and make up about 30% of its total weight. Can you spot them in the S&P 500 Stock Heatmap ?
Note that all numbers and rankings are measured by the companies' performances through mid-June of this year.
Let’s roll!
1. 🧩 Microsoft (ticker: MSFT )
Microsoft is the world’s most valuable company worth a staggering $3.289 trillion. The software maker quickly swooped in to lead the AI race by backing ChatGPT parent OpenAI . It has invested $13 billion in the startup.
Microsoft’s growth is largely driven by the adoption of AI across its product suite. Artificial intelligence-powered assistants such as Microsoft Copilot can operate without human intervention or direct commands, making companies’ lives easier and more productive.
💰 Market Cap : $3.289 trillion
🐮 Revenue : $211.91 billion (2023)
👶 How It Started : Microsoft's first major deal was with IBM in 1980. They developed the operating system for IBM's new computer, which they named PC DOS. The deal was worth $50,000.
2. 🧩 Apple (ticker: AAPL )
Apple has entered the chat. The iPhone maker just recently figured out how to play catch up in the AI race after doing virtually nothing for a year. Apple Intelligence — the company’s response to AI — got investors excited about the future growth prospects of iPhone sales and overall revenue generation.
The AI announcement, made during Apple’s annual developer conference, helped lift its shares by 10% and propelled the company to the number one spot, dethroning Microsoft. Briefly, though .
💰 Market Cap : $3.258 trillion
🐮 Revenue : $383.29 billion (2023)
👶 How It Started : Apple traces its humble origins to Steve Jobs’s garage where he and another founder — Steve Wozniak, would test the products before selling them over the phone. A third founder — Ronald Wayne — was in the company for just 12 days and sold his 10% stake for $800. That stake today is worth more than $325 billion.
3. 🧩 Nvidia (ticker: NVDA )
Nvidia is the highflyer technology company responsible for building out the infrastructure layer of the artificial intelligence revolution. Its coveted AI chips are the hottest commodity for all other technology giants and that’s where Nvidia’s power comes from.
Earlier this month, Nvidia’s market value crossed $3 trillion for the first time, overtaking Apple and becoming the third company to ever breathe the rarefied air of so much money. First place coming soon?
💰 Market Cap : $3.244 trillion
🐮 Revenue : $60.92 billion (2023)
👶 How It Started : Jensen Huang, who never interviews wearing anything other than a black jacket, was cleaning tables and washing dishes at his local Denny’s diner. And that’s where he sat with his two friends — hardware savant Chris Malachowsky and software geek Curtis Priem — when he founded his chip making business Nvidia.
4. 🧩 Alphabet (ticker: GOOGL )
Alphabet, parent of search dominator Google, is taking on Microsoft in the rushed race to market an AI assistant. The company’s first generation AI bot, Bard, suffered a major blow at launch (it returned false information). Subsequent attempts failed to present any threat to ChatGPT so Alphabet rebranded it to Gemini.
💰 Market Cap : $2.194 trillion
🐮 Revenue : $307.39 billion (2023)
👶 How It Started : The founders, Larry Page and Sergey Brin, initially worked on their search engine project from their dorm rooms at Stanford University. They later moved to a garage in Menlo Park, California, which was owned by Susan Wojcicki, former CEO of YouTube. Google purchased YouTube for $1.65 billion in 2005. Today, YouTube generates that amount in two weeks.
5. 🧩 Amazon (ticker: AMZN )
Amazon, the ecommerce and cloud computing heavyweight, is riding the AI wave thanks to its cloud computing division Amazon Web Services (AWS). It’s the company’s cash cow, revenue generator, profit driver, or however you want to call it.
For the most recent quarter, AWS hit $100 billion in annual revenue run rate — a financial metric that estimates future growth based on current performance. Or the opposite of "Past performance is no guarantee of future results."
💰 Market Cap : $1.911 trillion
🐮 Revenue : $574.78 billion
👶 How It Started : Amazon was founded by Jeff Bezos in 1994 after he left his analyst job at the hedge fund D. E. Shaw & Co, inspired by the rapid growth of the internet. He took the risk of selling things online and picked books due to their wide selection and ease of distribution. And the rest is history.
6. 🧩 Saudi Arabian Oil (ticker: 2222 )
An outlier in the rankings saturated by tech giants, Saudi Arabian Oil is the world’s largest oil producer. Also known as Saudi Aramco, it’s the single most important revenue source for the Saudi government (makes up 92% of its budget to be exact). In 2022, when energy prices boomed following the Covid lockdown, Aramco pocketed record profits of $161 billion.
💰 Market Cap : $1.783 trillion
🐮 Revenue : $440.80 billion (2023)
👶 How It Started : Saudi Aramco was established in the 1930s when Standard Oil of California discovered oil in Saudi Arabia and formed the California-Arabian Standard Oil Company. By the 1980s, the Saudi government had fully nationalized the company, renaming it Saudi Aramco.
7. 🧩 Meta Platforms (ticker: META )
Last on our list of $1 trillion companies and beyond is Meta Platforms, previously known as Facebook. The brainchild of Harvard dropout Mark Zuckerberg had a rough 2022 with more than 70% wiped out of its value and knocking it out of the $1 trillion club.
The following year, 2023, was a lot more generous to the social media behemoth as it gained nearly 200% and jumped right back into a 13-digit valuation. The company was up another 45% for the first half of 2024.
💰 Market Cap : $1.279 trillion
🐮 Revenue : $134.90 billion (2023)
👶 How It Started : Facebook was initially called "Thefacebook" and was limited to Harvard students when it first launched on February 4, 2004. The company’s first office was Mark Zuckerberg’s dorm room.
📣 Let’s Hear from You!
What’s your favorite pick of the world’s top seven companies ranked by market capitalization? Let us know in the comments!
You Need An Edge In The Markets - Tradingview Has The Tools!👉📈 In the video, we look at a EURUSD trade opportunity, but more importantly, we delve into essential features and tools available on TradingView, which can considerably enhance your trading edge. Here’s what we cover:
✅ 1: Multi-Chart Layout:
- TradingView’s workspace allows you to view multiple charts simultaneously. This feature is particularly useful when analyzing currency pairs like EURUSD.
- By comparing different timeframes or related assets, you gain a broader perspective on market dynamics.
✅ 2: Currency Indexes:
- Currency indexes provide crucial insights. They help answer questions like:
Is the EUR (Euro) truly under pressure?
Is the USD (US Dollar) gaining strength?
- For instance, even if the EURUSD pair appears bearish, understanding the individual currency strengths is vital. Sometimes, two currencies may be trending in the same direction with one slightly stronger than the other.. you might look to avoid trading the currency pair associated with this scenario.
✅ 3: Entry, Stop Loss, and Target Levels:
- We explore how to identify optimal entry points, setting a suitable stop-loss, and define profit targets.
📢Leveraging TradingView’s tools, you can fine-tune your trading strategy and gain a real edge in the currency markets.
📢 Remember, steady conservative and consistant trading, along with rigorous risk management, is key. Happy trading! 🛡️🌟

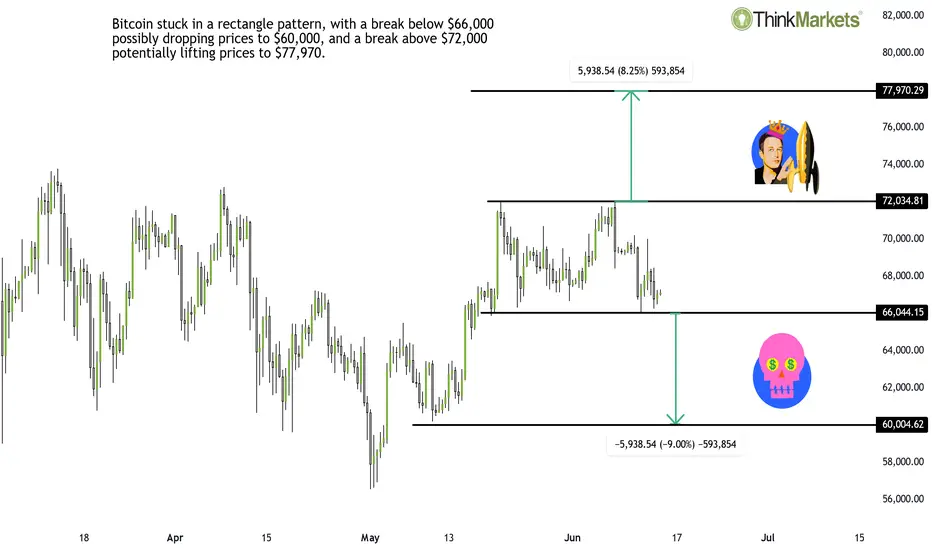
BTC looks ready to deliver a 9% moveBitcoin prices are currently stuck in a rectangle pattern. A break below $66,000 could potentially send prices down to $60,000, a drop of 9%. Conversely, a break above $72,000 could lift prices towards $77,970 per coin.
Recent trends show a stronger dollar, particularly against the Euro and British pound. If this strength continues, it could negatively impact Bitcoin prices, potentially leading to a break below the $66,000 support level. Additionally, the Nasdaq 100 is up 7.5% from its last swing low on May 31st without a major correction. While shorting the Nasdaq 100 is a high risk idea, a pullback is likely and could influence Bitcoin, pushing it below the critical $66,000 support.
If Bitcoin breaks out of this rectangle pattern, traditional risk management suggests placing a stop loss at the high of the breakout candle for a bearish break and below the breakout candle low for a bullish breakout. This strategy allows the price to return to the pattern but prevents it from moving too deeply, which could result in reaching the other side of the pattern.
As always, do your own research and proceed with caution. This content is not directed to residents of the EU or UK.
Any opinions, news, research, analyses, prices or other information contained on this website is provided as general market commentary and does not constitute investment advice. ThinkMarkets will not accept liability for any loss or damage including, without limitation, to any loss of profit which may arise directly or indirectly from use of or reliance on such information.
Mid-week check-in 6/13/2024Talking about my mistakes, observations, following rules, being systematic vs discretionary and just generally whatever comes to my mind. I do ramble a lot

Apple - Back to no.1 in the world!NASDAQ:AAPL is back to being no.1 in the world after rallying 11% in two days.
After moving higher +25% over the past two months, Apple is now back to being the most valuable company in the world with a market cap of 3.4 trillion dollars. This means that Apple is now back to leading the indices but Apple is also retesting resistance. A pullback is definitely likely considering that trees do not grow to the sky, but the overall trend is simply clearly bullish!
Levels to watch: $170, $215
Keep your long term vision,
Philip - BasicTrading

WTI Oil H4 | Potential bullish bounceWTI oil (USOIL) is falling towards a pullback support and could potentially bounce off this level to climb higher.
Buy entry is at 77.52 which is a pullback support.
Stop loss is at 76.30 which is a level that lies underneath a pullback support and the 38.2% Fibonacci retracement level.
Take profit is at 80.37 which is a multi-swing-high resistance that aligns close to the 50.0% Fibonacci retracement level.
High Risk Investment Warning
Trading Forex/CFDs on margin carries a high level of risk and may not be suitable for all investors. Leverage can work against you.
Stratos Markets Limited (www.fxcm.com):
CFDs are complex instruments and come with a high risk of losing money rapidly due to leverage. 68% of retail investor accounts lose money when trading CFDs with this provider. You should consider whether you understand how CFDs work and whether you can afford to take the high risk of losing your money.
Stratos Europe Ltd, previously FXCM EU Ltd (www.fxcm.com):
CFDs are complex instruments and come with a high risk of losing money rapidly due to leverage. 73% of retail investor accounts lose money when trading CFDs with this provider. You should consider whether you understand how CFDs work and whether you can afford to take the high risk of losing your money.
Stratos Trading Pty. Limited (www.fxcm.com):
Trading FX/CFDs carries significant risks. FXCM AU (AFSL 309763), please read the Financial Services Guide, Product Disclosure Statement, Target Market Determination and Terms of Business at www.fxcm.com
Stratos Global LLC (www.fxcm.com):
Losses can exceed deposits.
Please be advised that the information presented on TradingView is provided to FXCM (‘Company’, ‘we’) by a third-party provider (‘TFA Global Pte Ltd’). Please be reminded that you are solely responsible for the trading decisions on your account. There is a very high degree of risk involved in trading. Any information and/or content is intended entirely for research, educational and informational purposes only and does not constitute investment or consultation advice or investment strategy. The information is not tailored to the investment needs of any specific person and therefore does not involve a consideration of any of the investment objectives, financial situation or needs of any viewer that may receive it. Kindly also note that past performance is not a reliable indicator of future results. Actual results may differ materially from those anticipated in forward-looking or past performance statements. We assume no liability as to the accuracy or completeness of any of the information and/or content provided herein and the Company cannot be held responsible for any omission, mistake nor for any loss or damage including without limitation to any loss of profit which may arise from reliance on any information supplied by TFA Global Pte Ltd.
The speaker(s) is neither an employee, agent nor representative of FXCM and is therefore acting independently. The opinions given are their own, constitute general market commentary, and do not constitute the opinion or advice of FXCM or any form of personal or investment advice. FXCM neither endorses nor guarantees offerings of third-party speakers, nor is FXCM responsible for the content, veracity or opinions of third-party speakers, presenters or participants.

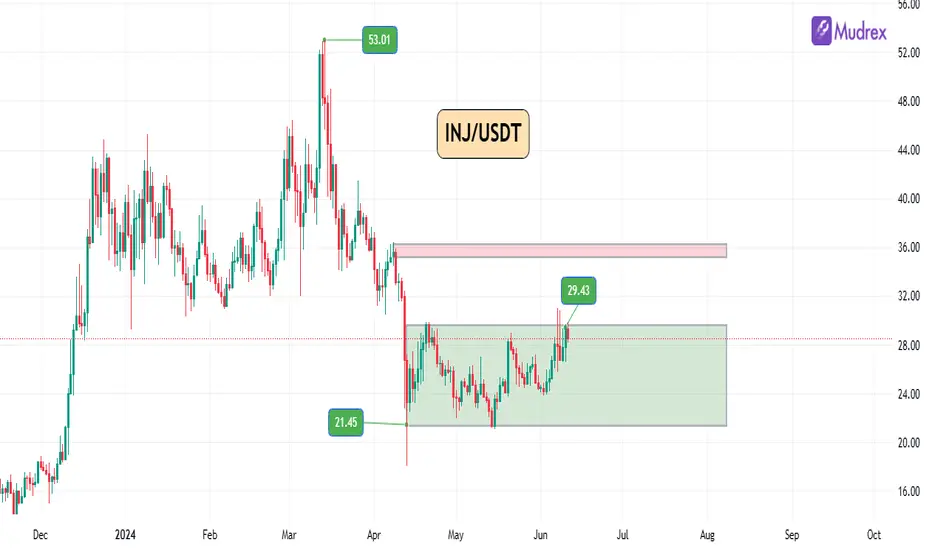
Injective Weekly AnalysisInjective (INJ) has been the biggest gainer of the week with a robust increase of 20.43%. After reaching an all-time high (ATH) of $53.01, INJ experienced a significant sell-off, filling the Fair Value Gap (FVG) on the daily timeframe and touching a low of $18.70 before quickly bouncing back. Currently, INJ is trading within a range of $21.54 to $29, facing multiple rejections around the $29 mark. Despite these rejections, INJ is showing a slight bullish trend, forming higher highs and lower lows. If INJ manages to break out of this range, it could potentially surge to the next resistance level at $34.
On both daily and weekly timeframes, moving averages strongly indicate a bullish signal, while oscillators remain neutral. Fundamentally, INJ is a strong asset to include in a portfolio. It is advisable to consider buying INJ during price dips to take advantage of potential discounts.
Bitcoin 1.2B of Oi is trapped. How WHALES WOULD TRADE IT?Bitcoin 1.2B of Oi is trapped. How WHALES WOULD TRADE IT?
iN A VIDEO I SHARED MY IDEA ABOUT btc and how i plan to trade it
Price at this moment is in middle of local range - i prefer to take a trade after Clear SL hunts and squeezing. Becasue those trapped trades should be liquidated

Weekly Analysis & Market Crash PredictionHere's a video going over what I'm watching heading into the week and what I expect leading up to FOMC. I'll do some more FOMC and market analysis before then as we get closer to Wednesday. Overall, I don't expect much, I think we'll have downside and chop until then. Either way, any moves made on Monday and Tuesday can be wiped out insantly on Wednesday, so I'll focus on some small day trades and averaging into longer dated puts for Monday and Tuesday most likely.

Bearish Reversal Insight AUDCAD Technical Analysis & Trade SetupThe AUDCAD currency pair is currently forming a Bearish Butterfly Harmonic Pattern (XABCD), indicating a potential bearish reversal. Point D, the Potential Reversal Zone (PRZ), is aligned with a key resistance area and intersects a daily trend line, providing a strong confluence for a bearish bias.
Potential Reversal Zone (PRZ) and Key Resistance:
Point D is identified as a critical area where the price is likely to reverse. This zone is reinforced by a key resistance level, adding validity to the bearish outlook. The intersection with the daily trend line further strengthens the likelihood of a trend reversal from this point.
Entry Strategy:
To capitalize on the expected trend reversal, the entry should be made at the breakout of the support level near 0.90450. This level is crucial as a confirmed breakout here would signal the start of a bearish trend.
Stop Loss Placement:
A stop loss should be placed above the resistance level at 0.91400. This placement ensures protection against potential false breakouts and market volatility.
Take Profit Targets:
The take profit targets for this trade are as follows:
TP-1: 0.89500
TP-2: 0.88550
TP-3: 0.87600
These targets are strategically set at significant support levels to maximize gains while managing risk effectively.
Conclusion:
The formation of the Bearish Butterfly Harmonic Pattern, combined with the confluence of the PRZ, key resistance area, and daily trend line, presents a compelling bearish setup for AUDCAD. By entering at the support breakout, setting a prudent stop loss, and targeting key support levels, this trade offers a favorable risk-reward profile for traders.

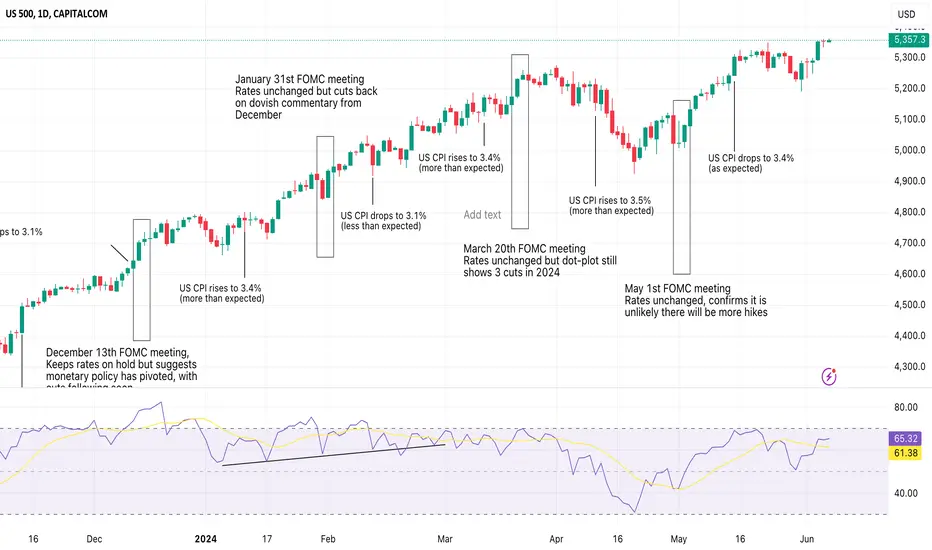
S&P 500 faces resistance ahead of crucial data and FOMC meetingThe bullish drive has been revived in US equity indices after a few weeks of downside pressure. The S&P 500 and the Nasdaq both broke to new highs on Wednesday driven mostly by technology stocks. The ADP May employment report also helped revive some buying appetite as it came in below expectations. There isn’t a very good correlation between the ADP data and the non-farm payroll data released later today, but markets took benefit in the weaker reading as a sign of a possible cooling in the US labour market, which could allow the Federal Reserve to cut some time in the coming months.
Money markets are assigning a 97% chance of no change from the central bank when it meets next week. But the ECB’s 25 basis point cut delivered on Thursday may have started to put traders in a better mood when considering the possibility that the Fed will actually be able to cut this year. For now, a 25-basis point rate cut is fully priced in by November, but Powell and his team have continued to be quite hawkish up until now, dampening hopes. Next week’s meeting will be a big test for markets as they’ll want an update on how the central bank expects things to unfold. Before the meeting, we’ll see the CPI data for May, another important market event.
On the chart, the S&P 500 continues to show potential for upside movement, but the rise ascent is becoming more laborious. Thursday saw little movement for the index as traders took a pause ahead of the latest labour data released on Friday. There is likely to be a lot of focus on the wage component of the data, as wage inflation has been sticky in recent months, and a key reason stopping the Federal Reserve from cutting. If the data comes in softer than expected, then it is likely that we see further bullish follow-through in the S&P 500 and other major US indices. That said, the chart continues to show signs of being a bit over-extended so the extent of the move might be slightly limited. Traders will also be weary of the CPI data being released next week so they may want to hold off on being too bullish just yet. The majority of the move is likely to come after the FOMC meeting next Wednesday, especially if the bank starts to show a readiness to cut rates fairly soon.
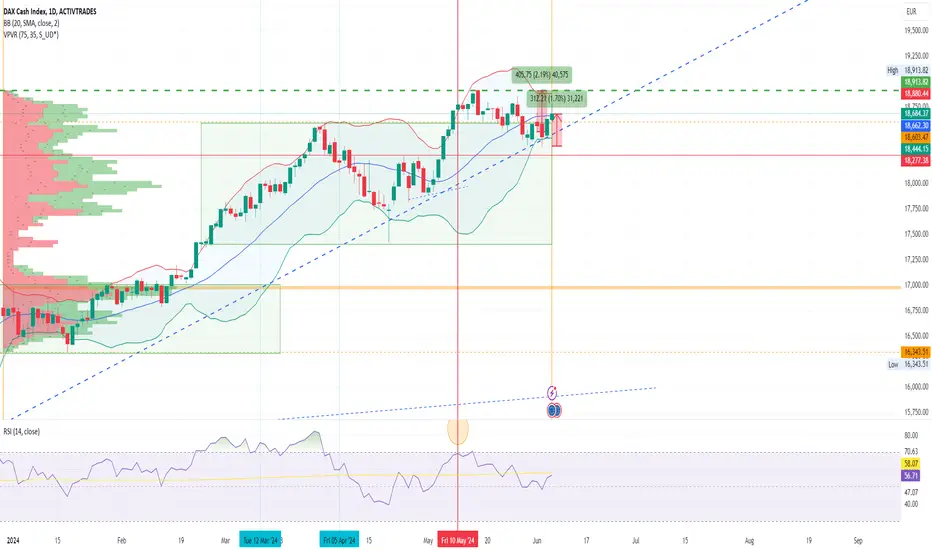
DAX rising weaklyMarkets rose on Wednesday, recovering losses from the previous session in anticipation of important data on regional activity and awaiting the ECB's latest monetary policy meeting. At the open, it was up 0.4%. It was followed by the French CAC40 and the FTSE 100 with 0.5% and 0.3% respectively, and finally the Spanish IBEX35 with around 0.4%. A rate cut of 25 basis points from record levels is expected today, heavily influenced and persuaded by signs of moderation in European inflation. The rapidly changing earnings outlook is what is driving this policy possibility. Doubts remain about what will be accepted going into the rest of the year after slightly better-than-forecast inflation data for the eurozone.
The French PMI was similar to expectations overall, but services and composite details were slightly lower, the Spanish PMI slightly better than expected, the Italian PMI disappointed with its lower than expected data, and the German data provided relief by improving expectations. The overall Eurozone as a whole showed for the month of April a larger decline being -1% versus -0.5% expected and on an annual basis, -5.7% versus -5.1% expected. Today we have European Parliament elections across Europe, so PMI and production releases in Spain, Italy, France and Germany, which were expected to be better and did not meet expectations, will most likely affect the currency. Retail sales are expected to be negative due to the slowdown in consumption across Europe, so we will just want to see what the central bank tells us this afternoon.
Regarding the German index, as we said, it has recovered its bullish mood this day. It has come out of the bearish trading zone of the last few weeks. Since Monday, the German spread has recovered 1.70%. We have to see if it will go back above the all-time highs this Friday or look to do so from next week onwards. What is clear on the chart is that the Trading Point is in the 17,000 zone, the shape being the bell of a possible triple bell with no excessive volume at its top, and the RSI at the moment is in the middle zone. For this reason it would not be unusual to see the German index pierce and pull back strongly to at least the area of 18,279 points approximately.
Ion Jauregui - ActivTrades Analyst
*******************************************************************************************
The information provided does not constitute investment research. The material has not been prepared in accordance with the legal requirements designed to promote the independence of investment research and such should be considered a marketing communication.
All information has been prepared by ActivTrades ("AT"). The information does not contain a record of AT's prices, or an offer of or solicitation for a transaction in any financial instrument. No representation or warranty is given as to the accuracy or completeness of this information.
Any material provided does not have regard to the specific investment objective and financial situation of any person who may receive it. Past performance is not reliable indicator of future performance. AT provides an execution-only service. Consequently, any person acing on the information provided does so at their own risk.
The TradingView Show: Charting Markets with TradeStationHello to all global traders! We're live with David Russell, TradeStation's Global Head of Markets giving us an inside look at the most important moves in markets. He’s the expert behind the research and analysis from TradeStation’s official TradingView account.
Follow them here: tradingview.sweetlogin.com
In this show, we examine the most important charts, interesting trades, and offer valuable education for all traders. What’s on David’s radar? The Fed, inflation, the upcoming Apple iPhone, the big money shifts moving from energy to tech, and other areas to watch including homebuilders and more.
We look forward to connecting with traders worldwide. Share your questions in the comments, contribute your insights, and don’t forget to subscribe for more shows on TradingView with our partners, influencers, sponsors, and global community. Thanks for watching!
This show is for educational and entertainment purposes only, not financial advice. Markets require hard work and dedication, so stay informed and keep learning.
Look first, then leap!
- TradingView
Important disclaimers for ETFs: www.tradestation.com
Important disclaimers for options: www.theocc.com
All other important disclaimers: www.tradestation.com
