EUR Pairs Market Analysiscontinuance of our review of EUR pairs and our position based off our initial analysis
Community ideas

I have a rule to follow the money rather than marry the marketThe cost to trade Bitcoin, the boring movement and other reasons have me moving away from trading Bitcoin from today.
I will be focussing on a morning market and an afternoon market
Right not it seems to be Forex in the morning and an Indice in the afternoon, namely the GPBJPY and Dow Jones
I hope this doesn't upset anyone. I have a rule to follow the money rather than marry the market

Uptrend is coming to an endUsing Elliot Wave and COT data, I am making a case that gold is probably topping out very soon and a sharp correction should follow. When everyone is bullish, that's typically not a good time to be bullish.

BUY GBPCHF - trade explained in detail Trader Tom, a technical analyst with over 15 years’ experience, explains his trade idea using price action and a top down approach. This is one of many trades so if you would like to see more then please follow us and hit the boost button.
We are proud to be an OFFICIAL Trading View partner so please support the channel by using the link below and unleash the power of trading view today!
tradingview.sweetlogin.com

Gold - Capturing Short-Term Retracements Continuous bullish price action will eventually lead to minor retracements where scalpers can profit from.
Many say the trend is your friend but i like to go against that so i am looking @ $2,619 low hanging fruit for a healthy retracement. $2,600 would also be considered healthy in my eyes as market structure will still be in tact.

BTCUSD - BITCOIN seeing strength?Good day traders!
Alright. For BTCUSD I'm still seeing the same pattern, however things are starting to look a little more optimistic. The pattern that I've been discussing for weeks now is the series of lower highs and lower lows. Once we break this pattern, then we can start to talk about that move to ATH and ~$85k above ATH.
We NEED to break FWB:65K and ideally with above average volume (which I did not discuss in the video). We need a breakout with volume to get some gas in the tank so to speak.
If we can do that, it simply increases confidence in the bullish scenario. There's never any certainty in the markets, but from a pattern perspective, we have to break the pattern in order to gain confidence in the next move. Break the pattern to the upside, I believe we'll see new highs. We have yet to break the pattern to the downside, but that is not off the table. I'm simply saying things are looking better from a bullish perspective at this time .

TESLA Looks Unstoppable This time +13% Already in ProfitsTESLA Looks Unstoppable This time +13% Already in Profits
Since when I posted the previous analysis on September 2nd the price increased by nearly +13% and is making higher highs.
Today it looks even better after the FED supported the economy by decreasing the rates by 50bps.
You can watch the video for further details.
Thank you and Good Luck!
Previous analysis:

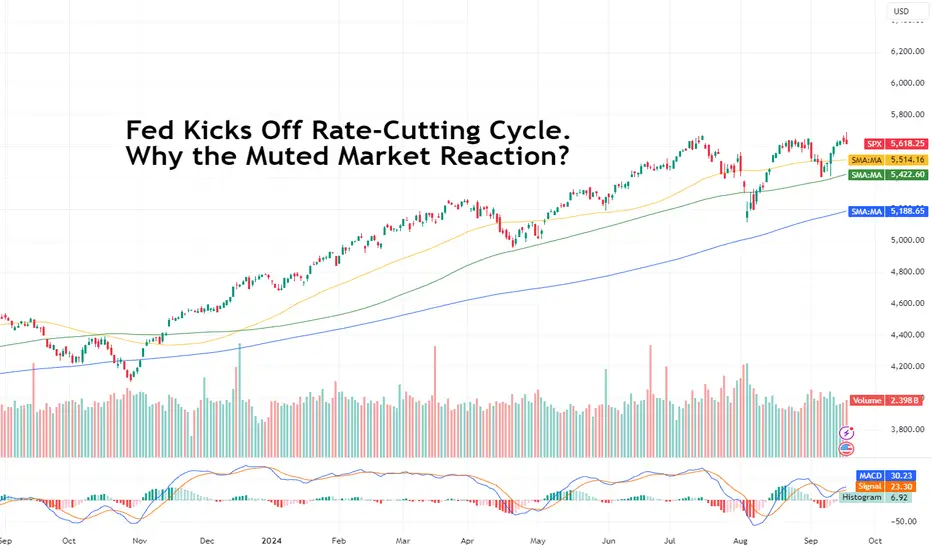
Fed Kicks Off Rate-Cutting Cycle. Why the Muted Market Reaction?Central bank bros met traders’ loftiest expectations with a half-point cut to interest rates on Wednesday. But is that too good to be true and maybe even a signal of some problems with the US economy and looming fears over at the Fed?
Trading today isn’t the same as trading yesterday. Even though prices don’t really confirm it — there wasn’t a super-duper rally in stocks. Maybe gold XAU/USD flickered a bit, but it was mostly froth . And here we are — the first day of trading in an environment with lower interest rates.
Jay Powell, head of the Federal Reserve, announced on Wednesday the first trim to borrowing costs in four years. The move ushers in a new normal where US interest rates USINTR are projected to continue moving lower from their 23-year high of 5.5%.
The easing cycle kicked off with a jumbo-sized 50 bps (basis points) slash. Surprisingly, the Fed went for the juicier, bolder and more aggressive option, leapfrogging the less interesting and exciting cut of 25 bps.
First reactions across the board showed investors were hyped to get what they wanted — the broad-based S&P 500 hit an intraday record .
Shortly after, however, stocks across the board pulled back and markets became anxious over the outlook as the realization kicked in. If the economy is doing fine, why go big on cuts from the get-go?
What’s more, central bankers are keen to ax interest rates by another half point in 2024, ultimately wrapping up the year with the benchmark rate sitting at 4.25% to 4.5%. Christmas may come early — the Fed meets twice more this year, on November 7 and December 18.
Better Safe Than Sorry?
A super-sized half-point cut could actually be a pre-emptive measure to alleviate a strained economy. But if inflation is now largely in the rearview mirror , what could the problem be? The other mandate. The Fed has a dual mandate of keeping prices in check (inflation) and upholding a stable labor market (jobs).
“We will do everything we can to support a strong labor market as we make further progress towards price stability,” Jay Powell said at the annual Jackson Hole gathering last month. And indeed, America’s jobs have seen a pronounced slowdown over the past few months. In July, markets added just 89,000 jobs (revised from an initial estimation of 114,000 ). In August, hiring had picked up modestly to 142,000 , but below expectations for 164,000.
Pros and Cons of Bumper Cut
Essentially, this big-boy cut of 50 bps is a double-edged sword. It cuts into borrowing costs, making money more affordable, potentially stimulating businesses to add more jobs and grow their gig. And it also prompts consumers to take on debt and get that house.
But on the flip side, a cut of that magnitude risks stirring up price pressures again. To get to full employment, the Fed faces the challenge of knocked inflation waking up from its slumber.
The size of the cut at this particular time doesn’t mean anything without the markets’ reaction to it. Apparently, investors were unimpressed and shrugged it off as no big deal. Looking ahead, however, the stakes are high because stocks are at all-time highs.
The S&P 500 touched a record, Big Tech is leading the charge into artificial intelligence and investors can’t own enough of the highflyers Nvidia NVDA , Meta META , Apple AAPL , etc.
The actual picture will become clear once markets figure out what the Fed’s rate-cutting cycle means and what to do about it.
How To Catch And Trade Forex Reversals EasilyMarkets reverse because of changing economic sentiment.
That's the easy part. Managing your entries/exits is what needs overall care.
Get consistency with this approach.

Why the US dollar bear should tread with careThe USD saw a sharp reversal higher despite a 50bp cut, simply because the markets were positioned for a more dovish dot plot. I have argued in prior analysis the USD exposure is a bit stretched over the near-term, so perhaps shorting the USD is getting a bit stale. We also have several key markets at inflection points after a risk event. Matt Simpson takes a technical look.

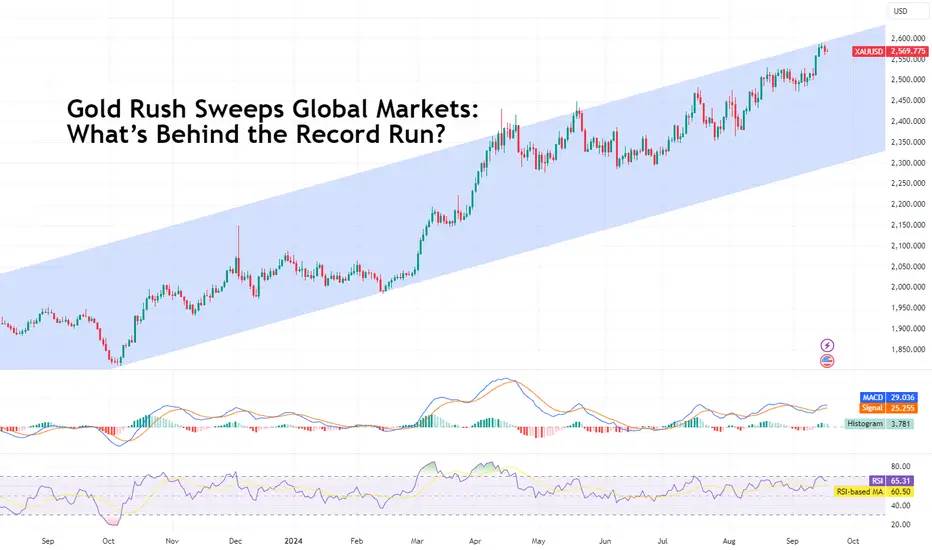
Gold Rush Sweeps Global Markets: What’s Behind the Record Run?The shiny stuff has outperformed stocks by a lot this year, sparking a debate over gold’s characteristics as an asset: is it just a pet rock that does nothing but sit idle, or is it the ultimate timeless store of value that trounces every competitor in times of uncertainty and gloomy outlook?
Gold XAU/USD is so back — the precious metal has outperformed nearly every other megacap asset, including the S&P 500 where 500 of America’s biggest and brightest companies generate returns for shareholders like a restless corporate machine.
Since the start of trading this year, gold is up a solid 25% to hit a record high of $2,590 earlier this week. In comparison, the broad-based Wall Street average, the S&P 500 SPX , is up 18% over the same time span.
Thank the impatient people who bet on prospects and can’t wait for the rumor to materialize. To a fairly big extent, the gains in gold are driven by the prospects of lower borrowing costs. Not the single cut to interest rates , which would be in the ballpark of 25 basis points to 50 basis points. That’s fairly fresh — way before that, early in 2024, investors were high on hopium that they’ll get as many as six slashes to interest rates.
Hopes Fade but Gains Stay
Gold didn’t show any signs of fatigue despite the Fed pushing against the consensus views. It plowed through mixed bags of macro reports showing that the US economy was zig-zagging between hot and cold.
Ultimately, gold won back its reputation as a preferred investment in times of shifting monetary policy landscapes, brewing geopolitical tensions , and overall uncertainty and gloomy outlook for global markets.
The fast-paced, hot-to-the-touch gold market today is in stark contrast to historical performance. During the time frame 2011 through 2018, gold was virtually muted and hugging the flatline with nothing exciting about it.
Right now, gold’s everywhere — from the retail trader’s portfolio to the central banks’ vaults. Global central banks, the money-printing machines with infinite reserves, stacked up the bullion to the tune of 483 tons in the first half of the year, says the World Gold Council. It’s a record since record-keeping began.
Good Guy Gold
But wait, that's not all — gold has buoyed some free riders. Gold-backed assets are partying hard, too. Gold mining companies are whizzing through, riding on massive year-to-date gains with the top performers up about 30%.
Exchange-traded funds with exposure to gold are flaunting big gains as well. These gold ETFs barely flash any red on the year with the top players flexing advances by as much as 50%.
The Great Portfolio Rotation or What’s Opportunity Cost?
By the looks of it, there’s this portfolio rotation into gold in the lead-up to the Federal Reserve’s upcoming interest rate cut. The US central bank is getting ready to knock down the cost of borrowing in an effort to alleviate some of the strain on the economy and lean against a possible recession.
What’s gold’s role in all that hubbub? Gold gets more attractive amid lower interest rates thanks to something called “opportunity cost.” In a nutshell, higher rates generally benefit fixed-income assets like bonds that get you guaranteed returns. And why jam your money into gold when you can ride out the high-rate wave and churn out 5% on the 10-year bond US10Y . That’s opportunity cost — missing out on fun, gains and dopamine while your hands are full with a non-yielding asset. What we’ve seen so far is a marked shift away from it.
Bond yields are falling in anticipation of the Fed’s rate cut, prompting investors to ramp up their long positions in the yellow bars, which are notorious for … well … yielding nothing. In other words, holding gold gets you no yield, interest, or dividend whatsoever, unlike bonds or the US dollar deposits where you can sit around and do nothing and still make money.
The prospects of downshifting interest rates have diminished the opportunity cost of non-yielding gold. Apparently, the shiny metal still has it — whenever the right conditions perk up, gold lives up to its standards of being a safe haven and a store of value.
What’s your take on gold? Do you have a long position in it or you’re a permabear who’s brave enough to short it at the top? Comment below!
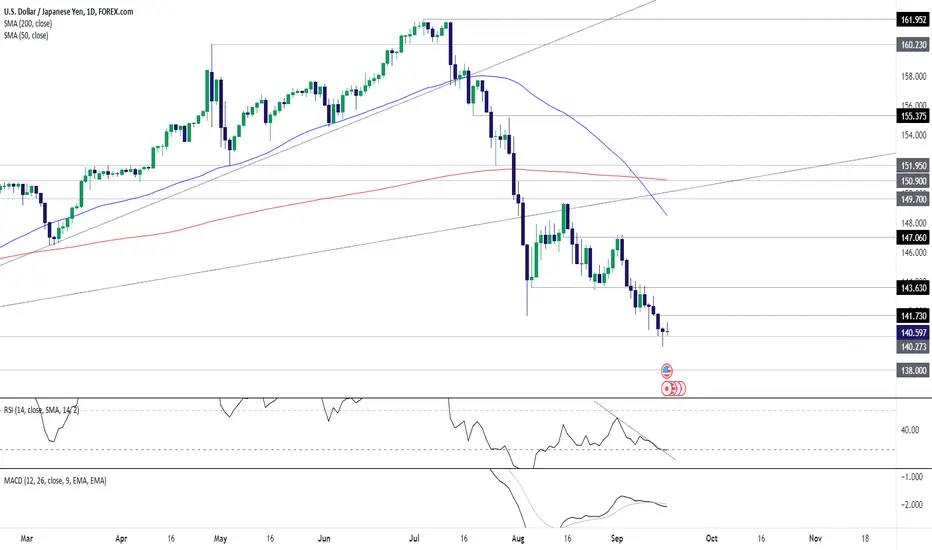
USD/JPY may squeeze if Fed delivers dovish disappointmentUSD/JPY looms as a prime squeeze candidate should the Fed disappoint on extremely dovish market pricing, not only likely to benefit from the probable uplift in US bond yields but also recent shifts in market positioning.
USD/JPY staged a decent reversal on Monday after slicing through the Dec 28 low of 140.273, printing a hammer candle on the daily. With RSI (14) nearing oversold territory and breaking the downtrend it’s been in since the start of September, directional risks may be shifting.
I’m not rushing into a long trade just yet, but I am keen to see whether the price holds above 140.273 today. If it does, longs could be established with a stop around 139.60 for protection. Make sure you keep positioning front of mind given how volatile the pair has been recently.
143.63 looms as a suitable trade target with only minor resistance at 141.73 located in between.
Good luck!
DS
SPX 500 Unjustified Bearish moves up and exit strategy explainednot financal advice just seeing many similarities in current market structure that could warrant a 20% correction as we are going thru bearish moves up to the upside.

Looking for a potential breakout of all time highs on VISA!🔉Sound on!🔉
Thank you as always for watching my videos. I hope that you learned something very educational! Please feel free to like, share, and comment on this post. Remember only risk what you are willing to lose. Trading is very risky but it can change your life!

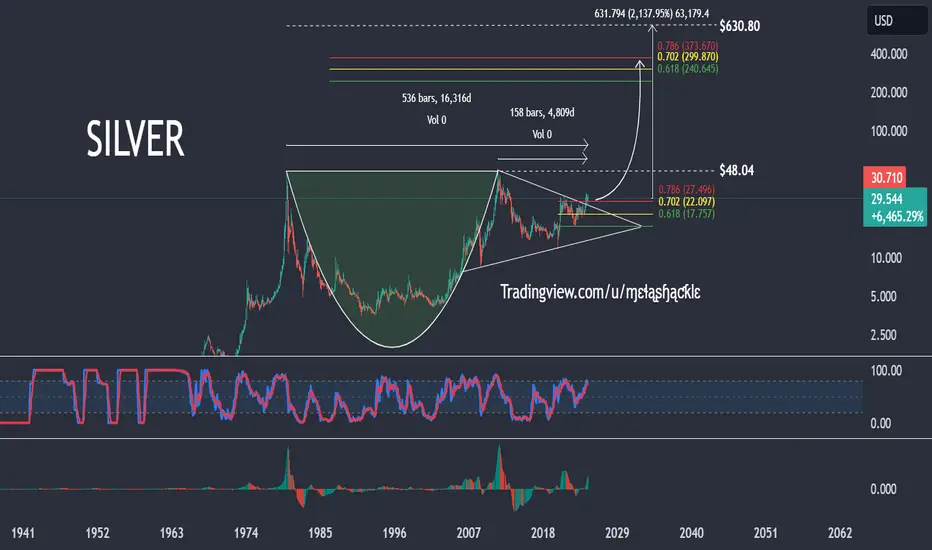
SILVER | THE BIGGEST CUP & HANDLE OF ALL TIME!Apple’s Cup and Handle pattern in the early 2000s is often cited as one of the most significant. After a prolonged downtrend, Apple formed a large cup with a handle from 2000 to 2005, which, after breaking out, has continued to appreciate to this very day. However, Apple's pattern is nothing compared to the current Cup & Handle pattern that exists in silver, whether in size or price.
I truly believe that silver is currently the most undervalued asset and will not only attain higher prices than most can imagine but will also rapidly begin to appreciate against gold, which currently has a ratio of 83.75 to 1. This ratio is irrational and unsustainable, as gold and silver are typically mined at a ratio of around 10 to 1. Even current U.S. Treasury Mint coins—Silver Eagles and Gold Eagles—have a current exchange rate of 50 to 1 at face value. Historically, under the gold standard and the Coinage Act of 1834, the ratio was set at 16 to 1.
Although this will not happen overnight and could take a decade or more to come to fruition, the unnatural and irrationally low price of silver is coming to an end. The overinflated gold-to-silver ratio will continue to fall as price manipulation ends and true price discovery begins.
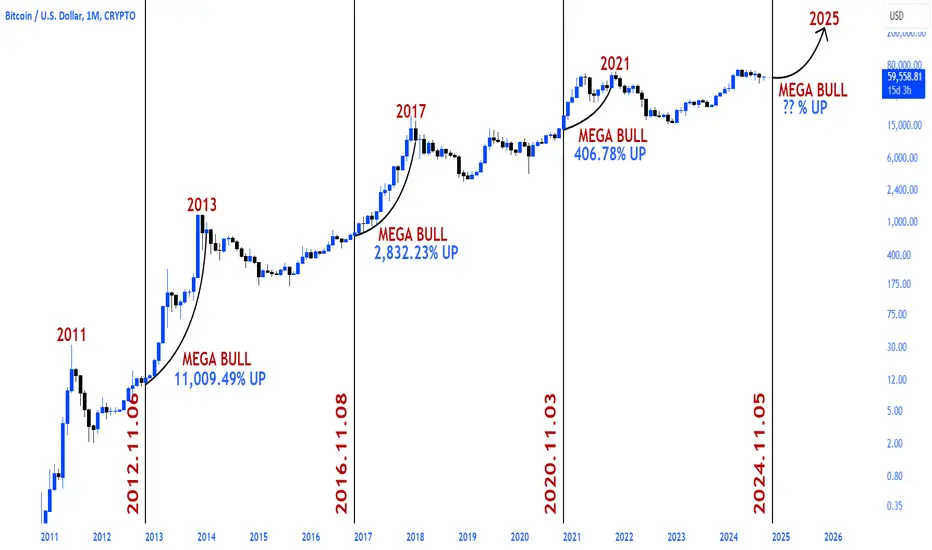
You are not optimistic enough about #BTC!The US presidential elections, held every four years, are completely compatible with the CRYPTOCAP:BTC mega bull cycle!
After the presidential elections held in 2012\2016 and most recently in November 2020, #bitcoin transitioned to the mega bull process!
The issue of high interest rates on the Fed's side has now come to an end. With the easing of interest rates and the presidential election to be held in November, #Bitcoin will transition to the mega bull process!
IS TESLA STOCK READY TO RALLY? (September 14, 2024)Some HTF views of tesla stock & data analysis to figure out if Tesla is about to go on this massive multi year rally

EdTech Unicorn Stride Surges: Strong Financials Fuel Rally!The EdTech revolution is progressing rapidly! As technology advances, internet access grows swiftly, and students seek innovative learning methods, the global EdTech market is flourishing.
North America currently holds a significant 37.3% share, but regions such as the Middle East and Africa, Europe, and Asia-Pacific are gaining ground, fueled by government support, digital literacy, and a burgeoning middle class. It's an exciting time for digital learning, and there's even more to look forward to!
◉ EdTech Market Growth Outlook
➖ Valuation projected to rise from $220.5 million in 2023 to $810.3 million by 2033.
➖ Compound Annual Growth Rate (CAGR) of 13.9%.
◉ Government Initiatives Supporting EdTech Sector
The US Department of Education has allocated $277 million in new grants through the Education Innovation and Research program to enhance educational equity and innovation, particularly in areas affected by the COVID-19 pandemic, specifically focusing on STEM education and rural regions.
Recognizing the enormous opportunity in EdTech, we're examining a stock that exhibits remarkable growth potential within the sector.
◉ Company Overview
Stride Inc. NYSE:LRN is a tech-driven education service provider offering proprietary and third-party online curricula, software, and services in the U.S. and globally. Their products support personalized learning for K-12 students through virtual and blended public schools, individual online courses, and supplemental materials in subjects like math, English, science, and history. Stride also emphasizes career learning in fields such as IT, healthcare, and business, and operates tuition-based private schools. Additionally, they provide post-secondary programs in software engineering and healthcare under brands like Galvanize and Tech Elevator, along with staffing services. Rebranded from K12 Inc. in December 2020, Stride has been incorporated since 1999 and is headquartered in Reston, Virginia.
Investent Advice by Naranj Capital
Buy Stride NYSE:LRN
● Buy Range- 77 - 80
● Target- 115 - 120
● Potential Return- 45% - 50%
● Invest Duration- 12-18 Months
◉ Market Capitalization - $3.31 B
◉ Peer Companies
➖ Graham Holdings NYSE:GHC - $3.23 B
➖ Adtalem Global Education NYSE:ATGE - $2.67 B
➖ Grand Canyon Education NASDAQ:LOPE - $4.04 B
➖ Laureate Education NASDAQ:LAUR - $2.25 B
◉ Technical Aspects
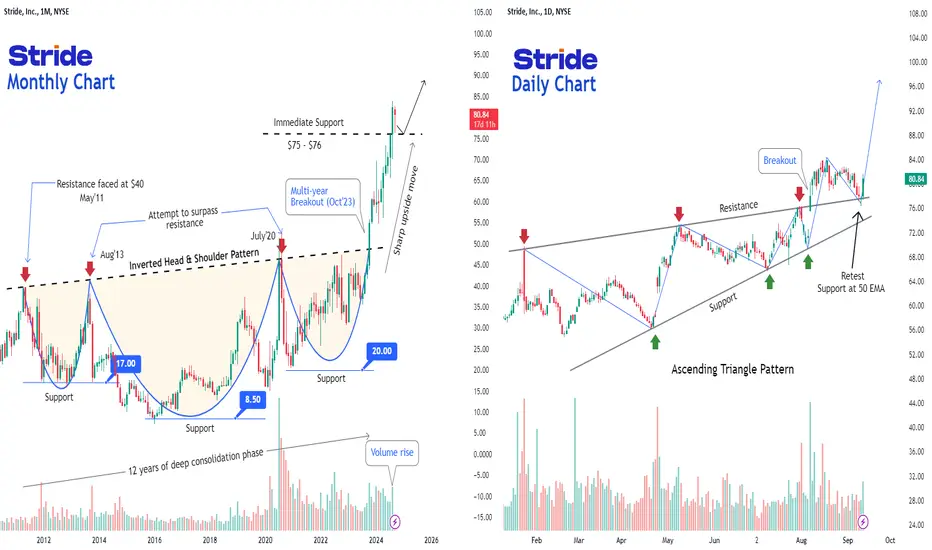
● Monthly
➖ The stock price initially faced resistance at $40 in 2011 but later found support at $17.
➖ Despite several attempts to break through resistance, the stock experienced significant declines.
➖ However, after a 12-year period, it finally broke out and rallied to a high of $84.
➖ Currently trading at $77.7, the stock is expected to continue rising in the near future
● Daily
➖ The daily chart indicates a clear uptrend in the price movement.
➖ An ascending triangle pattern has formed, and following the breakout, the price has retraced to the breakout level.
➖ At this moment, the price is attempting to find support at the 50 EMA.
➖ From a technical standpoint, the stock is resting at a support level, making it an attractive option for accumulation with a mid to long-term investment outlook.
◉ Relative Strength
➖ The chart clearly illustrates that Stride Inc. has greatly outperformed the US Smallcap 2000 index, achieving an impressive annual return of 82%, which is a notable achievement.
◉ Revenue & Profit Analysis
● Year-on-year
➖ In FY24, revenue surged by 11.3%, reaching $2,040 million, up from $1,837 million in FY23.
➖ EBITDA saw a substantial boost, climbing to $295.3 million in FY24 compared to $225.2 million the previous year.
➖ The EBITDA margin also experienced growth, rising to 14.47% from 12.26% in FY23.
➖ Additionally, diluted EPS witnessed an impressive increase of 57.91%, jumping to $4.69 in FY24 from $2.97 in FY23.
● Quarter-on-quarter
➖ In the latest June quarter, the company achieved a remarkable milestone with quarterly sales reaching an all-time high of $520.8 million. This marks a 3% increase from the $504.9 million recorded in the March quarter and a significant 10.75% rise compared to $470.3 million in the same quarter last year.
➖ EBITDA declined from $100.2 million to $82.3 million in the latest quarter, representing a 17.8% decrease.
◉ Valuation
◉ PE Ratio
● Current PE Ratio vs. Median PE Ratio
➖ The present price-to-earnings ratio for this stock is 16.2x, which is considerably below its four-year median price-to-earnings ratio of 18.9x times, indicating that the stock is currently undervalued.
● Current PE vs. Peer Average PE
➖ The stock presents a favorable valuation when considering its Price-To-Earnings Ratio of 16.2x, which is lower than the average of its peers at 18.3x.
● Current PE vs. Industry Average PE
➖ Stride appears to be offered at a more competitive price, featuring a Price-To-Earnings Ratio of 16.2x, which is significantly below the average of 19.2x for the US Consumer Services industry.
◉ PB Ratio
● Current PB vs. Peer Average PB
➖ The present PB ratio in relation to the average PB of peers indicates that the stock is somewhat higher, with a ratio of 2.8x in contrast to the peer average of 2.6x.
● Current PB vs. Industry Average PB
➖ When comparing the current PB ratio to the industry average, Stride appears to be considerably overvalued, exhibiting a PB ratio of 2.8x, while the industry average stands at 1.6x.
◉ Cash Flow Analysis
➖ The cash generated from operations has experienced substantial growth in fiscal year 2024, increasing to $278.8 million from $203.2 million in fiscal year 2023.
◉ Debt Analysis
➖ Stride has a total debt of $528.2 million, resulting in a debt-to-equity ratio of 0.44.
➖ The company generates sufficient interest income to exceed its interest expenses, indicating that interest payment coverage is not an issue.
◉ Top Shareholders
➖ BlackRock Inc. holds a significant ownership interest in this company, with a notable stake of 14.9%. This level of investment reflects BlackRock's confidence in the company's potential for growth and profitability.
➖ The Vanguard Group also maintains a considerable presence, owning 10.7% of the company's shares.
➖ Together, these two investment giants represent a substantial portion of the company's equity, indicating strong institutional support and interest in its future performance.
◉ Conclusion
Upon examining Stride Inc.'s financial performance, we focused on essential metrics such as revenue growth, profit margins, and the stability of cash flow. Additionally, we assessed the company's future growth potential by looking into industry trends and the competitive landscape.
As a result, we are confident that Stride Inc. is positioned to capitalize on new opportunities while effectively navigating challenges, making it an attractive option for both investors and stakeholders.
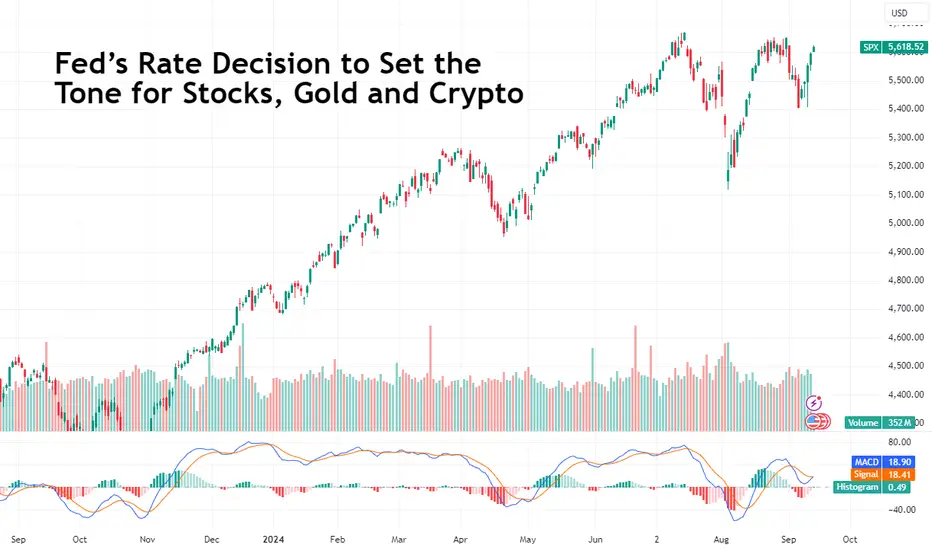
Fed’s Rate Decision to Set the Tone for Stocks, Gold and CryptoOfficials at the central bank are staying tight-lipped over the magnitude of the interest rate cut. What we know so far: there will be one. What we don’t know: is it going to be 25bps or 50bps?
Federal Reserve Chairman Jay Powell (or JPow if you’re a cool kid) is most likely having a hard time sleeping these days. Lurking in the near distance, September 18 to be precise, is a decision he should make that has the power to slosh trillions of dollars across global markets.
Stock valuations, crypto prices and the glow of gold all hinge on a single figure — the US interest rate ( USINTR ). Major central banks are on the move to unwind their restrictive monetary policies, especially when it comes to global interest rates . Investors have been trying to run ahead of the interest rate decision and position their portfolios to accommodate both a small casual trim to borrowing costs but also a bigger, juicier slash.
Clashing opinions over the size of the interest rate reduction have been swaying the financial markets in recent weeks. Fed officials haven’t sent out any comms regarding that question so markets do what they do best — speculate.
According to the FedWatch tool by CME Group, at the end of this week, investors were nearly even in their expectations for the upcoming interest rate cut with 55% calling for a 25bps (basis points) cut and 45% rooting for the fuller treatment of 50bps.
In any case, this would be the Federal Reserve’s first cut to borrowing costs in more than four years. The benchmark rate in the US is currently sitting at a 23-year high of 5.5% — a level that has stayed flat since July.
After a series of reports pointing to a wobbling economy — and on the back of mostly receding inflation — the central banking clique issued its uplifting guidance at their previous meeting, saying rates are about to go down when they meet again. But what they didn’t say — because they’re data dependent — is how much.
A 25bps cut to interest rates would most likely be already priced in across the spectrum. Stocks, the US dollar, gold and even cryptocurrency are now acting as if this level of rate cut is factored in. Moreover, some investors might even be disappointed to see a rate cut of that casual magnitude. Buy the rumor, sell the news, maybe?
A 50bps cut to interest rates could bring some needed fuel for the next leg up in stocks, gold and crypto. And, on the flip side, knock the dollar’s valuation.
Lower interest rates make money more affordable, enticing investors, businesses and consumers to get more cash out of the bank and spend more freely on big-ticket purchases. Obviously, investors shove the cash into various markets. Businesses expand operations and build new products. And consumers, well, they buy the new iPhone 16 and jam what's left in meme stocks ?
Perhaps even more importantly, lower interest rates help steer the economy, keeping it on an upward trajectory. Liquidity improves, because there’s more money flowing in the system, and valuations of public and private assets usually increase.
Take gold ( XAU/USD ), for example. Gold hit an all-time high Friday morning, pumping above $2,570 per ounce . Driving the gains was the relationship between gold and the prospects of lower rates, which make bullion more appealing because they reduce the opportunity cost of holding a non-yielding asset. At the same time, the US dollar loses some of its allure because the reduction in rates triggers a lower yield on dollar deposits.
Bitcoin ( BTC/USD ) is another interest -ing candidate to join the rate interplay. The OG token has been increasingly correlated to macroeconomic factors and the rate decision is already seen impacting its price in a positive way.
Stocks have been in choppy trading mode over the past couple of months largely due to the looming uncertainty about the looming rate-setting meeting.
So what do you think it’s going to be — 25bps or 50bps? And how would it affect financial markets? Shoot your thoughts below!
Q4 Bullish Continuation Bitcoin's price action continues to show a strong bullish trend. After multiple corrective pullbacks, the price has consistently rebounded within the established channel. We saw significant corrections of -20%, -22%, and -28%, yet BTC remains on course for a potential breakout towards the next major top in the $100K+ range. With strong support holding at GETTEX:46K and consistent higher lows, this chart highlights the resilience of Bitcoin and its potential for continuation to new highs.
Let's see how the next leg unfolds! 🚀 #BTC #Bullish #Crypto

Is oil signalling a recession? Oil has really started to free fall.
The death cross on the daily chart has occurred. this is where the 50 MA intersects with the 200 MA in a downtrend.
This often implies more downside to the medium and long term but is often a great short term long signal.
Usually when you get this signal the market makers bounce the stock or commodity a bit before taking it lower.
We are hitting a massive multi year trend line going back to 2022 that should act as some support.
XLE looks ready for 1 more down leg before a swing tradable low is in.
Energy does have a tendency to fall precipitously so understanding oil can keep falling if investors fear the worst or a recession.

WTI Oil H4 | Potential bearish reversalWTI oil (USOIL) is rising towards an overlap resistance and could potentially reverse off this level to drop lower.
Sell entry is at 68.80 which is an overlap resistance.
Stop loss is at 71.65 which is a level that sits above the 50.0% Fibonacci retracement level and an overlap resistance.
Take profit is at 65.24 which is a swing-low support.
High Risk Investment Warning
Trading Forex/CFDs on margin carries a high level of risk and may not be suitable for all investors. Leverage can work against you.
Stratos Markets Limited (www.fxcm.com):
CFDs are complex instruments and come with a high risk of losing money rapidly due to leverage. 62% of retail investor accounts lose money when trading CFDs with this provider. You should consider whether you understand how CFDs work and whether you can afford to take the high risk of losing your money.
Stratos Europe Ltd (www.fxcm.com):
CFDs are complex instruments and come with a high risk of losing money rapidly due to leverage. 59% of retail investor accounts lose money when trading CFDs with this provider. You should consider whether you understand how CFDs work and whether you can afford to take the high risk of losing your money.
Stratos Trading Pty. Limited (www.fxcm.com):
Trading FX/CFDs carries significant risks. FXCM AU (AFSL 309763), please read the Financial Services Guide, Product Disclosure Statement, Target Market Determination and Terms of Business at www.fxcm.com
Stratos Global LLC (www.fxcm.com):
Losses can exceed deposits.
Please be advised that the information presented on TradingView is provided to FXCM (‘Company’, ‘we’) by a third-party provider (‘TFA Global Pte Ltd’). Please be reminded that you are solely responsible for the trading decisions on your account. There is a very high degree of risk involved in trading. Any information and/or content is intended entirely for research, educational and informational purposes only and does not constitute investment or consultation advice or investment strategy. The information is not tailored to the investment needs of any specific person and therefore does not involve a consideration of any of the investment objectives, financial situation or needs of any viewer that may receive it. Kindly also note that past performance is not a reliable indicator of future results. Actual results may differ materially from those anticipated in forward-looking or past performance statements. We assume no liability as to the accuracy or completeness of any of the information and/or content provided herein and the Company cannot be held responsible for any omission, mistake nor for any loss or damage including without limitation to any loss of profit which may arise from reliance on any information supplied by TFA Global Pte Ltd.
The speaker(s) is neither an employee, agent nor representative of FXCM and is therefore acting independently. The opinions given are their own, constitute general market commentary, and do not constitute the opinion or advice of FXCM or any form of personal or investment advice. FXCM neither endorses nor guarantees offerings of third-party speakers, nor is FXCM responsible for the content, veracity or opinions of third-party speakers, presenters or participants.

Identifying Entry Points in EUR/USD: A Simple RSI StrategyAs a former professional technical analyst at a major bank, I used to write daily reports on the euro vs. the US dollar. Today, I want to share a technique I often used to identify entry points in the market.
Looking at the EUR/USD weekly chart, I’ve spotted a large symmetrical triangle that’s completed, with the market breaking higher. A common move in this pattern is a retest of the breakout point, which here would be a drop to around 1.0930. As long as the price stays above 1.0930, the pattern holds, and your outlook remains valid—this also helps define where to set your stop.
Next, I zoom into lower time frames, such as the daily or 4-hour charts, to find potential entry points. I rely on the RSI (Relative Strength Index) to identify oversold conditions. If the daily chart shows no clear signals, I move to the 4-hour chart. Right now, the 4-hour chart is showing periods of oversold RSI, which is when I’d consider entering long positions.
Remember, the price might not drop all the way to 1.0930, so you’ll need to decide when to enter the market. Using RSI and adjusting down time frames can help you make that call, with your stop already in place.
Disclaimer:
The information posted on Trading View is for informative purposes and is not intended to constitute advice in any form, including but not limited to investment, accounting, tax, legal or regulatory advice. The information therefore has no regard to the specific investment objectives, financial situation or particular needs of any specific recipient. Opinions expressed are our current opinions as of the date appearing on Trading View only. All illustrations, forecasts or hypothetical data are for illustrative purposes only. The Society of Technical Analysts Ltd does not make representation that the information provided is appropriate for use in all jurisdictions or by all Investors or other potential Investors. Parties are therefore responsible for compliance with applicable local laws and regulations. The Society of Technical Analysts will not be held liable for any loss or damage resulting directly or indirectly from the use of any information on this site.
