Traders Turning to Traditional Stocks and Dow Jones In July, most markets reached their peak, followed by a three-day global meltdown after the Bank of Japan announced a 25 basis point rate hike. Since then, all have recovered, but only the Dow Jones has surpassed its July high, while the others have not.
AI and tech stocks, particularly those in the Nasdaq, have lost their shine compared to traditional stocks like those in the Dow Jones.
We will explore which sectors investors are gravitating towards this time and why they favor the Dow Jones over the Nasdaq this season.
Micro E-Mini Dow Jones Futures & Options
Ticker: MCL
Minimum fluctuation:
1.0 index points = $0.50
Disclaimer:
• What presented here is not a recommendation, please consult your licensed broker.
• Our mission is to create lateral thinking skills for every investor and trader, knowing when to take a calculated risk with market uncertainty and a bolder risk when opportunity arises.
CME Real-time Market Data help identify trading set-ups in real-time and express my market views. If you have futures in your trading portfolio, you can check out on CME Group data plans available that suit your trading needs tradingview.sweetlogin.com
Community ideas

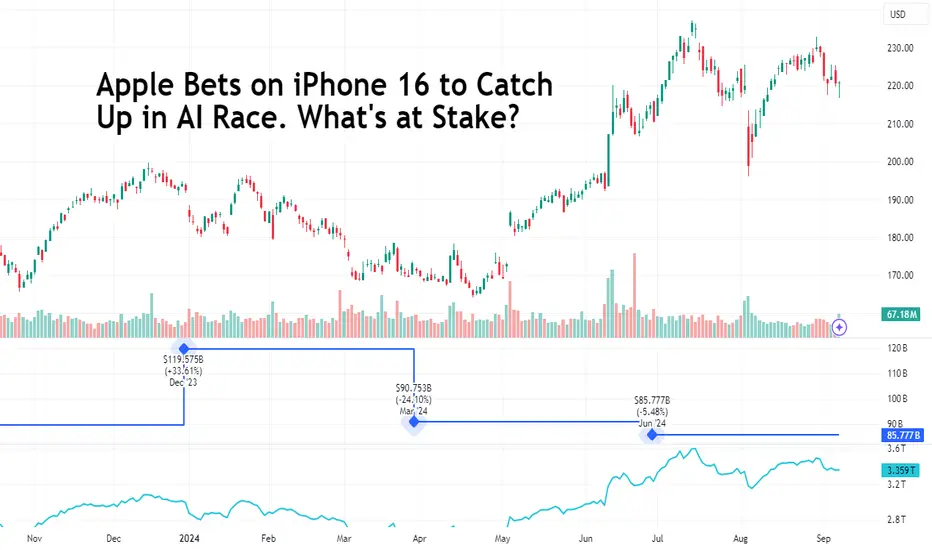
Apple Bets on iPhone 16 to Catch Up in AI Race. What's at Stake?Tech heavyweight carries a valuation of $3.4 trillion, making it the world’s most expensive company (on most days, thanks to volatility). But the consumer giant may be running out of ideas — its latest product event “It’s Glowtime” was a spectacle of colors, flashy lights, great camera work and editing. But the crowd went … mild.
Apple (ticker: AAPL ) unveiled the latest model of its flagship product, the iPhone 16, at its product launch event “It’s Glowtime” on Monday.
This wonder of technology, which changed how the world communicates (and sends memes), is now in its most advanced form flexing some solid AI muscle. The iPhone 16 is a bet on artificial intelligence — the Cupertino, California-based company is putting its hopes on the buzzy AI trend in an effort to convince users to dump their old non-AI phone for the first Apple smartphone built for AI.
Chief Executive Tim Cook praised the new device, saying this latest model is designed “from the ground up” powered by Apple’s new AI software, Apple Intelligence . Users can get their hands on the iPhone 16 starting September 20 — just in time for the fourth quarter to show how big of a demand there is for this new device, starting at $799.
The product launch event, streamed live on YouTube to more than 2.5 million viewers, didn’t lift Apple shares one bit. In fact, the stock was moving sideways to the downside before it recouped the 1.9% intraday loss and closed hugging the flatline at $220.91 a share. It wasn't a great day for the broader stock market , to be fair.
So why the muted response from Wall Street and the investing crowds on Reddit’s messaging boards? There was merely anything new to surprise markets — most of the announcements were already old news, priced in and well baked in.
What matters now is how well the iPhone 16 sells to the masses. The three months to December are generally strong selling time spans for the iPhone as more people are willing to shell out on smartphones for Christmas. But that could very well be the initial marketing spike followed by fizzled out revenue growth. That’s where Apple’s future hinges on its ability to keep cutting edge and think different .
Backed by the power of AI, Wall Street will be looking for a boost to iPhone sales, which have been losing momentum in recent quarters. Now with the Apple Intelligence software jammed into the latest operating system, iOS 18, Apple is looking to compete for a market share in the burgeoning space for AI smartphones.
The tech giant is not too worried about getting left behind. Its iPhone flaunts a loyal customer base, which generates about half of all company revenue. For the most-recent quarter, iPhone sales pulled in $39.3 billion from total sales of $85.5 billion.
But in practice, Apple is already late to the party. Other mainstays in the upper echelon of tech have rolled out AI phones. Google launched its AI smartphone, Pixel 8, back in October. Samsung, Apple's international archrival running on Android, introduced the Samsung S24 in January, flexing powerful AI capabilities.
Perhaps the biggest news at yesterday’s event was Apple’s foray into healthcare. A new use case has been discovered for the AirPods: they’ll be taking on the role of hearing aids, which makes the $250 Pro model a cheap product in the market for hearing aids. Other product releases, other than the iPhone 16, include the Apple Watch Series 10 with an updated design, and the Apple Watch Ultra 2 in a new color (looks like the Ultra team had an ultra easy job this year.)
So, with that said, what makes you want to invest in Apple? Or maybe trade it? Is it the bright outlook in the AI smartphone race? Or the company’s search for innovation in healthcare? Share your thoughts below!
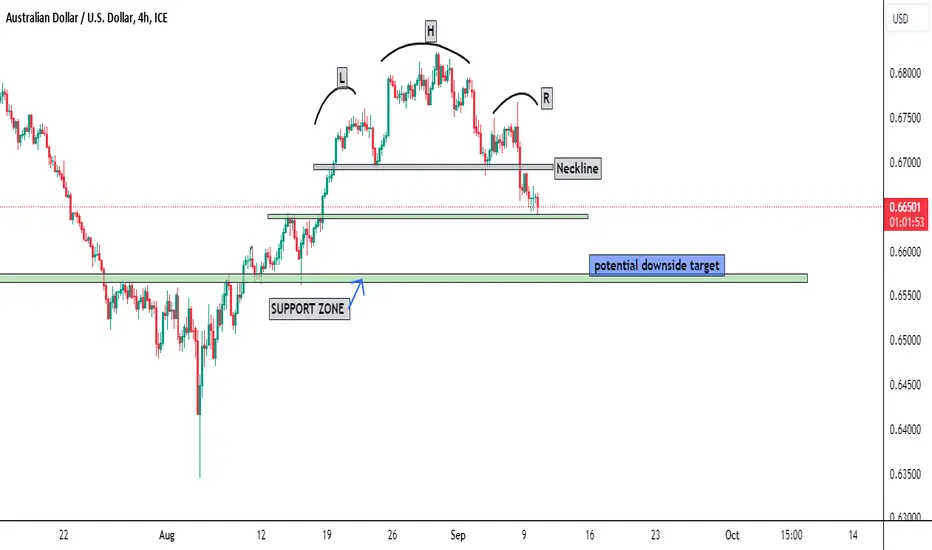
Head and Shoulders Pattern on AUD/USD On the AUD/USD chart, we are seeing a clear Head and Shoulders pattern , which is a strong indication of a potential bearish reversal. This pattern consists of three peaks, with the middle peak (the "Head") being the highest, and the two smaller peaks (the "Shoulders") on either side.
Key Points:
Left Shoulder: Formed , marking the first peak before the minor decline.
Head: The highest peak , indicating the strongest upward move before the market turned lower.
Right Shoulder: The second smaller peak has formed, suggesting the bearish momentum is resuming.
Neckline: The neckline, which connects the two troughs. A break below this line would confirm the bearish reversal pattern.
NAS100 I Potential long from bottom of the channelWelcome back! Let me know your thoughts in the comments!
** NAS100 Analysis - Listen to video!
We recommend that you keep this pair on your watchlist and enter when the entry criteria of your strategy is met.
Please support this idea with a LIKE and COMMENT if you find it useful and Click "Follow" on our profile if you'd like these trade ideas delivered straight to your email in the future.
Thanks for your continued support!Welcome back! Let me know your thoughts in the comments!

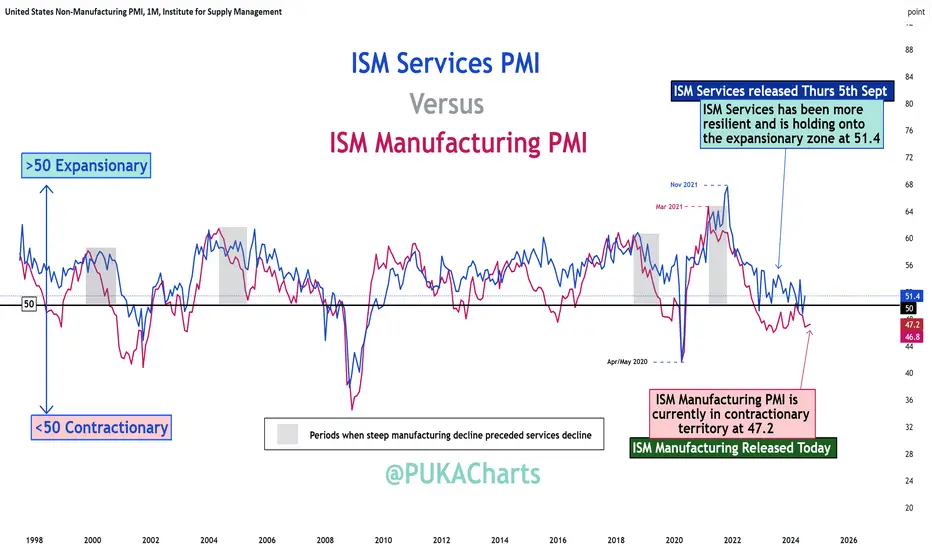
ISM Manufacturing PMI Remains Contractionary ISM Manufacturing PMI (released today).
Rep: 47.2 🚨Below Expectations & contractionary🚨
Exp: 47.5
Prev: 46.8
Anything below 50 is considered contractionary.
ISM Services PMI
ISM Services PMI is released this Thursday 5th Sept 2024. ISM Services is currently expansionary at 51.4. Lets see what Thursday brings.
A Trade as Simple as "Shooting Ducks in A Barrel" Soybean ShortIf you follow my channel, you know I love to trade a strategy that I like to call "Ducks in a Barrel". Its a strategy that is as easy as shooting ducks in a barrel.
We have a setup forming on the Daily timeframe for the Soybeans market.
Step 1: Identify trend (I like to see the 52 & 39 period SMA's sloping strongly and pulling away from each other). In the case of Soybeans, we see a strong bearish trend.
Step 2: In a down trending market, we want to see an asset become OVERVALUED VS GOLD & US TREASURIES. We see with Soybeans, we are now overvalued on the Daily timeframe vs gold & treasuries. Assets that are overvalued in a strong downtrend are assets that we want to SELL.
Step 3: In a down trending market, we want to see an asset become OVERBOUGHT. We see on the Daily stochastic that Soybeans are overbought. Assets that are overbought in a strong downtrend are assets that we want to SELL.
Step 4: In a down trending market, we want to see advisor SENTIMENT become BULLISH. The advisors and general public are usually wrong, so when they become overly bullish in a strong down trend, we want to sell into that bullish sentiment.
Step 5: We can also look at accumulation/distribution indicators and momentum for further confirmation of our idea. But realistically, we just need to see 2 or more of the above indicators confluent with each other to have a setup market.
Step 6: For the Daily timeframe, I utilize the H4 chart for my entry. The safest entry is to wait for 2 full range days to form beneath the 18 period SMA, and from there market enter when the lowest low of these 2 candles is hit. There are other entry techniques to get into the market earlier, but they come with greater risk.
NOTE: If you follow my channel, you will know that I am long Soybeans based on my COT strategy. Commercials are close to the max long positioning of the last 3 years (bullish), OI grinding up on the multi-month down move caused by CM's (bullish), paunch forming (bullish), bearish weekly sentiment (bullish), undervalued on weekly vs gold and treasuries (bullish), major cyclical lows (bullish). I have different accounts for different strategies, as sometimes we get conflicting signals.
If you have any questions about these "ducks in a barrel" trade setups, feel free to give me a message.
As always, I wish you good luck & good trading.

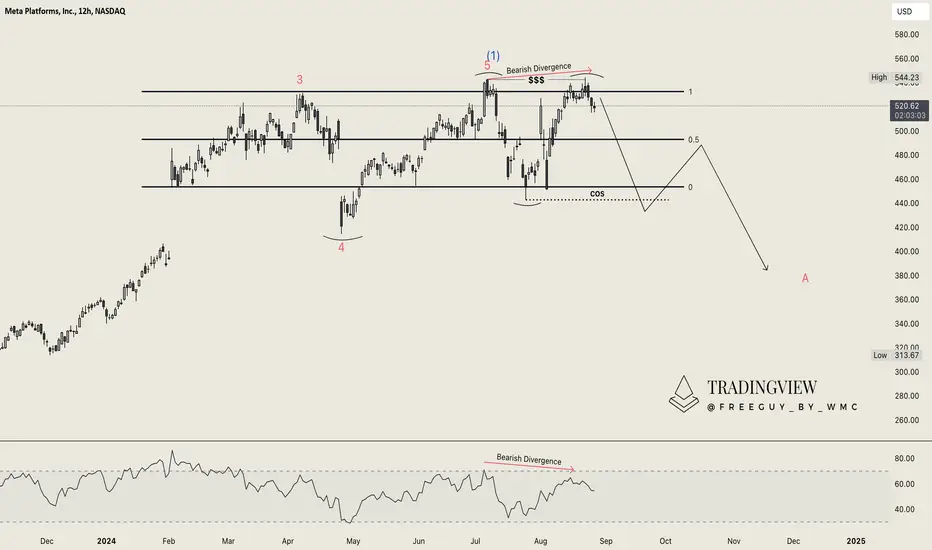
Meta (META): Watching for a SetbackIt has been a lovely rise within META since 2023. However, we are now continuing to range for some time, which is usually a sign of a possible setback before a continuation. This setback could be beneficial for sustainable growth and further rises.
Zooming in, we can observe a range building since February 2024. This range has been respected multiple times so far, and it seems likely to continue. However, the small breach of the top looks somewhat like a Swing Failure Pattern (SFP) and could be a signal of profit-taking by many traders. If we breach through the $440 level, we could see a change of structure if a candle closes below it. If this happens, it would confirm our analysis. Until then, we might see higher prices as this is technically still a bullish trend within this range.
Another small indicator supporting our view is the bearish divergence on the RSI. While RSI is a good indicator with a high win rate, it’s not infallible, so this scenario might not play out. Still, this seems the most likely outcome to us at the moment.
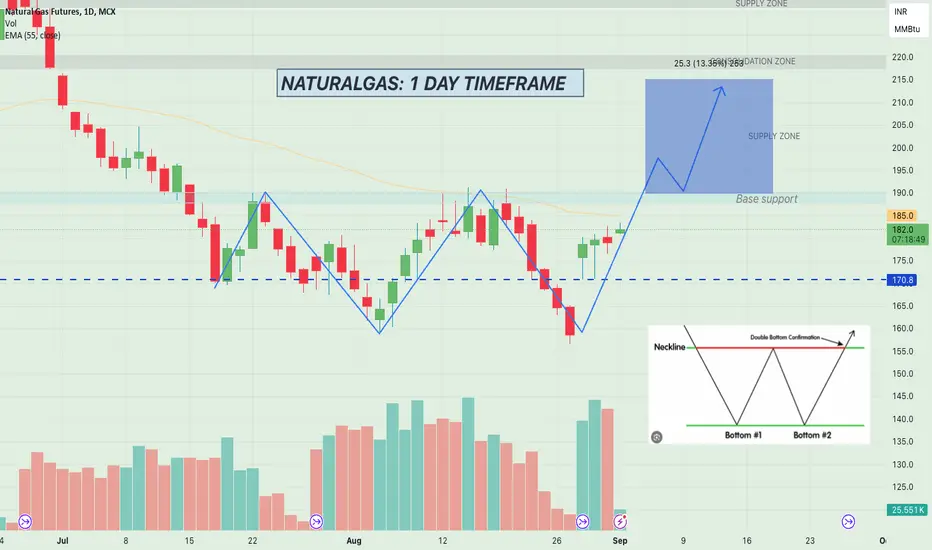
DOUBLE BOTTOM IN NATURALGASNatural Gas (NATGASUSD) 1 DAY Chart Analysis
Bullish Indicators Identified: Bullish breakout above the neckline of a double bottom pattern, previously acting as horizontal resistance.
Break of a falling trend line, signaling potential trend reversal.
Expanding Demand Zone: The broken structures suggest a new demand zone, increasing the likelihood of a bullish continuation.
T arget Level: Watching for price movement towards the 2.10 level.
Breakout Confirmation: A strong move above 187.8 will confirm the bullish breakout.
Risk Management: make sure to put stoploss
Disclaimer: This is a technical analysis based on the provided data and should not be considered financial advice. Trading involves risk, and past performance is not indicative of future results.
IF THIS WILL HELP YOU PLEASE LIKE THE POST ❤️
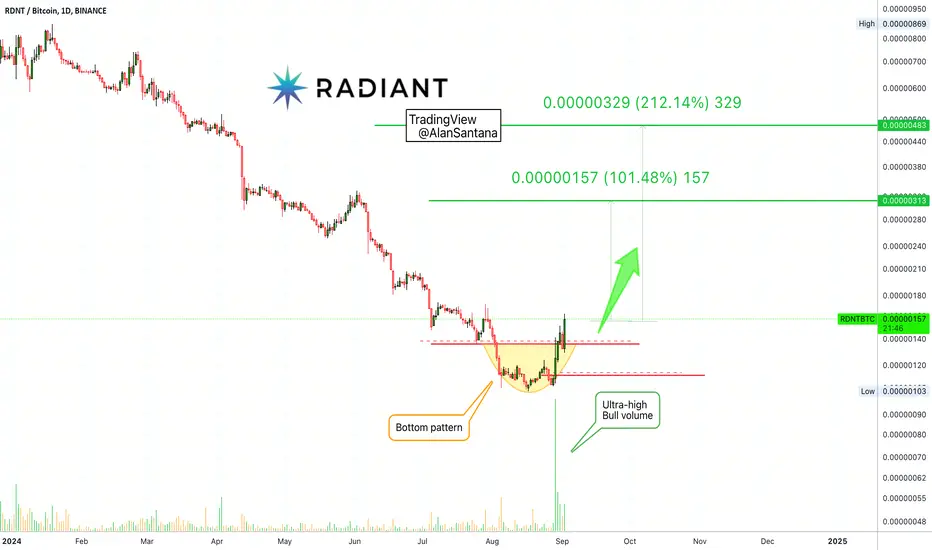
Radiant: High Volume = High Potential For Fast Move! (100%-200%)This chart is so clear that it hardly needs any explanation. For some we go deep into TA, while with other charts we go deep into the psychology of trading. Some other times we focus on courage, inspiration, success and personal growth. Some others are meant for profits; potentially fast growth.
➖ A strong decline is present on the RDNTBTC chart, to the left.
➖ A strong bottom formation is also present and a recovery right away.
➖ The rounded bottom is in and the pair trades back above support.
➖ The most important signal of all is the volume... Notice the really high volume on this one.
High volume can be translated, in this case, as a high potential for fast growth.
I am sharing this one as a short-term signal but remember, while only 100% is mapped on the chart, there can be more.
Plan before jumping in.
Remember there is always risk involved.
Thanks a lot for your continued support.
Namaste.
TradingView Auto Chart Patterns - AMZN LULU GOOGL META NVDA I've been playing around with the auto chart patterns for a few weeks now and so far it's been pretty accurate. I think it's great to have an automated tool to help identify a lot of the common patterns I look for so I wanted to share. It also gives extra confirmation to my current bias. We'll see how these patterns end up playing out.

September Effect - Up/Down/Sideways - How I'm Trading ItSummer trading is officially done and the market will be news sensitive leading up to the big bad FOMC Rate Decision on September 18.
August's monthly candle is a wild one with a massive wick to the south and the bulls pushed the SPY within a whisker of all-time highs, Dow to several all-time highs, Nasdaq into a nice bullish recovery posture, and Russell the same (higher lows).
6 Central Bank Rate Decisions in September
US News on Employment and Inflation all rolling out before the FOMC
I'd like to see a seasonal dip or pullback to offer more accumulation opportunities before a run higher. Let's see how it plays out.

Ethereum - Buy It Now Or Never!Ethereum ( BITSTAMP:ETHUSD ) will offer a final retest:
Click chart above to see the detailed analysis👆🏻
Ethereum is about to retest a perfect confluence of support from which a bullish reversal is almost certain. Following the overall bullish trend, Ethereum should retest the previous all time high next and then maybe even follow Bitcoin and create new all time highs going into 2025.
Levels to watch: $2.000
Keep your long term vision,
Philip (BasicTrading)

X, Starlink and Tesla: Musk's Conflicts Shake Wall StreetElon Musk's companies, X (formerly Twitter), Starlink and Tesla, are in the spotlight on Wall Street, impacting risk perception and market volatility. X faces blockades in Brazil after refusing to remove profiles linked to the far right, which has led to regulatory tensions that extend to Starlink, whose satellite internet service has been affected by the blocking of accounts to secure fines imposed on X.
Simultaneously, Tesla remains a key player in the tech stock market, but regulatory challenges faced by Musk on different fronts create uncertainty about the future performance of his companies. The lack of a legal representative for X in Brazil, along with the closure of its offices, illustrates the complexity of managing these controversies, which affect investor confidence.
The tensions come against a backdrop where Wall Street is closely watching the Federal Reserve's moves on interest rates, with the first expected adjustment of 25 basis points this month. Although these measures aim to stimulate the economy, any data surprises could increase volatility in the markets, which have already shown significant ups and downs in recent weeks. As investors look for stability, the conflicts of Musk and his companies add to market volatility, demonstrating how regulatory and political challenges can significantly influence the performance of tech stocks in the coming days.
Five key points will need to be watched:
• U.S. employment data.
• The aforementioned volatility.
• Rate cuts by the Bank of Canada, being its third consecutive rate cut at its meeting this Wednesday. Canadian economy showing mixed signals, having flat growth in the summer.
• Pressure on oil prices, caused by increased expectations of a supply increase by OPEC+ starting in October. Brent and WTI posted weekly and monthly losses, as US rates add pressure.
• Economic data from China, Caixin manufacturing PMI data for August was released today, and that expected a slight recovery although in August manufacturing activity fell to its lowest level in six months, increasing pressure on Beijing to implement economic stimulus measures to strengthen domestic demand.
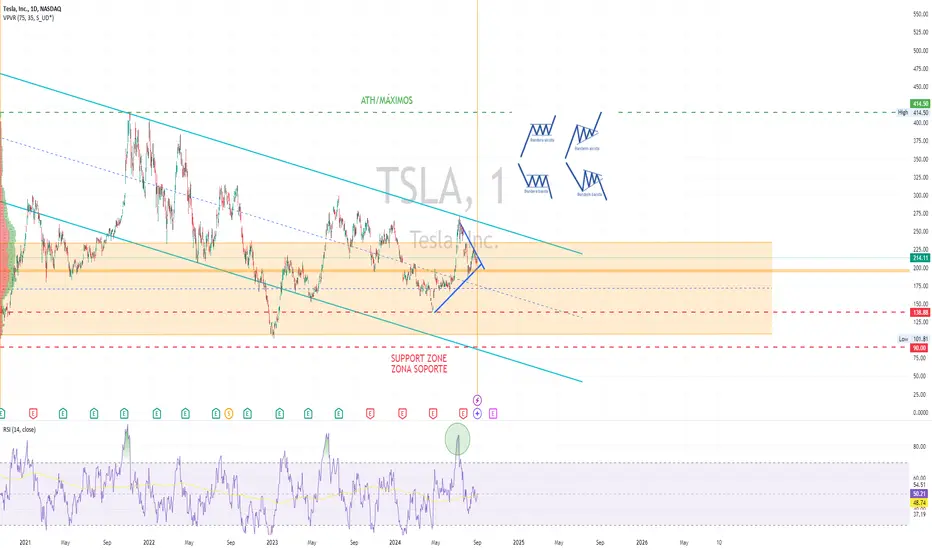
Looking at the chart of TESLA, Inc (ActivTrades Ticker: TSLA.US) we can see that the price of tesla has pulled back considerably since November 2021, giving itself a relatively sustained downward channel for 3 years. This year 2024, since April a price recovery trend has formed, not without highlights caused by the company's lack of results compared to its competitors. The direct impact of the X and Starlink blockades on Elon Musk's main company will have to be seen at this time. At the moment RSI has indicated a strong sell signal on July 8 that moved the price from $272 to $183. Currently the Checkpoint is around $195.50 and comes from a corrective candlestick sequence. If we go to the more charting aspect, a clear bearish pennant has formed so there could be a new correction to the lows, following the current trend pattern, which would move Musk's company in the direction of $101 or at least to $138.88 which is the support area of the last impulse.
Ion Jauregui - ActivTrades Analyst
*******************************************************************************************
The information provided does not constitute investment research. The material has not been prepared in accordance with the legal requirements designed to promote the independence of investment research and such should be considered a marketing communication.
All information has been prepared by ActivTrades ("AT"). The information does not contain a record of AT's prices, or an offer of or solicitation for a transaction in any financial instrument. No representation or warranty is given as to the accuracy or completeness of this information.
Any material provided does not have regard to the specific investment objective and financial situation of any person who may receive it. Past performance is not reliable indicator of future performance. AT provides an execution-only service. Consequently, any person acing on the information provided does so at their own risk.
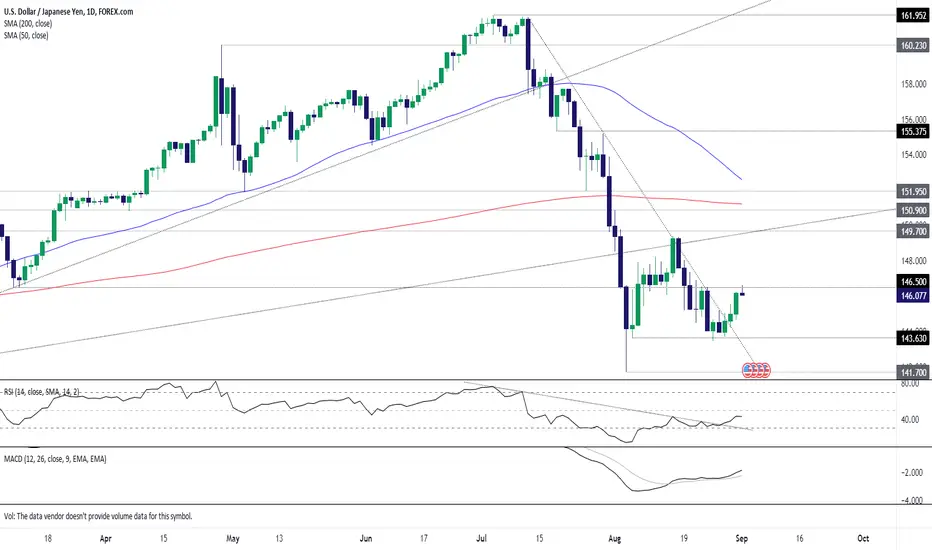
USD/JPY trade setups using 146.50 for protectionSitting in the middle of its recent range at the beginning of a week laden with risk events, 146.50 looms as a potential level USD/JPY traders can build setups around. With price and momentum breaking their respective downtrends last week, and with no meaningful sign of further deterioration in the US labour market based on recent jobless claims data, buying dips is preferred to selling rallies near-term.
Given that view and proximity to 146.50, one potential setup would be to buy a clean break above the level with a stop below for protection. Traders could target 149.70 which is where the former uptrend dating back to early 2023 now intersects with horizontal resistance. Traders could also buy around these levels with a tight stop below for protection, although that screens as a lower probability setup despite what would be entry at lower levels.
While price momentum looks to be shifting higher, should USD/JPY continue to be capped by selling at 146.50, traders could look to sell below the level with a stop above for protection. 143.60 is one potential target given it attracted buying support on several occasions during August.
DOGE: A Bullish Rally or Another Trap? What You Need to KnowYello! Could we be on the verge of a major #DOGEUSDT rally? Or is another fake-out looming? Let's dive into the latest analysis of #Dogecoin!
💎#DOGE is currently displaying strong potential for a bullish continuation from a critical support zone at $0.096. We've been tracking #Dogecoin closely as it follows a falling wedge pattern, and it now appears ready to break above the descending resistance line. The next target? Internal resistance at $0.151 — a key level that could set the stage for a bigger move.
💎If #DOGEUSDT holds strong at this critical support, we might witness a significant rally, echoing previous market surges. A breakout above $0.151 could pave the way for an advance toward the next resistance zones, potentially driving the price even higher.
💎But here's the catch... It’s essential to stay cautious. If momentum weakens at this support, we could see a pullback to the lower support area around $0.080-$0.087.
💎Keep a close eye on CRYPTOCAP:DOGE ’s price action! A daily close below this demand area could invalidate the bullish scenario and trigger further declines.
Stay focused, patient, and disciplined, Paradisers🥂
MyCryptoParadise
iFeel the success🌴

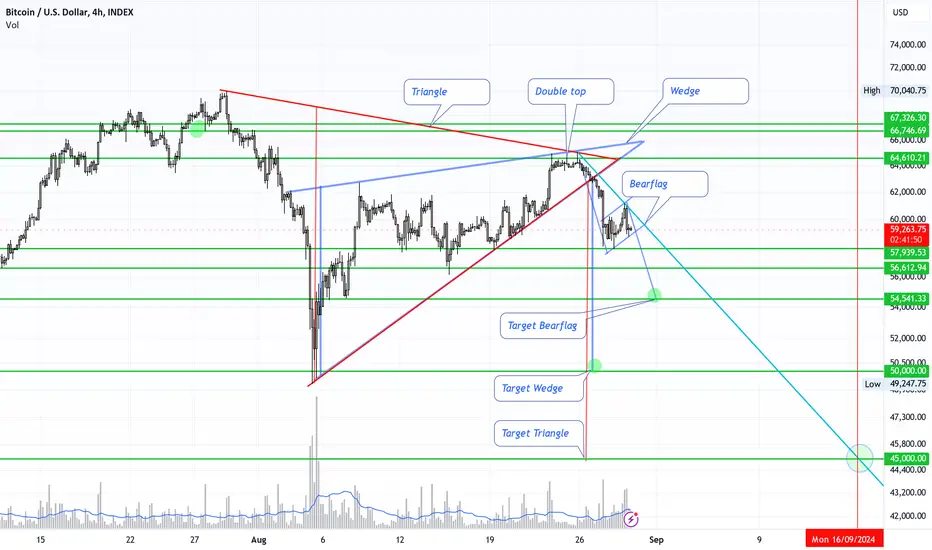
BTC Bitcoin Correction Outlook 4 hour Chart Extended AnalysisBTC Bitcoin Correction Outlook 4 hour Chart Extended Analysis
In this 4-hour short-term chart, we observe both a triangle and a bearish rising wedge that have been broken, signalling potential downward momentum. Additionally, we now see the formation of a bear flag, which is typically a continuation pattern. We can also see several support lines that highlight important levels to keep an eye on.
The identified targets include:
Bear Flag Target: 54,541
Bearish Wedge Target: 50,000
Maximum Correction Target (Triangle): 45,000
These targets closely align with the Elliott Wave C wave projections:
0.618 Fibonacci Extension: 56,764
1.000 Fibonacci Extension: 54,023
1.618 Fibonacci Extension: 49,589
My current outlook suggests the possibility of establishing a double bottom around 50,000, although it's too early to confirm this scenario.
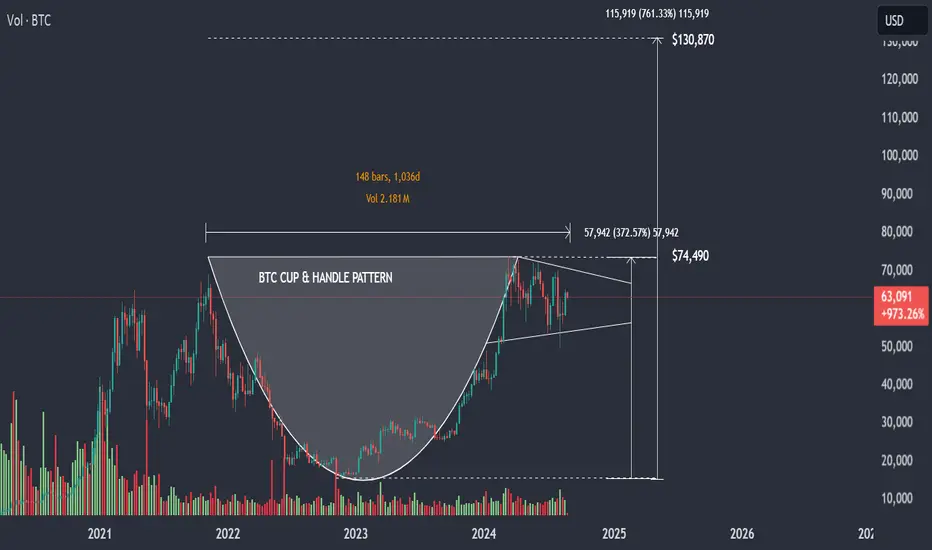
On the weekly chart, the inverted Head & Shoulders formation, Cup & Handle pattern, and the Descending Broadening Wedge, along with the bull flag, remain fully intact. These patterns support long-term targets for Bitcoin ranging between 150,000 and 325,000 in 2025.
Happy trading and good luck!
Disclaimer: This is my personal analysis and should not be taken as financial advice. Always conduct your own research before making any investment decisions.
Soybean Oil : Bull setup?December beanoil is a high probable low area worth having a closer look as numerous projections and retracement confluencing at around the 37-38 cts.
The time taken in the bull market from March '20 to April '22 is almost the same time it took to retreat. At the recent low,it took 840 calendar days compared to 772 days of rise.
Supporting the high probability is the triple divergence of MACD.

8/31 bitcoin.Hello, this is Full_Time_Trader88.
Let's dive into the Bitcoin market analysis for August 31st.
(Please note, I do not engage in any paid promotions. This post is purely for informational purposes and should be used as a reference.)
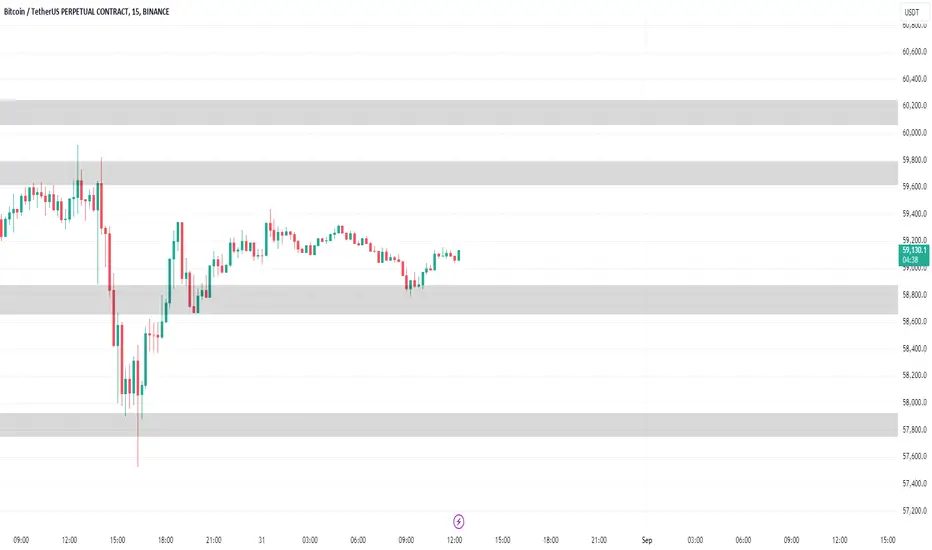
(15-Minute Chart - Layer Structure)
Bitcoin appears to be forming a "layered structure," where support and resistance levels act as distinct "layers." This structure provides a clean and well-organized chart view.
Layer 1: $57,750 - $57,928
Layer 2: $58,655 - $58,876
Layer 3: $59,614 - $59,794
Layer 4: $60,060 - $60,249
This structure was drawn two days ago and remains relevant today. (Anything above Layer 4 could be considered the "roof.")
(Remember Layer 1 for later.)
(1-Hour Chart - Head and Shoulders)
On a broader scale, a "Head and Shoulders" pattern is visible, which typically signals a bearish trend. The neckline of this pattern aligns with the "Layer 1" zone. If Layer 1 is broken, it could lead to increased selling pressure.
(4-Hour Chart - Divergence)
On the 4-hour chart, a bullish divergence was observed, which led to a minor rebound. However, the full potential of this divergence hasn't been realized yet. As long as the previous low of $57.5K holds, the market may still be influenced by this bullish divergence.
(If $57.5K is breached, it could trigger the Head and Shoulders pattern.)
(Daily Chart - Candlesticks)
Recent daily candles show minimal fluctuations, with the last four candles not moving more than 1%. This tight range suggests an accumulation phase, which often precedes a significant move.
(We might see an expansion phase soon.)
(Daily Chart - Bollinger Bands)
The middle line of the Bollinger Bands, which corresponds to the 20-day moving average (20MA), has been a strong resistance level. Breaking through this level is crucial for a potential trend reversal.
(Daily Chart - Bull Flag Pattern)
On a larger scale, a "Bull Flag" pattern has been forming over the past 170 days, including a "flagpole" phase that extends the pattern to over 220 days. This large-scale pattern is critical, and its resolution could determine Bitcoin’s trend heading into the end of the year.
(All movements in the past six months have been within this pattern.)
The Bull Flag is typically bullish, but only if it breaks upwards. A downward break would be a significant warning sign.
The short-term layered structure is crucial.
Breaching Layer 1 could activate the Head and Shoulders pattern, posing a risk.
Bitcoin is accumulating energy during its sideways movement.
All of this is happening within the larger Bull Flag pattern, which could dictate the year-end trend.
For short-term trading, focusing on the 4-hour chart or lower timeframes may be more practical.
That’s all for this brief analysis. Please use it as a reference.
Thank you for reading.
Your likes and subscriptions are greatly appreciated!
• This is not a buy or sell recommendation.
• It represents a personal perspective and is for reference purposes only.
• All decisions and associated responsibilities are solely yours.
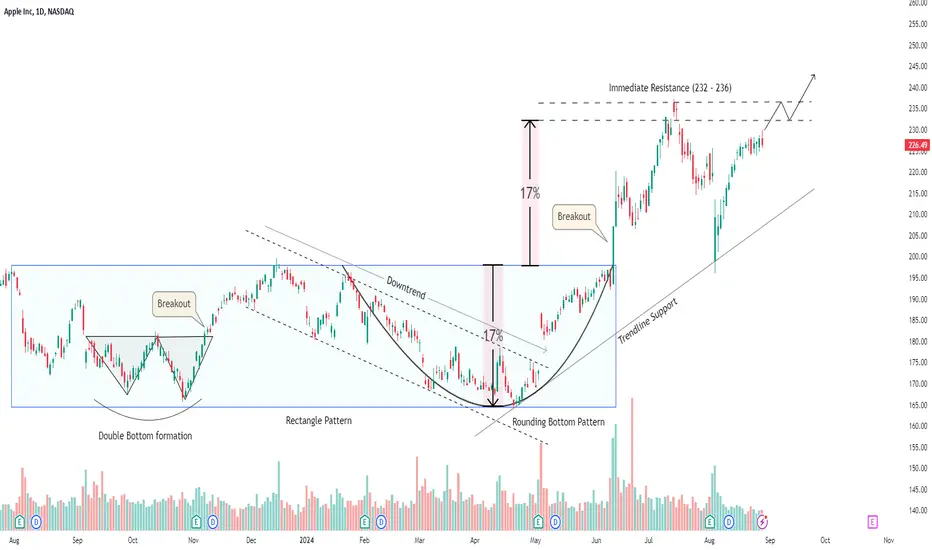
Apple is a great buy once it exceeds 240!
The stock experienced an extended period of consolidation, during which it formed several bullish chart patterns, including the Double Bottom and Rounding Bottom.
After the price broke above the neckline of the Rounding Bottom, the stock surged to reach an all-time high close to the 237 level.
Since then, it has retraced nearly 17%-18%, returned to its support level.
Now, with a robust rebound underway, the stock is approaching its resistance zone, and there are strong expectations for a significant breakout.
The optimal buying opportunity lies just above the 240 level.
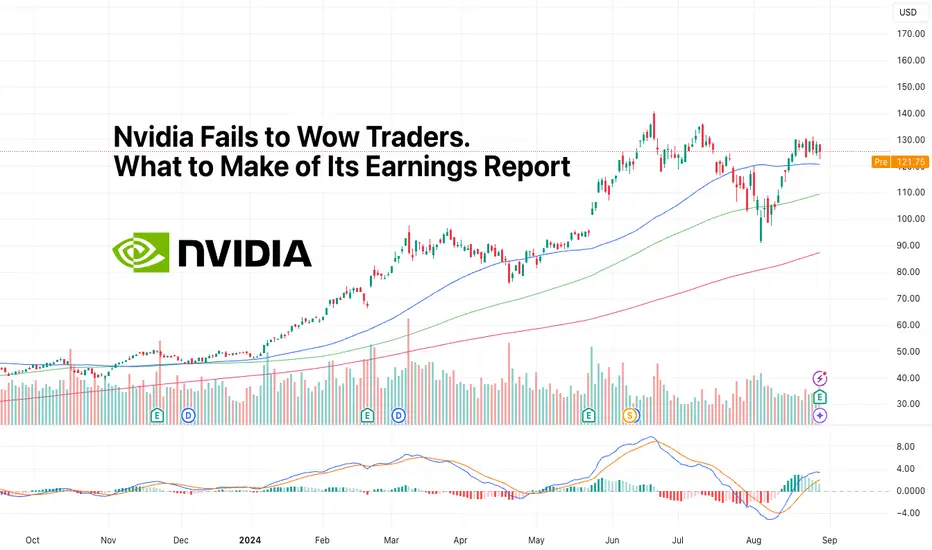
Nvidia Fails to Wow Traders. What to Make of Its Earnings ReportNvidia stock (ticker: NVDA ) is up nearly 3,000% in the past five years. Back then, in 2019, no one really cared about its earnings report as it was known mainly for its niche products targeting geeks, gamers and crypto miners. Now, when Nvidia reports, the world listens.
Everyone and their moms were glued to the screen Wednesday afternoon when the company released its quarterly earnings report. The numbers were good — triple-digit growth was there and guidance was calling for even more growth.
Yet investors proceeded to dump the stock. Big time . Shares lost as much as 10% of their valuation in after-hours trading before Nvidia fans scooped up some of those bruised gems at a discount.
Nvidia is worth $3 trillion (depending on the day) — that’s about 6% of the massive $50 trillion valuation of the S&P 500. The lofty price tag is largely due to Nvidia leading the AI boom with its chips being the hottest commodity in the tech world. As a result, Nvidia has turned into a top pick among the thousands of stocks available out there.
That gives you an idea of this stock’s important role. Markets are placing so much significance on Nvidia’s earnings update that you might as well put it on par with the jobs report or a Fed event.
Good but Not Absolutely Mind-Boggling Amazing
Analysts: We expect revenue growth of 115%.
Nvidia: Here’s 122%.
Analysts: Nooo, why not a bigger beat? Disappointed!
Nvidia posted another blockbuster quarter with $30 billion in revenue, up 122%, surpassing Wall Street’s estimates of $28.7 billion. Earnings per share landed at 68 cents a pop, up 152%, eclipsing consensus views of 65 cents. Thanks to the wide profit margins, Nvidia pocketed some $16.95 billion in net profit.
It did say, however, that gross profit margins narrowed quarter on quarter. For the three months to July 28, Nvidia generated an adjusted gross margin of 75.7%, down from 78.9% the previous quarter. Full-year gross margins are projected to sit above 75% while total revenue is expected to hit $120 billion.
With Great Returns Comes Great Responsibility
Here’s a harsh truth: the bigger you become, the higher the expectations for more breakneck growth. Nvidia’s revenue blasted by a supercharged 265% in the previous quarter. And if 122% can’t keep shares above the flatline, then Nvidia’s rapid expansion has turned against it. And by the looks of it, that growth is going to be increasingly challenged. Large-cap rivals are threatening to chip away (pun intended) at Nvidia’s dominance, potentially taking from its market share, diminishing the profit margins and pulling some of its Big Tech clientele.
For the October quarter, Nvidia chief executive Jensen Huang projects revenue of $32.5 billion, which exceeds the average consensus of $31.7 billion. But, then again, it doesn’t exceed it by a lot — and that didn’t sit well with the overly optimistic investors out there.
Not everything was above market expectations. Nvidia’s next-generation AI chip — Blackwell — still hasn’t started shipping and that unnerves some stock holders. Huang tried to assuage investor fears during the earnings call, saying that despite some design-related delays , Blackwell will ramp up production as expected and will bring in “several billion dollars” still this year. In a move to instil confidence and maybe patch things up, Nvidia authorized a juicy $50 billion stock buyback, which is a mere 2% of its market cap.
What are you doing with Nvidia’s shares? Are you a long-term holder or looking for the right entry? Maybe buying this dip? Let us know in the comment section!
The TradingView Show: Volatility Spikes with TradeStationWelcome to our latest live TradingView show with TradeStation! Kick back and watch this show to learn about the key things that are moving markets and shaping the conversation as the summer trading season comes to an end. What will you learn in this show?
Recent Price Action: We’ll analyze the market movements since the "carry trade crash" and see how this has affected various asset classes.
Interest Rates: We'll explore the latest developments in interest rates and their implications for trading strategies.
Dollar Index: Understand the current trends in the Dollar Index and how it influences currency movements.
Currencies: We’ll break down recent changes in currency pairs and what they mean for traders.
Then, we dive into a masterclass about Catalysts for Stock Movements, in which you'll learn about the key factors driving stock price changes. We’ll discuss 7 important catalysts to watch for, including:
1. Growth: Look at NVIDIA’s recent performance in AI chip sales.
2. Profit Margins: Examine how companies like META are improving their profitability.
3. Strategic Actions: Consider new leadership and strategic moves, such as Starbucks' new CEO.
4. Business Transformation: Explore how companies like Netflix and Microsoft are evolving their business models.
5-7. Other Key Factors: See how Apple's shift to services fits into the broader market picture.
Here are some examples of these catalysts:
Growth - Monitor trends like NVIDIA's AI chip sales.
Profit Margins - Track profitability improvements, such as with META.
Strategic Actions - Look out for major corporate strategies, like Starbucks' new CEO.
Business Transformation - Note significant shifts, such as Netflix’s new ad feature or Microsoft’s cloud computing focus.
Additional Catalysts - Keep an eye on other important factors like Apple’s expansion into services.
Don’t forget to jot down this checklist and join us each month for the TradingView Show, where we spotlight community members and cover educational content across equities, AI, crypto, gold, forex, and more.
Compliance and disclaimers:
Important information: tradestation.com/important-information/
Disclosure options: theocc.com/Company-Information/Documents-and-Archives/Options-Disclosure-Document
ETF prospectus page: tradestation.com/insights/etf-disclosures/

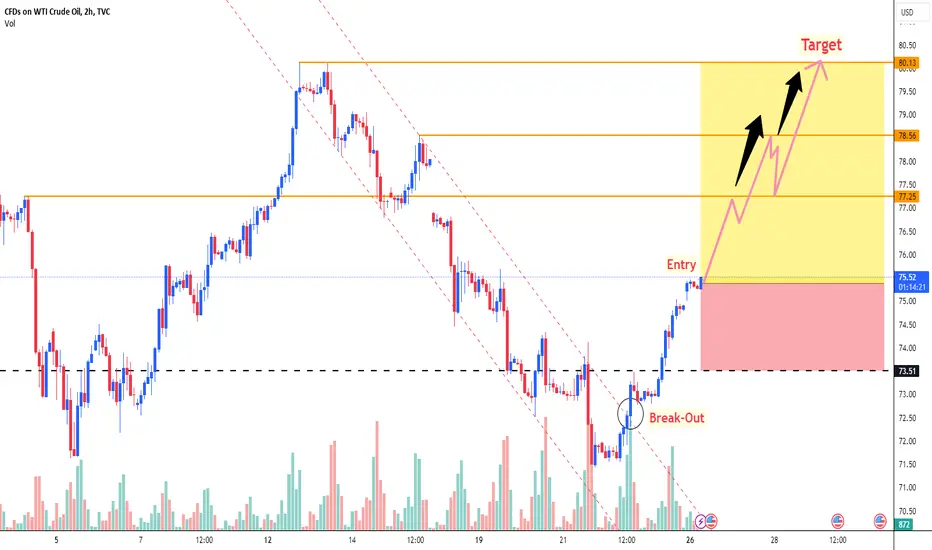
USOIL (H2) : THE USOIL TARGETTING USD 80.00 IN THE BULLISH TRENDUSOIL (H2) : THE USOIL TARGETTING USD 80.00 IN THE BULLISH TREND
According to this technical analysis, the current trend indicates an upward movement for USOIL. Prices are trading above moving average intersections, and the MACD indicator shows positive signs. Considering this, we can consider buying from the current price of $75, with a profit-taking target around $76 per barrel. Additionally, some traders expect the price to rise further, potentially targeting the resistance area around $80. Keep an eye on the market developments and adjust your trading plan accordingly!
1. Technical Analysis:
1. Trend: The current trend for USOIL is bullish.
2. Moving Averages: Prices are trading above key moving averages, which is a positive sign.
3. MACD Indicator: The MACD indicator also shows bullish momentum.
2. Price Levels:
1. Current Price: $71.74 per barrel.
2. Profit Target: Consider buying with a profit-taking target around $75.57 per barrel.
3. Potential Upside:
Some traders expect the price to rise further, potentially targeting the resistance area around $80.00.
LIKE👍, COMMENT 💬 & FOLLOW ➕, these figures can encourage me to analyze more efficiently for you. My all followers are requested to support me, comment my ideas and share your thoughts in comment box and new comers are invited to follow and support me.
BTC and the BIGGEST CUP & HANDLE IN CRYPTO HISTORY!BTC is forming an absolutely massive Cup & Handle on the Daily/Weekly chart. There has never been a formation like this in the history of crypto, and it's sure to be an incredible run to levels that will shock the world.