Live stream - Livestream 1-12-2024: Why Bitcoin Did Not Go UpBitcoin was supposed to go UP on the ETF launch news... but it did the opposite! Why this was just another "sell the news" event.
Community ideas

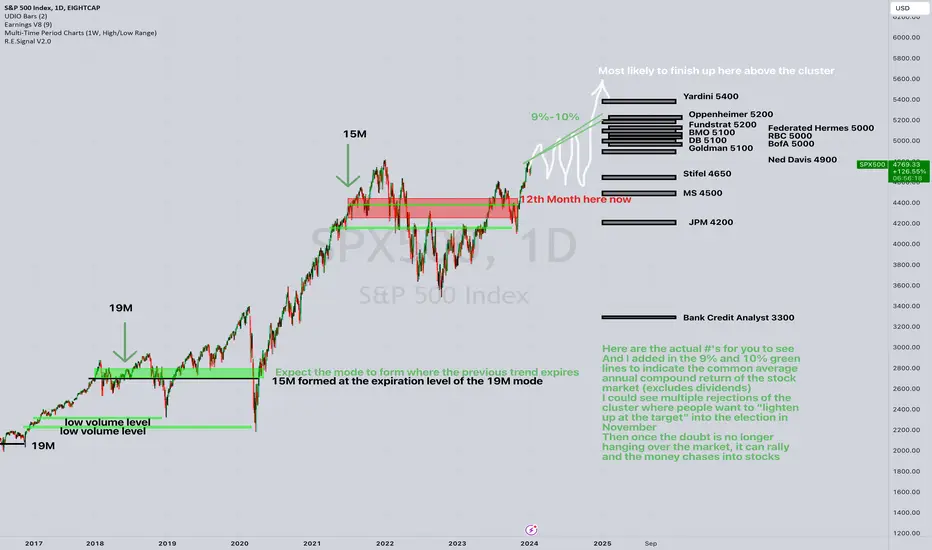
$SPX500 2024 Guess for the Year $SPYHere are the actual #'s for you to see the 2024 Wall Street analysts forecasts on the chart. Once those are charted in the black rectangles at the year-end price targets, we can see where there are concentrations of estimates and where investors might pause and sell as the target has been reached for the year.
And then I added in the 9% and 10% green lines to indicate the common average annual compound return of the stock market (excludes dividends).
I could imagine there will be multiple rejections of the cluster where people want to "lighten up at the target" into the election in November. I plotted three pullbacks from the resistance area and then once the doubt is no longer hanging over the market, it can rally and the money chases into stocks.
Election years have often been sideways grind and this year seems like more of the same. The media headlines are negative and investors are scared of a recession and another banking crisis. Inflation is always a fear and the Fed has hiked 500 basis points and although their language has shifted from "higher for longer" over to "easing ahead possibly three rate cuts in 2024" to paraphrase Jerome Powell at the Fed.
The stock market is unchanged after two years and many investors are shell-shocked from the bear market in 2022 and trying to fend off the lure of T-Bills and money market funds with their juicy 4%-5% yields which are the highest they have been in years. Take a look at my interest rate "guess" from last year when rates were near peak to show you what I was thinking back then (hint: topping, down to sideways. See link below).
This is my annual fun 'guess' which has been something I have done for about the last 10 years and with some luck it has at least acknowledged the big factors in the market and even if I am dead wrong I took a shot at it and welcome questions and comments.
Cheers to a healthy 2024 for everyone.
Tim
Jan 11, 2024 10:00AM EST
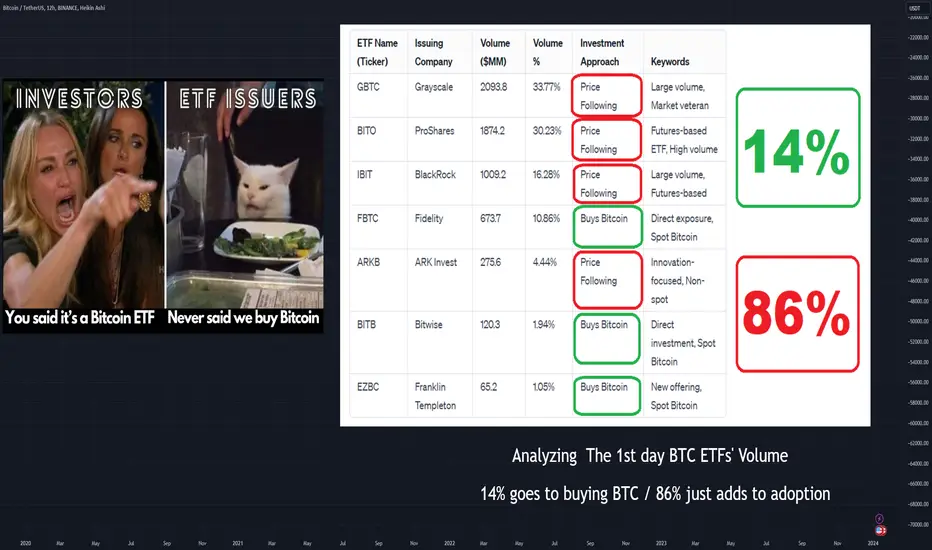
Spot Bitcoin ETFs Surge – A Bullish Signal for Market Adoption?Welcome to a pivotal moment in the Bitcoin market! As we witness the launch of several spot Bitcoin ETFs, including giants like Fidelity's FBTC, Bitwise's BITB, and Franklin Templeton's EZBC, the landscape of cryptocurrency investing is evolving before our eyes.
First-day volumes paint a promising picture, with funds that 'Buy Bitcoin' directly, such as FBTC (Fidelity), BITB (Bitwise), and EZBC (Franklin Templeton), accounting for a significant 14.06% of the total volume. This direct investment approach is injecting fresh capital into the spot Bitcoin market, hinting at a bullish outlook for Bitcoin adoption and price movement.
Let's not overlook the powerhouses that follow Bitcoin's price through derivatives, such as the ProShares Bitcoin Strategy ETF (BITO) and Grayscale's GBTC, which command an impressive 85.94% of the total volume. While they may not directly purchase Bitcoin, their market presence can't be ignored, as they reflect growing investor interest and add to the overall Bitcoin market depth.
With the potential move to a T+1 settlement cycle, the market could see increased efficiency and a more immediate impact from ETF inflows. This could be particularly beneficial for ETFs purchasing Bitcoin, as it allows for quicker capital deployment, enhancing the responsiveness of the market to new investments.
But let's temper our optimism with a dose of reality. It's crucial to remember that not all ETFs are created equal – some provide direct exposure to Bitcoin's price movements, while others offer a more nuanced approach through futures and other financial instruments. The true impact of these funds will unfold with time, as we closely monitor their influence on market demand and price dynamics.
In essence, the influx of new Bitcoin ETFs could be a harbinger of increased adoption and integration of Bitcoin into the mainstream financial world. This is a bullish sign for those of us optimistic about the future of digital assets.
Stay tuned for more updates as we navigate this exciting phase of market growth. And remember, despite the complexities, the introduction of these ETFs is a step toward broader acceptance and a testament to Bitcoin's enduring allure.
So..still very Bullish news... still very Good news!
One Love,
The FXPROFESSOR 💙
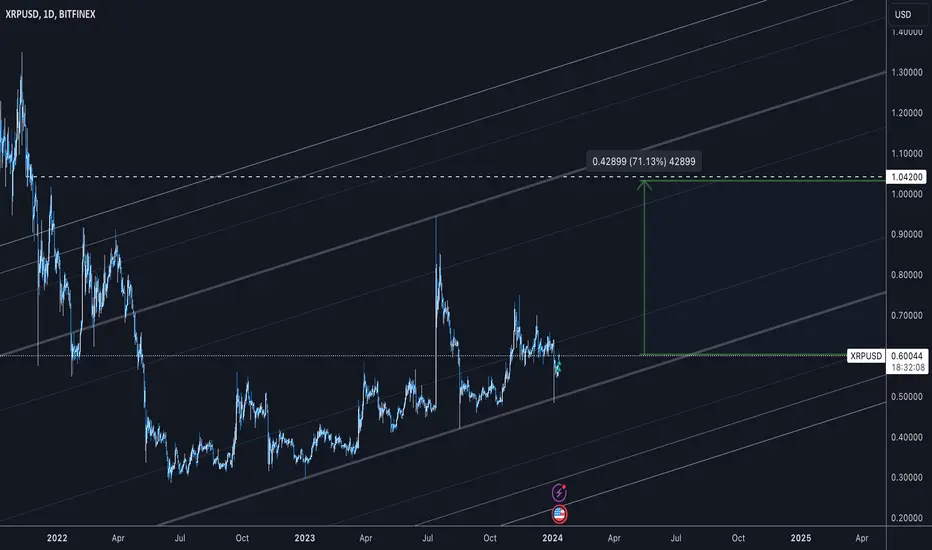
XRP High probability Uptrend with 70% move with target: $1.042The analysis below outlines a bullish case, with a target price of $1.042, marking a potential 71.76% increase from the current level.
Ascending Channel Formation:
The XRPUSD has been trading within an ascending channel, exhibiting higher lows and higher highs, a classical indicator of a bullish trend. The lower boundary of the channel has consistently provided support, suggesting a strong buying interest.
Consolidation Zone:
Prior to the current price action, XRPUSD was consolidating, with the price oscillating between a well-defined range of support and resistance levels. The upper boundary of this range may act as a springboard for a breakout.
Z-Score Probability Indicator:
The Z-Score indicator has dipped into the red zone, which often precedes a reversal. Given the other bullish signals, this could indicate a potential buying opportunity.
Moving Averages:
XRPUSD is currently trading above its significant moving averages, which have started to trend upwards, suggesting a bullish market structure.
AMD - Approaching All Time HighsHello Traders, welcome to today's analysis of AMD.
--------
Explanation of my video analysis:
After the massive breakout in 2016 we saw a rally of more than 4.500% on AMD. This rally was perfectly followed by a correction of 70% in 2022. As mentioned in my analysis, I am now waiting for a retracement back to the previous structure and if we have enough bullish confirmation, I will then look for potential trading opportunities.
--------
I will only take a trade if all the rules of my strategy are satisfied.
Let me know in the comment section below if you have any questions.
Keep your long term vision.

Breakout Alert: Nvidia (NVDA)Revolutionary AI-Optimised Graphics Propel Nvidia's Breakout
After months of sideways consolidation, Nvidia’s share price broke and closed decisively above resistance during yesterday's session – potentially reigniting the stocks powerful long-term uptrend.
Nvidia, a key player in the AI revolution, had an exceptional 2023, with its stock value more than tripling. However, the majority of these gains occurred in the first half of the year. Since summer, Nvidia's stock has been consolidating within a sideways range, as indicated in the chart below.
These prolonged consolidation phases within an established trend are not just typical but also beneficial. They facilitate stock rotation, involving accumulation and distribution, which helps prevent the trend from becoming overly stretched.
The breakthrough to new trend highs occurred following Nvidia's announcement of groundbreaking desktop graphics processors tailored for AI purposes—the GeForce RTX 40 SUPER Series. This unveiling triggered a substantial 6.4% surge, propelling the stock to close at record highs. Additionally, ahead of the Consumer Electronics Show in Las Vegas, the company introduced other AI-related components and software.
Nvidia (NVDA) Daily Candle Chart
Past performance is not a reliable indicator of future results
A Closer Look
If we take a closer look at yesterday’s breakout, there are several technical factors which indicate that the breakout has potential to continue:
Backed By Volume: On the hourly candle chart (below) we can see that the breakout was backed by an increase in volume – signalling increased participation. Volume acts as a validation mechanism for breakouts. It provides confidence to traders that the breakout has a stronger chance of being a genuine shift in market sentiment, rather than a temporary blip.
Higher Swing Lows: From November to December, Nvidia’s share price had been carving out a series of higher swing lows as the market repeatedly tested resistance. This signals that institutional ‘smart money’ traders were accumulating shares prior to the breakout.
Strong Close: Yesterday’s price action saw the shares maintain the breakout into the closing bell. This signals strong demand and reduces the probability that the breakout will fail.
Nvidia (NVDA) Hourly Candle Chart
Past performance is not a reliable indicator of future results
Disclaimer: This is for information and learning purposes only. The information provided does not constitute investment advice nor take into account the individual financial circumstances or objectives of any investor. Any information that may be provided relating to past performance is not a reliable indicator of future results or performance. Social media channels are not relevant for UK residents.
Spread bets and CFDs are complex instruments and come with a high risk of losing money rapidly due to leverage. 75% of retail investor accounts lose money when trading spread bets and CFDs with this provider. You should consider whether you understand how spread bets and CFDs work and whether you can afford to take the high risk of losing your money.
Bitcoin's Final Make Or Break MomentThis is my first post in some time. As I stated before, I'm largely moving on from crypto. I'm still here, paying attention to the market. I've also created a site for my fiction writing. Eventually, I may migrate some of these posts over there as representations of my non-fiction speculative market analysis.
Anyway, on to the important stuff.
Bitcoin did not succeed as a currency. Active addresses have still not seen any meaningful increase since 2017. The rate of growth for authentic currency adoption has slowed down along with price growth and expensiveness. studio.glassnode.com
There are only about 1 million active addresses. Nevertheless, price continues to be resilient. Perhaps this is due to its limited supply and its pivot in narrative to a "store of value." Indeed, it has been a pretty lucrative store of value, though more volatile than the stock market and other commodities. This doesn't necessarily make it a "good" store of value.
Regardless of what I think, the market will make its decision. Now is the time for that to happen. With ETFs supposedly on the horizon, we will get to see how much demand really exists for Bitcoin.
I'm going to take this moment to speculate a bit. If it continues to go up, my guess is it will be because of the ETF hype, but volume amongst most spot exchanges will remain low. Bitcoin dominance would likely rise to levels not seen since 2019. If it results in a bubble, eventually people will come to their senses and there will be a pop. It will attract a lot of media and government attention, not all of it positive.
If it drops from here, it will be like all the other times people had high hopes for Bitcoin. It will be like all the times Bitcoin was supposed to represent economic freedom. It will be like every single time Bitcoin made major news, only for everyone to talk about it just as it was about to crash. It will not come as any surprise.
If the ETFs fail to sustain the market to new highs, then I think there is little other chance for this asset, at least in the near future, until some other narrative takes hold. The thing exists, and as long as it does, people will ascribe their hopes, dreams, and (in my case) disdain towards it.
What would be a departure would be continued price appreciation and adoption. But, with a finite supply, there is of course a limit to how much people can buy. Then, what happens to it?
We shouldn't forget the other side of this market (apart from the ETF hype and the coin accumulation that requires). Binance is still a thing. BNB is still a juggernaut. Tron is still a thing, and so is the big stablecoin cartel which likely revolves around both.
But I'll spare you all my other thoughts on this subject. I just wanted to post a chart update, to show that I'm at least paying attention.
As for technicals, my chart shows two options. If it continues to hold in this broadening wedge pattern, the next target could be $90k, or roughly 2x from here, surpassing the previous all time high. As much as my previous analysis will be wrong if that happens, it's a possibility. The other scenario shows what could happen on a breakdown, back below the broadening pattern.
Here's the BLX chart, showing that Bitcoin has so far been rejected at a former long term trendline. This chart shows some more possibilities.
Let's see if it can break back above.
Zoomed out:
Either way, prepare for volatility!
As always, thank you so much for reading. This is not financial advice, but meant for speculation and entertainment only.
-Victor Cobra
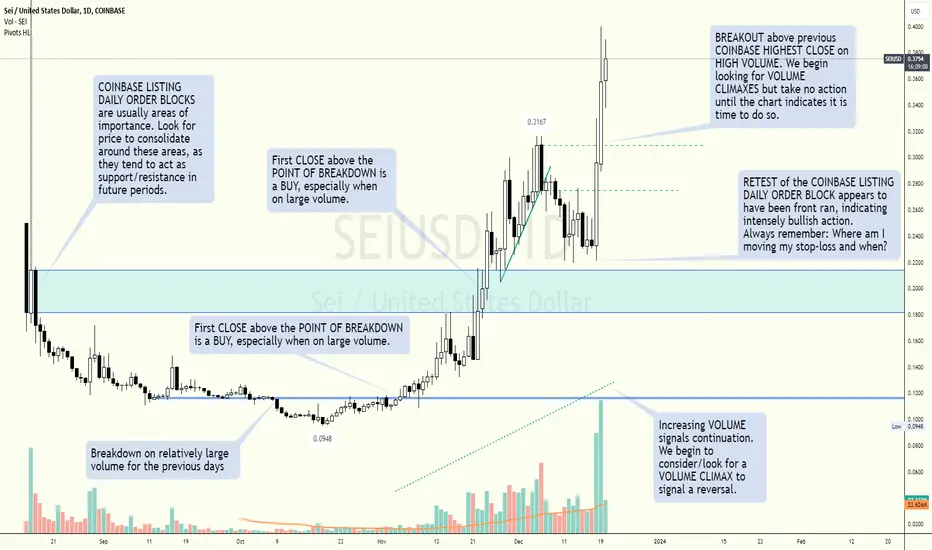
SEIUSD Hindsight AnalysisJust looking back at SEI-USD on COINBASE and figured I'd put my thoughts out there. By no means am I a professional--just trying to learn a few things along the way. Peep the chart and let me know your thoughts. I'm always looking for ways to improve my trading!
OMUSDT Potential Breakout Structure📊 BINANCE:OMUSDT is currently nestled in the tight base of a Falling Wedge pattern. Keep a close eye on the support level around 0.017, as a critical price to break sits at 0.024. Key resistances and upcoming targets are at:
🎯 Targets:
Target 1: 0.036
Target 2: 0.057
Target 3: 0.084
Target 4: 0.123
Regardless of the market situation, remember to use appropriate stop loss. A prudent approach is to set the stop loss below the support zone, with a weekly candle closing around 0.016 as a viable option.
Stay vigilant and keep an eye on the charts! 🚀

USDCAD Trading Strategy: Technical and Order Flow Analysis ! Hello Traders, here is the full analysis for this pair, let me know in the comment section below if you have any questions, the entry will be taken only if all rules of the strategies will be satisfied. I suggest you keep this pair on your watchlist and see if the rules of your strategy are satisfied. Please also refer to the Important Risk Notice linked below.

Eli Lilly Challenges Falling TrendlineEli Lilly spent the fourth quarter consolidating gains, and now trend followers may expect further upside.
The first pattern on today’s chart is the falling trendline along the peaks of November and December. Prices tried to fight above that resistance yesterday, creating potential for a breakout.
The pharma giant also pushed above its 50-day simple moving average (SMA). Both of those events may suggest that the intermediate-term trend is getting more bullish.
Next, LLY jumped on November 2 following strong quarterly results and bottomed around $567 the next session. It tested that post-earnings low last month and repeatedly closed above it. Is new support in place?
Finally, MACD just turned positive.
TradeStation has, for decades, advanced the trading industry, providing access to stocks, options, futures and cryptocurrencies. See our Overview for more.
Important Information
Past performance, whether actual or indicated by historical tests of strategies, is no guarantee of future performance or success. There is a possibility that you may sustain a loss equal to or greater than your entire investment regardless of which asset class you trade (equities, options, futures or cryptocurrencies); therefore, you should not invest or risk money that you cannot afford to lose. Online trading is not suitable for all investors. View the document titled Characteristics and Risks of Standardized Options at www.TradeStation.com . Before trading any asset class, customers must read the relevant risk disclosure statements on www.TradeStation.com . System access and trade placement and execution may be delayed or fail due to market volatility and volume, quote delays, system and software errors, Internet traffic, outages and other factors.
Securities and futures trading is offered to self-directed customers by TradeStation Securities, Inc., a broker-dealer registered with the Securities and Exchange Commission (“SEC”) and a futures commission merchant licensed with the Commodity Futures Trading Commission (“CFTC”). TradeStation Securities is a member of the Financial Industry Regulatory Authority, the National Futures Association (“NFA”), and a number of exchanges. TradeStation Crypto, Inc. offers to self-directed investors and traders cryptocurrency brokerage services under federal and state money services business/money-transmitter and similar registrations and licenses.
TradeStation Securities, Inc., TradeStation Crypto, Inc., and TradeStation Technologies, Inc. are each wholly owned subsidiaries of TradeStation Group, Inc., all operating, and providing products and services, under the TradeStation brand and trademark. TradeStation Crypto, Inc. offers to self-directed investors and traders cryptocurrency brokerage services. It is neither licensed with the SEC or the CFTC nor is it a member of NFA. When applying for, or purchasing, accounts, subscriptions, products and services, it is important that you know which company you will be dealing with. Visit www.TradeStation.com for further important information explaining what this means.

Bitcoin kicks off the New Year on a bullish noteAfter a series of bearish breakouts from the pattern resembling a triangle on the hourly chart, Bitcoin kicked off the new year on a bullish note and skyrocketed through its upper bound. By doing so, it established a new high at $45,532. Yet, despite this being a bullish development, a few things continue to ring an alarm bell for us. Last week, we noted that Bitcoin addresses with balances exceeding 100 BTC and 1,000 BTC increased in number following the dip in price. However, we have seen the opposite happening since 29th December 2023, with big players seemingly unloading their holdings into Bitcoin’s strength. While this occurrence does not necessarily warrant Bitcoin’s top, it is something to monitor in the foreseeable future. Another thing to watch out for would be an invalidation of a breakout above $44,729 and technicals on the daily chart. In the past two weeks, we have seen RSI retreat from the overbought territory and MACD reverse to the downside. Then, in the past three trading sessions, we have seen them attempting to reverse to the upside. If MACD follows through and RSI breaks above 70 points, it will bolster a bullish case. In such a scenario, we expect Bitcoin to test an important resistance near $48,000. Contrarily, the failure of the mentioned technicals to continue gaining strength will raise our concerns. All in all, our stance remains unchanged, and we will update our thoughts on the asset with the emergence of new developments.
Illustration 1.01
The picture shows the hourly chart of Bitcoin and the pattern resembling an ascending triangle. Yellow arrows indicate essential developments.
Illustration 1.02
Illustration 1.02 displays the daily graph of Bitcoin and simple support/resistance levels.
Technical analysis gauge
Daily time frame = Neutral (no trend/weak trend)
Weekly time frame = Bullish
*The gauge does not necessarily indicate where the market will head. Instead, it reflects the constellation of RSI, MACD, Stochastic, DM+-, ADX, and moving averages.
Please feel free to express your ideas and thoughts in the comment section.
DISCLAIMER: This analysis is not intended to encourage any buying or selling of any particular securities. Furthermore, it should not serve as a basis for taking any trade action by an individual investor or any other entity. Your own due diligence is highly advised before entering a trade.
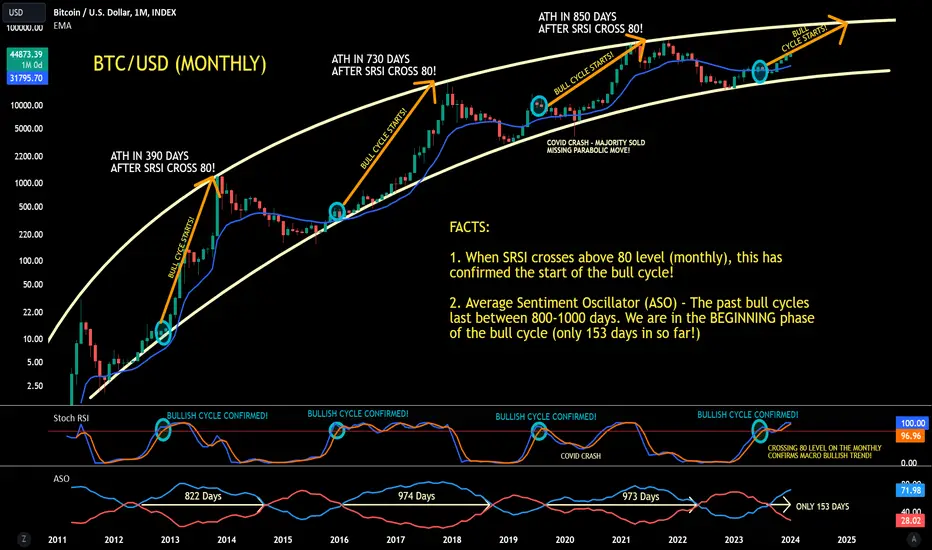
BTC - In the beginning phase of the Bull Cycle?*Important - Once the majority bashes crypto and calls it a scam calling for lower targets (like how many did in 2018 and missed out), that is when I will be all in! (In this post, Dumb Money were bashing on crypto, and they end up missing out on huge opportunity!. Check out the “Capitulation” phase shown on the comments.
Once dumb money becomes bullish, that would be the time to start taking profits regardless of top!
Whales/elites will not miss any opportunities to make money. They simply buy the fear, hype up the market, take profit and crash it again after taking profit. Instead of beating then, lets ride with them! ;)
Majority got Rekt last year due to listening to the "Bullish" Narratives the media and Social Media Influencers were portraying last year! Stop listening to them and start paying attention to the technicals.
Before reading, get rid of your moonboy mentality and no emotions for dips/corrections! Cannot rule bearish scenarios! Dips are for buying!!
People are so focused on the hourly/daily timeframe that they get emotional on every dip! Take a step back to the weekly/monthly timeframe and see why I'm so bullish now. Stop looking at the short-term dips/rise. Short term is irrelevant for the move that is coming!
You can't be emotional in these markets (stocks, forex, crypto, real estate, etc.). You will lose this game following the news and doing what the majority does. News creates emotions. Everything you need to know is on the charts. News is manipulated by the elites, and they take advantage of our emotions. Stop listening to the news and pay more attention to the charts. Don't follow the majority, because the majority will lose in the end! Also, don't buy the hype when everyone is buying... instead buy the fear when everyone else is selling.
Everything is on the chart! Cryptocurrencies are on the verge of exploding higher. Dips/Corrections are normal and needed in a bull market and are buying opportunities! Huge gains opportunity in the coming months! Never trade blindly. Use multiple indicators to make calculated decisions. Trade with no emotions!
"If you can't beat the fear, do it scared!"
"Be fearful when others are greedy, and greedy when others are fearful!" - Warren Buffet.
"Markets are a device for transferring money from the impatient to the patient. - Warren Buffet
"Show me the charts, and I'll tell you the news." - Bernard Baruch
"The secret to investing/trading is figuring out how rich you want to be and how poor you're willing to become."
"If you want to live like the 5% of the population who are hugely successful, then don't act like the 95%!"
Live stream - Bitcoin: This Week's Price Action Scenario.Bitcoin price action analysis, and bot signal review.

Live stream - Welcome To 2024 - Daily Pitch Int. with Darius AnuNikkei225, China50, ASX200, DJIA, S&P500, Nasdaq100, DAX40, FTSE100, DXY, Gold, Silver, WTI Oil, NatGas, Sugar, Bitcoin, Ethereum, BitcoinCash, Litecoin, AUDUSD, AUDNZD, USDJPY, USDCAD, USDCHF, GBPUSD,GBPCHF,EURCAD, EURUSD.

Bitcoin: Wave 4 New Buy Signal.Bitcoin continues to gyrate within the Wave 4 price structure, which implies there is one more leg higher before probability favors a broader correction. Along with that, there is a buy signal in effect now (the break of the 42,600 inside bar high). This signal appears at a relevant level (off 40K support) and IF momentum follows through, has potential to test the 45 to 46K resistance in the coming week.
Now keep in mind, while this appears to be a higher quality setup, it appears in the middle of a holiday week. This fact can reduce the chances of follow through since volume is generally lower. I have been warning about the lower volume holiday environment to help shape expectations effectively (especially for those who receive my Trade Scanner signals).
Volume is more likely to get back to normal levels mid week or into early next week. Does this mean you should avoid signals? That would be the conservative choice. In my opinion if you want to take a signal, just trade smaller than usual size. If the momentum fails to follow through you lose less.
The key thing to consider is this: as long as Wave 4 does NOT overlap Wave 1, the bullish impulse still stands. This serves as a guide for objective and reasonable expectations. For example, momentum may fail and price may test 40K for a third time. If a new setup appears in such a scenario, I would consider this an even higher probability, especially if we are outside of the holiday volume.
The line illustration on my chart (Wave 5?) is what I consider the ideal scenario. This is NOT to be confused with a forecast because there is NO way to know if price will play out this way. These illustrations have not played out numerous times which is the nature of a market that is MOSTLY RANDOM (not always random). The idea behind this is to be prepared IF price confirms, and use this to gauge reward/risk.
If you intend to trade/invest for capital appreciation, your goal for the new year should be to focus your attention on the professional side of this business. This type of information exists in the form of academic papers, legal complaints, and professional associations, NOT Youtube. More time in front of charts WILL NOT matter if you do not understand what is going on behind the charts.
A big thank you again to the community for your encouragement and support over the year. Have a HAPPY, HEALTHY and PROSPEROUS NEW YEAR!

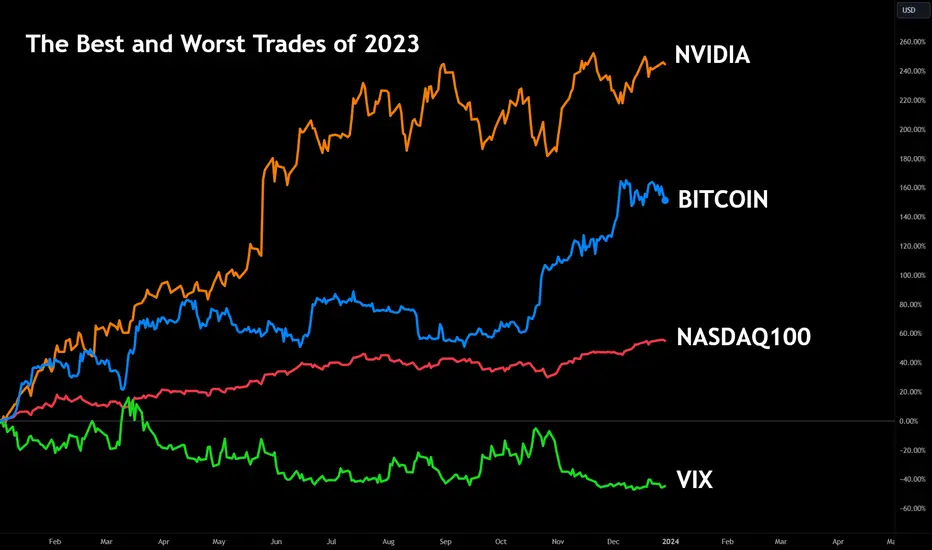
The Best and Worst Trades of 2023 💪First of all… happy new year to all traders, globally!
As the year comes to an end, and the new year begins, it’s time to join us in reviewing the top trades that defined our unforgettable year together. Marked by a historic market recovery across various global asset classes, including stocks, cryptocurrencies, and bonds, 2023 has been a memorable year for all of us.
Among the best performers, the Nasdaq-100 showed an incredible run, climbing more than 50% over the course of the year, while Bitcoin emerged as another noteworthy recovery adding more than $500 billion back to its market cap. While these two stories make many headlines, there’s much more to discuss and look into. After all, that’s what markets are about - research, planning, and data to find the next great trade.
Below, we'll recap these highlights, featuring charts and statistics that explain what happened in 2023 and some emerging trends to watch in 2024.
The best trades of 2023
Long Carvana +1063%
Long Solana +994%
Long Coinbase +448%
Long Avalanche +296%
Long Nvidia +245%
Long Bitcoin +161%
Long US dollars versus Turkish Lira +57%
Long Nasdaq-100 +55%
Short Natural Gas -38%
Short VIX -45%
For those who want to see more data, we’ve created handy lists for you below. Here are the best and worst for some of the most important asset classes:
The best stocks by market cap over $5 billion:
1. Carvana +1063%
2. Bridgegbio +502%
3. Coinbase +448%
4. Affirm +464%
5. Microstrategy +360%
6. Symbotic +346%
7. Applovin +275%
8. Super Micro Computer +253%
9. NVIDIA +245%
10. DraftKings +222%
Notable: Duolingo +232%
The worst stocks by market cap over $5 billion:
1. JD -53%
2. Moderna -45%
3. Pfizer -45%
4. Dollar general -45%
5. Estee Lauder -43%
6. Bayer -35%
7. Hertz -30%
8. Nokia -30%
9. Etsy -28%
10. Alibaba -19%
Notable: NIO -18%
The best performers in crypto by market cap over $3 billion:
1. Solana +994%
2. Chainlink +191%
3. Avalanche +296%
4. Bitcoin +161%
5. Cardano +155%
6. Polkadot +103%
7. Ethereum +97%
8. Tron +92%
9. XRP +88%
10. Dogecoin +33%
The biggest changes in forex - all pairs:
1. Swiss Franc / Turkish Lira +72%
2. British Pound / Turkish Lira +67%
3. Euro / Turkish Lira +63%
4. US Dollar / Turkish Lira +57%
5. Euro / Russian Ruble +33%
6. US Dollar / Russian Ruble +29%
7. Mexican Peso / Japanese Yen +25%
8. Swiss Franc / Japanese Yen +19%
9. British Pound / Japanese Yen +15%
10. Euro / Japanese Yen +13%
The best performers in commodities:
1. Cocoa +66%
2. Cattle +23%
3. Gold +13%
4. Sugar +4%
The worst performers in commodities:
1. Natgas -38%
2. Corn -29%
3. Wheat -20%
4. Soybean -11%
Indices:
1. Merval +321%
2. Nasdaq +55%
3. NIKKEI +31%
4. S&P 500 +25%
5. IBEX 35 +21%
6. DAX40 +19%
7. Russell 2000 +18%
8. Eurostoxx 50 +17%
9. CAC40 +15%
10. Eurostoxx 600 +11%
Notables:
Hang Seng -17%
VIX -45%
Thanks for being a part of our community and we look forward to celebrating the end of 2023 and the start of 2024. For those of you who read this far down, we have a game for you – can you spot the new tool we’ve added for 2024?
Happy new year, traders! Stay tuned for more great announcements.
TradingView
S&P starting to reprice it self as a comparison to the Russel Russel 2000 has currently reached is standard 2 deviation as a comparison to the pricing of s&p.
What this means is that currently the S&P price has increased so much over the Russel that recently it has deviated from it average +2 standard deviations.
At some point in time price will inevitably return to its average.
This could mean one of two things.
The s&p price declines more rapidly then Russel.
S&P does not increase in price as much as the Russel therefore underperforming the Russel causing the comparison to revert back to its average.
Last time such a miss price allocation happened lead to one of the biggest bear markets in recent history.
In 2000 the slow climb up with the SPX slowly rolling over and a big spike in Small cap quickly sent the SPX/RUT comparison plumet back down from its +2 to its +1 standard deviation within a short time period only to spike back up. (White arrows on the chart)
Something of the sort has happened recently.

Long Coinbase, Short BTC On Sell-The-News TriggerWhen traditional markets sense optimism, crypto markets go straight to the moon. Bitcoin (“BTC”) has been on a tear this year supported by hopes of spot BTC ETF launch, rising regulatory clarity, and monetary policy easing. When BTC sentiment turns bullish, it leads to sharp outperformance in digital asset-linked stocks as noted previously.
Coinbase is a top ranking performer. The crypto exchange stock is up a whopping 387% YTD outperforming BTC by almost 2.5x.
Outperformance during rallies is usually followed by sharper corrections during downturns. Buy the rumour and sell the news is common. In fact, it is more pronounced in crypto markets.
BTC trading at record prices for the year combined with bullish catalysts materializing soon, the risk of drawdown in prices remains high.
Digital asset linked stocks are likely to correct alongside BTC. But Coinbase is uniquely positioned to remain resilient. This paper posits a hypothetical trade set up with a long position in Coinbase and short position in BTC to position well into potential pull back in prices in the new year.
COINBASE’S “REGULATIONS FIRST” APPROACH HELPS BUT RISKS REMAIN
Coinbase adopts the strategy of regulation-focused expansion, giving it an upper hand in the otherwise largely unregulated digital asset industry.
That said, Coinbase faces its own raft of regulatory headwinds. In June 2023, the SEC sued Coinbase for operating as an Unregistered Securities Exchange, Broker, and Clearing Agency. Later in August, Coinbase filed a motion to dismiss the case on the basis that the cryptocurrencies listed on Coinbase do not qualify as securities.
Coinbase’s staking platform is another concern. Legal outcome remains uncertain. Regulatory overhang persists over Coinbase.
COINBASE HAS GAINED MARKET SHARE FROM CRISIS AT OTHER EXCHANGES
Coinbase has been holding up well when competing crypto exchanges have suffered collapse or punitive record regulatory fines. Consequently, it has been successful in swaying traders to its platform. News of Coinbase’s approval as a Virtual Asset Services Provider is just one of many global regulatory licenses the company has sought.
FTX collapse, regulatory action against Binance, and the shuttering of smaller exchanges like Bittrex has benefited Coinbase. It has gained BTC trading volume market share compared to last year (13.7% in 2023 v/s 5.7% in 2022), although it remains lower than its market share (18.1%) during the 2021 rally.
While Coinbase has taken volume share from Binance, both these crypto exchanges have lost share on BTC derivatives trading to CME Group. It is likely that Coinbase would lose out on some of the BTC trading volume to spot ETFs.
COINBASE IS THE CUSTODIAN FOR MOST OF THE PROPOSED SPOT BTC ETFs
While Coinbase may lose out on some of the trading volumes, it stands to benefit from the increased institutionalization of BTC.
The company has positioned itself to benefit from the institutional market as well. Coinbase Custody and Coinbase Prime are two of its offerings that stand to gain from spot ETF approval.
In Q3 2023, Coinbase derived 46% of its net revenue from transaction commissions (comprising of 95% from retail and 5% from institutions) and 54% from subscription and services revenue. This is a stark shift from Q3 2022 when 63% of its revenues came from transaction commissions. The shift towards services enables resilient growth from sustainable institutional sources.
Stablecoin revenue is the primary driver of services revenue for Coinbase. It has increased by 125% YoY. Stablecoin revenues represents earnings from stablecoin reserves linked to its partnership with Circle (USDC issuer).
While stablecoin revenues have driven growth in a high interest rate environment, Coinbase’s custodial revenue has lagged. Custodial income is up 9% YoY but 7% lower QoQ. Spot BTC approval with Coinbase as the custodian will help drive greater revenue resilience.
The following ETF’s which are up for approval imminently use Coinbase as their custody provider:
Source: Coindesk
Important to note that these agreements are not yet finalized and are subject to change. In fact, one of the SEC’s key concerns over approval has been the centralization of custody services with Coinbase. This recently caused Blackrock to amend the role of Coinbase in the proposed iShares Bitcoin Trust ETF. The goal of the amendments is to integrate refinements and improve the likelihood that the application is accepted by the SEC.
BITCOIN RALLY HAS OVERREACHED
A long position in BTC may be hard to justify given the massive price appreciation through 2023. BTC is up a mammoth 154%. Prices face risk of a sharp drawdown from profit taking.
Long-Term BTC holders have been accumulating their holdings all year. Many of these holders are now in profit. Nearly 90% of the total supply of BTC is in profit as per Glassnode.
While long-term holders have remained committed all year, realising these gains before a sell-the-news trigger will eventually lead to price pullback.
Source: Glassnode
THIS TIME, IT IS DIFFERENT FOR COINBASE
Coinbase performed poorly during the last Crypto drawdown. Back then, Coinbase was in dire straits. Losses looked precarious. Valuations were still roaring from its heady IPO levels. Now, both these metrics provide a reasonable entry.
Coinbase stock is still 50% lower compared to its level in Nov 2021 when BTC prices started collapsing.
HYPOTHETICAL TRADE SETUP
The hype in the run up to the approval of Spot BTC ETF is palpable. Downside risk prevails across BTC and Coinbase.
If buy-the-rumour & sell-the-news plays out, Coinbase is expected to remain resilient (relative to BTC) given larger market share and revenue diversification. Higher institutional income will also help bolster revenues along with increased trading volumes typically experienced during market shocks.
Investors can position to benefit from Coinbase’s relative resilience by opting for a long position in its shares hedged by a short position in CME Micro Bitcoin Futures expiring in January (MBTF2024). Each MBT contract provides exposure to 0.1 BTC (~USD 4,278). This requires 25 shares of Coinbase to balance the notional values on both legs.
The hypothetical trade set up would involve:
• Entry: 0.404% (USD 173.2 divided by USD 42,780)
• Target: 0.480%
• Stop Loss: 0.365%
• Profit at Target: USD 670
• Loss at Stop: USD 467
• Reward/Risk: 1.43x
Note: As of close of markets on 26th December 2023; Coinbase shares: USD 173.2 and MBTF2024: USD 42,780
MARKET DATA
CME Real-time Market Data helps identify trading set-ups and express market views better. If you have futures in your trading portfolio, you can check out on CME Group data plans available that suit your trading needs tradingview.sweetlogin.com
DISCLAIMER
This case study is for educational purposes only and does not constitute investment recommendations or advice. Nor are they used to promote any specific products, or services.
Trading or investment ideas cited here are for illustration only, as an integral part of a case study to demonstrate the fundamental concepts in risk management or trading under the market scenarios being discussed. Please read the FULL DISCLAIMER the link to which is provided in our profile description.

Bitcoin Consolidating In A Bull Pennant?Bitcoin appears to be consolidating in a bull pennant. I have not checked the chart in over a week as I have been on vacation, and little has changed - including the price.
A pennant has a descending resistance and ascending support. Remember, this can easily turn into a flag, a descending parallel channel. For that to happens, support breaks... people get bearish, only to see another form of bullish consolidation. So be careful.
Price is clearly interested in the $42,000 key area here, no surprises.

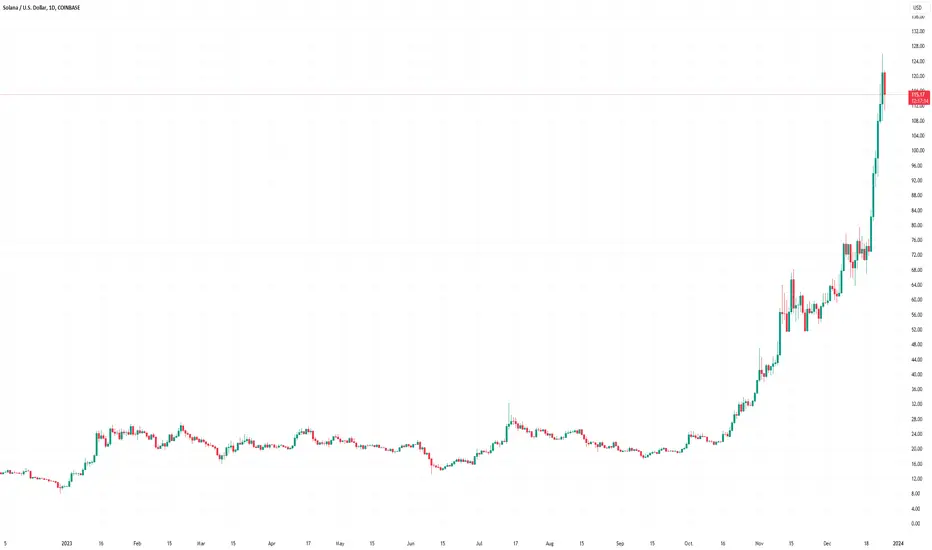
Solana Is the Fourth Largest Cryptocurrency by Capitalisation.Solana Is the Fourth Largest Cryptocurrency by Capitalisation. But for How Long?
2023 turned out to be a good year for cryptocurrencies, especially given the depressing mood that reigned at the end of 2022.
From the beginning of 2023:
→ Bitcoin increased in price by more than 150% – including due to rumours related to the approval of applications for a Bitcoin ETF;
→ Ethereum rose by approximately 85%.
But what has been particularly impressive is the progress made by the Solana project. This is a decentralised blockchain platform, which is characterised by high speed and scalability — they are achieved through the use of a unique architecture based on the Proof-of-History (PoH) protocol. In 2023, Solana became the first blockchain platform to reach 50,000 transactions per second. And a number of large investment funds, such as Grayscale and CoinShares, have added SOL to their portfolios.
SOL is a token that is used to pay for transactions and services on the Solana platform. It can also be used for staking to help support the network. The SOL/USD rate in 2023 has increased by more than 1000%!
At the same time, SOL now ranks 4th in terms of capitalisation of cryptocurrencies — after BTC, ETH, and the USDT stablecoin. December was the month when the price of the SOL token exceeded the psychological level of USD 100 for the first time since April 2022 (the historical high reached in the fall of 2021 exceeds the USD 250 level for SOL).
But will the price be able to stay above USD 100?
The 4-hour chart on the FXOpen TickTrader platform shows that:
→ the price broke through the USD 100 level, but did not test it;
→ the price broke through the level of USD 110, which confirmed its role as support;
→ the price reached the upper limit of the ascending channel, which began in early November.
At the same time, the chart shows bearish signs:
→ the price sharply reversed from the upper border of the channel on the last closed candle;
→ divergences formed on the RSI indicator.
In such a situation, you should be prepared for a scenario in which the SOL/USD price may fall — for example, to test the USD 100 level. In this case, the market can be supported by the median line of the channel.
At FXOpen UK and FXOpen AU, Cryptocurrency CFDs are only available for trading by those clients categorised as Professional clients under FCA Rules and Professional clients under ASIC Rules, respectively. They are not available for trading by Retail clients.
This article represents the opinion of the Companies operating under the FXOpen brand only. It is not to be construed as an offer, solicitation, or recommendation with respect to products and services provided by the Companies operating under the FXOpen brand, nor is it to be considered financial advice.
déjà vuCircle is the most perfect of shapes. It optimizes its area perfectly. An architectural marvel with no point of failure. And it is unique. All circles are similar to each other. Some small, other large. In the end identical.
Cycle is the Hellenic word of Circle.
I purposefully call it "Hellenic" instead of "Greek"
Market cycles are just that, cycles/circles. All of them are identical clones of the original.
Price is after all, nothing more than perfect fractals, the equation of which is, and will forever be, unknown to us.
FED is the all-powerful entity that gives birth and death to bull markets. Its only weapon is yield rates. Don't go against the FED.
Yield rates up = Bull Equity Market
Yield rates down = Bear Equity Market
Many think this is the other way around, that yield rates kill equity markets.
Why do rate hikes help equities though? Because Bonds. Bonds suffer during periods of rate hikes. And they soar when yield rates remain constant or fall.
The usual investment strategy of equities+bonds is creating a rapid shift in flow as we speak.
For a year, massive amounts of wealth was withdrawn from bonds, and invested into equities.
This trend is about to shift rapidly.
And the speed of such a shift is extreme.
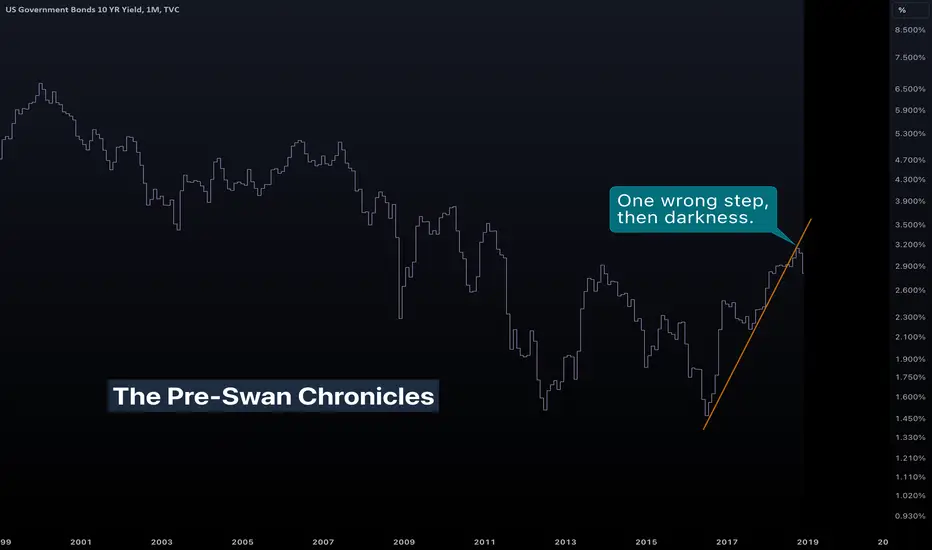
While short-term rates are very fast moving, long-term yields represent a heavy market, and thus are more important in our analysis. I will ignore the FEDFUNDS rate because it represents a fraction of the weight of US10Y.
Long-term yields didn't change much in 2007, but the crash was devastating.
In 2018 the same happened, but faster in US10Y. The slope was much higher than in 2007. This resulted in a literal black swan event. The consequences of the 2020 crash are still unknown.
Moving to today, we witness an unparalleled change in yield rates. This has resulted in massive bond crashes as we have shown before, and will most certainly lead to incalculable effects in the equity market.
History has shown that the stronger the rate change, the harder the crash. This makes sense. The higher yield rates go, the greater the incentive to invest in bonds.
Be aware, the market is waiting for the FED to trigger the crash.
Make sure to pick the correct side when the cycle ends again.
Tread lightly, for this is hallowed ground.
-Father Grigori
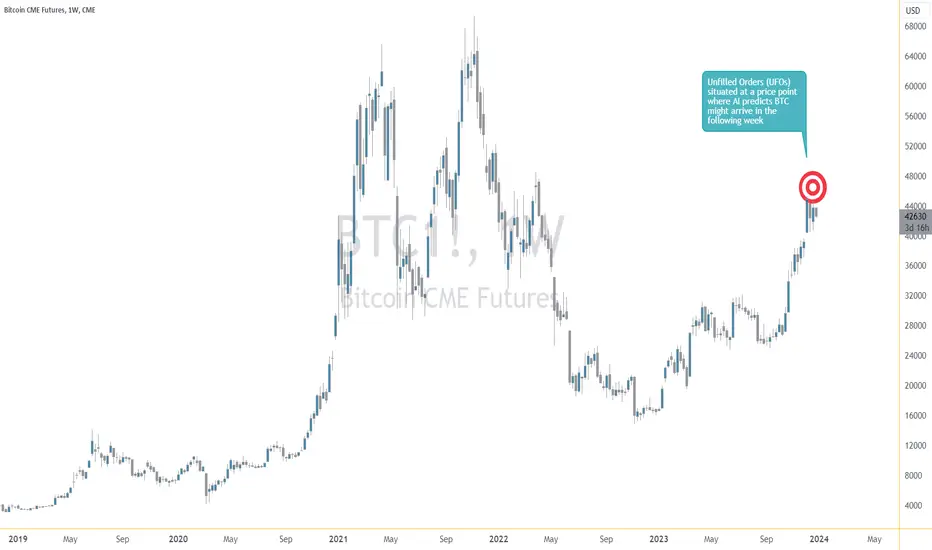
Bitcoin Futures: A Quantitative Approach to Analyzing BTCIntroduction to Bitcoin Futures
Bitcoin, the pioneering digital asset, has carved a niche in the financial markets with its futures contracts. Bitcoin Futures provide traders and investors a regulated avenue to speculate on the price of Bitcoin without holding the actual cryptocurrency. This article delves into a quantitative analysis to analyze the next week's potential value of Bitcoin Futures, employing a sophisticated Neural Network model.
Current Market Landscape
The Bitcoin market is known for its rapid price movements. Recently, regulatory news, technological advancements, and shifts in investor sentiment have contributed to market fluctuations. Understanding these trends is crucial for traders looking to navigate this dynamic landscape.
Quantitative Analysis of BTC Futures' Potential Price Movements
Neural Networks & Machine Learning: At the heart of our quantitative approach is a Neural Network model. This model has been trained on historical weekly data of Bitcoin Futures, including key price points and other relevant market indicators.
Data Preprocessing: To ensure accuracy, the data underwent rigorous preprocessing, including normalization to make it suitable for the Neural Network. This step is essential in highlighting the true patterns and trends in the data without noise or scale issues distorting the model's view.
Model Training: Our model was trained over 500 iterations, adjusting its internal parameters to minimize prediction error. This training process involved feeding the model historical data and letting it learn from the actual price movements.
Evaluation and Prediction: After training, the model's performance was evaluated. The actual prices were compared against the model's predictions to assess robustness. This evaluation is crucial in understanding the model's reliability.
Impact of External Factors
Bitcoin Futures are affected by a range of external factors, including regulatory changes, market sentiment, and technological developments. These factors can cause sudden and unpredictable market movements, making the analysis of future potential prices challenging. Our model takes into account the historical impact of these factors, but it's important to remember that unforeseen future events can lead to deviations from predicted values.
Forward-Looking Market Views
Based on our Neural Network's learning and the recent market data, the model predicts that the value of Bitcoin Futures for the next week will be around "$44,026.60". This prediction is visualized in our graph comparing actual prices against predicted values over time, providing a clear view of the model's accuracy.
Given the fact that the current value of BTC is slightly under 43,000, a trader could plan a long trade targeting 44,026.60 as their exit price. Entries could be taken in many ways such as utilizing key technical supports or waiting for breakouts above key resistance price levels. In all cases, a professional approach to taking risk in the marketplace always require managing such risk using stop-loss orders and making sure the trade size has been pre-calculated. There are many more options on how to have a contingency plan in place in case BTC moved in the opposite direction our AI expected it to. More on this in future articles.
The model's learning curve, depicted in the accuracy graph, shows how the prediction accuracy improved over training iterations, reflecting the model's increasing proficiency at understanding the market.
Conclusion
Our quantitative analysis, utilizing a sophisticated Neural Network model, provides a prediction for the next week's value of Bitcoin Futures. While this prediction is grounded in historical data and advanced algorithms, it's important for traders to consider the inherent volatility and unpredictability of the Bitcoin market. The predictive model is a powerful tool, but it should be used as part of a broader strategy that considers market news, economic reports, and other indicators.
When charting futures, the data provided could be delayed. Traders working with the ticker symbols discussed in this idea may prefer to use CME Group real-time data plan on TradingView: tradingview.sweetlogin.com This consideration is particularly important for shorter-term traders, whereas it may be less critical for those focused on longer-term trading strategies.
General Disclaimer:
The trade ideas presented herein are solely for illustrative purposes, forming a part of a case study intended to demonstrate key principles in risk management within the context of the specific market scenarios discussed. These ideas are not to be interpreted as investment recommendations or financial advice. They do not endorse or promote any specific trading strategies, financial products, or services. The information provided is based on data believed to be reliable; however, its accuracy or completeness cannot be guaranteed. Trading in financial markets involves risks, including the potential loss of principal. Each individual should conduct their own research and consult with professional financial advisors before making any investment decisions. The author or publisher of this content bears no responsibility for any actions taken based on the information provided or for any resultant financial or other losses.