Understanding Dark Pools█ Diving Into Dark Pools
In recent years, dark pools have become a significant part of the financial markets, offering an alternative trading venue for institutional traders. But what exactly are dark pools, and how do they impact market quality and price efficiency? This article delves into the comprehensive study titled "Diving Into Dark Pools" by Sabrina Buti, Barbara Rindi, and Ingrid Werner, which sheds light on the complexities of dark pool trading in the US stock market.
█ What Are Dark Pools?
Dark pools are private financial forums or exchanges for trading securities. Unlike public stock exchanges, dark pools do not display the order book to the public until after the trade is executed, providing anonymity to those placing trades. This lack of pre-trade transparency can help prevent large orders from impacting the market price, which is particularly beneficial for institutional investors looking to trade large volumes without revealing their intentions.
█ How Do Dark Pools Work?
In dark pools, the details of trades are not revealed to other market participants until the trade is completed. This lack of transparency helps prevent significant price movements that could occur if the order were known beforehand. Dark pools typically execute trades at the midpoint of the best bid and ask price in the public markets, ensuring fair pricing for both parties involved.
█ Why Are Dark Pools Used?
Dark pools are primarily used by institutional investors who need to execute large trades without revealing their trading intentions. Displaying such large orders on public exchanges could lead to unfavorable price movements due to market speculation and front-running by other traders.
█ Benefits of Dark Pools
Reduced Market Impact: Large orders can be executed without affecting the stock's market price.
Anonymity: Traders can buy or sell significant amounts without revealing their identity or strategy.
Lower Transaction Costs: By avoiding the public markets, traders can often reduce the costs associated with large trades.
Improved Execution: Dark pools can offer better execution prices due to the lack of market impact and reduced volatility.
█ Why Do Large Actors Hide Their Orders Using Dark Pools?
Large institutional investors use dark pools to hide their orders to:
Avoid Market Manipulation: Prevent others from driving the price up or down based on the knowledge of a large pending trade.
Maintain Strategic Advantage: Keep trading strategies and intentions confidential to avoid imitation or counter-strategies by competitors.
Achieve Better Prices: Execute trades at more favorable prices by not alerting the market to their actions.
█ Actionable Insights for Traders
Understand Market Dynamics: Knowing how and why dark pools are used can provide insights into market liquidity and price movements.
Monitor Market Quality: Be aware that increased dark pool activity can improve overall market quality by reducing volatility and spreads.
Assess Price Efficiency: Recognize that while dark pools can enhance market quality, they might also lead to short-term inefficiencies like price overreaction.
█ Key Findings from the Study
The study analyzed unique data on dark pool activity across a large cross-section of US stocks in 2009. Here are some of the critical insights:
Concentration in Liquid Stocks: Dark pool activity is predominantly concentrated in liquid stocks. Specifically, Nasdaq stocks show higher dark pool activity compared to NYSE stocks when controlling for liquidity factors.
Market Quality Improvement: Increased dark pool activity correlates with improvements in various market quality measures, including narrower spreads, greater depth, and reduced short-term volatility. This suggests that dark pools can enhance market stability and efficiency for certain stocks.
Complex Relationship with Price Efficiency: The relationship between dark pool activity and price efficiency is multifaceted. While increased activity generally leads to lower short-term volatility, it can also be associated with more short-term overreactions in price for specific stock groups, particularly small and medium-cap stocks.
Impact on Market Dynamics: On days with high share volume, high depth, low intraday volatility, and low order imbalances, dark pool activity tends to be higher. This indicates that traders are more likely to use dark pools when market conditions are favorable for large trades.
█ Conclusion
Dark pools play a crucial role in modern financial markets by allowing large trades to be executed without revealing the trader’s intentions, thus minimizing market impact and reducing costs. For retail traders, understanding the mechanics and implications of dark pools can lead to better-informed trading decisions and a deeper comprehension of market behavior. The study concludes that while dark pools generally contribute to improved market quality by reducing volatility and enhancing liquidity, their effect on price efficiency is nuanced. For small and medium stocks, dark pools can lead to short-term price overreactions, while large stocks remain largely unaffected. The findings underscore the importance of understanding the different impacts on various stock categories to make informed trading decisions.
For institutional traders and market participants, understanding the role and impact of dark pools is crucial for navigating the modern financial landscape. By offering an alternative venue for executing large trades discreetly, dark pools play a pivotal role in today's trading ecosystem.
█ Reference
Buti, S., Rindi, B., & Werner, I. (2011). Diving into Dark Pools. Charles A. Dice Center for Research in Financial Economics, Fisher College of Business Working Paper Series, 2010-10.
-----------------
Disclaimer
This is an educational study for entertainment purposes only.
The information in my Scripts/Indicators/Ideas/Algos/Systems does not constitute financial advice or a solicitation to buy or sell securities. I will not accept liability for any loss or damage, including without limitation any loss of profit, which may arise directly or indirectly from the use of or reliance on such information.
All investments involve risk, and the past performance of a security, industry, sector, market, financial product, trading strategy, backtest, or individual's trading does not guarantee future results or returns. Investors are fully responsible for any investment decisions they make. Such decisions should be based solely on evaluating their financial circumstances, investment objectives, risk tolerance, and liquidity needs.
My Scripts/Indicators/Ideas/Algos/Systems are only for educational purposes!
Community ideas
Think in Probabilities Embracing Uncertainty Your Key To SuccessPicture this: You’re at your trading desk, eyes on the charts, heart pounding as the market swings unpredictably. Do you feel that fear creeping in?
Now, imagine knowing that this unpredictability doesn’t have to scare you. Instead, it can be the key to your success. Let's dive into why thinking in probabilities and staying calm in the face of uncertainty can turn trading from a gamble into a calculated path to consistent success.
Many traders struggle with uncertainty because they lack a solid, tested system. Trading randomly or without a proven strategy leads to anxiety and inconsistency. But once you have a reliable system that suits your lifestyle and mindset, and you fully understand your edge, you realize that while the outcome of each trade is random, the probabilities of your trading system will work out for you over time.
The Role of Probabilities in Trading
Trading isn’t about predicting the next big market move; it’s about understanding the odds and working them to your advantage. Each trade is a small part of a larger statistical framework, where the focus shifts from individual outcomes to the bigger picture.
Why Is Learning To Think In Probabilities So Important For Trading Success?
Reduces Emotional Bias : By thinking in probabilities, you understand that each trade is just one in a series of many. This helps reduce emotional reactions to individual losses or gains, such as revenge trading, doubling up on position sizing, or even smashing your new iPhone against the wall (been there, LOL).
For example, if you know that your strategy wins 60% of the time, you won't be devastated by a single loss. You'll see it as part of the statistical outcome.
Encourages Rational Decision-Making: Knowing your strategy has an actual edge helps you stick to your plan, even during losing streaks, and avoid impulsive decisions. To know your edge, you need to do plenty of backtesting and forward testing so you can gain confidence in the system.
For instance, if you experience a string of losses, understanding that this is normal and statistically probable helps you remain disciplined and not deviate from your strategy.
Builds Confidence in Your System : Confidence comes from knowing your strategy is backtested and has a proven edge over a large number of trades.
This knowledge helps you stay disciplined and focused on executing your plan. For example, if your backtesting shows a positive expectancy over 1,000 trades, you can trust your system even when short-term results are unfavorable.
Things That Have Helped Me Over the Years to Deal With the Uncertainty of Trading
Finding or Developing a System/Strategy That Suits You : As humans, we are all different, and this is especially true in trading. Some people are happy to be in and out of the market fast (scalpers) and have the ability to make big decisions quickly under pressure.
Others are slower thinkers and like to make decisions carefully, staying in the market for a longer period of time (swing traders).
You need to find what you're best at and stick to it. If you have a busy life with work and family, maybe swing trading suits you. If you’re younger and not as busy, then perhaps scalping is your style.
Playing Strategy Games and Games of Chance : This may not be something you've heard before, but I've met many traders, including myself, who have found that games like poker can really help your trading by teaching you to think in probabilities.
Another game I love to play is chess, as it encourages you to think ahead, and I’ve found it has helped me in my trading over the years.
Practicing Visualization : If you've ever read anything on the subconscious mind, you know it’s responsible for 95% of all your automatic behaviors, especially in trading. The subconscious doesn’t distinguish between what is real and what is imagined.
This is why visualization is such a powerful tool to help you embrace market uncertainty. By visualizing yourself placing trades confidently, managing risks well, and handling outcomes calmly, you prepare your mind for real trading scenarios.
This mental practice reinforces your belief in your system and prepares you for the market's ups and downs.
Books That Helped Me Think in Probabilities
Reading has been an invaluable part of my journey to understanding probabilities. Here are some books that have profoundly impacted my trading mindset:
"Thinking, Fast and Slow" by Daniel Kahneman
This book helped me understand how cognitive biases affect decision-making and how to overcome them by thinking more strategically.
"Fooled by Randomness" by Nassim Nicholas Taleb
Taleb's insights into the role of chance and randomness in our lives and the markets were eye-opening and changed how I view risk and probability.
"Beat the Dealer" by Edward O. Thorp
Although this book is about blackjack, Thorp’s exploration of probability and statistics offers valuable lessons for trading.
"The Theory of Poker" by David Sklansky
Sklansky breaks down the mathematics of poker, showing how to make decisions based on probability, a skill directly applicable to trading.
"The Intelligent Investor" by Benjamin Graham
This classic on value investing emphasizes the importance of long-term thinking and understanding market probabilities.
"A Man for All Markets" by Edward O. Thorp
This autobiography offers a fascinating look at how Thorp applied probability theory to beat the casino and the stock market.
"Sapiens: A Brief History of Humankind" by Yuval Noah Harari
Harari’s book provides context on human behavior and decision-making, offering insights into the psychological elements of trading.
"The Signal and the Noise" by Nate Silver
Silver’s exploration of how we can better understand predictions and probabilities is highly relevant to making informed trading decisions.
"Superforecasting: The Art and Science of Prediction" by Philip E. Tetlock and Dan M. Gardner
This book teaches how to improve forecasting skills through careful analysis and thinking in probabilities.
Thinking in probabilities was a game-changer for me. It shifted my focus from trying to predict every market move to playing the long game. By embracing this mindset, I turned fear into confidence and uncertainty into strategy.
Remember, trading isn’t about guessing the market. It’s about responding with a clear, composed mind. Trust your strategy, know your edge, and let the probabilities work in your favor. This approach transformed my trading journey, and it can do the same for you. Happy trading!

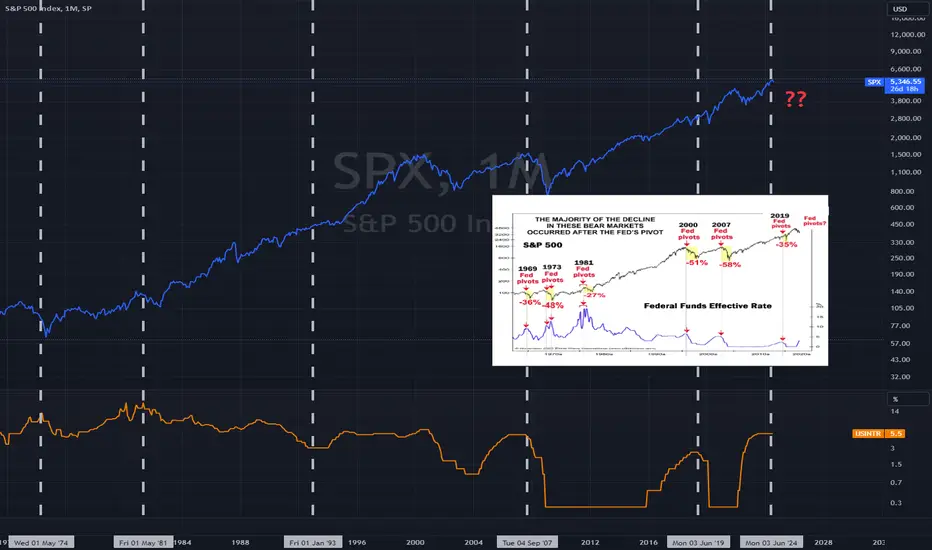
Does the Market Rally When the Fed Begins to Cut Rates?The relationship between rate cuts and the stock market, as illustrated in the provided graph, shows that major market declines often occur after the Federal Reserve pivots to lower interest rates. This pattern is evident in historical instances where the Fed's rate cuts were followed by significant drops in the S&P 500. Several factors contribute to this phenomenon, which are crucial for investors to understand.
Economic Weakness:
Rate cuts typically respond to economic slowdown or anticipated recession.
Each instance of the Fed pivoting to lower rates (1969, 1973, 1981, 2000, 2007, 2019) corresponds to significant market declines soon after.
Rate cuts signal concerns about economic health, causing investors to lose confidence, as reflected in the graph.
Delayed Impact:
Rate cuts do not immediately stimulate the economy; it takes time for their effects to propagate.
The graph shows that the majority of the market decline occurs after the Fed's pivot, indicating that initial rate cuts were insufficient to halt the downturn.
During this lag period, the market may continue to decline as economic data reflects ongoing weakness.
Investor Sentiment:
Rate cuts can trigger fear among investors, who interpret the move as an indication of severe economic issues.
The graph shows substantial percentage drops in the S&P 500 following each pivot, demonstrating how negative sentiment can exacerbate declines.
The fear of a worsening economy leads to a sell-off in stocks, contributing to further market drops.
Credit Conditions:
During economic stress, banks may tighten lending standards, reducing the effectiveness of rate cuts.
Post-rate cut periods in the graph align with times of economic stress, where credit conditions likely tightened.
Businesses and consumers may not be able to take advantage of lower borrowing costs, limiting economic recovery and impacting the market negatively.
Historical examples such as the crises in 2000 and 2007 highlight substantial market drops after rate cuts, as seen in the graph. In both cases, the rate cuts responded to bursting bubbles (tech bubble in 2000, housing bubble in 2007), and the economic fallout was too severe for rate cuts to provide immediate relief. The graph underscores that while rate cuts aim to stimulate the economy, they often follow significant economic downturns. Investors should be cautious, recognizing that initial market reactions to rate cuts can be negative due to perceived economic weakness, delayed policy impact, and deteriorating sentiment.
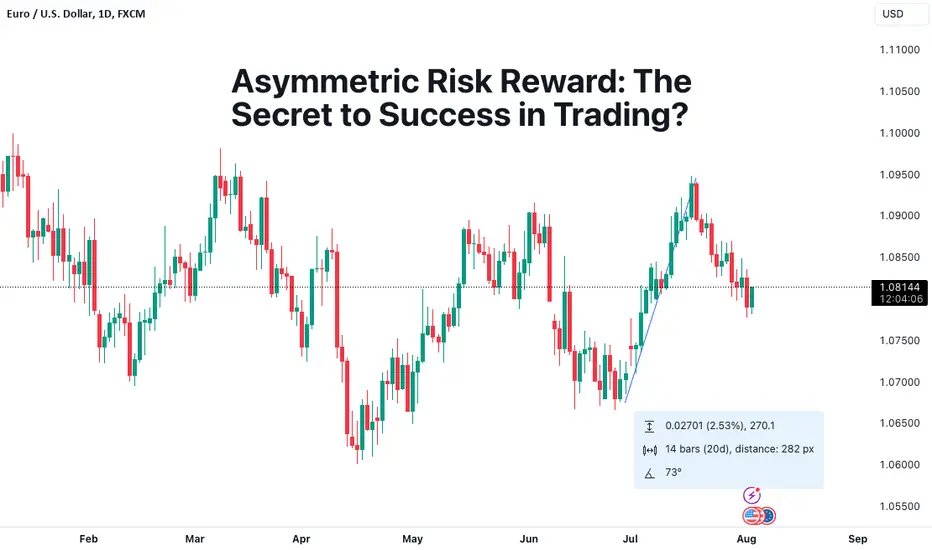
Asymmetric Risk Reward: The Secret to Success in Trading?Be as bold as you want yet protect your capital with the asymmetric risk reward strategy — an approach adopted by some of the greatest market wizards out there. In this Idea, we distill the concept of asymmetric bets and teach you how to risk little and earn big. Spoiler: legendary traders George Soros, Ray Dalio and Paul Tudor Jones love this trick.
Every trade you open has only two possible outcomes: you either turn a profit or make a loss. Perhaps the greatest thing you can learn about these two outcomes is the balance between them. The fundamental difference between making money and losing money — the mighty risk-reward ratio .
The risk-reward ratio is your trade’s upside relative to the downside you baked in (or realized).
Let’s Break It Down 🤸♂️
Most traders believe that you have to take huge risks to be successful. But that’s not what the big guys in the industry do with the piles of cash they’ve got. Instead, they try to take the least amount of risk possible with the most upside. That’s what asymmetric risk-reward ratio means.
Think of it this way: you invest $1 only if you believe you can ultimately make $5. Now your risk-reward ratio is set at 1:5, or a hit ratio of 20%. Safe to say that you’ll likely be wrong lots of times. But step by step, you can risk another dollar for that $5 reward and build up a good track record or more wins than losses. That way you can be wrong four times out of five and still make money.
Let’s scale it up and pull these two further apart. Let’s say you want to chase a juicier profit with a small risk. You can pursue a risk-reward ratio of 1 to 15, meaning you risk $1 to make $15. The odds are very much in your favor — you can be wrong 14 times out of 15 and still break even.
What Does This Look Like in Practice? 🧐
Suddenly, the EUR/USD is looking attractive and you’re convinced that it’s about to skyrocket after some big news shakes it up. You’re ready to ramp up your long position. Now comes decision time — what’s a safe level of risk relative to a handsome reward?
You decide to use leverage of 1:100 and buy one lot (100,000 units) at the price of $1.10. That means your investment is worth €1,000 but in practice you are selling $100,000 (because of the leverage) to buy the equivalent in euro. In a trade of that size one pip, or the fourth figure after the decimal (0.0001), carries a value of €10 in either direction.
If the exchange rate moves from $1.1000 to $1.1100, that’s 100 pips of profit worth a total of €1,000. But if the trade turns against you, you stand to lose the same amount per pip. Now, let’s go to the practical side of things.
You choose to widen the gap between risk and reward and aim for profit that’s 15 times your potential loss. You set your stop loss at a level that, if taken out, won’t sink your account to the point of no return. Let’s say you run a €10,000 account and you’ve already jammed €1,000 into the trade.
A safe place to set your stop loss would be a potential drawdown of 2%, or €200. In pip terms, that’s equal to 20 pips. To get to that 1:15 ratio, your desired profit level should be 300 pips, aiming for a reward of €3,000.
If materialized, the €3,000 profit will bump your account by 30% (that’s your return on equity), while your return on investment will surge 200%. And if you take the loss, you’d lose 2% of your total balance.
It’s How the Big Guys in the Industry Do It
You’d be surprised to know that most of the Wall Street legends have made their fortunes riding asymmetric bets. Short-term currency speculator George Soros explains how he broke the Bank of England with a one-way bet that risked no more than 4% of his fund’s capital to make over $1 billion in profits.
Ray Dalio talks about it when he says that one of the most important things in investing is to balance your aggressiveness and defensiveness. “In trading you have to be defensive and aggressive at the same time. If you are not aggressive, you are not going to make money, and if you are not defensive, you are not going to keep money.”
Paul Tudor Jones, another highly successful trader, spotlights the skewed risk-reward ratio as his path to big profits. “5:1 (risk /reward),” he says in an interview with motivational speaker Tony Robbins,” five to one means I’m risking one dollar to make five. What five to one does is allow you to have a hit ratio of 20%. I can actually be a complete imbecile. I can be wrong 80% of the time, and I’m still not going to lose.”
What’s Your Risk-Reward Ratio? 🤑
Are you using the risk-reward ratio to get the most out of your trades? Do you cut the losses and let your profits run by using stop losses and take profits? Share your experience below and let’s spin up a nice discussion!
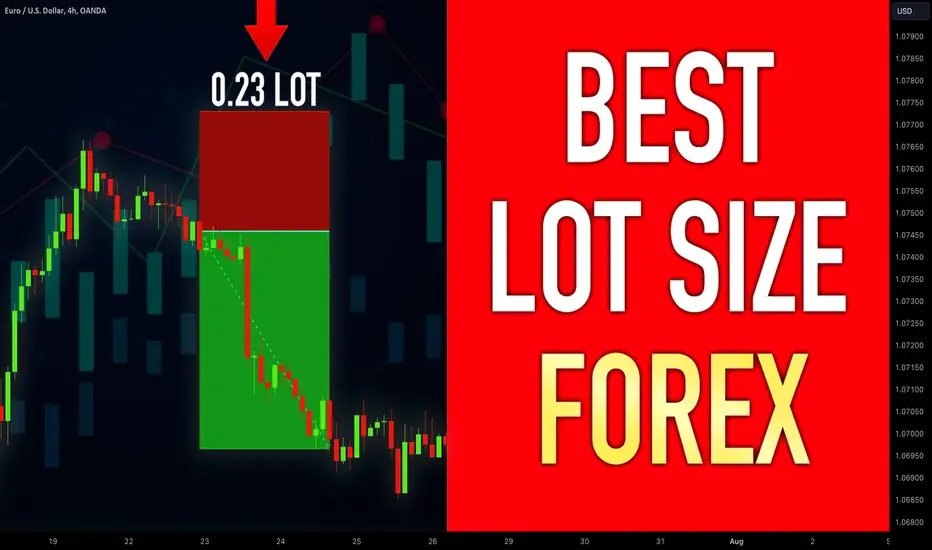
What Lot Size to Use in Forex for $10, $100, $1000 Account
I will share with you a simple guide, that will help you to calculate a lot size for your forex trading account easily.
In brief, let me explain to you why you should calculate a lot size for your trades.
If you trade Forex with Fixed lot, you should be extremely careful. Too big lot size may lead too substantial losses or even blown trading account, while with a too small lot you may miss good profits.
To calculate the best lot size, follow these 5 simple steps.
1. Make a list of all Forex pairs that you trade
Let's say that you trade only major forex pairs:
EURUSD,
GBPUSD,
USDJPY,
USDCAD,
NZDUSD,
AUDUSD
2. Back test every pair and identify at least 5 past trading setups on each pair
Above, you can see 5 last trades on each 6 major forex pairs.
3. Measure stop losses of each trade
4. Find the trade with the biggest stop loss in pips
In our example, the biggest stop loss in on GBPUSD pair.
It is 34 pips.
Remember this number and the name of a currency pair.
Why we need to do that? Your lot size will primarily depend on your risk in pips. For example, scalpers may have 10/15 pips stop losses, while swing traders may have even 100 pips stop losses.
5. Open a Forex position size calculator
You can use any free calculator that is available.
They are all the same.
6. Input your account size, 2% as the risk ratio and a currency pair with the biggest stop loss (GBPUSD in our example)
In "stop loss in pips" field, write down the pip value of your biggest stop loss - 34 pips in our example.
For the account size of 1000$,
the best lot size to use 0.05 standard lot.
The idea is that your maximum loss should not exceed 2% of your account balance, while the average loss will be around 1%.
Remember to carefully back test your strategy and now exactly your maximum risks in pips, to make proper calculations!
❤️Please, support my work with like, thank you!❤️
AMP Futures - Market Replay - TradingView MobileIn this idea we will demonstrate how to access market replay with the Tradingview mobile app.

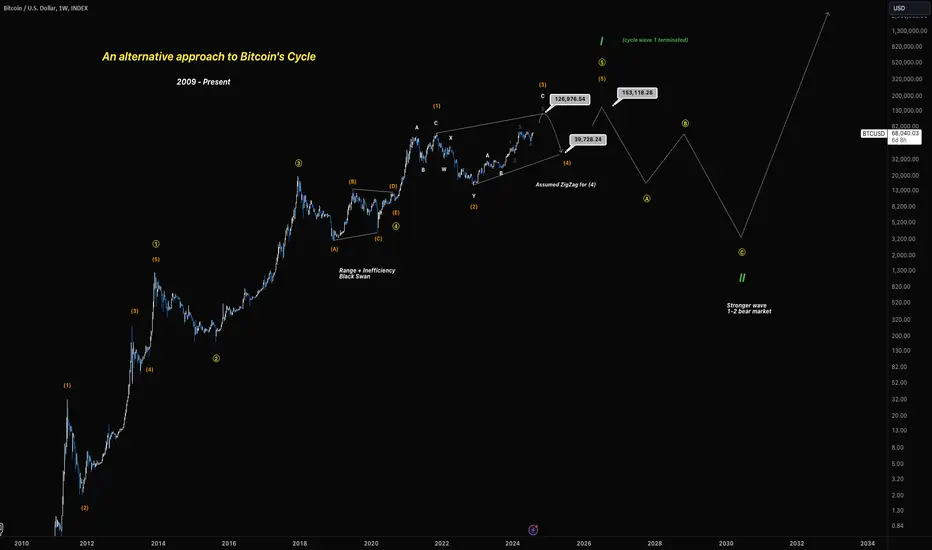
Predicting Bitcoin's Cycle Using the Elliott Wave Theory, Part 2Hello traders. In this article, we dive deeper into another detailed way of seeing Bitcoin's potential end-of-cycle pattern. This is the 2nd part to the previous post that discusses Bitcoin's cycle using the Elliott Wave Theory - a comprehensive and subjective theory. Here, we will be exploring an alternative scenario that builds on our previous concept of Bitcoin fractals since its inception in 2009. By addressing some of the subjectivity in the wave theory and leveraging market psychology and algorithmic fractals, this post is aimed to provide another organized and insightful look at the structure of Bitcoin's price movements.
If you are interested in seeing the first scenario, here is a link for your convenience:
For this alternative scenario, as mentioned above, it addresses some of the subjectivity that arises from the Elliott Wave Theory, specifically the observation of multiple 1-2 scenarios presented in our previous idea. Although the idea was supported by evidence from market psychology and algorithmic fractals, the problem arises by having the possibility of infinite 1-2 nested structures that works upon extending each internal wave - which is a pretty rare observation in any markets; however, Bitcoin has been able to withstand year by year and work on a pretty timely schedule. Based on the expectations, we used that observation to create the scenario of nested 1-2's. Nevertheless, due to its possible subjective count, this idea focuses more on the structural integrity of the basic 5-wave pattern and being able to fit the whole price action from inception as a 5-wave pattern.
Simply put, this thesis aims to create a more organized structure. As many are still eager to determine how far Bitcoin might correct after this bull run ends, I hope this idea can also give you confidence to help build your own thesis.
There is one thing that is for sure, however: the evidence portrayed from both of these scenarios strongly suggests that we will see higher levels before lower levels, though no theory can be 100% accurate, we could technically see a reversal even now. But my duty is to make sure to narrow down the scenarios as best as I can.
For this specific idea, we have structured this whole move up as 5 waves since inception, sticking as closely as possible to the basic Elliott Wave model of the 5-wave impulse. To achieve this, we made some simple adjustments from the first thesis in the previous post.
The challenge for many arises when trying to fit a wave 3 that must be the longest or second longest wave compared to waves 1 and 5. In this chart, since primary wave 1 in yellow is the longest, wave 5 must be technically shorter than wave 3, which is a strict rule and must be obeyed.
To accomplish this, we can use the 2017-2020 price action as a range initself for wave 4. Previously, we considered the pandemic crash as a technical bottom. If we use that as a sideways range, the only viable sideways patterns are triangles and flats (as we have exhausted the zigzag family correction patterns for wave 4 already). For more details on these patterns, please refer to the previous guide on triangle and flat patterns in my Elliott Wave Theory guide on my main page.
By using the 2017-2020 range as a triangle, our subwave E has resulted in an extremely short subwave, known as a failure or truncation. After breaking out of the triangle, the next step is to figure out on how to form wave 5, which is the final part of the 5-wave motive impulse.
Currently, the only way we can see wave 5 concluding is through a possible diagonal given the current data. Why? We would typically expect a basic 5-wave move for wave 5, but since wave 5 has to be short and wave 1 was extended, we do not expect the last primary wave 5 in yellow to be extended.
Thus, the only remaining option is a possible diagonal pattern to complete wave 5, since we have also assumed it will be short due to wave 1 already being the longest wave and wave 3 being the 2nd longest wave.
This Ending Diagonal, which consists of 5 waves (unlike a Leading Diagonal, which appears in waves 1 or A), they are only observed in wave 5s or wave Cs.
To construct our Ending Diagonal, the five subwaves must be zigzags (simple ABCs) or complex zigzags (WXYs). We are currently observing a mix of these, which is normal in diagonals:
* Subwave (1): ABC. Observed as a long wave A and short wave C. This can be debated, but longer wave As compared to wave Cs are not uncommon.
* Subwave (2): WXY. A WXYXZ could fit as well like we observed in our previous post, but that deviates significantly from the traditional structure. A WXY is the next best alternative, and even that can be subjective as we typically observe simple ZigZags (ABCs) within diagonals.
* Subwave (3): Currently being created. With the available data, it could be an ABC, though it may become more complex going forward.
* Subwave (4) / (5) : To be determined. Must belong to the zigzag family.
As we are still working on subwave (3) within the ending diagonal, the interest level for a pullback remains the same as in our previous idea, THAT IS THE KEY. This significant pullback could validate this idea, so we will monitor it up to that point.
This larger picture presents a wide range between subwaves 4 and 5, similar to waves 1 and 2.
Once subwaves 4 and 5 are created, it will technically terminate the larger degree wave 5 of the entire 5-wave impulse cycle. After termination, a significant downside correction is possible, potentially reaching levels as low as $3,000.
Alternatively, we also have a completely different count where this cycle wave 1-2 may be already in play, and it can be achieved by using a larger flat idea that may also help with separation and further deepend subjectivity. Here is that approach:
In conclusion, while the evidence strongly suggests that Bitcoin will reach higher levels before any significant correction, it is crucial to remain adaptable as market conditions evolve. The analysis presented here offers merely a potential roadmap. No theory can predict market movements with absolute certainty. By staying informed and considering multiple scenarios, investors can better navigate the complexities of the cryptocurrency market.
I invite EVERYONE to share your thoughts and engage with this post in the comments below.
Why Interest Rates Matter for Forex TradersWhy Interest Rates Matter for Forex Traders
Delve into the intricate world of forex, where interest rates stand as towering beacons guiding currency movements and trader strategies. From the fundamentals of central bank operations to the subtle nuances of the carry trade, uncover how they shape the global financial tapestry, dictating economic outcomes and trader fortunes.
Understanding Interest Rates
An interest rate is the cost of borrowing money or the return earned from lending, expressed as a percentage. Two primary types dominate the discourse:
Central Bank Interest Rates
Set by monetary authorities like the Federal Reserve, these rates often serve as the benchmark for short-term lending between banks. For instance, the federal funds rate in the US dictates interbank loans overnight, influencing liquidity and, by extension, currency value.
Market Interest Rates
Think LIBOR (London Interbank Offered Rate) – the rate at which banks lend to each other in the international interbank market. It, influenced by supply and demand dynamics, often fluctuates daily, making it a vital metric for traders who delve into currency swaps or forward rate agreements.
In trading currency pairs, interest rates aren't mere numbers – they're indicators dictating strength, investment flows, and overall economic health.
Interest Rates as Market Drivers
In forex, interest rates emerge as crucial influencers. Acting as catalysts, they shape currency values, guide investment flows, and mould strategies traders employ.
For those looking to take advantage of these forces, using a platform like FXOpen's TickTrader offers a competitive edge, ensuring traders have access to real-time data and advanced trading tools.
Decoding Interest Rates in Forex Market Trends
Interest rates wield enormous power in the global financial theatre, particularly in the dynamics of forex trading. One of the clearest relationships observed is between high interest rates and currencies. Elevated rates act as a magnet for foreign capital since investors constantly scout for better returns. This inflow requires the purchase of the country's currency, leading to its appreciation.
Carry Trade and Interest Dynamics
One such tactic to capitalise on rate disparities is the carry trade. Traders borrow funds in a currency with low rates and invest it in a currency yielding higher returns. The difference or the "carry" becomes their profit. The symbiotic relationship between interest rates and forex is deeply evident here. A sound grasp of the nuances of this strategy can lead to lucrative opportunities for seasoned traders.
Interest Differentials: The Subtle Nuances
Even minor variations in rates across nations can offer significant opportunities. These differentials between currency pairs influence their relative strengths. For instance, if Country A starts offering higher interest rates than Country B, it could lead to an appreciation of Country A's currency, interest rates playing the central role. Savvy traders continually analyse these differentials, strategising their trades to capitalise on the anticipated market movements.
Central Banks and Monetary Policy
Central banks hold a significant position in steering a nation's economic direction. One of their critical levers is the setting of interest rates. They directly impact the money supply and, subsequently, inflation levels.
When inflation surges beyond targeted levels, central banks may raise rates to rein it in, as this will typically reduce consumer borrowing and spending. Conversely, when economies face downturns, they might reduce them, promoting borrowing and investment and aiming to boost economic activity. Thus, the delicate balance between inflation rates and interest rates is a testament to the central authorities’ pivotal role in economic stability.
Monetary Policy Tools: Shaping the Financial Landscape
Central banks use a variety of tools to implement their monetary policies:
Open Market Operations
By buying or selling government securities, these banks control the money circulating in the economy. Selling securities pulls money out of the market, leading to higher interest rates. Conversely, purchasing them injects money, pushing rates down.
Reserve Requirements
By altering the amount of money banks need to hold in reserve, central banks can influence the amount available for loans. A higher reserve means fewer loans, resulting in higher rates and vice versa.
Forward Guidance and Quantitative Easing
These are more nuanced tools. Forward guidance involves bank governors communicating their future plans, providing the market with a sense of direction. Quantitative easing, on the other hand, involves large-scale asset purchases to increase money supply and lower interest rates.
Economic Indicators and Their Correlation with Interest Rates
Economic indicators provide valuable insights into a country's financial health, and their fluctuations often influence monetary policy decisions. For instance, when inflation surpasses target levels, central banks might consider hiking them to temper the rising prices, leading to an interplay between foreign exchange and interest rates.
A strong GDP growth signals a thriving economy, which might attract foreign investments. These inflows usually put upward pressure on the domestic currency. However, if the bank responds by raising rates, this may further amplify its strength. Thus, the effect of increasing interest rates on currency is often profound, making it a focal point for forex traders.
Similarly, employment metrics, consumer sentiment, and manufacturing output are all vital indicators that economists monitor. Changes in these metrics might hint at upcoming monetary policy adjustments.
Lastly, there are foreign currency loans and interest rates. When global rates are low, corporations might engage in foreign currency loans, seeking cheaper financing options. However, shifts in these rates can impact the cost of servicing these loans, leading to potential forex market volatility.
The Bottom Line
The dance between forex and interest rates is both complex and fascinating. As we've seen, interest rate trading offers profound insights and opportunities for those in the foreign exchange arena. For those eager to navigate these waters and capitalise on the intricate interplay of rates and currencies, opening an FXOpen account can be the gateway to informed, strategic trading in this dynamic market.
This article represents the opinion of the Companies operating under the FXOpen brand only. It is not to be construed as an offer, solicitation, or recommendation with respect to products and services provided by the Companies operating under the FXOpen brand, nor is it to be considered financial advice.
How To Find Another Entry On The Trade u Missed Tutorial in this video i am explaining to u two different methods to catch the trade u have missed already from the right place and price

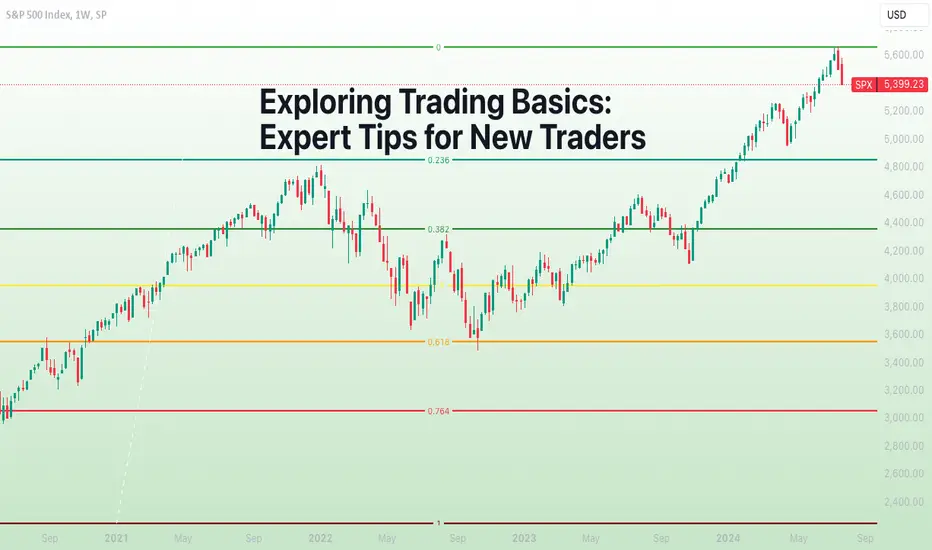
Exploring Trading Basics: Expert Tips for New TradersWelcome to the thrilling world of trading, future market experts! If you’re stepping into this arena for the first time, it’s natural to feel both excited and a little overwhelmed. No worries — we’ve set up this nice value-packed TradingView Idea to make you feel at home. Read on for practical tips that will help you kick off your trading journey to a strong start. Ready, set, go? Let’s roll!
1. Get Yourself Familiarized
Action Step : Your first step as a fresh trader is to familiarize yourself with the market fundamentals. Start by getting a solid grasp of basic market concepts. Learn about different asset classes like stocks , forex , or crypto .
Understand how they work and what news or events influence prices across the board (spoiler: if you’re looking at the bigger picture and keep it high level, there aren’t too many things to consider — check the Economic Calendar Related Idea below). Spend an hour or two each week reading about market fundamentals. Knowledge of these basics will make you more confident in your trading approach and also help you see where you feel most comfortable putting your money. And don't forget about the trading psychology part .
2. Set Clear, Achievable Goals
Action Step : Write down your trading goals and stick them somewhere you can see them. Aim for specific, measurable targets like “Hit a 2% monthly return” or “Learn a new trading strategy weekly.” This keeps your efforts focused and on track.
But don’t stop there. Keep revisiting, updating, and refining your trading goals. Think of them as your compass or map that you need to follow in order to get where you want. In contrast, not having a goal or goals might throw you out in the open where you wander without a clear path or direction.
3. Stick to Your Budget
Action Step: Decide on your total trading capital and how much you’re willing to risk per trade. Use the 1-2% rule: never risk more than 1% or 2% of your total capital on a single trade. This will help you protect your account from total wipeout.
It’s easy to get swayed by some massive move in the market (yes, we know about Bitcoin BTC/USD ), but catching these waves is rarely an easy game. The better you are at sticking to a healthy level of risk exposure, the better your chances to stay in the game for as long as possible.
4. Stay Updated with Market News
Action Step : Dedicate 15 minutes each morning to checking financial news. Keeping tabs on major economic reports and events will give you an understanding of what investors regard as important so you can add it to your agenda too.
We’ve set up a nice and easygoing Top stories news stream that serves you only top-tier market-moving scoops, published daily and updated in real time. Make sure to frequent them so you can raise your level of knowing what’s happening in the markets.
5. Keep a Trading Journal
Action Step : For every trade, jot down the details in a journal. Include entry and exit points, your reasons for the trade, and the outcome. Review your journal weekly to identify patterns and areas for improvement.
If you want to get an even more precise look at your trading performance, add more columns to it and include prospect trades, or a watchlist of positions you’re interested in. Mark your monthly performance, year-to-date returns, and even how much you paid in commissions.
6. Start Small and Scale Up
Action Step : Begin with small trades to minimize risk while you’re learning. For example, if you have $1,000, start with trades of $50-$100 and keep your stop tight around the 2% mark. That way, you’ll gain experience and see how you feel when you have an open trade.
Leave a trade overnight, watch it actively or let it run for a few days (provided you use a stop loss , more on it in the Stop Loss Related Idea below) — all these will help you ease into smoother trading and build better confidence. After that, you can gradually increase your trade size for bigger profits. And — most importantly — don’t rush it. The markets will be there tomorrow; but will you?
7. Use Stop-Loss Orders
Action Step : Always set a stop-loss order when placing a trade. For instance, if you buy a stock at $100, set a stop-loss at $95. This means your position will be automatically sold if the price drops to $95, limiting your loss to $5 per share.
The use of stop-loss orders, or simply stop losses, can’t be emphasized enough. No matter how confident you are on a trade, how much conviction you have to go big, always think of the downside, or how much you’re willing to lose.
8. Join a Trading Community
Action Step : If you’re reading this, then you’ve already nailed this step. TradingView is the world’s largest finance, markets, and charting platform, boasting more than 60 million monthly visitors — one big, big community .
This is the place where traders share tips and strategies, show off their charts, discoveries, patterns, price targets, and trading ideas. So, stick around, engage, ask questions, and learn from the experiences of others.
9. Diversify Your Portfolio
Action Step : Spread your investments across different sectors and asset classes. Don’t just buy big tech stocks ; consider some auto companies as well or the volatile corner of cryptocurrencies.
Diversifying your portfolio (learn about it in the Diversification Related Idea below) will help you balance your risk, ideally without reducing the potential for returns. You don’t have to go all-in on a trade and YOLO your entire life savings into a Solana meme coin. Think of the long term and tread carefully. Sometimes, you’re as good as your last trade.
10. Continuously Improve Your Skills
Action Step : Dedicate time each week to learning something new about trading. Watch educational videos , read books, or dive into financial podcasts where big market events get broken down or where traders and investors share their experience and what made them successful.
The markets renew each day, never resting, never ceasing to oscillate and presenting new trading opportunities. Always learn, never get complacent, and keep striving for more!
Share Your Thoughts!
So there you have it, folks! With these practical, actionable tips, you’re ready to jump into the trading game with some added confidence. Remember, every pro was once a newbie. Stay cool, stay informed, and most importantly, have fun with it (but also be smart). Happy trading! 🚀📈
How to Adjust your Fibonacci LevelsHey Traders here is a quick video on how Fibonacci can help you in your trading. Also how you can know when to adjust the levels as the market moves higher or lower.
Enjoy!
Trade Well,
Clifford

AMP Futures - Bracket orders with TradingView MobileIn this idea we will demonstrate how to create bracket orders with Tradingview mobile.

4h and 8h Fakout entry strategy explainedA short video explaining the process of using 4h and 8h fakeouts as an entry strategy

Divergence: RSI vs. PriceHey everyone!
In my years of trading, I've really come to love Reversal Strategies and my favorite is in the form of a DIVERGENCE!
Today, I took some time to put together an Educational Video on:
1) What a Divergence Is?
2) How to Spot them!
&
3) How to Trade them!
I hope you find this helpful!
**Tips
- Divergence is never good enough to trade alone, YOU NEED CONFIRMATION!
- The longer the Divergence takes, the more reliable it is
- Change in Momentum is KEY!

Timing when day trading can be everythingTiming when day trading can be everything
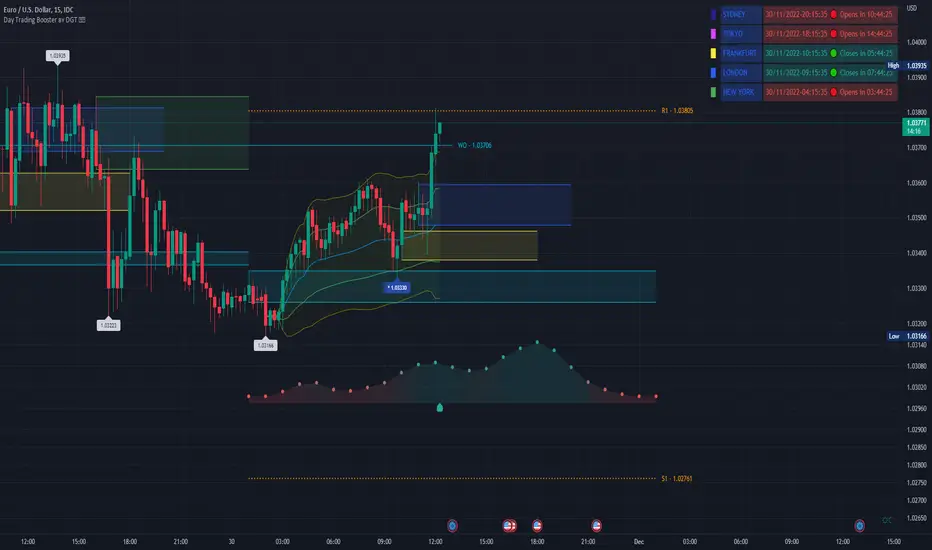
In Stock markets typically more volatility (or price activity) occurs at market opening and closings
When it comes to Forex (foreign exchange market), the world’s most traded market, unlike other financial markets, there is no centralized marketplace, currencies trade over the counter in whatever market is open at that time, where time becomes of more importance and key to get better trading opportunities. There are four major forex trading sessions, which are Sydney, Tokyo, London and New York sessions
Forex market is traded 24 hours a day, 5 days a week across by banks, institutions and individual traders worldwide, but that doesn’t mean it’s always active the entire day. It may be very difficult time trying to make money when the market doesn’t move at all. The busiest times with highest trading volume occurs during the overlap of the London and New York trading sessions, because U.S. dollar (USD) and the Euro (EUR) are the two most popular currencies traded. Typically most of the trading activity for a specific currency pair will occur when the trading sessions of the individual currencies overlap. For example, Australian Dollar (AUD) and Japanese Yen (JPY) will experience a higher trading volume when both Sydney and Tokyo sessions are open
There is one influence that impacts Forex matkets and should not be forgotten : the release of the significant news and reports . When a major announcement is made regarding economic data, currency can lose or gain value within a matter of seconds
Cryptocurrency market s on the other hand remain open 24/7, even during public holidays
Until 2021, the Asian impact was so significant in Cryptocurrency markets but recent reasearch reports shows that those patterns have changed and the correlation with the U.S. trading hours is becoming a clear evolving trend.
Unlike any other market Crypto doesn’t rest on weekends, there’s a drop-off in participation and yet algorithmic trading bots and market makers (or liquidity providers) can create a high volume of activity. Never trust the weekend’ is a good thing to remind yourself
One more factor that needs to be taken into accout is Blockchain transaction fees, which are responsive to network congestion and can change dramatically from one hour to the next
In general, Cryptocurrency markets are highly volatile, which means that the price of a coin can change dramatically over a short time period in either direction
The Bottom Line
The more traders trading, the higher the trading volume, and the more active the market. The more active the market, the higher the liquidity (availability of counterparties at any given time to exit or enter a trade), hence the tighter the spreads (the difference between ask and bid price) and the less slippage (the difference between the expected fill price and the actual fill price) - in a nutshell, yield to many good trading opportunities and better order execution (a process of filling the requested buy or sell order)
The best time to trade is when the market is the most active and therefore has the largest trading volume, trading all day long will not only deplete a trader's reserves quickly, but it can burn out even the most persistent trader. Knowing when the markets are more active will give traders peace of mind, that opportunities are not slipping away when they take their eyes off the markets or need to get a few hours of sleep
You are kindly invited to check the script that helps to identify market peak hours : Day Trading Booster .
Incorporating Alternative Investments into Portfolio BuildsIncorporating alternative investments such as private equity, hedge funds, and real assets can be a rewarding strategy for diversification and enhancing returns. These alternative assets provide unique risk-return profiles that can complement traditional investments in forex, commodities, and indices.
1️⃣ Understanding the Role of Alternative Investments
Alternative investments can play an important role in diversification due to their low correlation with traditional asset classes. By including assets like private equity, hedge funds, and real assets, you can reduce overall portfolio volatility. For example, during the 2008 financial crisis, many hedge funds and private equity investments outperformed traditional equities, providing a buffer against market downturns. Understanding the unique risk-return characteristics of each alternative investment is essential for effective integration.
2️⃣ Analyzing Historical Performance and Risk
To effectively incorporate alternative investments, it's important to analyze their historical performance and risk profiles. For instance, private equity has historically offered higher returns than public equities, but with greater risk and illiquidity. Hedge funds, on the other hand, provide diverse strategies such as long-short equity, market neutral, and global macro, each with different risk-return dynamics. Real assets like real estate and infrastructure provide stable cash flows and inflation protection, but come with their own set of risks.
3️⃣ Diversification Strategies
Diversification is the cornerstone of portfolio construction. When integrating alternatives, consider spreading investments across different types of alternative assets. For example, combining private equity with hedge funds and real assets can help mitigate the risk associated with any single asset class. A diversified portfolio might include a mix of growth-oriented private equity, income-generating real estate, and tactical hedge fund strategies.
4️⃣ Assessing Liquidity Needs
One of the main challenges with alternative investments is liquidity. Private equity and real assets typically have long lock-up periods, whereas hedge funds may offer more liquidity but still not as much as traditional assets. Assess your liquidity needs and time horizon before allocating significant portions of your portfolio to these investments. For example, an investor with a long-term horizon might allocate more to private equity, while those needing shorter-term liquidity might prefer hedge funds.
5️⃣ Evaluating Manager Expertise and Due Diligence
The success of alternative investments often hinges on the expertise of the fund managers. Conduct thorough due diligence by evaluating the manager’s track record, investment strategy, and risk management practices. For example, when selecting a private equity fund, consider the fund’s history of successful exits, management team’s experience, and alignment of interests. Similarly, for hedge funds, assess the manager's ability to generate alpha across different market conditions.
6️⃣ Tactical Asset Allocation
Integrating alternative investments requires a dynamic approach to asset allocation. Tactical asset allocation involves adjusting the portfolio mix based on market conditions and opportunities. For instance, during periods of low interest rates and high equity valuations, increasing exposure to private equity and real assets might provide better returns. Conversely, in volatile markets, hedge funds employing market neutral or global macro strategies can offer downside protection.
7️⃣ Monitoring and Rebalancing
Regular monitoring and rebalancing are essential to maintain the desired risk-return profile of the portfolio. Set predefined thresholds for rebalancing to ensure the portfolio stays aligned with your investment goals. For example, if the allocation to private equity exceeds the target due to strong performance, consider rebalancing by allocating more to underperforming or undervalued assets like certain commodities or forex positions. This disciplined approach helps in maintaining the optimal balance between traditional and alternative investments.
Incorporating alternative investments into a portfolio that includes forex, commodities, and indices offers a pathway to enhanced diversification and potential returns. By understanding the unique characteristics of private equity, hedge funds, and real assets, investors can craft a balanced and resilient portfolio. Remember to conduct thorough due diligence, assess liquidity needs, and regularly monitor and rebalance the portfolio to adapt to changing market conditions.

Why Using Charts Can Help You with Your TradingImagine you've decided to buy a particular stock. Your position starts to make money, and you're thrilled. But what do you do now? Should you hold onto your position or cash it in? Has it made enough profit, or will it go further? It's painful to lose money, but it's also frustrating to take profits only to see your original investment quadruple in price after you've cashed out too early.
Is there something that can help you make these decisions? Yes, there is! It's called technical analysis. But what if you're a complete novice to technical analysis? It may look complicated and difficult, but don't worry.
The beauty of technical analysis is that it can help with your decision-making, and once you learn the rules, it's easy to apply.
I have attached a short video explaining the steps I go through when I first look at a chart. Do you know how to determine a trend? Do you know how to apply trend lines? Do you know what a momentum indicator is? Do you know why and how to use moving averages? Do you understand continuation and reversal signals?

Optimizing Technical Analysis with Logarithmic Scales▮ Introduction
In the realm of technical analysis, making sense of market behavior is crucial for traders and investors. One foundational aspect is selecting the right scale to view price charts. This educational piece delves into the significance of logarithmic scaling and how it can enhance your technical analysis.
▮ Understanding Scales
- Linear Scale
This is a common graphing approach where each unit change on the vertical axis represents the same absolute value.
- Logarithmic Scale
Unlike the linear scale, the logarithmic scale adjusts intervals to represent percentage changes.
Here, each step up/down the axis signifies a constant percentage increase/decrease.
▮ Why Use the Logarithmic Scale?
The logarithmic scale offers a more insightful way to analyze price movements, especially when the price range varies significantly.
By focusing on percentage changes rather than absolute values, long-term trends and patterns become more apparent, making it easier to make informed trading decisions.
▮ Comparative Examples
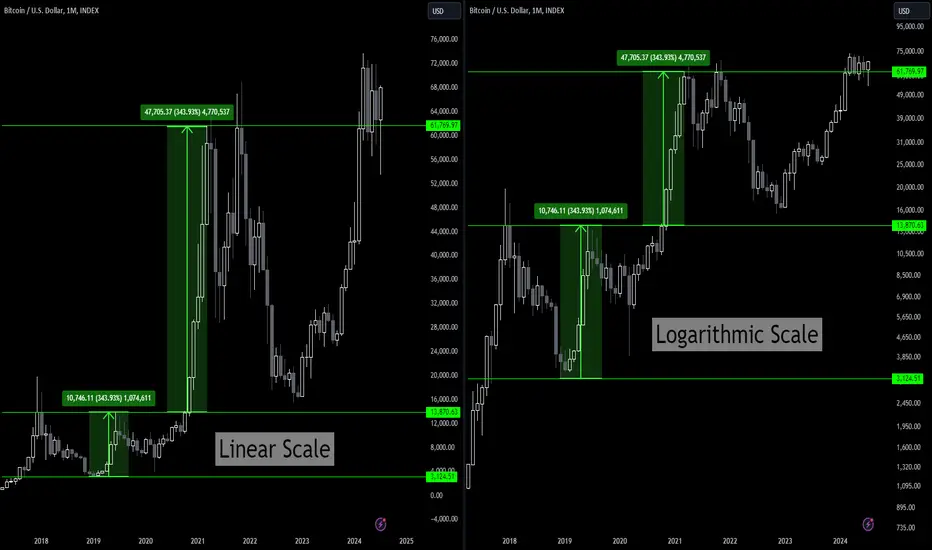
Consider the Bitcoin price movement:
- On a linear scale, a 343% increase from $3,124 to $13,870 looks smaller compared to the same percentage increase from $13,870 to $61,769. This disparity occurs because the linear scale emphasizes absolute changes.
- On the logarithmic scale, both 343% increases appear proportional, giving a clearer representation.
Additionally, in a falling price scenario, a linear graph might show a smaller box for an 84% drop compared to a 77% drop, simply because of absolute values' significance. The logarithmic scale corrects this, showing the true extent of percentage declines.
▮ Advantages and Disadvantages
Advantages:
- Fairer comparison of price movements.
- Consistent representation of percentage changes.
- More reliable support and resistance lines.
Disadvantages:
- Potential misalignment of alerts (tradingview.sweetlogin.com).
- Drawing inclined lines might create distortions when switching scales:
A possible solution is the use the "Object Tree" feature on TradingView to manage graphical elements distinctly for each scale.
▮ How to Apply Logarithmic Scale on TradingView
Enabling the logarithmic scale on TradingView is straightforward:
- Click on the letter "L" in the lower right corner of the graph (the column where prices are shown);
- Another option is use of the keyboard shortcut, pressing ALT + L .
▮ Conclusion
The logarithmic scale is an invaluable tool for technical analysis, providing a more accurate representation of percentage changes and simplifying long-term pattern recognition.
While it has its limitations, thoughtful application alongside other analytical tools can greatly enhance your market insights.
Volume Spread Analysis (VSA): Volume and Price DynamicsVolume Spread Analysis (VSA): Understanding Market Intentions through Volume and Price Dynamics.
█ Simple Explanation:
Volume Spread Analysis (VSA) is a trading technique that identifies key market patterns and trends by analyzing the relationship between volume and price spread, revealing traders' actions and market behavior.
Essentials in Volume Spread Analysis (VSA):
Laws.
VSA Indicator.
Signs of Strength.
Signs of Weakness.
Note that while the provided examples are excellent for illustrating the points, they are unlikely to play out perfectly in most scenarios.
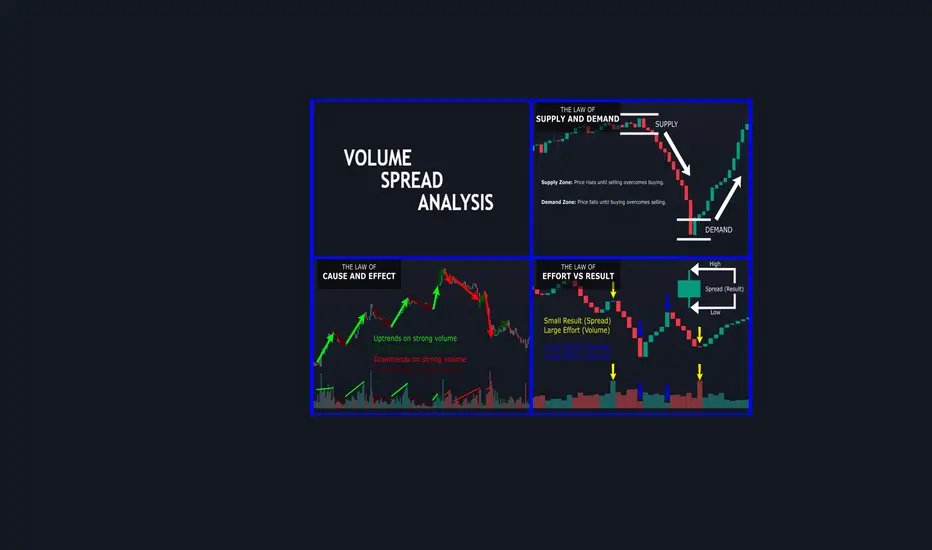
█ Laws
Three basic laws forming the foundation of Volume Spread Analysis (VSA).
The Law of Supply and Demand
This law states that supply and demand balance each other over time. High demand and low supply lead to rising prices until demand falls to a level where supply can meet it. Conversely, low demand and high supply cause prices to fall until demand increases enough to absorb the excess supply.
The Law of Cause and Effect
This law assumes that a 'cause' will result in an 'effect' proportional to the 'cause'. A strong 'cause' will lead to a strong trend (effect), while a weak 'cause' will lead to a weak trend.
The Law of Effort vs Result
This law asserts that the result should reflect the effort exerted. In trading terms, a large volume should result in a significant price move (spread). If the spread is small, the volume should also be small. Any deviation from this pattern is considered an anomaly.
█ VSA Indicator
This indicator simplifies the identification of Volume and Spread Levels. It provides options to display volume and/or spread bars. An enhanced version of the indicator auto-scales both volume and spread for optimal chart presentation, reloading every time the chart is moved.
Levels: Representing the levels of both volume and spread using the terminalogy of low, normal, high, and ultra.
Indicator Version 1: Display volume and/or spread bars. When both are displayed, the spread bars are shown in a fixed quantity.
Indicator Version 2: Display both volume and spread bars, with the spread bars scaled to the volume bars.
█ Signs of Strength
Indicates that the market is likely to experience bullish behavior.
Down Thrust: Indicates strong buying interest at lower prices, suggesting a potential upward reversal.
Selling Climax: Signifies a reversal point as panic selling exhausts and smart money starts accumulating.
Bear Effort No Result: A large downward price move without strong selling effort (volume) indicates an anomaly where the result doesn't match the effort, suggesting the down move may be unsustained.
No Effort Bear Result: Strong selling effort (volume) fails to push prices down indicating an anomaly where the result doesn't match the effort, suggesting a potential lack of downward momentum.
Inverse Down Thrust: Shows buyers overpowering sellers, likely leading to a bullish market reversal.
Failed Selling Climax: Failed selling effort suggests strong buying support and a possible upward trend reversal.
Bull Outside Reversal: Indicates strong buying reversing a downtrend, confirmed by higher close.
End of Falling Market: Signifies strong buying absorbs panic selling at new lows, likely leading to stabilized price or reversal.
Pseudo Down Thrust: Suggests weakening of the downward momentum with a potential upward continuation if broken above high.
No Supply: Indicates a lack of selling interest at lower prices, potentially setting up for a price rise.
█ Signs of Weakness
Indicates that the market is likely to experience bearish behavior.
Up Thrust: Indicates sellers overpowering buyers during a price rise, suggesting a potential downward reversal.
Buying Climax: Represents peak buying, typically at price highs, with potential for reversal as sellers take control.
No Effort Bull Result: A large upward price move without strong buying pressure (volume) indicates an anomaly where the result doesn't match the effort, suggesting the up move may be unsustained.
Bull Effort No Result: Strong buying (volume) fails to drive prices higher indicates an anomaly where the result doesn't match the effort, suggesting a potential lack of upward momentum.
Inverse Up Thrust: Increased selling pressure during an uptrend suggests a possible shift to a downtrend.
Failed Buying Climax: High buying volume fails to sustain higher prices, indicating a potential reversal to downtrend.
Bear Outside Reversal: Strong selling pressure reversing an uptrend, signaling a potential downtrend.
End of Rising Market: Indicates buying saturation at market peaks, suggesting a possible reversal as demand exhausts.
Pseudo Down Thrust: Indicates weakening upward momentum with potential for downward continuation if broken below low.
No Demand: Indicates reduced buying interest at higher prices, possibly leading to a price decline.
Charting the Markets: Top 10 Technical Analysis Terms to KnowWelcome, market watchers, traders, and influencers to yet another teaching session with your favorite finance and markets platform! Today, we learn how to marketspeak — are you ready to up your trading game and talk like a Wall Street pro? We’ve got you covered.
This guide will take you through the top technical analysis terms every trader should know. So, kick back, grab a drink, and let’s roll into the world of candlesticks, moving averages, and all things chart-tastic!
1. Candlestick Patterns
First up, we have candlesticks , the bread and butter of any chart enthusiast. These little bars show the opening, closing, high, and low prices of a stock over a set period. Here are some key patterns to recognize next time you pop open a chart:
Doji : Signals market indecision; looks like a plus sign.
Hammer : Indicates potential reversal; resembles, well, a hammer.
Engulfing : A larger candle engulfs the previous one, suggesting a momentum shift.
Want these automated? There's a TradingView indicator for that.
2. Moving Averages (MA)
Next, we glide into moving averages . These are practically lines that smooth out price data to help identify trends over time. Here are the big players:
Simple Moving Average (SMA) : A straightforward average of prices over a specific period of days.
Exponential Moving Average (EMA) : An average of prices but with more weight to recent prices, making it more responsive to new information.
3. Relative Strength Index (RSI)
The RSI is your go-to for spotting overbought and oversold conditions. Ranging from 0 to 100, a reading above 70 means a stock might be overbought (time to sell?), while below 30 suggests it could be oversold (time to buy?). Super common mainstay indicator among traders from all levels.
4. Bollinger Bands
Bollinger Bands consist of a moving average with two standard deviation lines above and below it. When the bands squeeze, it signals low volatility, and when they expand, high volatility is in play. Think of Bollinger Bands as the mood rings of the trading world!
5. MACD (Moving Average Convergence Divergence)
The MACD is all about momentum. It’s made up of two lines: the MACD line (difference between two EMAs) and the signal line (an EMA of the MACD line). When these lines cross, it can be a signal to buy or sell. Think of it as the heartbeat of the market.
6. Fibonacci Retracement
Named after a 13th-century mathematician, Fibonacci retracement levels are used to predict potential support and resistance levels. Traders use these golden ratios (23.6%, 38.2%, 50%, 61.8%, and 100%) to find points where an asset like a stock or a currency might reverse its direction.
7. Support and Resistance
Support and resistance are the battle lines drawn on your chart. Support is where the price tends to stop falling — finds enough buyers to support it — and resistance is where it tends to stop rising — finds enough sellers to resist it. Think of these two levels as the floor and ceiling of your trading room.
8. Volume
Volume is the fuel in your trading engine. It shows how much of a stock is being traded and can confirm trends. High volume means high interest, while low volume suggests the market is taking a nap from its responsibilities.
9. Trend Lines
Trend lines are your visual guide to understanding the market’s direction. Technical traders, generally, are big on trend lines. You can draw them by connecting at least a couple of lows in an uptrend or at least a couple of highs in a downtrend. They help you see where the market has been and where it might be headed.
10. Head and Shoulders
No, it’s not shampoo. The head and shoulders pattern is a classic reversal pattern. It consists of three peaks: a higher middle peak (head) between two lower peaks (shoulders). When you see this take shape in your chart, it might be time to rethink your position.
What’s Your Favorite?
So there you have it, a whirlwind tour of the top technical analysis terms that’ll help your trading yield better results and, as a bonus, make you sound like a trading guru. What’s your favorite among these 10 technical analysis tools? Share your thoughts in the comments below!

Taking On Discipline In StagesOnce you have decided that you need discipline in your trading, knowing where to start can be difficult and overwhelming. There are many pieces to a trading plan, and it's easy to feel overwhelmed.
You can break the task into manageable sections and master one discipline at a time, or focus on the the discipline you need. This approach makes the process more manageable and ensures that each aspect of your trading strategy is given the attention it deserves.
Trading Plan Components: Each of these sections should have objective rules so there isn't any escape room.
Method Rules
Entry Rules
Stop Rules
trailing Stop Rules
Exit Rules
Journaling
Trade Plan for TME, COIN
Shane

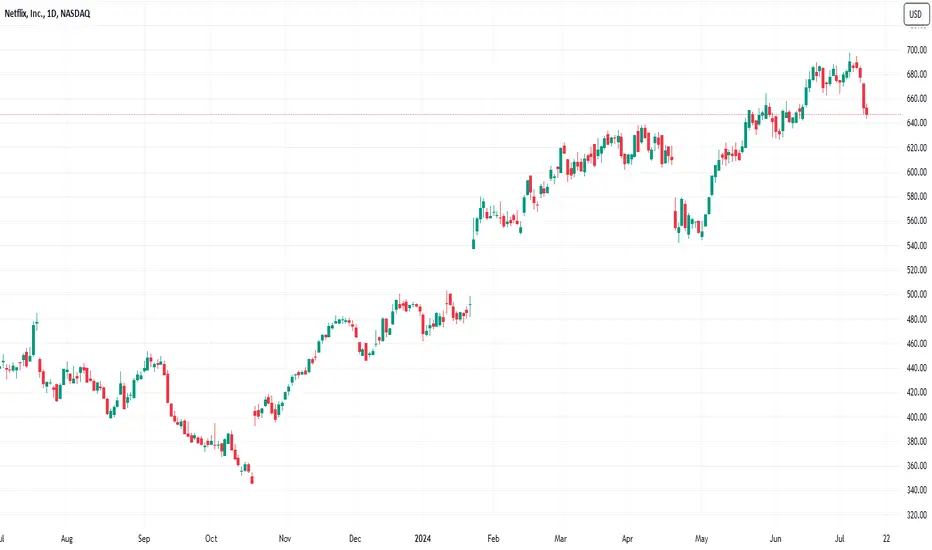
What Is a Dead Cat Bounce Pattern, and How Can One Trade It?What Is a Dead Cat Bounce Pattern, and How Can One Trade It?
A dead cat bounce is a common pattern in financial markets, often confusing traders with its brief recovery followed by continued decline. Understanding this pattern is crucial for traders aiming to navigate market downturns. This article delves into what a dead cat bounce is, its causes, how to identify it, and strategies for trading it.
Understanding the Dead Cat Bounce Pattern
A dead cat bounce is a temporary recovery in the price of a declining asset, followed by a continuation of the downtrend. This phenomenon occurs in all types of financial markets, including stocks, forex, and crypto*, and can mislead traders into believing that a market or asset has started to recover, only to see prices fall again.
The term "dead cat bounce" originates from the saying that "even a dead cat will bounce if it falls from a great height." In financial terms, this means that a sharp decline is often followed by a brief, albeit false, recovery. For example, during the 2008 financial crisis, many stocks experienced dead cat bounces as they briefly recovered before continuing their downward trajectory.
Identifying a dead cat bounce requires careful analysis. For instance, in a dead cat bounce in a crypto* asset, a sudden 10% rise might appear promising. However, if this increase is followed by another decline surpassing the recent lows, it confirms a dead cat bounce.
Traders often use volume analysis and resistance levels to spot these patterns, noting that a true recovery is usually accompanied by sustained volume and breaking through significant resistance levels.
Characteristics of a Dead Cat Bounce
A dead cat bounce is characterised by specific market behaviours that signal a temporary recovery amidst a prolonged downtrend. Recognising these features can help traders avoid being misled by false recoveries.
- Sharp Decline Preceding the Bounce: A significant drop in asset prices that breaks through single or multiple support levels.
- Brief and Sudden Rebound: The asset experiences a quick, short-lived rise in price.
- Low Trading Volume: The bounce usually occurs with lower trading volume compared to the initial decline, indicating weak buyer interest.
- Continuation of Downtrend: After the brief rebound, the asset's price continues to fall, often reaching new lows.
- Lack of Strong Fundamentals: The recovery lacks strong fundamental support, often driven by short-covering or speculative buying rather than genuine positive news.
Causes of a Dead Cat Bounce
A dead cat bounce is typically caused by several common factors that create a temporary illusion of recovery in a declining market.
- Short-Covering: Traders who have previously sold the asset buy it back to cover their positions, causing a temporary price increase.
- Speculative Buying: Some investors buy into the declining asset, hoping to capitalise on what they perceive as a bargain, which briefly drives prices up.
- Technical Support Levels: The asset hits a technical support level, prompting a temporary rebound as traders react to these key price points.
- Positive News: Positive news related to the asset, such as cost-cutting measures in a company, strong country GDP growth, or even rumours can cause temporary optimism and buying interest.
However, while these factors may provide some support for the asset, it’s rare for the market to recover fully. Given that the sharp fall preceding the bounce is often due to a significant shift in fundamentals or indicative of strong selling pressure, the bearish trend is likely to prevail.
Identifying a Dead Cat Bounce
Identifying a dead cat bounce involves careful analysis of price movements, trading volume, resistance levels, momentum indicators, and market sentiment. Recognising these signals may help traders avoid being misled by temporary market recoveries.
Price Movements
A dead cat bounce typically follows a sharp decline that clears previous support levels with little resistance, often prompted by significant news releases. After this steep fall, the price may find a temporary base at another support level and begin to rise. However, this recovery generally regains less than 50% of the initial drop.
Volume
The rebound in a dead cat bounce often occurs on weaker volume, indicating less conviction behind the recovery. This is especially noticeable in assets traded on centralised exchanges, like stocks or crypto*. In forex, assessing volume can be challenging due to its decentralised nature.
It’s important to consider the timeframe; daily charts may be most effective for detecting volume patterns in a dead cat bounce, while intraday volumes can be misinterpreted due to natural ebbs and flows as trading sessions progress.
Resistance Levels
The rebound may fail to break through significant resistance levels, such as a prior support level turned resistance or the last swing high in the downtrend. If the price approaches but cannot surpass these levels and subsequently drops again, it's a strong indication of a dead cat bounce. Monitoring these resistance points helps validate the pattern.
Momentum Indicators
Using technical indicators like the Stochastic Oscillator or Awesome Oscillator (AO) can provide clues about a dead cat bounce. These indicators may show only a slight improvement or remain in bearish territory, indicating weak momentum.
It’s important to recognise that these indicators might show false bullish signals, such as an oversold Stochastic or a bullish AO zero-line crossover, as the bounce begins. Therefore, they may have the most value in detecting continuation, such as a bearish hidden divergence.
To explore these indicators among 1,200+ trading tools, head over to FXOpen’s free TickTrader platform.
Market Sentiment
If broader market conditions and sentiment remain negative or if the news driving the rebound is not substantial, the bounce is likely temporary. It’s important to consider the overall picture and what has fundamentally changed for the asset rather than reacting to temporary retracement.
How to Trade a Dead Cat Bounce
When a trader recognises a potential dead cat bounce, they might consider entering a short position to capitalise on the continuing downtrend. Here are some key strategies that may potentially help trade this pattern effectively.
Since a bounce may sometimes be genuine and lead to a quick recovery, it's prudent for traders to wait for confirmation that the downtrend is ready to continue. This cautious approach also allows for placing a stop loss in a defined area—specifically, just above the high of the bounce.
Key Trading Signals
Traders typically watch for the last higher low established during the bounce to be traded through. In other words, they wait for the short-term bullish trend to appear to falter with a lower low. As seen in the dead cat bounce chart above, this indicates that the most recent support level during the bounce has failed, signalling the downtrend might continue.
Greater confidence in the downtrend continuation can be achieved if the price fails to break through a prior area of resistance or a previous support level now acting as resistance.
Momentum Indicators
Momentum indicators can be used to confirm that the downtrend is ready to continue.
Specifically, a hidden bearish divergence, where the RSI makes a high higher than the high before or at the beginning of the downtrend; the RSI showing the asset is overbought; or the RSI struggling to break above 50 on a slightly higher timeframe (RSI < 50 indicates bearish conditions) can add confirmation.
With the MACD, the signal line may cross under the MACD line or struggle to break out of negative territory.
Chart Patterns and Candlestick Patterns
- Bearish Chart Patterns: Breaking out of patterns like a rising wedge, bearish quasimodo, or descending triangle can confirm the move lower.
- Bearish Candlestick Patterns: Patterns such as a shooting star, tweezer top, or marubozu candle can add confluence and confidence to the trade.
Setting Stop Loss and Take Profit
- Stop Loss: Traders usually set a stop loss just above the high of the dead cat bounce to potentially limit losses if the price unexpectedly rises.
- Take Profit: Given the likelihood of another significant downward leg, a take-profit order may be set at the next major support level. This potentially ensures capturing returns before the market finds new support and reverses.
Context-Dependent Strategy
Ultimately, there is no single way to trade a dead cat bounce in stocks or any other asset. However, using these factors to seek confirmation and waiting for a further breakdown before taking a position can help traders navigate and take advantage of trading on this pattern.
The Bottom Line
Recognising and understanding a dead cat bounce can potentially help traders avoid false recoveries and optimise their strategies. By carefully analysing market signals and using appropriate trading techniques, traders might better navigate downtrends. To apply these insights and enhance your trading experience, open an FXOpen account today.
FAQs
What Is a Dead Cat Bounce?
The dead cat bounce meaning refers to a temporary recovery in the price of a falling asset, followed by a continuation of the downtrend. It often misleads traders into believing that the market or asset is recovering, only to see prices fall again.
What Causes a Dead Cat Bounce?
Several factors can cause a dead cat bounce, including short-covering, speculative buying, and hitting technical support levels. Temporary improvements in market sentiment or positive news can also trigger these short-lived recoveries.
How to Spot a Dead Cat Bounce?
A dead cat bounce can be identified by a sharp decline followed by a brief recovery that regains less than 50% of the initial drop. Low trading volume during the rebound, failure to break significant resistance levels, and weak momentum indicators are key signals.
Is a Dead Cat Bounce Bullish or Bearish?
A dead cat bounce is a bearish pattern. It represents a brief, false recovery in a downtrend, followed by a continuation of the falling market.
How Long Does a Dead Cat Bounce Last?
The duration of a dead cat bounce varies depending on the timeframe but is typically short. On a daily chart, it may take between a few days and a few weeks; on a 5-minute chart, potentially less than a few hours.
How to Analyse a Dead Cat Bounce?
Analysing a dead cat bounce involves considering price action, volume, resistance levels, momentum indicators, and overall market sentiment. Recognising these factors can help identify the potential for a temporary recovery in a declining market.
*At FXOpen UK and FXOpen AU, Cryptocurrency CFDs are only available for trading by those clients categorised as Professional clients under FCA Rules and Professional clients under ASIC Rules, respectively. They are not available for trading by Retail clients.
This article represents the opinion of the Companies operating under the FXOpen brand only. It is not to be construed as an offer, solicitation, or recommendation with respect to products and services provided by the Companies operating under the FXOpen brand, nor is it to be considered financial advice.
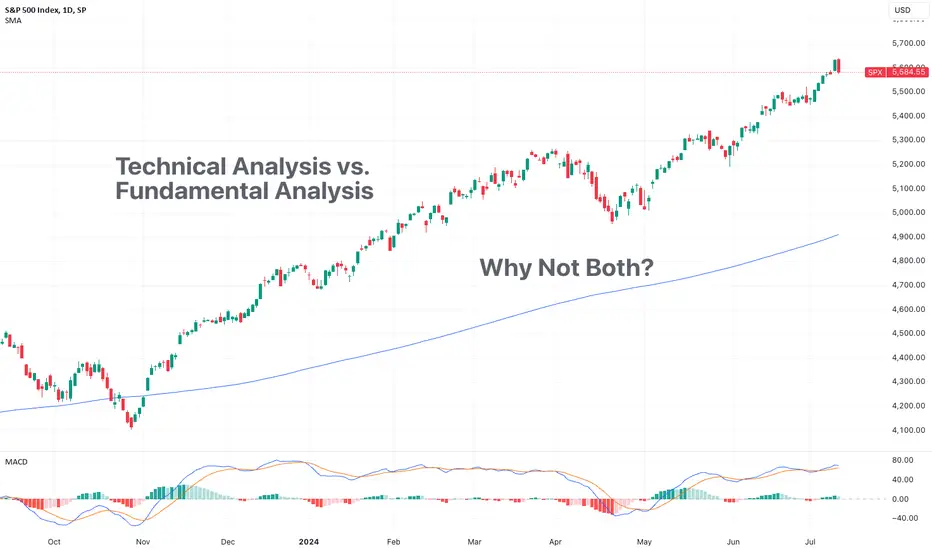
Technical Analysis vs. Fundamental Analysis: Why Not Both?Hey there, fellow traders and market mavens! Ever found yourself staring confused at the screen and not making sense of things that happen in trading?
So you decided to wander off deep into technical analysis shutting out its other half — fundamental analysis? Or vice versa — you digested every economic report that big media outlets churned out and yet failed to factor in some support and resistance levels?
Fear not, for we've got the lowdown on why you don't have to pick sides and go with either the Fibonacci sequence or the latest jobs data . In fact, we're here to tell you why embracing both might just be your secret to trading success. So, grab your charts and financial reports and let's dive into the world where candlesticks meet earnings reports!
Technical Analysis: The Lost Art of Tape Reading
Technical analysis is like the cool, intuitive friend who always seems to know what's going to happen next. It's all about reading the market's mood through price charts, patterns and indicators. Here's why tech analysis should be in your skill set:
Trend Spotting : Ever wished you could predict the next big trend? With moving averages, trend lines and momentum indicators like the MACD, you can ride the waves like a pro surfer and let the market carry your trades into a sea of profits.
Timing is Everything : Candlestick patterns and support/resistance levels are your besties when it comes to perfect timing. The more you study them, the more you elevate your chances of entering and exiting trades with ninja-like precision.
Market Sentiment : Tools like the Relative Strength Index (RSI) and Bollinger Bands give you the scoop on whether the market's feeling overbought, oversold or just right. Learn these if you want to increase the probability of correctly gauging the market’s mood.
But hold up, before you get lost in the charts, let's not forget about the fundamentals.
Fundamental Analysis: Making Sense of Things
If technical analysis is your go-to for instant market vibes, fundamental analysis is the place to figure out why things happened in the first place. Here’s why fundamentals are a big deal and can help you to a) learn what moves markets and b) become fluent in marketspeak and own every trading conversation:
Long-Term Vision : While technical analysis can sometimes feel like guesswork, fundamental analysis is spitting facts. Earnings reports, P/E ratios and economic indicators help you see the bigger picture and educate you into a better, more knowledgeable trader.
Value Hunting : Ever heard of value investing legends like Warren Buffett? They thrive on finding undervalued gems through rigorous fundamental analysis. And, some say, this approach to investing is not reserved for companies only. It works for crypto, too.
Economic Health Check : Understanding GDP growth, interest rates and inflation can feel like having a crystal ball for market trends. And, one big plus is that you’ll become a lot more interesting when you explain things like monetary policy or forward-looking guidance to your uncle at the Thanksgiving table.
The Power Couple: Combining Technical and Fundamental Analysis
Now, here’s the kicker: Why choose one when you can have both? Imagine the synergy when you combine the swift foresightedness of technical analysis with the solid foundation of fundamental analysis. Here’s how to make this dynamic duo work for you:
Double-Check Your Entries and Exits : Use technical analysis for pinpointing your entry and exit points but back it up with fundamental analysis to build a convincing narrative of the asset’s long-term potential.
Confirm the Trend : Spot a promising trend with technical indicators? Validate it with strong fundamentals to make sure it’s not just a flash in the pan.
Risk Management : Technical analysis can help set your stop-loss levels, while fundamental analysis keeps you informed about any potential game-changers in the market.
Diversification : Fundamental analysis might show you the hottest sectors right now, while technical analysis can help you call tops and bottoms if an indicator you trust is showing oversold or overbought levels.
Wrapping Up
So, there you have it, folks! Technical analysis and fundamental analysis don’t have to be opposite camps. Think of them as your dynamic duo, Batman and Robin, peanut butter and jelly — better together. By blending the best of both worlds, you’ll increase your chances of success in trading and do yourself a favor — you’ll get to know a lot and become more interesting!
Ready to take your trading game to the next level? Start combining technical and fundamental analysis and watch as your trading strategies transform into a market-crushing masterpiece. Happy trading and may your profits be ever in your favor!