Need something to learn? ✅Hello,
Let's stop reading the charts for a while and instead learn how to read them.
There are many indicators and strategies which we can use to get better readings and understand the market better.
Under this post, please leave comments and tell us which indicators or strategies you want to know about more.
Which ones are more helpful? Which ones aren't accurate at all?
Let us know the title, and we will publish an educational idea about it.
Thank you.
Community ideas

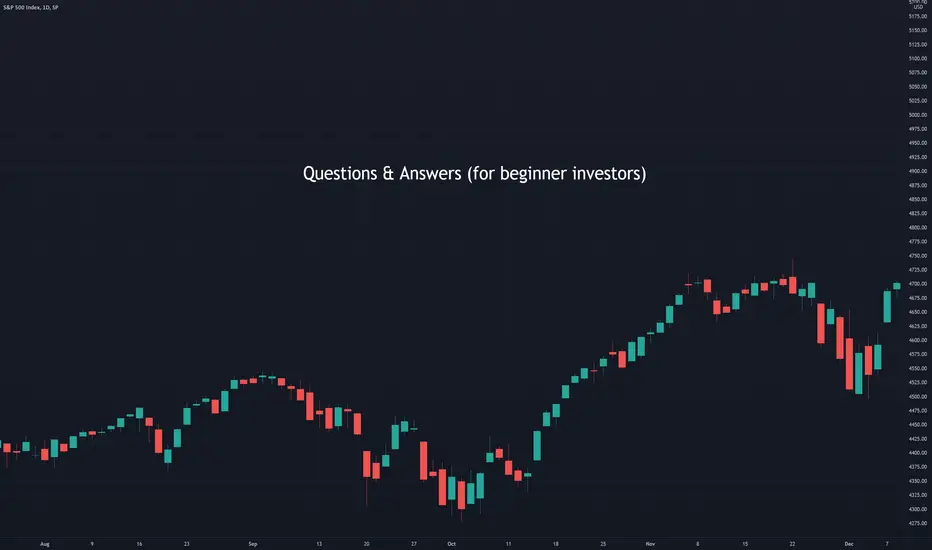
Some important questions & answers (for beginner investors)Today we prepared for you several questions and answers that might be helpful to new investors. Please feel free to post your own questions and answers in the comment section.
What is technical analysis and why does it work?
Technical analysis is a scientific discipline that analyzes investments by evaluating statistical data (usually price and volume). This method works because of fractal nature which represents the ability of same price patterns to appear across multiple different time frames independently. This applies also to patterns observable in oscillators, indexes and other technical tools.
What trading systems are the best performing ones?
Best performing trading systems are trend based. Purpose of such trading systems is to identify the trend and then „ride it“ – which means investing in its early stage and taking profits in its latter stage.
Which time frame is the most reliable?
Generally, bigger time frames are more reliable as opposed to smaller time frames. Though, patterns and trading signals usually take longer to develop when using a bigger time frame. Most common time frames are: 1-hour, 4-hours, daily and weekly.
What is leverage? Is it a really fast way to make money?
Leverage simply represents borrowing money in order to fund an investment. For example, when a trader uses leverage with ratio 1:10 and underlying asset moves by 1% then leveraged asset moves by 10% in the same direction. Leverage is definitely one of the possible ways to generate money fast. However, it is also a quick way to lose money.
Should I use a leverage when I am new (unexperienced) investor?
Use of leverage by new investors is pretty common as it represents an enticing opportunity to make money fast. However, in our opinion, an unexperienced investor should not use leverage at all. That is because leverage is very difficult to manage and its use by an unexperienced trader usually results in loss of capital.
Is it possible to time exact market tops and bottoms?
Timing exact market tops and bottoms is incredibly difficult even for an experienced trader. There are several technical tools at disposal of a technical analyst which he or she can use to indicate market reversal points. However, picking these exact spots is not necessary in order to turn profitable in trading. As mentioned previously, best performing trading systems are trend based. Such trading systems work by identifying trends and by exploiting them (without requirement to identify exact market top or bottom).
What is diversification? Why should I implement it?
Diversification is one of the possible ways to manage risk in the portfolio. It simply stands for diversifying capital into multiple different investments rather than focusing capital in a single investment. Proper diversification protects investor's capital from price fluctuations within particular market sectors. Additionally, it is crucial in order to build a long-term lasting portfolio.
Should I invest in the stock market when it just reached all time high?
Probably not. Usually, the market tends to pull back when it reaches a new all time high. Therefore, in our opinion it is not best to add to the long position just when a new all time high was reached by an asset. One of the best strategies in a strong bull market is to add to the long position when price drops and then sell the position once an asset reaches new all time high.
Should I invest in an asset just because it fell 90% in value recently?
Not necessarily. Fall of such high magnitude does not necessarily mean that the price trend will reverse. There may be various reasons why an asset fell by so much; and therefore, doing your own due diligence is highly advised before entering any trade.
Is past performance of an asset indicative of its future performance?
No. Past performance of an asset should not serve as a basis for predicting future performance of that same asset.
Should I use options/other derivatives as a new trader?
There is no restriction to use options as a new trader but derivatives in general are more complex instruments than stocks or bonds; additionally, their price is determined by numerous factors that an investor should be aware of. If a trader does not fully understand how some asset class behaves, then he or she should avoid such a particular asset class.
Should I keep holding a losing position?
It depends on the investor's own assumption but in general it is better to close positions that keep losing to prevent further losses and to be able to use capital somewhere else.
I feel I haven’t made many trades in the recent past. What should I do?
Trading is not about making enough trades but about generating profit. Sometimes there are not enough opportunities in the market; making too many trades could lead to entering positions that a trader is not fully comfortable with. Also too many trades reduce profit due to trading fees being stacked up. So if a trader can not find another opportunity to make a trade, the best solution is to take a “break” and to keep looking for the next opportunity rather than force himself or herself into trading.
DISCLAIMER: This analysis is not intended to encourage any buying or selling of any particular securities. Furthermore, it should not serve as basis for taking any trade action by individual investor. Your own due dilligence is highly advised before entering trade. This content serves solely educational purposes.
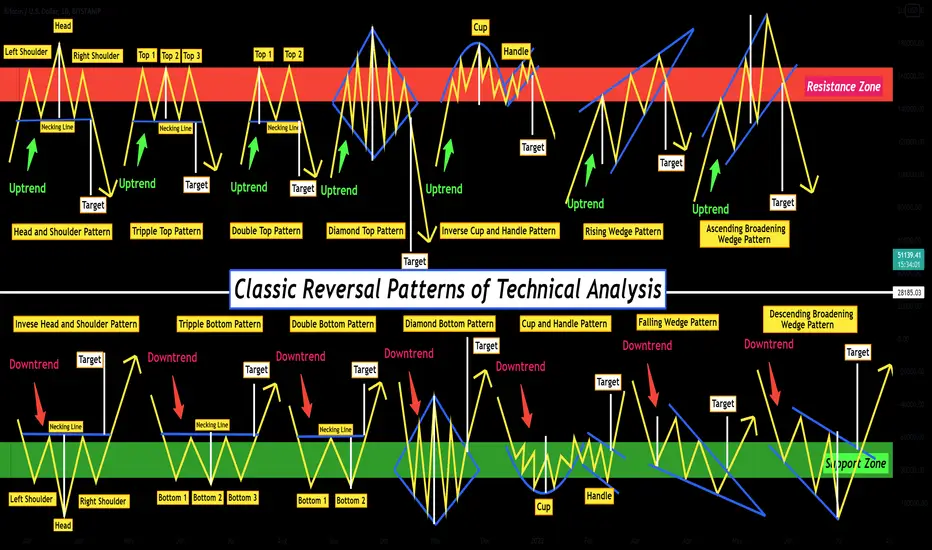
Classic Reversal Patterns of Technical Analysis !!!👨🏫I tried to show you the most important Classic Reversal Patterns of Technical Analysis with their 🎯 Targets 🎯.
Please do not forget the ✅' like '✅ button 🙏😊 & Share it with your friends, Thanks, and Trade safe.
How to capture chart snapshot in tradingview-telegram alert botHello traders,
In the last video we learnt How to create simple web-hook to send alerts to telegram . In this tutorial, we will try to build a bit more on it and to also include chart snapshots along with plain alert messages.
Webhook code is updated in the replit repository here: replit.com
Once, setup, run the repl and capture base URL
⬜ Webhook API
Webhook post request URL format below:
https:///webhook?jsonRequest=&tblfmt;=&chart;=&loginRequired;=
jsonRequest - true/false. Set it to true only if you are sending alerts in the form of json. If set to true and the alert message is not in json format, it will throw error
tblfmt - Values taken from python library tabulate . Defines how to display the json message in tabular format. Applicable only if jsonRequest is true
chart - Chart URL from tradingview for which snapshot need to be captured
loginRequired - true/false. Use this only if you are using a private non shared chart for snapshot or if your chart contains invite only scripts which needs to be shown in the chart snapshot.
⬜ Capturing Chart URL
Note: Make sure you create different chart for different instruments which you are trying to get alert. Also make sure your chart is saved and all the indicators are in palce.
⬜ Testing on postman
⬜ Creating the alert

Who Would You Stake?Hey everyone! 👋
This month, in preperation for the new year, we will be theming our posts around the concept of building a solid trading plan!
Later posts in December will look at the key elements involved in building a rock-solid game plan, but today, to introduce the concepts in a fun way, we will be looking at a completely hypothetical situation.
-
Let’s say that you’re walking down the street, and a stranger approaches you with a business proposal; he’s recently sold his business, and come into a significant amount of capital - $10,000,000. Additionally, word of the sale has gotten to two separate aspiring traders, who have approached him asking him if they can manage his money in return for a fee.
The stranger has heard from a family friend that you’re interested in trading, and he wants your help in picking out which trader to invest the money in. In return for your help, He’s going to split the profits he makes 50-50 with you.
Obviously, it’s in your best interest to help him make a decision that will make the most money for the longest period of time, with the least amount of risk.
The stranger then pulls out contact information for both traders, and asks you to interview them separately.
-
Here's our question to you: if you only get to ask the traders three questions to gauge their likely future performance, what would you ask them? What questions dive to the heart of risk, reward, and sustainability?
We look forward to your replies, and in next week's post, we will begin looking at how some of the likely responses can go towards building out a consistent, profitable process!
- Team TradingView
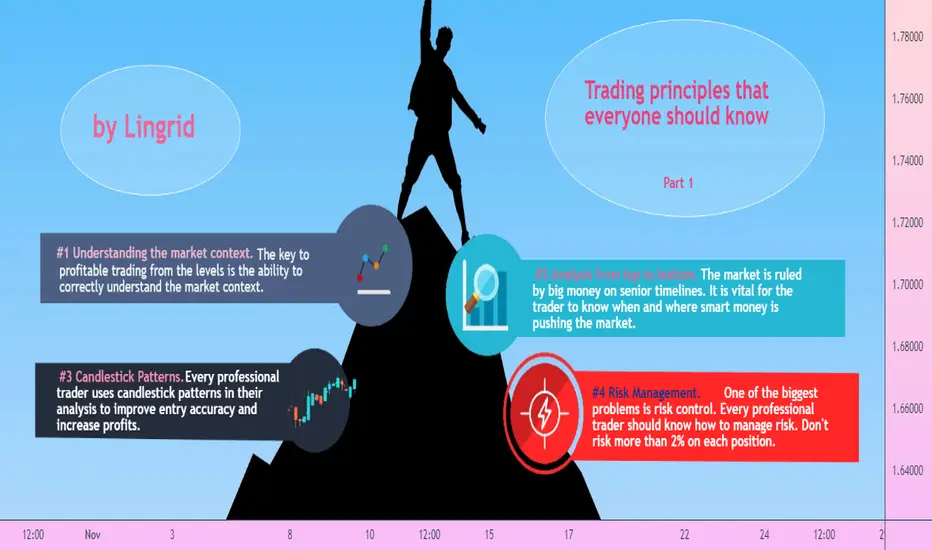
TRADING PRINCIPLES THAT EVERYONE SHOULD KNOW. PART 1.Hello traders!
For a long time, the Forex market has created a large number of trading methods.
Finding your strategy that suits you specifically is one of the main steps in achieving success in the Forex market.
And it is worth remembering that successful traders do not use anything magical in their trading. Everything has been invented for a long time for both a novice trader and a successful trader.
The main task of beginners is to choose a fairly easy strategy and strictly follow its principles and rules.
So what does a beginner need to know in order to trade profitably?
Price levels.
It is difficult for a beginner to determine price levels and trade them correctly.
There are no specific rules in this topic, since the price does not draw clear points, but forms zones.
Many traders use support and resistance levels in their trading and for beginners, the main task at the beginning of the journey will be the concept of selling from resistance and buying from support.
There are three types of trading systems based on price levels.
1. If the price moves within the framework of a sideways movement, the trader can sell from resistance and buy from support.
2. If there is a prevailing trend in the market, for example, bearish, a trader can sell from resistance and expect support to break through.
3. The same rules work in the bull market, only in a different direction. If the price breaks through the resistance, then this zone becomes a support from which you can buy.
Consider the principles of trading from price levels.
#1 Understanding the market context.
The key to profitable trading from the levels is the ability to correctly understand the market context.
Bearish pressure leads the market movement through an impulse movement that breaks through support and creates new lows – in this context, selling strategies will not work well.
That is why it is so important to follow the concept of the market context:
When the market falls, creating new highs and lows, we are talking about an impulsive bearish context.
The correction is created by an impulse that is weaker than the main trend.
A sideways movement occurs when both demand and supply are approximately equal and the price cannot move in a certain direction.
As soon as the bulls or bears take over, the price will make an impulse in the direction of the strong side.
#2 Top-Down Analysis
The market is ruled by big money, which pays great importance to large timelines.
And it is vital for an ordinary trader to know where smart money is pushing the market.
To do this, it is worth noting strong levels on the monthly-weekly-daily timeframes in order to know exactly where the price is most likely to rebound.
On the other hand, if the price is above the key levels, then the market is bullish.
#3 Candlestick Patterns
Almost every trader uses candlestick patterns in his analysis, which are a very strong analysis tool.
Reversal candlestick patterns create an excellent opportunity to enter a trend reversal.
The higher the timeframe on which the pattern was formed, the stronger its signal will be.
Knowing candlestick formations is a very important part of a trader's professional growth.
#4 Risk Management
Any trader should be aware of the risks and be able to control them.
Although this topic goes beyond the definition of the market context, it is still very important.
There are many ways to control risks.
An important rule is to set a stop loss and risk in each position, as recommended, no more than 2% percent.
Hedge fund managers risk an even smaller percentage in each transaction, sometimes 1% or even lower.
It is better to grow slowly than to fall quickly.
If you lose 2% of the capital, in the next transaction, in order to get your money back, you will already need to make 4%, which in general is not difficult to do.
But if you lose 50%, you will need to make 100% profit already, which is almost unrealistic.
Conclusions
Summarizing the above, you can make the following sequence of actions:
Identify the key support and resistance levels.
Wait for the candle to form in the desired direction.
Stop loss above or below the candlestick pattern.
Take profit is placed at the following support or resistance levels.
Always make sure to use proper money management for each trade, and never take on a risk that exceeds the return.
Traders, if you liked this idea or if you have your own opinion about it, write in the comments. I will be glad 👩💻
RSI (The relative strength index)Hello, Let us talk about 'RSI.'
On this chart: We will read about who developed it, how it works, and how it helps us.
Those who read the book called 'New Concepts in Technical Trading Systems' know that RSI was developed by J. Welles Wilder Jr. and published in 1978.
Who is J. Welles Wilder?
He is the creator of several technical indicators that are currently the leading indicators in technical analysis software. These indicators include the Average True Range, the RSI, the Average Directional Index, and the Parabolic SAR.
Let us get to RSI:
The relative strength index is a technical indicator of the analysis used in financial markets. The relative strength index of the share of internal energy of the share to move upwards or fall due to lack of necessary energy.
A tangible example is a basketball. If we drop it from above, in multiple collisions with the ground, it will be at a lower altitude each time and eventually land on the ground.
This index has the property of moving averages. It needs the desired period and point number (close, open, and such) to calculate. The big difference is that the mechanism of all moving averages is a sequential and delayed instrument. However, the RSI is an instrument based on moving averages. It is a leading indicator, and this is due to the existence of two levels of support and resistance in the oscillator. When the indicator (line of movement) reaches these levels, analytical signals are issued.
If we are trying to identify Oversold and Overbought conditions, our best options would be Stochastic and RSI.
RSI is scaled from 0 to 100.
The readings above 70 show an overbought condition, and the readings below 30 show an oversold condition.
When we say overbought or oversold, we are pointing out to the face that the market value might reverse. That is why frequently in overbought scenarios, we obverse a fall, and in oversold scenarios, we can expect a rise in the market value.
Keep in mind that some traders prefer using 20 and 80 instead of 30 and 70. They claim this method reduces the chances of errors and gives more accuracy.
If the readings are moving above the 50 (center), then we can expect a rising trend, and when the readings are showing a move below the center, we can expect a falling trend.
We can also use this key indicator to identify potential bottoms and tops in the market. That is why it is a great tool to help with confirming trend formations. If we look at a chart and think we see a bullish or bearish trend, always check the RSI. See if it is above the center or below it. Check for the overbought and oversold situation. This method can reduce our chart reading and trading errors.
How accurate is it?
Accurate return signals are rare and difficult to distinguish from false alarms. For example, a false positive is an uptrend and a sudden drop in stocks. A false negative is a situation where there is a bearish cross, but the stock suddenly accelerates upwards. Because this indicator shows moving momentum, when an asset has significant acceleration in any direction, it can stay in an overbought or an oversold condition for a long while. Therefore, the RSI is beneficial in volatile markets where the price of assets alternates between uptrends and downtrends.
Suppose you are interested in using this great indicator. In that case, you can go on your TradingView chart and the dashboard, click on 'Indicators & Strategies' and search for RSI and find the best one suited for you.
Have you ever used this indicator? What do you think the pros and cons are?
Let us know your ideas.
Good luck.

Going With The Herd - Part 5/5I follow a technomental analytic approach to the commodities markets in a quest to determine the path of least resistance of prices. Each piece of a market’s structure provides a clue. When assembled, a picture tends to emerge, increasing the odds of success for long or short positions.
The last in the series- We looked at the other components of market structure
Fundamentals versus technicals
The wisdom of the crowd
Trend following indicators establish support and resistance levels
The trend is your greatest friend in markets- Prices tend to rise or fall to unforeseen levels that defy logic
Market structure deals with each commodity’s supply and demand fundamentals. Each market has idiosyncratic characteristics as production locations are in areas where the earth’s crust is rich in reserves or the climate supports crop growth. Consumption is ubiquitous as people worldwide depend on raw materials to power their lives, provide shelter and nutrition. Fundamentals are a substantial part of the analytical equation, but crowd behavior is equally important. The saying, “the trend is your friend,” is critical as when buyers are more aggressive, prices rise, and when sellers dominate, they decline.
Therefore, technical analysis is a crucial tool that enhances the clarity of a picture created by the various market structure pieces.
The last in the series- We looked at the other components of market structure
In past articles, we looked at how term structure or the price differentials between delivery periods can offer clues about the supply and demand equation in commodity markets. We examined processing, quality, location, and substitution spreads which provide more insight into the path of least resistance of prices.
The market structure components are puzzle pieces dealing with fundamentals. Many variables can push commodity prices higher or lower. The spreads and differentials that determine the overall market structure are a microeconomic approach to analysis. While they provide critical information, it is incomplete without taking the technical state of a market into account. Market structure deals with endogenous factors on the microeconomic side. Technical analysis tends to incorporate the market’s interpretation of macroeconomic factors.
Fundamentals versus technicals
Fundamental and technical analysis are not mutually exclusive; they can be complementary. In commodity markets, as in all markets, there are cycles. Understanding the history of cyclical behavior can help predict the future. Fortunately, you do not have to pour over thousands of pages of prices and data. All the data required for technical analysis are contained in one picture—a price chart.
Fundamental analysis examines numerous aspects of an individual commodity market, while technical analysis studies past and current price action in futures contracts.
The wisdom of the crowd
In his 2004 book, The Wisdom of Crowds, author James Surowiecki explained “why the many are smarter than the few and how collective wisdom shapes business, economies, societies and nations” through a series of case studies. The book applies to the commodity markets as a price chart is a track record of collective wisdom.
Prices move higher when buyers are more aggressive than sellers. They fall when sellers dominate buyers.
Trend following indicators establish support and resistance levels
Many technical indicators and price patterns reflect the crowd’s wisdom. Support levels are below the current price. They are levels where technical analysts believe that buyers will outnumber sellers. Resistance levels are above the current price. They are levels where technicians believe sellers will outnumber buyers. These beliefs often lead to a self-fulfilling prophecy as technical analysts sell near resistance and buy near support.
Bullish or bearish trends do not last forever as markets rarely move in straight lines. Short-term traders watch very short-term, often intraday, charts. Longer-term technical traders and investors watch daily, weekly, monthly, or longer-term charts.
Price momentum and trend strength are two critical components of technical analysis. A stochastic oscillator quantifies the momentum of a price rise or decline. They compare closing prices for a stated period with price ranges over time. The theory behind stochastics is prices tend to close near the highs in rising markets and the lows in falling markets. A reading below 20 indicates an oversold condition, while a reading above 80 points to an overbought condition.
The daily CBOT wheat chart shows that overbought conditions lead to price corrections while oversold conditions lead to rallies. However, a market can remain in overbought or oversold territory for extended periods. When the stochastic reaches an overbought or oversold condition, the price action tends to run out of upside or downside steam, leading to a reversal.
The relative strength indicator compares recent gains and losses in a market to establish overbought or oversold conditions. An RSI below 30 indicates an oversold condition, while a reading over the 70 level indicates that a market is in overbought territory.
The daily chart of NYMEX crude oil futures shows the decline in the RSI to below 30 in late August 2021 led to a reversal and price rally. While the indicator remained above the 70 level from late September through late October, it eventually ran out of upside steam, leading to a price correction in November. On November 26, 2021, crude oil experienced the most significant decline since April 2020. The RSI fell to an oversold condition. We will find out over the coming days and weeks if the decline leads to a bottom with the technical metric in oversold territory.
These technical indicators reflect price action only. They ignore all of the noise that can lead to emotional impulses. Technicians use stochastics, Bollinger bands (which highlight support and resistance levels), RSI, and many other technical tools, for any time frame ranging from minute-to-minute to very long-term horizons.
Technical analysis is far from perfect, but it adds another dimension and creates another puzzle piece for determining the path of least resistance for prices in markets across all asset classes.
The trend is your greatest friend in markets- Prices tend to rise or fall to unforeseen levels that defy logic
The old saying that “the trend is your friend” reflects an acceptance that crowds make better decisions than individuals. Trends are an integral part of investing and trading calculus. Ignore trends at your peril as going against conventional wisdom is one of the leading causes of losses. Markets often move to extremes and remain irrational for far longer than most market participants can stay solvent. Commodities are highly volatile assets. Price variance can lead to wild swings to highs and lows. In April 2020, crude oil fell to negative $40.32 per barrel in a bearish frenzy. In May 2021, lumber futures rose to over $1700 per 1,000 board feet as bullish price action pushed the price to an irrational and unsustainable level. However, crude oil at zero was illogical, as was lumber at $1,000. Market participants that did not respect the trend suffered financial distress.
Trends often carry prices to price levels on the up or downside that defy logic, reason, and rational analysis. Following and respecting trends often saves a trader or investor from catastrophic losses. We never attempt to pick a top or bottom in any market because we respect the crowd’s wisdom. However, when the trend bends, we adjust our risk positions accordingly.
Finally, discipline is what defines success in markets. Remember, a professional baseball player needs a 0.300 batting average to make it into the Hall of Fame. That average means they make an out two out of every three trips to the plate. Trading and investing are similar. Many of the most successful traders call the market wrong more than half the time. However, those that approach markets with a risk-reward plan and stick to it improve their chances of success. Following trends allows profits to run. It also is self-correcting as it causes a market participant to reevaluate and close losing risk positions, before they cause severe financial damage.
One of the leading causes of losses is allowing a short-term trade to become a long-term investment because the price moves contrary to a forecast. Trend following is a tool that helps to correct as it validates or refutes an original thesis.
Respecting the crowd’s wisdom is an integral part of traders and investing and goes hand in hand with the puzzle pieces of a market’s structure.
--
Use the link below to sign up for the Monday Night Strategy Call. You can use the other link provided below to get early access to the full articles and more for free.
Trading advice given in this communication, if any, is based on information taken from trades and statistical services and other sources that we believe are reliable. The author does not guarantee that such information is accurate or complete and it should not be relied upon as such. Trading advice reflects the author’s good faith judgment at a specific time and is subject to change without notice. There is no guarantee that the advice the author provides will result in profitable trades. There is risk of loss in all futures and options trading. Any investment involves substantial risks, including, but not limited to, pricing volatility, inadequate liquidity, and the potential complete loss of principal. This article does not in any way constitute an offer or solicitation of an offer to buy or sell any investment, security, or commodity discussed herein, or any security in any jurisdiction in which such an offer would be unlawful under the securities laws of such jurisdiction.

What Did You Learn About Trading This Year?Let’s face it, 2021 has been a crazy year. Between the meme stock mania, the exponential growth of cryptocurrencies, and the NFT flipping craze we have seen over the last few months, it’s been a year of unprecedented moves. And, when unexpected things happen, everyone tends to learn new things - about risk, about themselves, and about the world around them.
To celebrate our awesome community (which has also grown exponentially this year!) we’re giving 5 people who enter the contest below the chance to win hyper-exclusive prints we commissioned from British artist Gordon Ellis-Brown.
All you have to do to enter our randomized draw is comment below with the biggest lesson you learned this year, and how you plan on using it to improve your trading in 2022.
Entries will close Tuesday, November 30th at 10am ET, and the winners will be announced shortly thereafter.
If you follow our social channels, you will have no doubt seen us giving these prints away all last week as a way of celebrating our Black Friday and Cyber Monday sales, but we also want to make sure that everyone here has a chance to win.
Good luck to everyone, and thank you all for making this community so special; it wouldn’t be the same without you :)
-Team TradingView

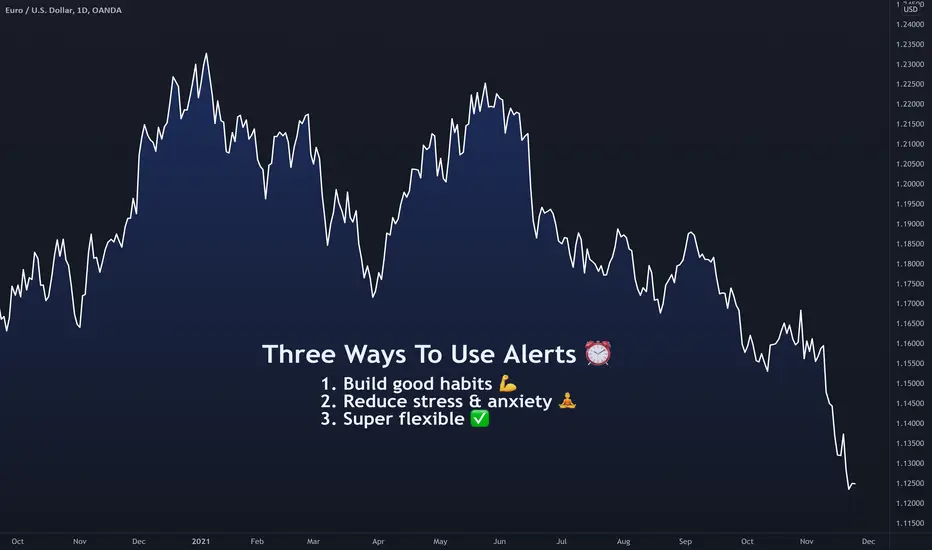
Three Ways To Master AlertsHey Everyone! 👋
We hope you’re enjoying Black Friday week, and have helped yourself to some of the great discounts we are offering over the next few days. We only do this once a year, so it really is the best time to get a plan!
Now, let’s jump into today’s topic: Alerts.
While alerts have a ton of potential applications when it comes to trading, they are often underutilized because it can take some time and ingenuity to build a system where they can work well. Let’s get started:
1. They can help build good habits 💪
Stop us if this sounds familiar: you hear an awesome investment story, and then immediately go out on the market and purchase the asset, with no plan in place.
While this can work, it’s not a great strategy for long term success, because in reality it can be extremely hard to sit in that position without a plan and trade it efficiently. You may choose to exit the position based on nothing more than momentary greed or fear, and moves like that can prevent consistency and long term profitability.
Alerts are great because they can take out the guesswork of entering and exiting a position. Simply set alerts for the prices you would like, then place a trade if, and only if, the conditions are met. Then, let the market do its thing, and let the probabilities work in your favor.
Alerts can turn the experience of trading from a constant search for ideas - and always feeling behind - into a relaxing job of waiting for your own pre-approved conditions to trigger before taking action. In short, alerts can make you much more well prepared for the market’s ups and downs.
2. They increase freedom and reduce anxiety 🧘
There is a well known maxim in trading and in life that states that negative emotions are felt twice as strongly as positive emotions. This factoid has lots of applications, but it can be especially useful to understand as a trader.
Consider the following investors:
A dentist who checks quarterly reports from his brokerage
A position trader who checks his positions once a month
A swing trader who checks his positions once a week
A Day trader who checks his positions once a day, if not more
Given the natural volatility that markets experience, which market participant is least likely to be mad or upset? The dentist. Why? Because he is receiving less data points from the market. Even world class day traders are exposed to tens or hundreds of negative situations in their positions on a day to day basis as a result of volatility, which they cannot control. This level of negative stimulation can reduce mental health and trading effectiveness.
Alerts allow well prepared traders with some edge to step back from the markets and allow the trades to come to them.
3. Our alerts don’t let anything fall through the cracks ✅
While the previous two points are benefits when it comes to price alerts, our alerts also step the game up considerably when it comes to user utility. Once you have setups that you like to trade, you can set alerts on trendlines, technical indicators, customizable scripts, and so much more, so you can ensure that your favorite setups aren’t being missed.
This can be as simple as a long term investor setting RSI alerts on Dow 30 stocks, in order to buy dips in strong names, to as complex as an intraday futures spread scalper setting alerts for pricing inefficiencies within his top 40 contracts.
Our customizable alerts can really allow well organized traders to capture every opportunity as they see fit.
Thanks for reading, and stay well!
TradingView Team
How to create simple web-hook to send alerts to TelegramHello Traders,
In this video, I have demonstrated how to create a simple web-hook which can send your Tradingview alerts to Telegram channel or group for zero cost.
⬜ Tools Used
▶ Telegram Messenger
▶ Replit - Cloud platform for hosting small programs
▶ Postman - To test web-hooks before going live (Optional)
▶ Cronjob - To set health-check and keep bot alive
⬜ Steps
▶ Create Telegram Bot
Find BotFather and issue command /newbot
Provide bot name
Provide bot username - which should be unique and end with _bot
Once bot is created, you will get a message with token access key in it. Store the token access key.
▶ Prepare Telegram Channel
Create new telegram channel
Add the bot @username_to_id_bot to it as admin and issue /start to find chat id
Store the chat id and dismiss @username_to_id_bot from channel
Find the bot created in previous step using bot username and add it to channel as admin
▶ Setup replit
Create a free Replit account if you do not have it already.
Fork the repl - Tradingview-Telegram-Bot to your space and give a name of your choice.
Set environment variables - TOKEN and CHANNEL which are acquired from previous steps.
Run the REPL
▶ Test with postman
Use the URL on repl and create web-hook post request URL by adding /webhook to it.
Create post request on postman and send it.
You can see that messages sent via postman appearing in your telegram channel.
append ?jsonRequest=true if you are using json output from alerts.
Json request example:
▶ Set alerts from tradingview to web-hook
Use web-hook option and enter the webhook tested from postman in the web-hook URL
And that's all, the webhook for Telegram Alerts is ready!!
Thanks for watching. Hope you enjoyed the video and learned from it :)
PS: I have made use of extracts from the open github repo: github.com

Which currency pairs benefited from financial crisis 2007-2008The stock market has been rising in spite of the covid pandemic. Even before that, some well-known names were predicting a huge cruse with Peter Schiff republishing his same old book every year for some time now. Anyway, many of us agree, that there is something wrong with the markets and even more reputable managers predict a crash. It is, therefore, a good idea to look where the money tends to go should that happen.
Forex is a central point of the financial markets. Bonds, stocks, and commodities each is denominated in a currency. Buying the right asset from the right asset class is great. Buying it with the right currency is even greater ☺
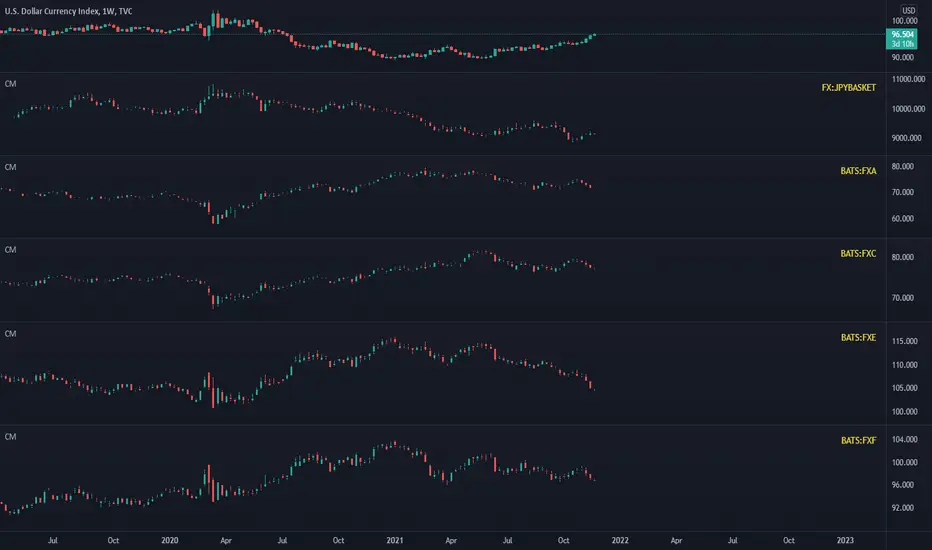
One of the winners is clearly an American Dollar. I will leave it in all the following charts. After a long downtrend, the crisis put a halt to that and in 130 days, 860 days worth of losing the value was recovered. Of course, such rapid growth in currency value must have made exports difficult, so I assume there must have been some major intervention and the downtrend resumed after a beautiful double top.
(the chart below dollar is SP500 as another anchor for our analysis)
Then, there are two losers in this chart. It is important to mention two things. First, the charts present futures as the other indexes don't go as far. Second, a weak currency doesn't mean the country handled the crisis poorly. But as far as currencies go, AUD and EUR did perform rather poorly. // I think this is likely to be a repeated behavior. AUD is still a commodity currency and EUR pegs diverse economies to each other. This raises a question about stability as successful currencies require political and economical union too.
Oil currencies such as NOK or CAD seem to also have dropped. I added Oil chart at the bottom. // I do think that this is likely to repeat with NOK, but not necessarily with CAD. Although the CAD is another commodity currency, it is perceived as safer to some degree. At least as far as I know.
(could not find reliable NOK index)
When it comes to currencies generally perceived as safe, Yen performed nicely and has risen more than 25% measuring from the lowest low between 2008 to the nearest significant top. The pair USDJPY was sideways-ish before the years 2007-2008 but is clearly downward-slope as Yen somewhat outperforms US Dollar. The same can't be said about the Swiss Franc which has only woken up after the dollar started to reverse. You can point out several weekly candles when the investors were rushing from the dollar and buying CHF in exchange in these times. // I think a Yen will express similar behavior. I am not sure what to make of CHF which is backed by gold more than other currencies and the gold has already risen quite high.
I will leave it here without further interpretation, but I am looking forward to discussion if there is one, and I will make a few more similar posts in the future if this one becomes any popular.
It's Here.We’re on a mission to give the world the best tools, data, and charts to make better decisions, while making it as affordable as possible for everyone - no matter where you are.
This week, we turn on the turbo boosters. Our destination: Mars.
Get ready for our epic week of Black Friday discounts.
The countdown starts now: Get your Black Friday deal
Join us for the journey.

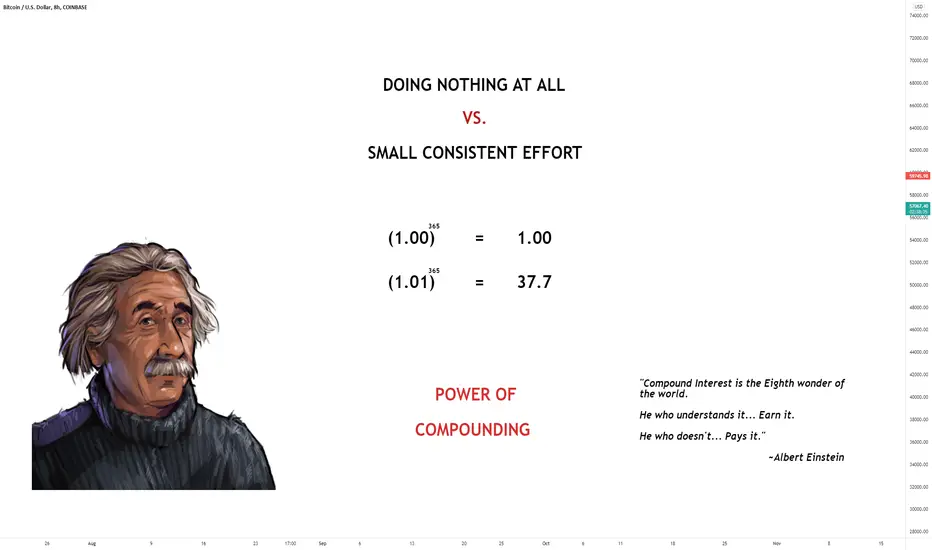
Power of Small Consistent EffortsHello Traders, 👋
Today I would love to talk all about the power of putting in small consistent efforts. Furthermore discuss the power of compounding and compound interest.
Putting in small consistent effort is ideal for anyone, regardless of experience.
Whether you are new to trading, trade forex, trade crypto or even want to find a new hobby 🏑🏓🎺🎸
1.00
The first equation is simply the number 1 raised to the power 365.
The power 365 simply means 1 x 1 x 1 x 1 etc... 365 times. Anything multiplied by 1 remains unchanged, so the result is 1.
But what happens if we add 1% to that?
1.01
1% bigger than 1 is 1.01.
So if we take 1.01 and we raise that to the power 365 — so in other words, we multiply 1.01 x 1.01 x 1.01 x 1.01 etc... 365 times. You will be surprised that it equals 37.8 notice that this is almost 37 times bigger than the answer to the first equation above! 🤯
This is the result you’d get if you “did just 1% more than usual”.
The difference in effort is just 1% a day, it’s tiny!
If you can work on your trading 1% more than you are currently doing, every day. You will end up with a considerable amount of impact from that work.
Whereas if you don’t do that little bit extra every day, you will be making zero progress and contain the same knowledge as you did a year ago, maybe less.
Little steps, done consistently time and time again, compound into big, big differences. And not taking those little steps, makes the effect almost disappear.
"Compound Interest is the Eighth wonder of
the world.
He who understands it... Earn it.
He who doesn't... Pays it."
~Albert Einstein
In simple terms compound interest is earning interest on your interest.
For example
If you was trading with $1000 and you made on average 10% per month, you would reinvest your earnings each month to make interest on them. This is called compound interest.
+++++++++++++ Profit/Interest
Month 1 $1100 +$100
Month 2 $1210 +$110
Month 3 $1331 +$121
Month 4 $1464 +$133.1
As you can see each month your profit is increasing. This is because you are making profit on your profit.
The earlier you start compound interest the better. This is something millennials should learn in school!
I know most people want to jump on the million dollar deal and get rich quick.
But if you took a single penny and doubled it everyday, by day 30, you would have $5,368,709.12.
However, it's important to note that it's all about the power of doubling. If you asked the same question, but changed the doubling time to just 27 days, you would only have $671,088.64
If you are struggling on your trading journey, do not give up!
****The first step of every successful Trader : FAILURE****
Do not let a little failure scare you away from being consistent.
Thanks for taking the time to read my post! 💖
Please check out my other trade ideas!
🐱🏍🐱🏍🐱🏍
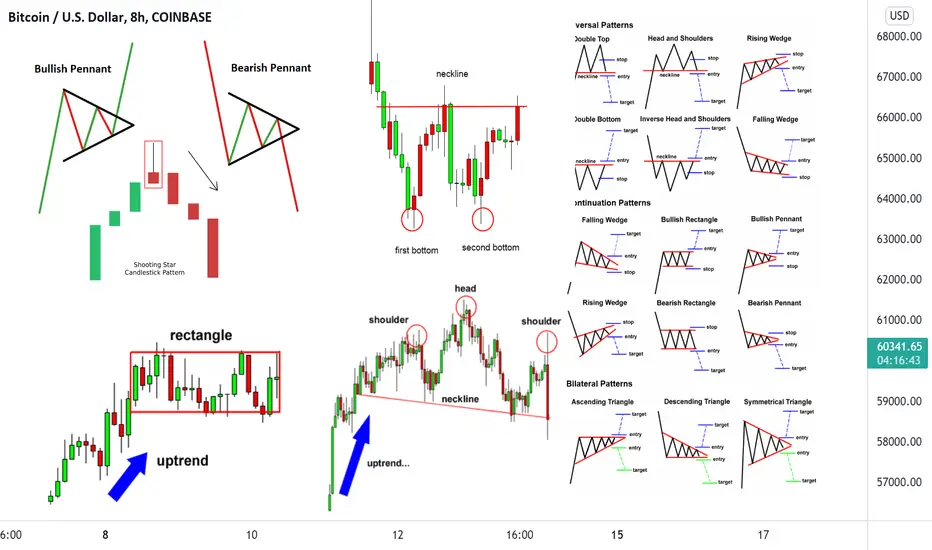
Reversal Patterns & ContinuationHello Traders,
Today I would like to talk all about the different types of reversal patterns & continuation patterns, this can be whether you are a swing trader or a day trader we all must look for signals such as these as they are solid confirmations for our trading ideas.
Forex reversal patterns are on chart formations which help in forecasting high probability reversal zones. These could be in the form of a single candle, or a group of candles lined up in a specific shape.
Types of Reversal Chart Patterns
There are two basic types of trend reversal patterns; the bearish reversal pattern and the bullish reversal pattern.
The Bullish reversal pattern forecasts that the current bearish move will be reversed into a bullish direction.
The Bearish reversal pattern forecasts that the current bullish move will be reversed into a bearish direction.
Double Top and Double Bottom
We will start with the Double Top reversal chart pattern. The pattern consists of two tops on the price chart. These tops are either located on the same resistance level, or the second top is a bit lower. The double top pattern typically looks like the letter “M”.
The Double Top has its opposite, called the Double Bottom. This pattern consists of two bottoms, which are either located on the same support level, or the second bottom is a bit higher. The double bottom pattern typically looks like the letter “W”.
Head and Shoulders
The Head and Shoulders pattern is a very interesting and unique reversal figure. The shape of the pattern is aptly named because it actually resembles a head with two shoulders.
The pattern forms during a bullish trend and creates a top – the first shoulder. After a correction, the price action creates a higher top – the head. After another correction, the price creates a third top, which is lower than the head – the second shoulder. So we have two shoulders and a head in the middle.
Of course, the Head and Shoulders reversal pattern has its inverted equivalent, which turns bearish trends into bullish. This pattern is referred to as an Inverted Head and Shoulders pattern.
Overall
Reversal patterns are a key part in trading and especially useful for confirmations in your trade ideas. You may not always find reversal patterns but when you do you will know the best possible entries!
Thanks for taking the time to read my post!
Please check out my other trade ideas!
😆😂😆😂😆😂😆😂
Trend Following Without PriceHello everyone!
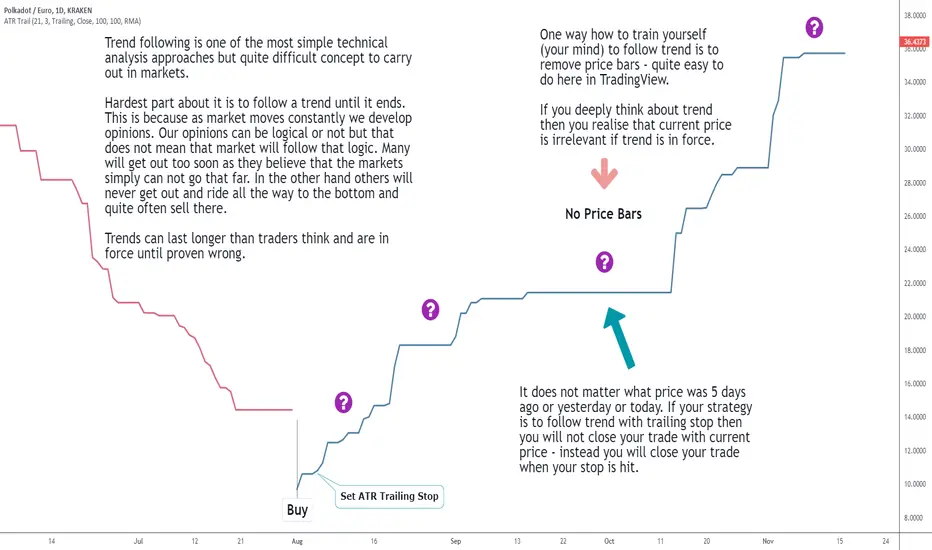
Trend following is one of the most simple technical analysis approaches but quite difficult concept to carry out in markets.
Hardest part about it is to follow a trend until it ends. Following trend is just like standing outside and waiting when it will start raining.
You know that at some point it is going to start to rain but you don't know when it precisely happens and how wet will you get.
One good way to train patience and discipline to calmly follow trend is to remove all price data from charts. To understand logic behind that
trader must understand that until trend is in force it's not important what current price is. It's not important what it was 2 weeks ago as well it's
not important what price is tomorrow - until trend continues. Trader will sell only when by his/her definition trend is over i.e. sell signal is
triggered.
This is educational post and if somebody want's to try it then go ahead. I am not saying that you should always follow trend blindly. There are different
styles within trend following like scaling in & scaling out; different methods how to trail stops etc. where checking price data is necessary.
I am just pointing out one way how to train yourself if you feel some anxiety or feel stress holding positions and always want to cash out.
I added second identical chart with revealed price data and feel free to compare them and see how these charts look different.
Thanks and enjoy your trading :)
Why Do You Need a Trading Journal? 📝
Hey traders,
📖 Trading Journal is a crucial element in your trading education.
Even though the majority tends to neglect it, in fact, it is considered to be the essential part of a daily routine of a professional trader.
In this post, we will discuss why you should keep a trading journal & how it enhances your trading performance.
Let's start with the obvious:
✍️ Trading journal is applied for recording your trading positions:
winning and losing ones.
With that, you can monitor your current performance, identify the mistakes that were made and examine your decisions.
❌ Analyzing the errors you learn your weaknesses & the situations when it is preferable not to trade. You adjust your trading strategy accordingly in order to avoid similar mistakes in future.
💪 Examining the winning trades you learn about your strengths.
You identify the trading instruments, the trading setups where your strategy reaches the highest accuracy.
⚖️ Working with the numbers you can measure your investing exposure and calculate your account drawdowns. You can analyze your losing streaks & your long-term/mid-term/short-term account statistics.
📈 Analyzing the figures you can measure your progress over time by comparing your current results with the old ones.
😡 Keeping the record of your emotions, you can measure & quantify the psychological element of your trading. You may calculate the percentage of emotional decisions being made and their effect.
🌟 Consistent journaling makes you disciplined. It teaches you to strictly follow the rules of your trading plan & constantly learn from your mistakes in order to hasten the path towards a more disciplined and profitable trading career.
A trading journal should be simple and tailored to your specific trading style and the goals you would like to achieve.
I hope that my words will inspire you to keep a trading journal!
Do you have the one already?
❤️Please, support this idea with like and comment!❤️

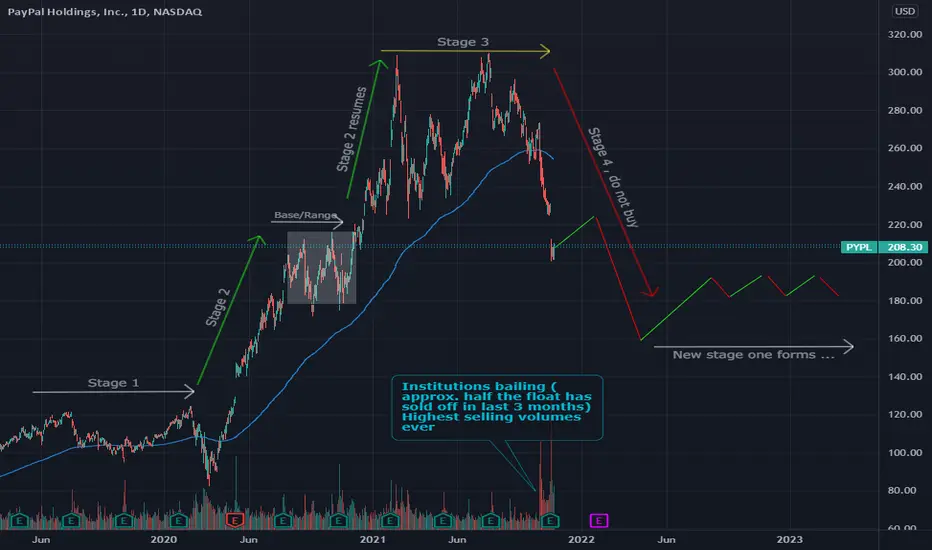
PYPL - Quick breakdown Using Mark Minervini's stage analysisThis is just a quick analysis that I did up using Mark Minervinni's stage analysis , Looks like a perfect example of a stock that achieved super performance that now is entering the final stage , which is stage 4.
If you have not read Marks books , I highly suggest picking them up , the best of the bunch in my opinion is his " How to trade like a stock market wizard " . Very valuable resource to any traders knowledge base .
One of the most important concepts from Marks book for me was the stage analysis. It's very useful and fairly easy to identify and asses if you know what you are looking for . The logic is that there are 4 stages of a stocks cycle , this is arguably true for most stocks. Even if stocks are not super-preformers, which Mark's book especially focuses on identifying, they will still often follow these 4 stages of movements.
The 4 stages are as follows :
Stage 1 is the neglect phase or "consolidation"
Stage 2 is the advancing stage or "accumulation"
Stage 3 is the Toping phase or "distribution"
Stage 4 is the declining phase or "capitulation"
The Stage 4 or Capitulation phase , which I believe PYPL is currently in , is always accompanied with massive selling volumes , this is very much because institution's have changed their view on the future of the company and decided to stop buying and supporting the share price's advancement . If you look at the monthly charts volumes, the last three months have been predominantly selling with a total volume around 580 Million , which is about half of the float . Obviously there is some brave bulls in this volume still buying but I think that there is a good possibly that around 70 % of that volume will be institution's selling .
Eventually , many stocks do recover from capitulation like this but there is often a second leg down and a longer term stage one will quite often be required to, once again, enter the advancing stage ( Stage 2) . Sometimes, this becomes year's and sometimes the stocks never do come back . I think that once we see a stage 4 setup like this , then we should wait for a stage one to form before considering a long and still a stage 2 or a breakout of a base is a much better setup .
It's important to recognize what stage a stock is currently exhibiting to increase the probability of your long setups and this is probably one to stay away from at this time , perhaps an ok day trader depending on your style but not a safe swing trade or investment at this time .
Just an opinion and the purpose of this posting is simply to share some of the basics of Mark's stage analysis .I want to mention also that Mark's stage analysis method is also very much in line with Stan Weinstein's book as well , which is titled "Secrets for profiting in bull and bear markets ". Stan's book is right up there with Mark's too, hard to pick a favorite of the two to be honest because they both are wonderful and have taught me very important lessons.
One last note , often after a large move up , stocks need some time to digest and thus will form a base , this is similar to a stage 3 much tighter . The best super-preformance stocks do not usually build more than 6 bases during its stage 2 cycle , 4-5 is more common though before stage 3 eventually sets in. Stage 3 has some similar traits to a base but is typically wider and looser price action . Also, although using stage analysis like this helps us to make assessment's of a stocks health anything can happen in the markets , as always . This is just a tiny part of what Mark's books have to offer and he has much more in depth explanation's of it too.
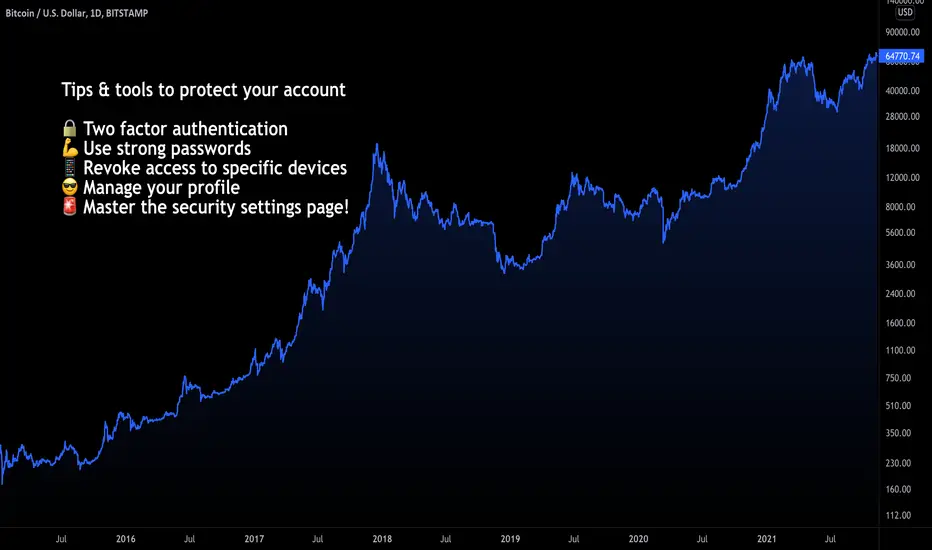
Tips For Securing Your TradingView ProfileSecurity and privacy are incredibly important to us. We have an entire team dedicated to it! We want all members to be absolutely confident that they have the tools they need to ensure their accounts are secure, safe, and protected. Let's get started.
The Obvious Tips
Don't use the same password everywhere or else one breach could expose all accounts. Make sure your passwords are unique and not easy to guess. Make sure to use strong passwords and special characters like @ # ! / < ? % when possible.
Don't fall for scams! Always double and triple check links that you click. Don't give out your log in credentials to anyone. One helpful tip is to make sure you have the official tradingview.sweetlogin.com homepage bookmarked on your browser. You'll also want to ensure you have the TradingView mobile apps on iOS or Android. Don't download imitators! Only use the official TradingView.com platform and apps.
The Tools Available To You
All TradingView members have access to individual security features within their Profile Settings . Head to your Profile Settings page to get started. Once you've made it to your Profile Settings, click the Privacy and Security tab . From here you can manage the full security of your account including several unique features:
• Enable Two-Factor Authentication
• Review linked social accounts
• Check sessions and logged in history
• Log out of individual devices
• Log out of all devices
• Disable/Enable chat
• Ignore users
• Complete control of your profile, how it looks and the information shown
For those interested in managing their individual trader Profile , we have tools that let you quickly change your profile picture, connected social media accounts, about & bio, location, and an entire notification suite for on platform notifications and email notifications.
Bonus Tips!
Two factor authentication is a must-have for those interested in the ultimate level of security. It means you can use a second device, like your phone, or an authentication app to confirm every log in.
If you're looking to learn more about all of the security features available to you, check out our Help Center. For example, this post explains more common tips to securing your account ! There's even more within our Help Center , which is free for everyone to learn more about markets and TradingView.
Thanks for reading!
- Team TradingView
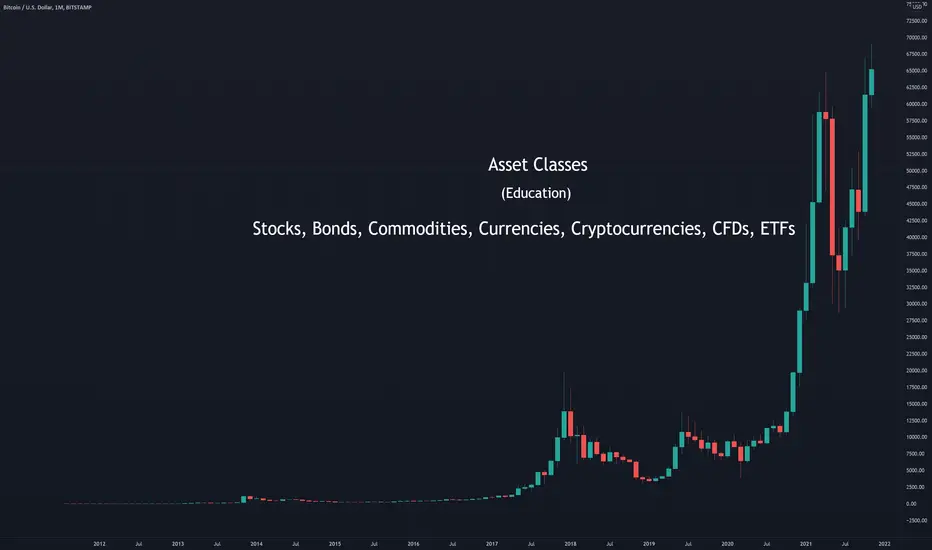
Asset Classes - Part 1 and 2 - For beginnersAsset classes - Part 1 - Stocks, Bonds, Commodities and Currencies
There are several types of asset classes which group together investments with similar characteristics. However, each asset class also has its own particular features that it does not share with other asset classes. Most common asset classes are: equities, fixed income, real estate, commodities and currencies. Correlation between different asset classes within the same industry is common. However, asset classes in unrelated fields show very little correlation. Each asset class possesses a different level of liquidity; most liquid asset classes are equities, fixed-income securities, and commodities.
Sub-asset class
Asset classes can be subdivided into sub-asset classes; for example, commodities can be subdivided into lumber, metals, oil, etc. Sub-asset classes can be further subdivided into separate groups which show common characteristics while showing characteristics of the broad group at the same time. For example, metals can be subdivided into precious metals and industrial metals. Each group can be then divided even further to efficiently distinct between separate features of asset type. For example, precious metals can be divided into gold, silver and platinum.
Illustration 1.01
Illustration above shows a daily chart of continuous CFD on WTI oil. Price made a low of 33.67 USD on 2nd November 2020 and continued to rise until it reached a high of 85.39 USD on 25th October 2021.
Correlation
Some assets tend to show correlation. Such correlation can be positive or negative. Positive correlation means that two assets behave in a similar way. For example, when gold rises then mining stocks rise as well. Contrary to that, negative correlation describes such behavior in which assets move in the opposite direction to each other. For example, when USDEUR declines then WTI oil tends to rise.
Illustration 1.02
Illustration above shows the daily graph of Exxon Mobil Corporation which belongs to the oil mining and exploration sector. It made a low of 31.11 USD on 29th October 2020 and then continued to rise until 1st November 2021 when it reached a high of 66.08 USD. Positive correlation can be observed between CFD on WTI oil shown in Illustration 1.01 and Exxon Mobil Corporation stock.
Stocks
Stocks, also called equities, are normally issued by an eminent (company, state, etc.) as shares which give right of ownership to their holder. These shares are then sold by eminent (to investors) with the purpose to raise capital. Stocks are predominantly traded on stock exchanges and they can be either common stocks or preferred stocks. Common stocks entitle a shareholder to vote at shareholders´ meetings and to receive dividends being paid by a company. Preferred stocks differ from common stocks in that they usually come with limited or no voting rights at all. Though, preferred stocks have higher claims to dividends and distribution of assets by a company. This means that in case of liquidation of a company preferred stockholders have priority over common stockholders. In addition to that, preferred stocks can pay higher dividends than common stocks and because of that they are good for building passive income based on dividend payments which can be monthly or quarterly.
Bonds
Bonds are simply loans made by an eminent (borrower) which can be state, corporation, or any other legal entity. Bonds are considered fixed-income instruments because they come with interest payments being paid out to an investor. Owner of a bond is called debtholder while the issuer of a bond is called a creditor. Bonds are tradable assets and they have maturity. In addition to that, bonds come with risk of default. Because of that, higher yielding bonds usually come with higher risk of default. Bonds are great investment vehicles for building passive income, however, they generally underperform in terms of yield when compared to stocks, commodities and indices. Bond yield is negatively correlated to bond's price.
Commodities
Commodities are basic goods (such as gold, lumber, oil etc.) that are used in commerce. They are usually refined or used for production of other goods. Commodities can be traded on market exchanges where they must meet specified minimum standards like quality, weight, type, etc. Commodities are great speculative and anti-inflationary investment vehicles.
Illustration 1.03
Illustration 1.03 shows the daily chart of CFD on WTI oil. On 20th April 2020 due to the WTI oil crisis at Cushing, Oklahoma price plunged below negative 36 USD (-36 USD per barrel). Unfortunately, that is not depicted on the chart (chart depicts lowest value at 0.00 USD).
Currencies
Currency has the role of a medium of exchange for goods and services in almost all economies around the world. There are many different currencies worldwide, however, predominantly used currencies are U.S. dollar (USD), Euro (EUR), British pound (GBP), Yuan (CNY) Ruble (RUB), Yen (JPY). Relationships between currencies are highly intertwined making the currency market very complex and hard to predict. Central banks can influence currency rates through monetary policies such as interest rates and quantitative easing. Similarly, a government can impact currency rate by enacting fiscal policies. These policies can have an impact on spending, import, export, etc.; which will, in result, influence currency rate. In addition to all of that, some currencies exhibit positive or negative correlation with commodities such as gold, oil, etc.
Illustration 1.04
Illustration above shows the daily graph of EURUSD. It is observable that EURUSD made lows in March 2020 and then continued to rise towards November 2020. Only a month later in April 2020 oil bottomed out and then started to rise in tandem with EURUSD (depicted in Illustration 1.03).
Asset Classes - Part 2 - Cryptocurrencies, ETFs, CFDs
Modern technology along with financial evolution brought rise of new asset classes such as cryptocurrencies, exchange traded funds (ETFs), contracts for difference (CFDs) and options. These new financial instruments represent alternative investment to stocks, bonds, commodities and currencies. Additionally, some features within these products can help an investor to diversify portfolio, trade short and use leverage with ease of a few mouse button clicks.
Cryptocurrencies
Cryptocurrency is simply digital currency. Most cryptocurrencies are based on blockchain technology which acts as a distributed ledger that is run by a large number of computers that comprise decentralized structure. Normally, cryptocurrencies are not issued by central authorities (however, central banks around the world currently work on digital form of fiat currencies). Cryptocurrencies are encrypted by cryptographic methods which makes them very difficult to counterfeit and double-spend. These assets are considered to be more volatile when compared to stocks, bonds, commodities and fiat currencies. Another defining feature that sets cryptocurrencies apart from other assets is that they are traded non-stop (24 hours a day, including weekends). Most popular cryptocurrencies are Bitcoin (BTC), Ethereum (ETH), Cardano (ADA), Ripple (XRP), Dogecoin (DOGE).
Illustration 1.04
Picture above shows the monthly chart of BTCUSD (Bitcoin in USD). It is very easy to spot unbelievable growth of more than 862 000 % between August 2011 and November 2021.
Exchange traded fund (ETF)
Exchange traded fund is a type of security that is publicly traded on a stock market exchange and which tracks an index, stock, commodity, or other asset. Exchange traded funds can track either one asset or group of assets. This allows an ETF to be structured in such a way that it can reflect performance of a particular economic sector.
Illustration 1.05
Illustration above shows the daily graph of JETS ETF which is an airline exchange traded fund. It has exposure to airline manufacturers, airline operators, airports and terminal services.
Contract for difference (CFD)
Contract for difference is exchange traded security that is cash-settled and which does not include delivery of goods. It simply pays the difference between the opening price and closing price. CFDs copy the price of other securities and they can be traded short, and also on margin. However, usually higher fees are associated with CFDs when compared to stocks, bonds, currencies and commodities.
Illustration 1.06
Depiction above shows the monthly graph of CFD on USOIL.
DISCLAIMER: This content serves solely educational purposes.
Japanese candle strength 📈📉In this idea I share how the candle could affect the strength of the market and know possible changes in trend

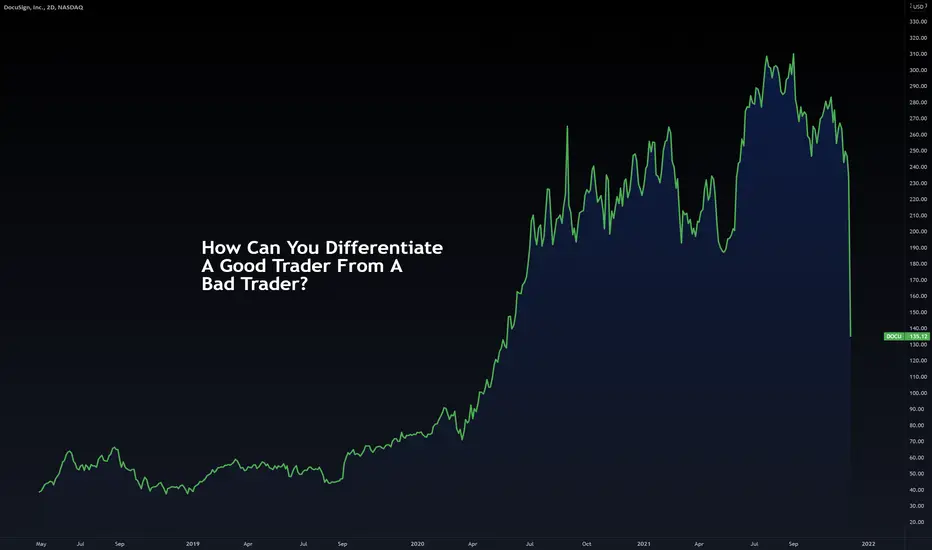
Skill VS Luck - Becoming a Consistently Profitable TraderHi traders, here we are on another workshop. Today I'll be sharing some of the points on differentiating skill or luck trading. Majority of the traders have absolutely no clue on are they doing the right things or not? Here's a few key points:
Skill
1. Winners and Losers
- If you are a skilled trader, you're someone who understand the probable and possible in trading. There's no guarantee on any single trade whether it's a winner or loser. Remember, the short-term outcome in trading is completely random, what's more important is to come out being profitable in the long-term. Never judge your performance based on the short-term outcome, think long-term.
2. Good Risk Management
- Good traders always have effective risk management in place. Not any single trade is able cause damage on their capital, and they truly understand how to detach themselves from negative emotions.
3. Repeatable
- Good traders have a repeatable process, that allows them to tackle the market in the same way every single day.
4. Proper Planning
- Good traders rarely deviate from their initial plan, as they understand that a planned trade is a good trade regardless of the outcome. Any trade taken out of impulsive behaviour, is considered a bad trade regardless of the outcome.
5. Consistency
- Good traders have a set of routine and action plan. To achieve consistent results, you must have a consistent performance.
6. Execution
- Good traders have little to no hesitation when it comes to executing their trades. They execute their plan without second guessing or doubt.
Luck
1. No loser
- Most gurus' or lucky traders would promote themselves having 80% - 90% strike rates, which could never happen in reality. The only way you can achieve such a high win rate is to have a Profit Factor of less than 1. In fact, most of the best traders out there have a strike rate of 40-50%.
2. Excessive Risk Exposure
- Losing traders have no idea how to isolate themselves from a bad state of mind. They're constantly putting up a lot of risk on the table regardless of having no clue on what's going on in the markets. The sense of urgency is rushing them on taking unnecessary risk.
3. Unrepeatable
- Losing traders constantly take trades out of their trading plan, which is not duplicable. If you're taking trades that is unrepeatable, most likely it's a lucky trade and you shouldn't be happy about it even if it turns out to be a winning position.
4. Impulsive Behaviour
- Losing traders deviate from their initial plan due to uncontrolled emotion. They're taking trades they're not supposed to take, then regrets later on.
5. No routine
- Losing traders have no daily routine. They're always blind firing all over any 'seems' profitable position. Most of them possess of potential over-trading habits.
6. Hope & Praying
- Losing traders are constantly looking for the 'best trade' that'd give them an enormous return. Most of them have no trading plan and proper Risk Management in place, causing them to experience an emotional rollercoaster on any particular position when it gets out of hand.
"Chains of habit are too light to be felt until they are too heavy to be broken." - Warren Buffett
Let me know in the comment below what's your worst trading nightmare!
If you enjoy the content, make sure you follow my profile and give me a thumbs up for daily fx forecast & educational content.

Simplifying Order FlowThis chart analysis shows you the power of order flow using two main things:
OB - Order Blocks
BOS - Break of Structure
If you can determine a trend utilising impulse and correction, you can almost always ride the wave by scaling in positions using this method.
First, determine your trend and then wait for a break of structure of a low/high.
In this example, we are in a bearish market so we are anticipating a break of a low before we can draw up our order block.
Once we get a break we can mark the OB that created the break and then wait for demand at a later date for sells.
IF the price gets too far away from the OB and looks like it isn't going to return to that point, we can move on to the next BOS and OB.
Note: This does not always mean that price won't return but we can still capitalise on the short term moves.
I have left an example of what could potentially happen next, although I am doubtful because the trend looks like it is coming to an end.
Please take a moment to like and comment on this post!
