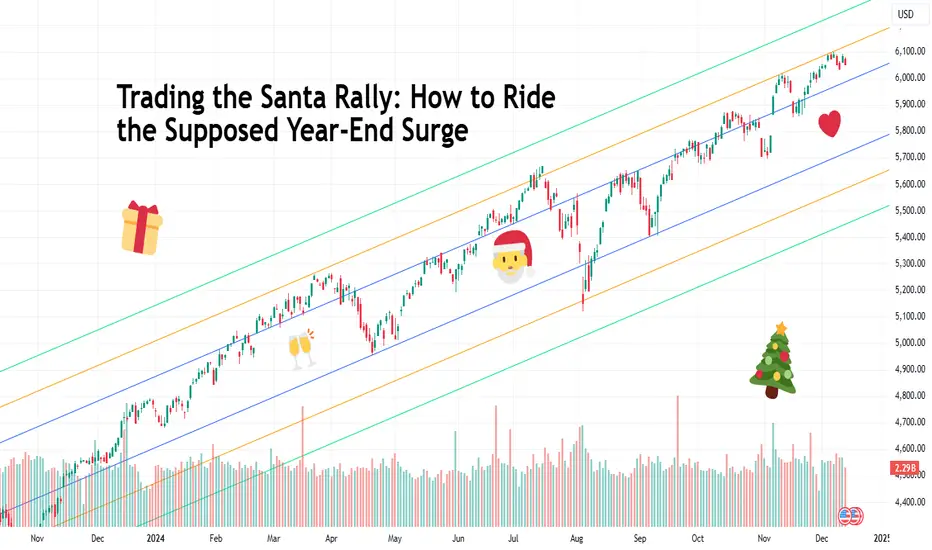
Trading the Santa Rally: How to Ride the Supposed Year-End SurgeThe Santa Rally — a festive event characterized by silent nights and active markets. Every December, traders whisper about it with a mix of excitement and skepticism. But what exactly is this supposed year-end market surge? Is it a gift from the markets or just a glittery myth? Let’s unwrap the truth.
🎅 What Is the Santa Rally?
The Santa Rally refers to the tendency for stock markets to rise during the last few trading days of December and sometimes even the first few days of January. It’s like a financial advent calendar, but instead of dark chocolate, traders hope for green candles.
The origins of this term aren’t entirely clear, but the event is widely observed. Analysts cite everything from holiday cheer to quarter-end, year-end portfolio adjustments as possible reasons. But beware — like a wrongly wrapped gift, the rally doesn’t always deliver what you expect.
🎄 Fact or Festive Fiction?
The Numbers Don’t Lie (Mostly):
Historical data does show that markets have a knack to perform well during the Santa Rally window. For instance, the S&P 500 SPX has delivered positive returns in about 75% of the observed periods since 1950. That’s better odds than guessing who’s going to win the “Ugly Sweater Contest” at the office.
Not Guaranteed:
However, let’s not confuse correlation with causation. While historical trends are nice to know, the market isn’t obliged to follow tradition. Geopolitical events, Fed decisions, or even a rogue tweet can easily knock this rally off course (especially now with the returning President-elect).
🚀 Why Does the Santa Rally Happen?
1️⃣ Holiday Cheer : Investors, like everyone else, might be more optimistic during the holidays, leading to increased buying momentum. After all, not many things can say “joy to the world” like a bullish portfolio.
2️⃣ Tax-Loss Harvesting : Fund managers sell off losing positions in early December to offset gains for tax purposes. By the end of the month, they’re reinvesting, potentially pushing prices higher.
3️⃣ Low Liquidity : With many big players sipping mezcal espresso martinis on the Amalfi coast, trading volumes drop. Lower liquidity can amplify price movements, making small buying pressure feel like a full-blown rally.
4️⃣ New Year Optimism : Who doesn’t love a fresh start? Many traders sign off for the quarter on a positive, upbeat note and begin setting up positions for the year ahead, adding to upward swings.
⛄️ The Myth-Busting Clause
While these factors seem plausible, not every Santa Rally is a blockbuster. For example, in years of significant economic uncertainty or bearish sentiment, the holiday spirit alone isn’t enough to lift the market.
🌟 How to Trade the Santa Rally (Without Getting Grinched)
1️⃣ Set Realistic Expectations : Don’t expect a moonshot. The Santa Rally is more of a sleigh ride than a rocket launch. Focus on small, tactical trades instead of betting the farm on a rally (and yes, crypto included).
2️⃣ Watch Key Sectors : Historically, consumer discretionary and tech stocks often perform well during this period. Consider these areas, but always do your due diligence.
3️⃣ Manage Your Risk : With low liquidity, volatility can spike unexpectedly. Tighten your stop-losses and avoid overleveraging — Santa doesn’t cover margin calls.
4️⃣ Keep an Eye on Macro Events : Is the Fed hinting at rate cuts (hint: yes it is )? Is inflation stealing the spotlight (hint: yes it is )? These can overshadow any seasonal trends.
☄️ Crypto and Forex: Does Santa Visit Here Too?
The Santa Rally isn’t exclusive to stocks. Forex markets can also see year-end movements as hedge funds, banks and other institutional traders close out currency positions.
Meanwhile, traders in the crypto market have gotten used to living in heightened volatility not just during the holidays but at any time of the year. More recently, Donald Trump’s win was a major catalyst for an absolute beast of an updraft.
🎁 Closing Thoughts: Naughty or Nice?
The Santa Rally is a fascinating mix of tradition, psychology, and market mechanics. While it’s fun to believe in a market jolly, it’s better to stay prepared for anything out of the ordinary.
So, are you betting on a rally this year, or are you staying on the sidelines? Let’s discuss — drop your thoughts in the comments below and tell us how you’re planning to trade the year-end rush! 🎅📈
Community ideas
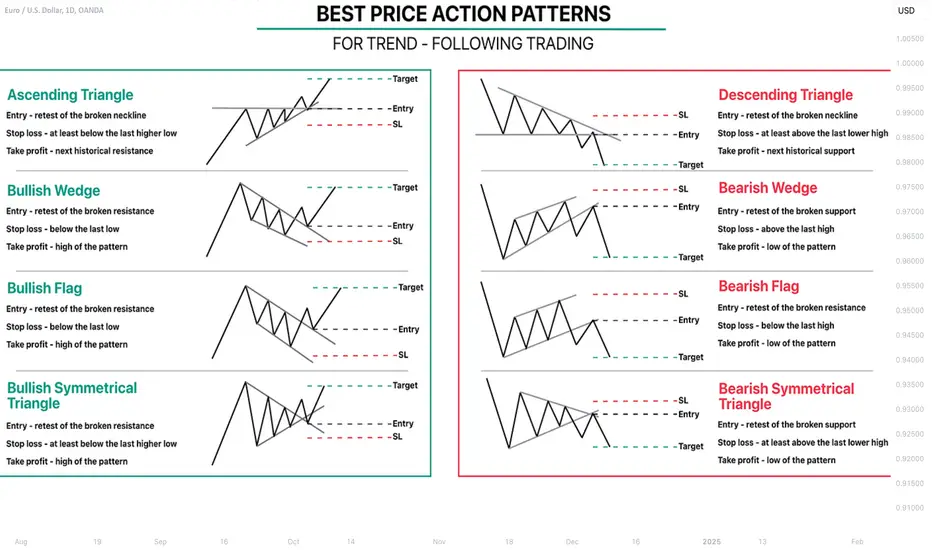
Learn Best Price Action Patterns For Trend-Following Trading
In this educational articles, I will teach you the best price action patterns for Trend-Following Trading Forex.
📍Ascending & Descending Triangles
The ascending triangle will be considered to be a trend-following pattern if the impulse leg preceding the formation of the pattern is bullish.
The pattern consist of 2 main elements:
a horizontal neckline based on the equal highs,
a rising trend line based on the higher lows.
❗️The trigger is a bullish breakout of a neckline of the pattern and candle close above.
📈The position is opened on a retest.
🔴Stop loss is lying at least below the level of the last higher low.
🎯Take profit is the next historical resistance.
Look at an ascending triangle formation on EURUSD on an hourly time frame.
On the left, you can see the structure of the pattern and on the right, the trading plan.
📍The descending triangle will be considered to be a trend-following pattern if the impulse leg preceding the formation of the pattern is bearish.
The pattern consist of 2 main elements:
a horizontal neckline based on the equal lows,
a falling trend line based on the lower highs.
❗️The trigger is a bearish breakout of a neckline of the pattern and candle close below.
📉The position is opened on a retest.
🔴Stop loss is lying at least above the level of the last lower high.
🎯Take profit is the next historical support.
Above is a perfect descending triangle pattern that I spotted on GBPUSD on a 4H time frame.
📍Bullish & Bearish Wedges
The bullish wedge pattern will be considered to be a trend-following pattern if the impulse leg preceding the formation of the pattern is bullish and the pattern is directed to the downside.
The pattern consist of 2 contracting falling trend lines based on the lower lows and lower highs.
❗️The trigger is a bullish breakout of a resistance of the pattern and candle close above.
📈The position is opened on a retest.
🔴Stop loss is lying below the low of the pattern.
🎯Take profit is the high of the pattern.
Above is a falling wedge pattern that I found on GBPUSD.
The pattern is formed after a strong bullish impulse.
A trigger to buy is a bullish breakout of its resistance.
——————
The bearish wedge pattern will be considered to be a trend-following pattern if the impulse leg preceding the formation of the pattern is bearish and the pattern is directed to the upside.
The pattern consist of 2 contracting rising trend lines based on the higher highs and higher lows.
❗️The trigger is a bearish breakout of a support of the pattern and candle close below.
📉The position is opened on a retest.
🔴Stop loss is lying above the high of the pattern.
🎯Take profit is the low of the pattern.
To correctly sell this rising wedge pattern on EURUSD, we should wait for a breakout of its horizontal support and then sell the market on its retest.
📍Bullish & Bearish Flags
The bullish flag pattern will be considered to be a trend-following pattern if the impulse leg preceding the formation of the pattern is bullish and the pattern is directed to the downside.
The pattern consist of 2 parallel falling trend lines based on the lower lows and lower highs.
❗️The trigger is a bullish breakout of a resistance of the pattern and candle close above.
📈The position is opened on a retest.
🔴Stop loss is lying below the low of the pattern.
🎯Take profit is the high of the pattern.
Above, you can see a perfect example of a bullish flag pattern on EURUSD on a 4H time frame and its trading strategy.
——————
The bearish flag pattern will be considered to be a trend-following pattern if the impulse leg preceding the formation of the pattern is bearish and the pattern is directed to the upside.
The pattern consist of 2 parallel rising trend lines based on the higher highs and higher lows.
❗️The trigger is a bearish breakout of a support of the pattern and candle close below.
📉The position is opened on a retest.
🔴Stop loss is lying above the high of the pattern.
🎯Take profit is the low of the pattern.
Above is a bearish flag pattern on GBPUSD and a full plan to sell the market based on it.
📍Bullish & Bearish Symmetrical Triangles
The bullish symmetrical triangle will be considered to be a trend-following pattern if the impulse leg preceding the formation of the pattern is bullish.
The pattern consist of 2 contracting symmetrical trend lines based on the higher lows and lower highs.
❗️The trigger is a bullish breakout of a resistance of the pattern and candle close above.
📈The position is opened on a retest.
🔴Stop loss is lying at least below the last higher low of the pattern.
🎯Take profit is the high of the pattern.
This bullish symmetrical triangle on EURUSD on an hourly time frame is a perfect example of a bullish trend-following pattern.
——————
The bearish symmetrical triangle will be considered to be a trend-following pattern if the impulse leg preceding the formation of the pattern is bearish.
The pattern consist of 2 contracting symmetrical trend lines based on the higher lows and lower highs.
❗️The trigger is a bearish breakout of a support of the pattern and candle close below.
📉The position is opened on a retest.
🔴Stop loss is lying at least above the last lower high of the pattern.
🎯Take profit is the low of the pattern.
On the left chart, you can see a structure of a valid symmetrical triangle.
On the right chart, you can see how to trade it properly.
The main difficulty related to trading these patterns is their recognition. You should train your eyes to recognize them on a price chart.
Once you learn to do that, I guarantee you that you will make tons of money trading them.
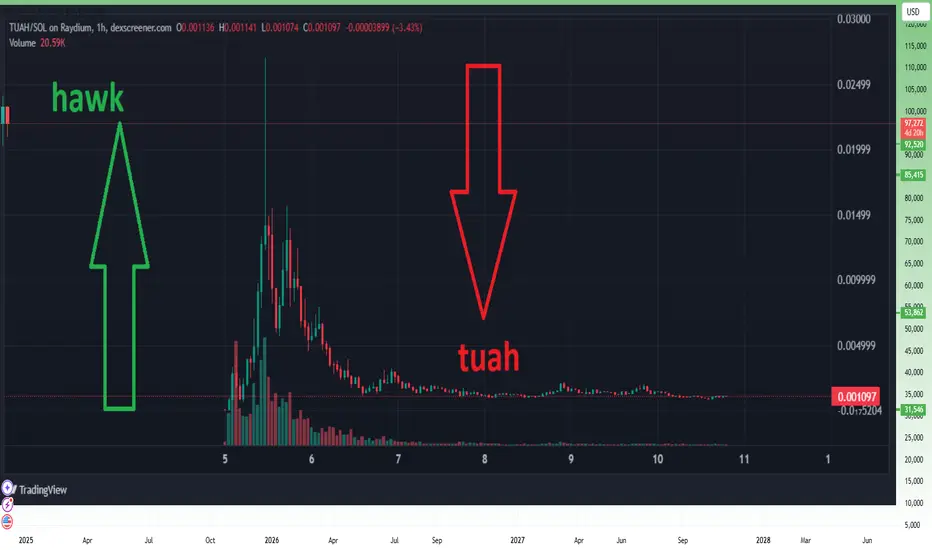
Lessons from the Hawk Tuah Meme Coin SagaThe recent collapse of the Hawk Tuah meme coin offers several valuable lessons for crypto investors, particularly regarding the risks associated with celebrity-backed tokens and meme coins. Here's a comprehensive look at the event and its implications:
What Happened?
Haliey Welch, a viral internet personality known as the “Hawk Tuah Girl,” launched her cryptocurrency, HAWK, on the Solana blockchain. Initially, the token skyrocketed in value, reaching a market cap of nearly $490 million within hours. However, the excitement was short-lived as the coin's value plummeted by over 90% shortly after its peak, resulting in massive losses for investors.
Investigations revealed suspicious activity, including a small group of wallets controlling 80-90% of the token's supply. These entities quickly sold their holdings after the price surged, a tactic commonly referred to as a Rug- Pull .
Welch has faced accusations of orchestrating the scheme, although she denies any wrongdoing
Key Takeaways for Investors
1. Avoid Hype-Driven Investments
Meme coins often rely on hype rather than fundamentals. The initial surge in HAWK’s value was fueled by Welch’s popularity and aggressive promotion, which masked its lack of intrinsic value.
2. Beware of Celebrity Endorsements
Celebrities frequently endorse or launch crypto projects, but their involvement doesn't guarantee legitimacy. Past incidents with figures like Kim Kardashian and Floyd Mayweather highlight a recurring pattern of failed celebrity-endorsed tokens
3. Understand the Token’s Structure
The dominance of a few wallets in HAWK’s ecosystem made the token vulnerable to manipulation. Always investigate the tokenomics of a project , including the distribution and control of its supply.
Recognize the Signs of a Rug Pull
- Rapid price surges followed by sharp declines
- Concentrated ownership by insiders or “snipers”
- Lack of a clear use case or roadmap
- Exercise Caution with New Tokens
*Newly launched coins are highly volatile and prone to exploitation. In the case of HAWK, the lack of regulatory oversight compounded the risks
Lessons for Regulators
The Hawk Tuah incident underscores the need for stricter oversight of crypto markets, especially celebrity-backed projects. While decentralized finance (DeFi) promotes inclusivity, its openness can be exploited. Regulators like the SEC are already investigating such cases, which may lead to stricter rules on token launches and promotions
Conclusion
The collapse of the Hawk Tuah coin serves as a cautionary tale about the dangers of speculative investments in unregulated markets. While the allure of quick profits can be tempting, due diligence, skepticism of promotional tactics, and an understanding of market mechanics are crucial for navigating the crypto space.
Investors should remember: if something sounds too good to be true, it probably is . For long-term success in crypto, focus on projects with robust fundamentals, transparency, and proven utility.
The Nested PullbackPullbacks are a bread-and-butter pattern for anyone trading trends. A market moves with momentum, takes a breather, and then resumes its original direction. Today, we’re diving into a refined variation of this classic setup: the nested pullback.
What Is the Nested Pullback?
The nested pullback takes the traditional pullback and adds a twist. After the market initially pulls back and resumes its trend, a smaller, secondary pullback sometimes occurs during the continuation leg. It’s a minor pause within a larger trend, but it holds major significance for those seeking precision in both entries and trade management.
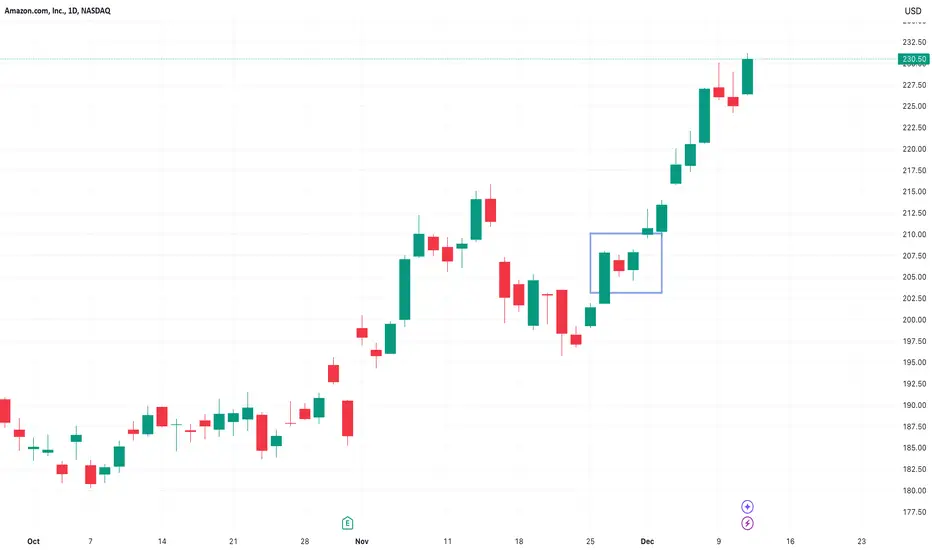
As depicted in the image below of Amazon's daily candle chart, we see an established uptrend, followed by a pullback. The trend resumes with strength, and crucially, we get a small pause—this creates the nested pullback pattern. It’s this compact formation within the broader move that makes it so effective, offering a structured opportunity for both entries and trade management.
This pattern is a prime example of how market structure and evolving price action can guide decision-making. It’s not just about spotting a pullback, it’s about understanding the conditions that create this nested structure and using it to your advantage.
Nested Pullback AMZN Daily Candle Chart
Past performance is not a reliable indicator of future results
Why This Pattern Can Be So Effective
1. The Cyclical Nature of Volatility
Markets are inherently cyclical, with quiet periods followed by bursts of activity. The nested pullback leverages this dynamic, forming during the quieter phase before volatility picks up again. This makes it an excellent pattern for timing entries just as the market gears up for its next significant move.
2. Not All Pullbacks Are Equal
A key factor in the nested pullback’s effectiveness is that it often follows shallow pullbacks—those with significantly less strength than the preceding trend leg. This relative weakness signals that the underlying trend is strong, and the market is likely to continue moving in the same direction.
The nested pullback pattern isn’t new, but it gained wider recognition thanks to the work of trading authors like Adam Grimes and Linda Raschke. Their insights have helped countless traders incorporate this subtle pattern into their strategies.
How to Trade It
The beauty of the nested pullback is in its simplicity. If you missed the initial pullback entry, this pattern often offers a second chance to join the trend. The structure of the nested pullback allows you to define your risk clearly: stops can be placed just below the small range or flag that forms during the nested pullback. This tight stop placement provides a favourable risk-to-reward ratio, making it an appealing setup for traders.
Managing the trade is equally straightforward. Keltner Channels can be a valuable tool here. By setting the Keltner Channel to 2.5 ATRs around a 20-day exponential moving average (standard settings), you can identify areas where the market might be overextended. If you’re long and the price breaks above the upper Keltner Channel, it could be a strong signal to take profits into strength. This approach ensures that you’re capitalising on the move while avoiding the temptation to hold on too long in the face of potential reversals.
The nested pullback works particularly well in strong, trending markets. It often appears after breakouts or during continuation phases, giving traders a structured way to enter or manage positions confidently.
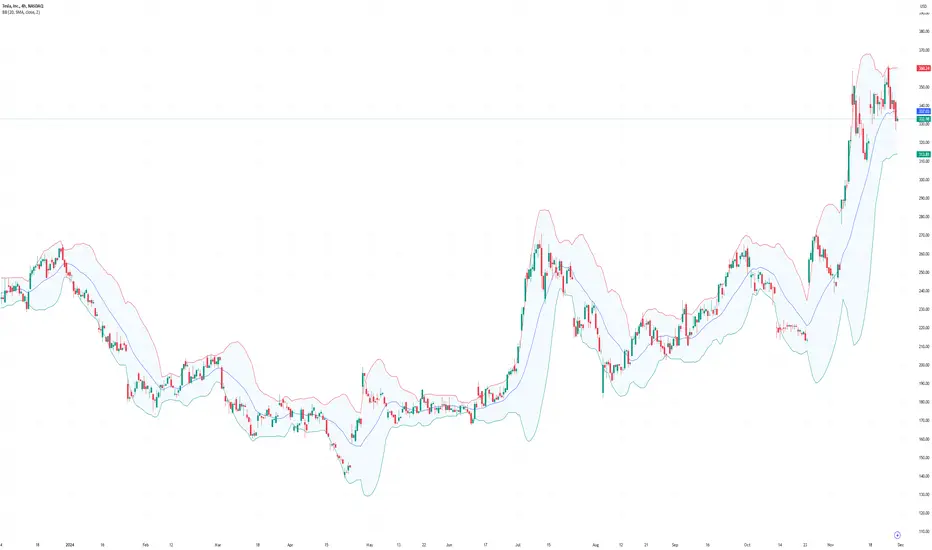
Example:
In the chart below, Gold is locked in a strong uptrend, with prices initially pulling back to the basis of the Keltner Channel. Following this pullback, the trend resumed, but not without a brief pause spanning two sessions—forming the nested pullback pattern. This pause presented an optimised entry point for traders looking to align with the prevailing trend.
As momentum continued, prices surged into the upper Keltner Channel, providing a clear signal that the market was potentially overextended. This area served as an excellent opportunity to exit the position into strength, locking in gains before any potential reversal.
Gold Daily Candle Chart
Past performance is not a reliable indicator of future results
Summary
The nested pullback is a subtle yet effective pattern that builds on the simplicity of traditional pullbacks. By understanding its structure and why it works, you can use it to refine your entries and strengthen your trade management. Whether you’re new to trading or a seasoned pro, this pattern offers a practical edge in trending markets.
Disclaimer: This is for information and learning purposes only. The information provided does not constitute investment advice nor take into account the individual financial circumstances or objectives of any investor. Any information that may be provided relating to past performance is not a reliable indicator of future results or performance. Social media channels are not relevant for UK residents.
Spread bets and CFDs are complex instruments and come with a high risk of losing money rapidly due to leverage. 82.67% of retail investor accounts lose money when trading spread bets and CFDs with this provider. You should consider whether you understand how spread bets and CFDs work and whether you can afford to take the high risk of losing your money.
Mastering Crypto Moves: Proven Strategies for Daily GainsUnlock 15% to 50% Daily Growth with Expert Chart Analysis and Market Insights
Follow me for:
🚀 Daily Crypto Predictions: Identify cryptocurrencies poised for 15%-50% moves in a single day.
📊 25 Years of Expertise: Learn from a seasoned trader with decades of experience in market analysis.
💹 Chart Mastery: Discover key patterns like Bollinger Bands, oscillators, and ICO rebound opportunities.
🧠 Real-Time Decisions: Gain insights into live trades, including entry points, profit targets, and risk management.
🤖 Navigating Market Manipulation: Understand how whale bots and market movers influence price ranges.
📈 Multi-Timeframe Analysis: Learn to analyze weekly, daily, and intraday charts for maximum synergy.
🎥 Exclusive Insights: Follow unique predictions on trending cryptocurrencies, including detailed analyses and live demonstrations.

HOW TO FIND 100X MEMECOIN???Hi i want to make this post as an educational content after 1 year from previous educational posts which i had.
i speak very usual that you can understand content well.
First you should consider this that maybe there are around 100 or 1000 or even 10000 Meme coins out there to be found.
But only 10 of them is valuable and can be next DOGE or SHIBA or PEPE or ....(comment below some valuable Meme which i didn't write).
1. First of all Meme should have a good story that after reeded buy audience they said i should buy some of this token for my children or my self long-term.
i will explain two good story for you as an example:
A. In May 2021, Shiba creator sent the rest to Ethereum co-founder Buterin, who burned 90% of them to increase their value and then donated the remaining 10%.
B. Or Doge Creator which started the token as a Joke and then Elon Mask supports over years.
conclusion: Meme coins are now for dreaming and need a good back story and people need to talk with each other about the funny story of it and boom 🚀.
so search for stories like these two examples or the other stories like we are loving dogs or cats so lets go and buy the meme token of it lol.
But that story wont work on every animal names so take care don't rush to every animal name token which usually are falling hard after some fake pump.
2. Second you need to find strong community now all meme coins have groups and chats before buying go join and see how they are preforming for month and then decide to invest.
3. Third check updates and ... which they had on their own token and see what are the future plans or listing and ....
4. Forth always check the major wallets of that Meme token here are some factors you should be afraid of it:
A. if the huge amount of token like 30% or 50% is in one wallet
B. if the huge amount of token like 70% or 80% is in the hand of one exchange: so it is usually a meme token created by that exchange and other exchange wont list it forever usually and also it created by that exchange with fake pump in green market days to sell you that token and one day it eventually fall hard i see in different exchanges deferent token like this with high fake volume on it but i can not name here and after 2-10 months they dump 70-80% fall and low volume and delisted.
conclusion: be afraid of tokens which huge amounts are in specific wallet because they are usually dangerous also remember they can easily create fake wallets and divide tokens to different wallets so best thing is to check major 20 wallets of that token and see if those wallets hold any other tokens and are really whales or it is fake wallets that all in that meme.
5. Fifth high liquidity: check the Meme token have high liquidity because one day soon or late you want to sell it.
Disclaimer: The content below this are not any more 100% Educational but it is another example i provide for better understanding.
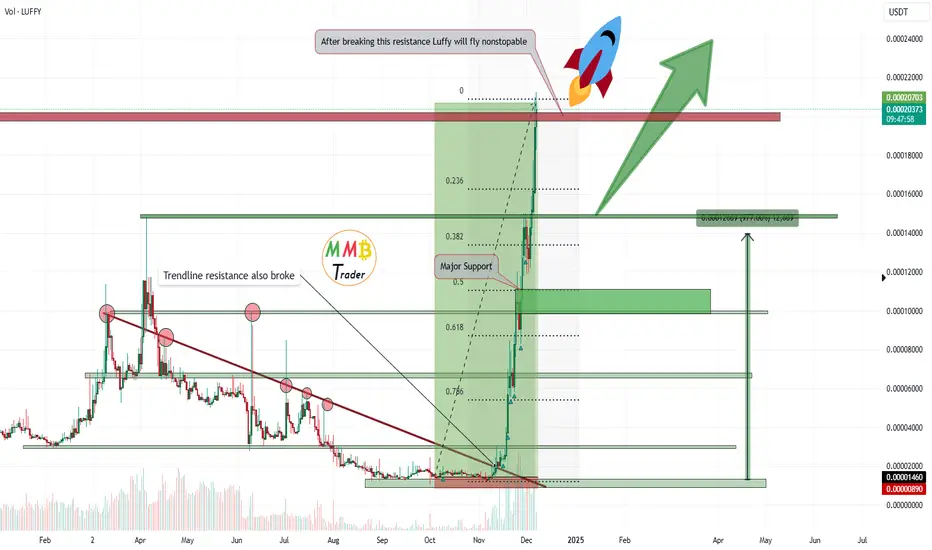
This is the beginning of this 1300% pump we had on Luffyusdt:
why i open long on Luffyusdt meme?
i checked almost all of the things mentioned above.
the story was all right here we have first anime token since 2021 running and they make web3 site to bring anime lovers together and ....
i check the team behind that and i checked evert 0-25 main wallets of this token and see in that 25 wallets 10 of the was whale and 5 of them was exchanges and major wallet is Dead wallet which means they burn 45% of token until now.
this token soon would be 100X in my opinion because it has the potential.
this is my own view and it may be wrong because we are living in crypto market so do your own research always and jump check your major meme holding and hold only valuable one.
any questions or thoughts mentioned in the comments.
also Disclaimer : Trade based on your own experience and research and knowledge.
When is a stock too high to buy? (Example: IHG)How do you know when you’ve missed the boat?
A stock has already gone up a tonne, so bascally you are too late!
Sometimes, you just have to let go, right?
Sometimes yes, but not always - let’s look at an example.
International Hotels Group (IHG)
Back in 2020, LSE:IHG IHG shares were trading down at ~2000 GBX, now they are a hairs breadth from 10,000 - that’s 5X in about 4 years. Not bad.
Can you really even think about buying shares at 10,000 that were 2,000 only 4 years ago. 🤔
We’re saying YES.. if you follow some guidelines.
Clearly this is not a value investment - this is a momentum trade.
To be buying IHG shares up here, one is basically arguing that the price at new highs indicates and buyers are in charge and the price is going to keep going up for the time being.
This helps define the trade risk very well.
If the trade is that IHG has broken out over the previous peak at ~8,800. We don’t want to be owning shares below this level - if they’re back below 8,800 the momentum has stalled and we need to be out.
To put it another way, we are not buying just under 10,000 and willing to hold the shares all the way back down to 2,000 again - no. We want to ride the momentum up - not down !
From here there’s a pretty good chance that momentum takes the price up to the 10,000 level. As a big round number, there is also a good chance that profit taking takes place here too.
That creates our buy zone between 8,800 and the current market price (9,750).
So what might a trading strategy look like to capture this situation?
The following is a way to have:
An intial risk of £1000 to test the waters
A total risk £3000 if/when the trade starts working
A 2X profit potential (with the opportunity to capture more)
Spread Betting Strategy: Target £6000+ Profit with £1000 Initial Risk
Entry Points and Stops
9000 GBX Entry:
Stop Loss: 8600 GBX.
Bet Size: £2.50 per point.
Risk: £1000.
9200 GBX Entry:
Stop Loss: 8800 GBX.
Bet Size: £2.50 per point.
Risk: £1000.
9400 GBX Entry:
Stop Loss: Trailing 400 points.
Bet Size: £2.50 per point.
Initial Risk: £1000.
Profit Targets
First Position (9000):
Gain: 1000 points.
Profit: £2500.
Second Position (9200):
Gain: 800 points.
Profit: £2000.
Third Position (9400):
Trailing Stop Profit Example:
10,400 GBX: Profit = £2500.
11,000 GBX: Profit = £4000 or more.
Summary
Total Risk: £3000.
Fixed Profit (First Two Positions): £4500.
Potential Profit (Third Position): Variable, based on trailing stop.
Reward-to-Risk Ratio: 2:1 or higher, depending on trend continuation.

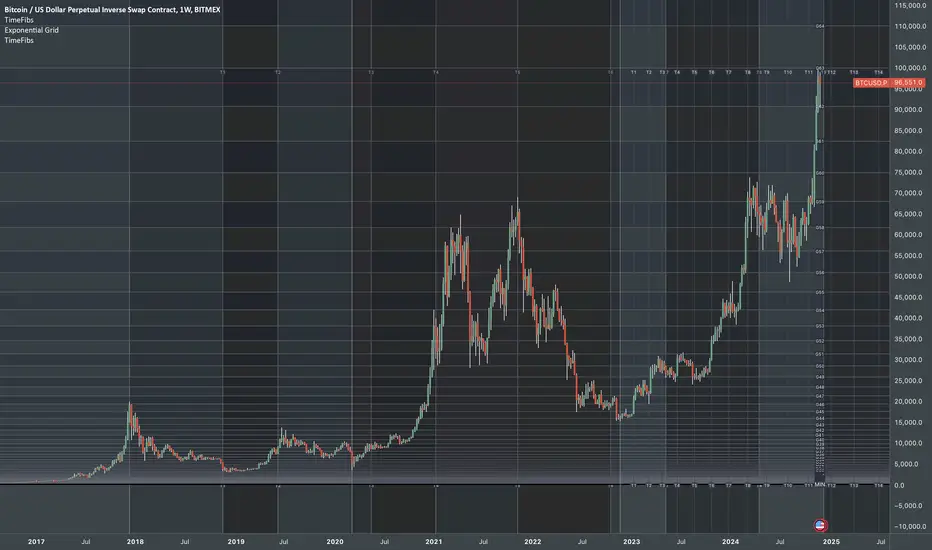
Reality & FibonacciParallels between Schrödinger’s wave function and Fibonacci ratios in financial markets
Just as the electron finds its position within the interference pattern, price respects Fibonacci levels due to their harmonic relationship with the market's fractal geometry.
Interference Pattern ⚖️ Fibonacci Ratios
In the double-slit experiment, particles including photons behave like a wave of probability, passing through slits and landing at specific points within the interference pattern . These points represent zones of higher probability where the electron is most likely to end up.
Interference Pattern (Schrodinger's Wave Function)
Similarly, Fractal-based Fibonacci ratios act as "nodes" or key zones where price is more likely to react.
Here’s the remarkable connection: the peaks and troughs of the interference pattern align with Fibonacci ratios, such as 0.236, 0.382, 0.618, 0.786. These ratios emerge naturally from the mathematics of the wave function, dividing the interference pattern into predictable zones. The ratios act as nodes of resonance, marking areas where probabilities are highest or lowest—mirroring how Fibonacci levels act in financial markets.
Application
In markets, price action often behaves like a wave of probabilities, oscillating between levels of support and resistance. Just as an electron in the interference pattern is more likely to land at specific points, price reacts at Fibonacci levels due to their harmonic relationship with the broader market structure.
This connection is why tools like Fibonacci retracements work so effectively:
Fibonacci ratios predict price levels just as they predict the high-probability zones in the wave function.
Timing: Market cycles follow wave-like behavior, with Fibonacci ratios dividing these cycles into phase zones.
Indicators used in illustrations:
Exponential Grid
Fibonacci Time Periods
Have you noticed Fibonacci ratios acting as critical levels in your trading? Share your insights in the comments below!
What Is a Standard Deviation, and How Can You Use It in Trading?What Is a Standard Deviation, and How Can You Use It in Trading?
Understanding market volatility is essential for effective trading, and one of the most valuable tools for measuring it is standard deviation. This gauge quantifies the dispersion of asset prices around their mean and provides insights into the variability and potential risk associated with a financial instrument.
This article delves into what standard deviation is, its calculation, interpretation, practical implementation, and its limitations.
What Is Standard Deviation?
Standard deviation is a statistical measure that quantifies the dispersion or variability of a set of data points relative to their mean. In trading, it is used to assess the volatility of a financial instrument. A higher standard deviation indicates greater variability in prices, suggesting more significant swings, while a lower value suggests smaller price fluctuations.
For instance, consider two stocks: Stock A and Stock B. If Stock A’s standard deviation is 5 and Stock B’s is 15, Stock B exhibits more price variability. This means that Stock B fluctuates more widely around the mean compared to Stock A, and its volatility level is higher.
Understanding the standard deviation of a stock or other asset helps traders evaluate its associated value. Assets with high standard deviations are considered riskier as their prices are hardly analysed, whereas assets with low deviations might be seen as potentially safer.
Volatility vs Standard Deviation
While both terms are related, volatility refers to the degree of variation in an asset's price over time, whereas standard deviation quantifies this variation statistically. The former is the broader concept, encompassing the overall fluctuations, while the latter provides a precise numerical measure of these fluctuations, offering traders a clearer understanding of market behaviour and risk.
Calculating Standard Deviation
Calculating standard deviation involves a series of straightforward steps. Here's how traders can calculate it using a set of price data:
1. Gather Data: Collect the closing prices of the asset over a specified period. For example, use the closing prices for the past 10 days.
2. Calculate the Mean: Add up all the closing prices and divide by the number of prices to find the average (mean) price.
Mean = ∑ Price /Number of Prices
3. Determine the Deviations: Subtract the mean from each closing price to find the deviation of each price from the mean.
Deviation = Price − Mean
4. Square the Deviations: Square each deviation to ensure all values are positive.
Squared Deviation = (Price − Mean)^2
5. Calculate the Average of Squared Deviations: Add up all the squared deviations and divide by the number of prices minus one (this adjustment, known as Bessel's correction, is used for a sample).
Variance = (∑(Price − Mean)^2) / (Number of Prices − 1)
6. Take the Square Root: Find the square root of the variance to get the standard deviation.
Standard Deviation = √Variance
Example Calculation
Assume we have the closing prices for a stock over 5 days: $20, $22, $21, $23, and $22.
1. Mean: (20 + 22 + 21 + 23 + 22) / 5 = 21.6
2. Deviations: −1.6, 0.4, −0.6, 1.4, 0.4
3. Squared Deviations: 2.56, 0.16, 0.36, 1.96, 0.16
4. Variance: (2.56 +0.16 +0.36 + 1.96 + 0.16) / 4 = 1.3
5. Stock’s Standard Deviation: √1.3 ≈1.14
Interpreting Standard Deviation in Trading
Standard deviation in trading offers deep insights into the statistical behaviour of asset prices, aiding traders in making informed decisions.
Volatility Analysis
- Normal Distribution: A normal distribution, also known as a bell curve, is a common statistical pattern where most data points cluster around the mean, with fewer occurrences as you move away from the mean. Within a normal distribution, roughly 68% of data should be within one standard deviation of the mean, 95% inside of two standard deviations, and 99.7% inside of three standard deviations.
- Trading Insight: By observing this measure, traders can estimate the likelihood of movements within certain ranges. For instance, if a stock’s daily return has a mean of 0.5% and a deviation of 2%, traders can expect that around 68% of the time, the stock’s daily return will be between -1.5% and 2.5%.
Market Sentiment
- Rising: An increasing standard deviation can signal growing uncertainty or a transition period in the market. It might precede major news events, economic changes, or market corrections. Traders often watch for rising volatility as a precursor to market shifts, adjusting their positions accordingly.
- Falling: A decreasing standard deviation can indicate calming markets or consolidation phases, where prices move around a mean. This might suggest that the market is absorbing recent volatility, leading to potential trend formation. Traders may see this as a period to prepare for future directional moves.
Risk Assessment
- Portfolio Management: The measure helps in assessing the risk level of an asset or portfolio. A higher value in a portfolio suggests greater overall risk, prompting traders to diversify or adjust their holdings to manage exposure.
- Comparative Analysis: By comparing the standard deviation of different assets, traders can identify which securities align with their risk tolerance. For instance, a conservative trader might prefer assets with lower standard deviations for their smaller price fluctuations.
Performance Evaluation
- Sharpe Ratio: Standard deviation is a key component in calculating the Sharpe Ratio, which measures risk-adjusted returns. A lower figure, in conjunction with a high return, indicates better performance on a risk-adjusted basis. Traders use this to compare the efficiency of different investments.
Indicators Using Standard Deviation
Standard deviation is a fundamental tool in trading, utilised in various indicators to assess volatility and inform strategies. To explore the indicators discussed below and apply them to live charts, head over to FXOpen’s free TickTrader platform.
Standard Deviation Indicator
- Description: The standard deviation indicator directly displays an asset’s standard deviation on a chart. It visually represents the deviation of the asset over a specified period.
- Interpretation: When the value is high, the market is experiencing more significant swings. Conversely, a low deviation suggests a market with less fluctuation. Traders often use this indicator to gauge the current volatility and adjust their strategies accordingly.
Bollinger Bands
- Description: Bollinger Bands consist of three lines: a simple moving average (SMA) in the middle and two standard deviation lines (one above and one below the SMA).
- Interpretation: The width of the bands reflects volatility. When the bands widen, it indicates increased volatility, while narrowing bands suggest the opposite. Bollinger Bands are commonly used to identify overbought or oversold conditions. Prices touching the upper band may signal an overbought market, while prices touching the lower band may indicate an oversold market. Traders use this information to make decisions about potential entry or exit points.
Relative Volatility Index
- Description: The Relative Volatility Index (RVI) uses the standard deviation of high and low prices over a specified period to measure volatility.
- Interpretation: The RVI is used to measure the volatility of a financial instrument, comparing price changes to price ranges over a specified period. It helps traders identify potential trend reversals or continuations by signalling periods of heightened or diminished market activity.
Practical Implementation of Standard Deviation in Trading
Traders utilise this statistical measure for several practical applications to enhance their trading strategies and risk management.
Risk Management
It helps in setting price targets and stop-loss levels. By understanding the typical price range, traders can place stop-loss orders beyond the expected range to avoid premature exits. For example, if the expected deviation is $2, a stop-loss might be set at $4 away from the entry level to account for typical fluctuations.
On the other hand, a trader may extend or tighten their profit target based on the market’s standard deviation. If it indicates volatility is low, they might prefer to set a target closer to the current price vs in a highly volatile market.
Evaluating Positions
When choosing or evaluating a potential position, traders might consider this measure to gauge expected volatility. A higher value signals higher potential market swings, indicating more risk. This may help in aligning trades with individual risk tolerance levels.
Identifying Extreme Price Movements
Bollinger Bands are particularly useful here. These bands are set at a distance of two or three standard deviations from a moving average. Movements outside these bands indicate extreme values. For instance, a spike beyond three standard deviations occurs only 0.03% of the time in a normal distribution, suggesting a strong signal. Traders might view a breach above the upper band as a potential selling point and a breach below the lower band as a buying opportunity.
Limitations of Standard Deviation
While standard deviation is a valuable tool in trading, it has certain limitations:
- Assumes Normal Distribution: It presumes data follows a normal distribution, which isn't always true in financial markets where extreme events can occur more frequently.
- Historical Data Dependence: It relies on historical data to define future volatility, potentially missing unforeseen market changes.
- Ignores Direction: It reflects volatility but doesn't indicate the direction of market movements, making it less useful for trend analysis.
- Sensitivity to Outliers: Extreme values can skew the measure, leading to inaccurate volatility assessments.
- Not a Standalone Tool: It should be used alongside other indicators and analysis techniques to provide a comprehensive market view.
The Bottom Line
Understanding and utilising standard deviation is vital for effective trading and risk management. By incorporating this measure, traders can better analyse volatility and make informed decisions. To apply these insights in real-world trading, open an FXOpen account and start leveraging advanced tools and strategies today.
FAQs
Is Volatility the Same as Standard Deviation?
Volatility and standard deviation are related but not identical. Volatility relates to how much variation exists in an asset’s price over a period of time. Standard deviation is a statistical measure used to quantify this volatility. Essentially, it provides a numeric value for volatility, indicating how much an asset's price deviates from its average.
How to Calculate the Volatility of a Stock?
To calculate stock volatility, traders determine the standard deviation of its returns over a specific period. They collect the daily closing prices, calculate the daily returns, and then compute the standard deviation of these returns. This gives the annualised volatility, reflecting the stock's fluctuation rate.
What Is a Good Standard Deviation for a Stock?
A "good" standard deviation depends on the trader’s risk tolerance and strategy. Lower values might suggest potentially less risk and less market fluctuation, suitable for conservative traders. Higher values indicate greater risk and potential reward, appealing to risk-tolerant traders. Generally, it’s best to seek a balance.
This article represents the opinion of the Companies operating under the FXOpen brand only. It is not to be construed as an offer, solicitation, or recommendation with respect to products and services provided by the Companies operating under the FXOpen brand, nor is it to be considered financial advice.
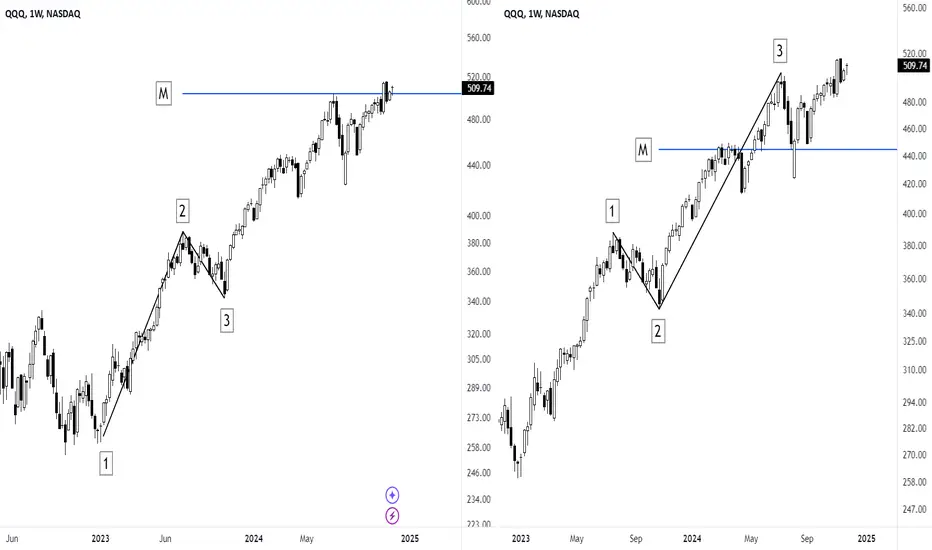
Understanding Trends and Waves in TradingIntroduction
In trading education, recognising price movements is crucial. Prices move in trends, and these trends move in waves. Understanding these waves is essential for successful trading.
The Two Types of Waves
Impulsive/Primary Trend
Comprises a minimum of five waves.
Dictates the overall direction of price movement.
Corrective/Secondary Trend
Comprises a maximum of three waves.
Provides insights into the ongoing trend.
This phase is the most critical for traders to master.
Conclusion
To trade successfully in a trending market, it’s vital to learn how to accurately count waves. Mastering this skill can significantly enhance your trading decisions. Best wishes for your trading success!

Measured Moves: A Guide to Finding TargetsMeasured Moves: A Guide to Finding Targets
Visualizing the boundaries of price movement helps anticipate potential swing points. The concept of measured moves offers a structured framework to estimate future price behavior, based on the observation that each swing move often mirrors the size of the previous one, assuming average price volatility remains consistent. While not exact, this approach provides a practical method to approximate the extension of a swing move.
Background
Determining profit targets across various methods and timeframes can be challenging. To address this, I reviewed the tactics of experienced traders and market research, noting key similarities and differences. Some traders relied more on discretion, while others used technical targets or predetermined risk-to-reward ratios. Levels of support and resistance (S/R) and the Fibonacci tool frequently appeared, though their application varied by trader.
Based on current evidence, levels appear most relevant when tied to the highest and lowest swing points within the current price structure, for example in a range-bound market. In contrast, sporadic or subtle levels from historical movements seem no more significant than random points. The Fibonacci tool can provide value since measurements are based on actual price range; however, the related values have limited evidence to support them.
To explore these ideas, I conducted measurements on over a thousand continuation setups to identify inherent or consistent patterns in swing moves. It’s important to emphasize that tools and indicators should never be used blindly. Trading requires self-leadership and critical thinking. The application of ideas without understanding their context or validity undermines the decision-making process and leads to inconsistent results. This concept formed the foundation for my analysis, ensuring that methods were tested rather than taken at face value.
Definitions
Trending price movement advances in steps, either upward or downward. This includes a stronger move followed by a weaker corrective move, also known as a retracement.
When the corrective move is done and prices seem to resume the prevailing trend, we can use the prior move to estimate targets; this is known as a projection.
For example, if a stock moves up by 10%, pauses, and subsequently makes another move, we can utilize that value to estimate the potential outcome. Well thats the idea..
Data
Through manual measurements across various timeframes, price structures, and stock categories, I have gathered data on retracements and projections. However, this information should not be considered precise due to market randomness and inherent volatility. In fact, deviations—such as a notable failure to reach a target or overextensions—can indicate a potential structural change.
As this study was conducted with a manual approach, there is a high risk of selection bias, which raises concerns about the methodology's reliability. However, it allows for a more discretionary perspective, enabling observations and discretion that might be overlooked in a purely automated analysis. To simplify the findings, the presented values below represent a combination of all the data.
Retracement Tool
In the context of price movements within a trend, specifically continuation setups, retracements typically fall between 20% and 50% of the prior move. While retracements beyond 50% are less common, this does not necessarily invalidate the setup.
From my observations, two distinct patterns emerge. First, a shallow retracement where the stock consolidates within a narrow range, typically pulling back no more than 10% to 20% before continuing its trend. Second, a deeper retracement, often around 50%, followed by a nested move higher before a continuation.
For those referencing commonly mentioned values (though not validated), levels such as 23.6%, 38.2%, 44.7%, and 50% align with this range. Additionally, 18% frequently appears as a notable breakout point. However, I strongly advise against relying on precise numbers with conviction due to the natural volatility and randomness inherent in the market. Instead, a more reliable approach is to maintain a broad perspective—for example, recognizing that retracements in the 20% to 50% range are common before a continuation. This approach allows flexibility and helps account for the variability in price action.
Projection Tool
When there is a swing move either upward or downward, we can utilize the preceding one of the same type for estimation. This approach can be used exclusively since it is applicable for retracements, projections, and range-bound markets as long as there has been a similar price event in recent time.
In terms of projection, the most common range is between 60% and 120% of the prior move, with 70% to 100% being more prevalent. It is uncommon for a stock to exceed 130% of the preceding move.
Frequently mentioned values in this context include 61.8% and 78.6% as one area, although these values are frequently surpassed. The next two commonly mentioned values are 88.6% and 100%, which are the most frequent and can be used effectively on their own. These values represent a complete measured move, as they closely mimic the magnitude of the prior move with some buffer. The last value, 127%, is also notable, but exceeding this level is less common.
Application
The simplest application of this information is to input the range of 80% to 100% into the projection tool. Then, measure a similar prior move to estimate the subsequent one. This is known as the measured move.
There are no strict rules to follow—it’s more of an art. The key is to measure the most similar move in recent times. If the levels appear unclear or overly complicated, they likely are. The process should remain simple and combined with a discretionary perspective.
Interestingly, using parallel channels follows the same principle, as they measure the range per swing and project average volatility. This can provide an alternative yet similar way to estimate price movement based on historical swings.
The advantage of this method is its universal and adaptable nature for setting estimates. However, it requires a prior swing move and is most effective in continuation setups. Challenges arise when applying it to the start of a new move, exhaustion points, or structural changes, as these can distort short-term price action. For instance, referencing a prior uptrend to project a downtrend is unlikely to be effective due to the opposing asymmetry in swing moves.
In some cases, measured moves from earlier periods can be referenced if the current range is similar. Additionally, higher timeframes take precedence over lower ones when determining projections.
This is nothing more than a tool and should be used with a discretionary perspective, as with all indicators and drawing tools. The true edge lies elsewhere.
Example Use
1. Structure: Identify an established trend or range and measure a clear swing move.
2. Measured Move: Apply the measurement to the subsequent move by duplicating the line to the next point or using a trend-based Fibonacci extension tool set to 100% of the prior swing.
The first two points define the swing move.
The third point is placed at the deepest part of the subsequent pullback or at the start of the new move.
3. Interpretation: While this is a simple tool, its effective use and contextual application require experience and practice. Remember, this process relies on approximation and discretionary judgment.
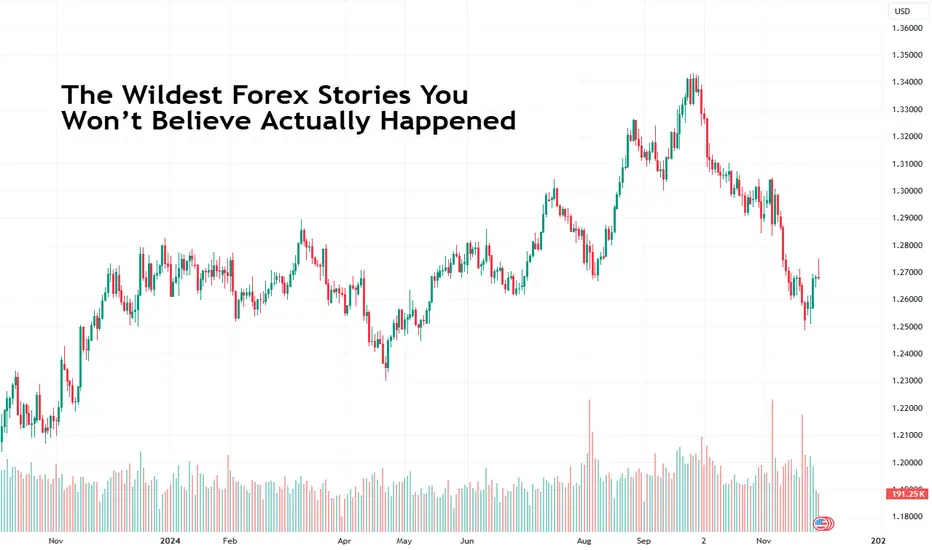
The Wildest Forex Stories You Won’t Believe Actually HappenedIf you think the forex market is all about boring spreadsheets, economic data, and mind-numbing chart patterns, think again. Beneath the surface of the world’s largest financial market lies a treasure trove of jaw-dropping, laugh-out-loud, and occasionally heart-wrenching tales.
Some of these stories will make you double-check your stop-losses, while others might tempt you to try your hand at trading—if only for the adrenaline rush.
Here’s a whirlwind tour of the forex market’s wildest moments. Spoiler alert: truth really is stranger than fiction.
The “Flash Crash” That Shook the Yen
Imagine logging into your trading platform, coffee in hand, only to see the yen skyrocket in a matter of minutes. That’s precisely what happened on January 3, 2019, when the USD/JPY pair nosedived by 4% in less than 10 minutes. The culprit? A rare combo of thin holiday liquidity, panicked algorithms, and a trigger-happy market reacting to Apple’s earnings warning .
Traders watching the carnage were left rubbing their eyes in disbelief as billions of dollars evaporated faster than you can say “where’s my stop loss.” Some savvy players profited handsomely, while others were left staring at margin calls and wondering if they’d just witnessed a glitch in the Matrix.
Lesson learned : Low liquidity markets can be as risky as walking on thin ice.
George Soros: The Man Who Made $1 Billion in a Day
No list of wild forex stories is complete without the ultimate trading flex: George Soros’s legendary short against the British pound in 1992. Dubbed “Black Wednesday,” this was the day Soros and his Quantum Fund went toe-to-toe with the Bank of England—and won.
Convinced by his partner Stanley Druckenmiller that the pound was overvalued and would be forced out of the European Exchange Rate Mechanism (ERM), Soros bet billions on its decline. The result? A cool $1 billion profit in a single day, a humiliated Bank of England, and Soros’s elevation to trading legend.
Lesson learned : Never underestimate the power of conviction—or billions in leverage.
The Swiss Franc Tsunami
On January 15, 2015, the Swiss National Bank (SNB) shocked the world by unpegging the Swiss franc from the euro . In the blink of an eye, the EUR/CHF pair plummeted as much as 19%, and chaos erupted across the forex market. Brokers went under, traders were wiped out, and even the most seasoned professionals were left scrambling for answers.
Lesson learned : Central banks play by their own rules, and when they change the game, expect pandemonium.
The Trader Who Bet Against the Euro—and Won Big
Meet John Taylor, the founder of currency hedge fund FX Concepts and one of the original forex market wizards. In the early 2000s, Taylor made a name for himself by betting against the euro when everyone else was bullish. Armed with a combination of macroeconomic analysis and a deep understanding of market psychology, he rode the euro’s decline to rack up massive profits.
His contrarian approach earned him a reputation as a forex maverick, proving that going against the herd can pay off big—if you’ve done your homework. But not for long. Long story short: FX Concepts got up to $14 billion in assets in 2008 and declared bankruptcy in 2013.
Lesson learned : In forex, sometimes the best trades are the ones no one else sees coming. But also—it’s tough to know when to call it quits.
The Currency Crash That Inspired a Coup
In 1997, the Asian Financial Crisis sent shockwaves through global markets, but few places felt it as acutely as Indonesia. The rupiah lost more than 80% of its value , sparking widespread economic turmoil and political unrest that ultimately led to the resignation of President Suharto after 31 years in power.
While most forex traders were focused on the numbers, the crisis served as a stark reminder that currencies aren’t just lines on a chart—they’re the backbone of entire economies.
Lesson learned : Forex trading can shape history in ways few other markets can.
The Pound’s Post-Brexit Rollercoaster
In June 2016, the Brexit referendum sent the British pound on a ride so wild it could rival any theme park attraction. As the "Leave" vote defied polls and pundits, the pound plummeted 10%, hitting levels not seen since the 1980s . Traders who had been banking on a "Remain" victory were left scrambling, while those betting against the pound made a killing.
The chaos didn’t stop there. In the months and years that followed, every Brexit-related headline became a market-moving event. Negotiation updates? Pound down. Political drama? Pound down. A tiny glimmer of clarity? Pound up—until the next twist.
This wasn’t just a currency reacting to uncertainty; it was a masterclass in how politics can take control of forex markets.
Lesson learned : Currencies are deeply tied to national identity and global sentiment. And when politics enters the mix, expect fireworks.
What’s Your Wildest Forex Story?
The forex market is a place of extremes—extreme risk, extreme reward, and extreme stories that prove truth is stranger than fiction.
Have your own wild forex story to share? Maybe you caught the Swiss franc wave or survived a flash crash with your account intact. Drop your tale in the comments and let’s get talking!
Benchmarking a trend with a moving average (Example: Gold)They say a bad workman blames his tools.
Quite often, good work means using the right tools.
In a trend you need to use trend-following tools - and the most famous indicator is the moving average.
When it's a fast-moving trend, you need to use averages taken over shorter periods (e.g. 20 day SMA > 200 day SMA). Likewise a slower trend needs averages taken over longer periods (e.g. 20 week > 50 day).
Gold has just bounced off the 20 week moving average for the fourth time. The market is clearly benchmarking this trend according to this specific average.
So while the price is above this moving average the trend is intact - and when it eventually breaks below it will be an important signal that the strength of the trend has weakened - and could be about to reverse.
On the daily chart a rising trendline has broken but we would argue the reason the rebound off the low has been so strong is because the price rebounded off the 20 week moving average.
For now our bias is bullish but there are no good risk:reward opportunities to buy and it remains unclear whether the short term uptrend can continue after the trendline break

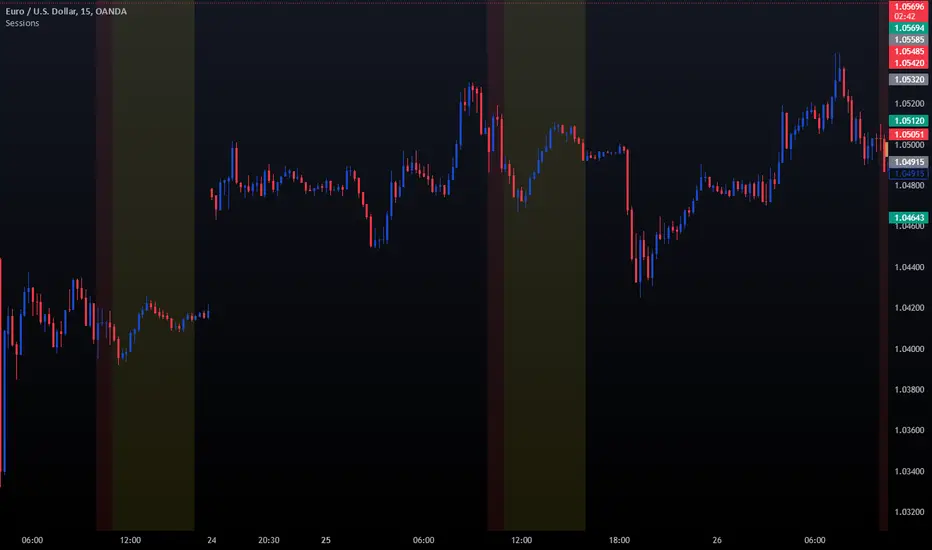
Kill Zone Trading in ForexKill Zone Trading in Forex
Kill Zones represent key periods when market volatility and trading volume surge. This article delves into the concept of Kill Zones, their strategic importance, and practical insights on how traders can leverage these windows for effective trading.
Understanding Kill Zones
Why do ICT Kill Zones matter? A Kill Zone in forex trading refers to a specific time period during which currency pairs experience increased volatility and volume. These periods are crucial for traders who aim to capitalise on significant price movements. The concept, popularised by Michael Huddleston, also known as the Inner Circle Trader, highlights the importance of timing in trading strategies.
The strategies are based on global forex hours. The forex market operates 24 hours a working day across four major sessions: Sydney, Tokyo, London, and New York. The interaction between these sessions, particularly at their opening and closing times, creates unique opportunities for traders. The heightened activity during these periods can lead to greater liquidity and faster price movements.
The Four Primary Kill Zones
The four primary Kill Zones represent strategic windows where trading volume and volatility peak due to the interplay of global market sessions. Each period corresponds to key transitions in major forex markets worldwide.
Below, we’ve described each along with the key ICT Kill Zone times. You can see how currency pairs react during these times in FXOpen’s free TickTrader platform.
1. Asian Kill Zone
Asian Kill Zone Time Period: 23:00 GMT to 02:00 GMT in winter and in summer.
This window coincides with the opening of Asian markets, primarily Tokyo. This period sees increased activity in currency pairs with AUD, NZD, and JPY.
The US dollar typically shows consolidation, providing an environment ripe for scalping strategies. Traders often monitor for optimal trade entry (OTE) patterns, another ICT concept, during this time, capitalising on the day’s initial movements and setting the stage for the European session.
2. London Kill Zone
London Kill Zone Time Period: 08:00 GMT to 11:00 GMT in winter (07:00 GMT to 10:00 GMT in summer).
This window is known for its volatility and significant trading volume, particularly involving EUR and GBP. As the London session opens, it often establishes the daily highs (in bullish markets) or lows (in bearish markets), reacting to developments from the Asian session.
Traders analyse market movements to prepare for potential breakouts or reversals. This window can be crucial when setting up trades, especially for currency pairs that show little activity overnight but become volatile with the London opening.
3. New York Kill Zone
New York Kill Zone Time Period: 13:00 GMT to 16:00 GMT in winter (12:00 GMT to 15:00 GMT in summer).
This window marks the overlap of the London and New York sessions, creating a critical period for USD-paired currencies. The dynamics of this period are influenced by the activity of traders from both continents being concurrently active. Traders seek continuation or reversal of the trends established over the London session, employing strategies that capitalise on the volatility to maximise returns.
4. London Close Kill Zone
London Close Kill Zone Time Period: 15:00 GMT to 17:00 GMT in winter (14:00 GMT to 16:00 GMT in summer).
As the London session concludes, this window typically exhibits less volatility but still offers opportunities for strategic trades. Traders might observe retracements or continuations of earlier trends. During this period, strategies often revolve around identifying trend exhaustion and preparing for potential reversals as European traders close their positions, influencing pair directions before the close of the American session.
Practical Considerations for Trading Kill Zones
When engaging with Kill Zones in forex, practical considerations are key to leveraging these periods effectively. Keep in mind these things:
Navigating Time Zone Shifts
Traders must account for time zone shifts such as British Summer Time (BST) and Eastern Daylight Time (EDT) when planning their trading schedules. These shifts can impact the real-time operation of forex markets by altering the relative timing of session openings and peak activity periods.
BST is GMT+1, moving the London window to an hour earlier for those trading on GMT. During BST, which typically runs from late March to late October, the London Kill Zone shifts from 07:00 to 10:00 GMT. Conversely, EDT, which is GMT-4, affects those in the US by advancing the New York window to start and end an hour earlier. This period typically extends from the second Sunday in March to the first Sunday in November.
Risk Management
Trading during these windows involves navigating periods of high volatility, where price movements are rapid and unpredictable.
- Volatility-Based Position Sizing: Adjusting position sizes based on volatility may be useful. In more volatile periods like the London or New York openings, reducing position size may help manage potential losses.
- Time-Specific Stop-Loss Orders: Implementing stop-loss orders that reflect the heightened activity levels can help mitigate potential risks. For example, wider stop-loss margins might be necessary across the New York window due to the significant price shifts that can occur when both American and European markets are active.
- Real-Time Monitoring: Active monitoring during these volatile times is vital. Rapid response to price changes can potentially help mitigate losses. Setting alerts at particular levels and indicators may aid in a proactive approach.
The Bottom Line
Understanding and utilising Kill Zones may enhance a trader's ability to strategically enter and exit the market during periods of high volatility and volume. They offer pivotal opportunities for discerning traders to capitalise on significant price movements. For those looking to further explore or leverage these opportunities, opening an FXOpen account could be a valuable step towards engaging with currency pairs during these critical windows.
FAQs
What Is a Kill Zone in Trading?
A Kill Zone in trading refers to specific times in the forex market when price volume and volatility are significantly higher than usual, offering key opportunities for currency trades.
How Do You Use a Kill Zone?
Traders often analyse market conditions and use historical data to identify high-probability opportunities during these volatile windows.
How to Trade Effectively During ICT Kill Zones?
Trading effectively involves understanding each Kill Zone's characteristics and using effective risk management tools to capitalise on increased volatility and liquidity.
What Is the ICT Kill Zone Indicator for TradingView?
The ICT Kill Zone indicator, developed by LuxAlgo, highlights these critical periods directly on TradingView charts, aiding traders in visualising potential trading windows.
This article represents the opinion of the Companies operating under the FXOpen brand only. It is not to be construed as an offer, solicitation, or recommendation with respect to products and services provided by the Companies operating under the FXOpen brand, nor is it to be considered financial advice.
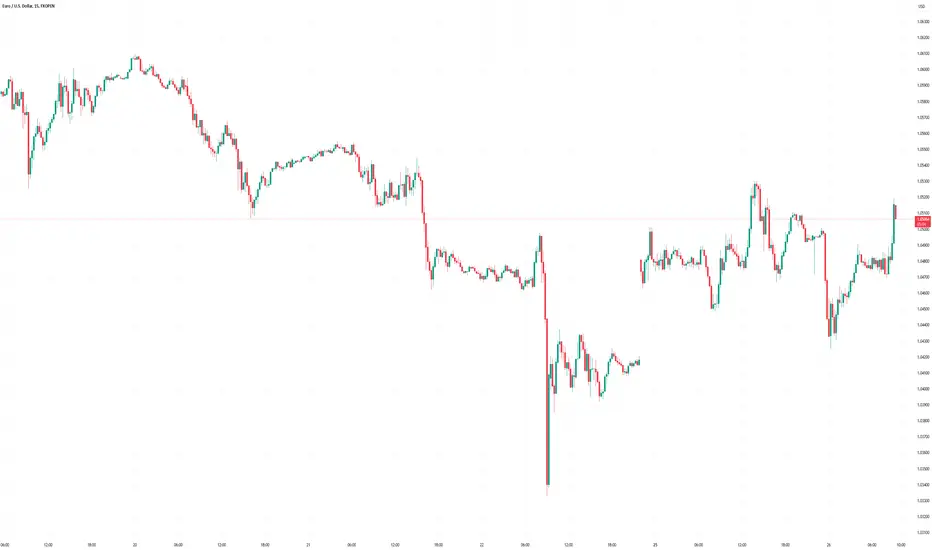
Silver Bullet Strategy EURUSD USDCAD AUDUSD | 26/11/2024Yesterday served as a classic example of the importance of risk management in every trader's system. We initiated three trades across three different currency pairs (EURUSD, GBPUSD, USDCAD) and plan to provide a detailed breakdown of each trade, including the outcomes.
We began scouting for potential setups that matched our entry criteria at 10:00 EST. By 10:30 EST, a FVG had developed on GBPUSD, indicating potential selling opportunities during this trading session. All that remained was to wait for a retracement into the created FVG to secure an entry point for the trade
The subsequent five-minute candle entered the Fair Value Gap (FVG) on GBPUSD, indicating that we could execute our trade upon its closure. Simultaneously, we were exploring additional trading opportunities across various currency pairs. It was then that we observed the emergence of a FVG on USDCAD, necessitating a wait for a retracement into the FVG before executing a trade. We executed the trade on GBPUSD while awaiting confirmation to enter the USDCAD position.
The USDCAD setup provided an entry confirmation, indicating that we would have two trades active during this session. Additionally, the session was still ongoing when we observed that another EURUSD setup was approaching the fulfillment of our entry criteria.
Immediately after initiating the trades on GBPUSD and USDCAD, we observed a significant drawdown on both. This was due to a large bearish marubozu candle printing on the USDCAD, while the GBPUSD experienced two successive bullish candles, casting both positions in an unfavorable light. While all this was happening the setup on EURUSD had fulfilled all the requirements on our checklist so we had to execute that trade as well.
Our USDCAD position hit the stop loss, and shortly after, our GBPUSD position also reached the stop loss, resulting in a 2% reduction of our trading account for the day. This leaves us with just one active position on EURUSD.
Being in such a position wouldn't be easy to bare if we hadn't managed risk properly. We entered these trades risking only 1% per trade and had already accepted the potential outcomes, which greatly diminished any emotional attachment to these trades. With that in mind, the EURUSD position began moving in our desired direction, which was a considerable relief after two out of three trades had reached the stop-loss point
We patiently waited, and this time our patience paid off when our EURUSD position hit the take profit (TP) for a 2% gain. Thus, for the day, we experienced two losses and a win, but with effective risk management, our win offset both losses, and we broke even for the day. Do you see the importance of ensuring your wins outweigh your losses? We experienced just one win and two losses, yet our single win was more significant that it offset all the losses we had for the day
Using Bollinger Bands to Gauge Market Trends and Volatility The US Thanksgiving holiday usually marks a quieter period for trading, as US financial markets are closed on Thursday and US traders often take the Friday off as a holiday to benefit from a long weekend. This can see both lower volume and volatility, so we thought we’d take this time to outline one of our favourite technical indicators, called Bollinger Bands.
The aim is to increase your knowledge of a new indicator you may consider worth knowing, ahead of the first week of December, which is packed full of important events that may kick start markets moving again into the end of 2024.
We intend to highlight how Bollinger Bands can potentially be applied to help read both current trending and volatility conditions for any asset.
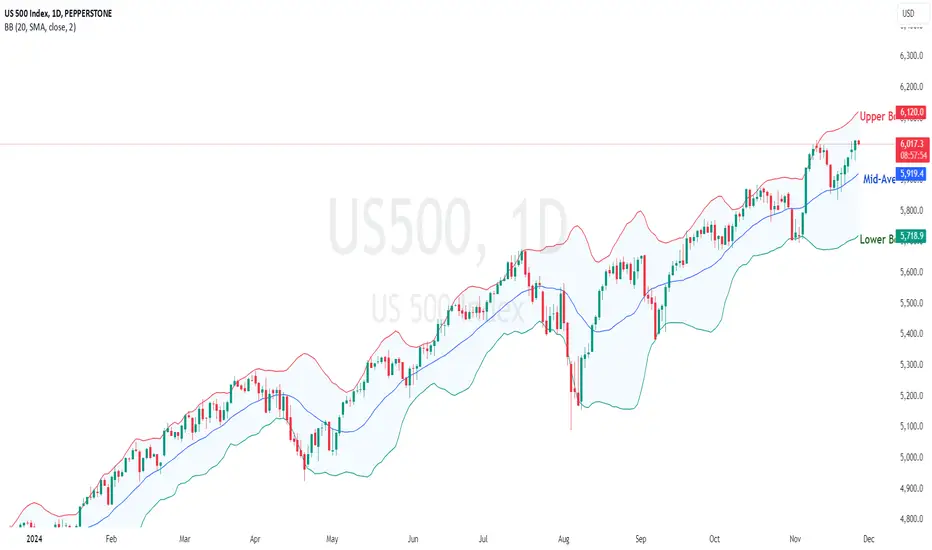
To help with this, we are using the US 500 index as an example to outline the type of band set-ups you can consider using within your day-to-day analysis and trading.
What are Bollinger Bands?
Bollinger bands are made of 3 lines – the mid-average, upper and lower band (see chart above).
The mid-average is a 20 period moving average, with the upper and lower bands calculated using 2 standard deviations either side of the mid-average.
If you are unsure of the concept or how to calculate 2 standard deviations, please don’t worry, the Pepperstone charting system will do this automatically for you and add them to the chart of any asset you may wish to analyse.
The mid-average is used to reflect the direction of the on-going trending condition of a market. If its rising, an uptrend is in place, while if it’s falling, a downtrend is evident.
How the bands act in relation to the mid-average is key when using Bollinger bands. They can often offer important confirmation of the trend and can show if acceleration phases in the price of a particular asset may be seen within that trend.
The most important thing to know about Bollinger bands is that they react to increasing volatility within price. Periods of increasing volatility see both bands widening away from the mid-average, while if volatility is decreasing, they contract or draw closer to the mid-average.
Let’s look at this further.
What Set-Ups are We Looking For and What Do They Mean?
There are 5 set-ups to be aware of when using Bollinger bands and each offer clues to the next activity in the price of a particular asset.
1st: Volatility Increasing Within a Confirmed Trend:
When the mid-average is either rising (to highlight an uptrend) or falling (to reflect a downtrend), and the bands are widening to show increasing volatility within that trend, alongside the upper band being touched in an uptrend, or within a downtrend, the lower band being touched.
When all the above conditions are evident, the potential is for that move to extend further than perhaps anticipated.
On the US 500 Index chart above, the green arrows mark when these more aggressive trending conditions are in place.
2nd: Volatility Decreasing Within a Confirmed Trend:
Where the mid-average is either rising (uptrend) or falling (downtrend), and the bands are contracting reflecting decreasing volatility within that trend.
When these set-ups are in place, the speed of the recent directional move is slowing, and the possibilities are increasing for a consolidation in price.
During this period, we may want to consider reducing or closing positions and reverting to the side lines, as a setback could materialise, as a reaction to the latest move.
On the chart above, red arrows mark these consolidation periods.
3rd: Mid-Average Support/Resistance Holds Within Corrective Moves:
Within these corrective or recovery phases after periods of increasing volatility and widening bands, we must watch how the mid-average support or resistance is defended.
If the mid-average is rising, highlighting an uptrend and holding price weakness, it may resume the direction of the original trend. Similarly, when the mid-average is falling, highlighting a downtrend and holding price strength, it may continue in the same direction. However, past trends and technical indicators are not reliable predictors of future performance, and market conditions can change unexpectedly.
On the new chart above, these points are marked by the blue vertical arrows.
4th: Trend Channels Form Between Mid-Average and Upper/Lower Band:
When the rising mid-average holds as suggested in the third set-up above, this can see uptrend or downtrend channels form in price.
In an uptrend, the rising mid-average holds price weakness and turns it higher.
While this still sees price strength, volatility doesn’t increase but remains steady, reflected by rising parallel bands and support continues to be found by the rising mid-average.
However, resistance materialises following tests of the upper band, for a setback towards the support of the still rising mid-average.
This pattern ends if the price of the asset breaks below the support offered by the rising mid-average.
On the latest chart above, this is marked by the purple arrows.
When the declining mid-average holds price strength, as suggested in the 3rd set-up above, this can see a downtrend channel form in price.
In a downtrend, the declining mid-average holds price strength and turns it back lower.
While this scenario still sees price weakness, volatility remains steady and doesn’t increase, reflected by the declining bands being parallel, and resistance continues to be found by the falling mid-average.
However, tests of the lower band see support materialise and a rally in price ensues towards resistance marked by the still falling mid-average.
This pattern ends if the price of the asset breaks above resistance offered by the falling mid-average.
This situation is the opposite of the chart above.
5th: Mid-Average Broken to See More Extended Rally/Sell-Off:
Mid-average support or resistance gives way, but while price weakness or strength develops, the direction of the average doesn’t change.
This sees a limited move in the direction of the mid-average break.
During price weakness, if the mid-average continues to rise, the lower band can act as a support level and prompt a rally.
During price strength, if the mid-average continues to fall, the upper band acts as a resistance level from which price weakness can emerge again.
These signals are marked by the green rectangles in the chart above.
It is important to note in this example, if an upper or lower bands is touched and then both bands start to widen alongside the mid-average changing direction, then this is highlighting the 1st set up described above, meaning we are observing increasing volatility within what is a new trending condition.
In this situation, we may need to consider adjusting our trading strategy to reflect this new directional shift in price.
Conclusion:
While past signals within Bollinger Bands are not a guarantee of future signals, by utilising the set-ups described above, they may offer an indication of the latest trending conditions in the price of a particular asset.
More importantly, they help to highlight when increasing volatility is materialising and when more sustained price moves are possibly on the cards, in the direction of the on-going trend.
Also, they show when decreasing volatility can result in a period of consolidation and a reaction to the recent move due.
Take a look at the Pepperstone charting system and consider whether Bollinger Bands may help you establish the next directional moves for the asset you’re trading.
The material provided here has not been prepared in accordance with legal requirements designed to promote the independence of investment research and as such is considered to be a marketing communication. Whilst it is not subject to any prohibition on dealing ahead of the dissemination of investment research we will not seek to take any advantage before providing it to our clients.
Pepperstone doesn’t represent that the material provided here is accurate, current or complete, and therefore shouldn’t be relied upon as such. The information, whether from a third party or not, isn’t to be considered as a recommendation; or an offer to buy or sell; or the solicitation of an offer to buy or sell any security, financial product or instrument; or to participate in any particular trading strategy. It does not take into account readers’ financial situation or investment objectives. We advise any readers of this content to seek their own advice. Without the approval of Pepperstone, reproduction or redistribution of this information isn’t permitted.
Profitable Support and Resistance Strategy for Trading Forex
This support and resistance strategy works on any forex pair and gold.
It is simple and profitable and it is the best trading strategy for beginners.
In this article, I will share with you a step-by-step guide for trading this strategy. You will learn entry rules and important theory.
First and foremost, in order to profitably trade support and resistance levels, you need to know how to identify them. You should know how to distinguish a significant structure level.
I believe that you should look for a strong support or resistance strictly on a daily time frame.
That structure should be historically significant.
It means that it should be respected by the market at least 2 times, with a strong and clear reaction to that.
Here is the example of a key support on EURUSD.
The underlined key level was respected as the resistance, first,
then, after a breakout, it turned into support and a strong bullish reaction followed.
Above, you can see a perfect horizontal resistance level that was respected 2 time in a row in the recent past.
Support and resistance levels that I showed you are truly significant.
But, trading more than 9 years, I realized that the historic reaction of the market to a key level is not enough to make it reliable.
I found one more important condition that strengthen a key level - a market trend.
We will trade only supports that align with the market trend, meaning that we buy from such a support, if only the market is trading in a bullish trend.
In the example above, NZDUSD is trading in a clear bullish trend on a daily. If we buy the market from the underlined support level, we will take a trend-following trade.
That will be the best support level for buying the market from.
We will trade only the resistances that align with the market trend.
It means that we will sell from the resistance, only if the market is trading in a bearish trend.
Look at AUDUSD on a daily. The pair is trading in a bearish trend.
The resistance that I underlined will be valid for selling from, because shoring from that, we will trade with the trend.
Please, realize that if you sell the market that is in an uptrend from a resistance level, you will go AGAINST the trend. The probabilities of winning such a trade will always be lower.
You can see the EURNZD went through a resistance level, completely neglecting that, because the market trend was bullish.
Buying a key support in a bearish trend, we will take a trade against the trend. Such trades always have lower accuracy.
A key support on EURCAD was easily broken because the market was trading in a bearish trend.
Now, let's discuss th e entry point, stop loss placement and target selection.
Once you identified a key resistance in a bearish trend, set a sell limit order on that.
On EURGBP, the market is trading in a bearish trend on a daily.
We see a significant resistance that meets our criteria.
We should set a sell limit order on that.
Stop loss for the trade will be 0.5 ATR.
I simply take the default ATR settings with 14 Length.
In our example, ATR is 27 pips.
Our stop loss for the trade will be 14 pips above the entry level.
Take profit for the trade will be the closest support.
Here is the closest support that I spotted on EURGBP. It will be our TP level.
You can see that the market perfectly reached the target.
Once you identified a key support in a bullish trend, set a buy limit order on that.
I see a perfect daily key support on EURJPY pair.
The market is trading in a strong uptrend.
A buy limit order should be set on that level.
Stop loss for the trade will be 0.5 ATR.
ATR is 139 pips.
Our stop loss will be 70 pips.
Take Profit will be the closest daily resistance.
311 pips of profit were made.
Market trend is always your friend .
The rule to trade support and resistance levels only in the side of the trend is very simple, but many newbie trades neglect that, and lose a lot of money.
Try this support and resistance strategy, back test it on different forex pairs and let me know your results.
Thanks for reading!
❤️Please, support my work with like, thank you!❤️
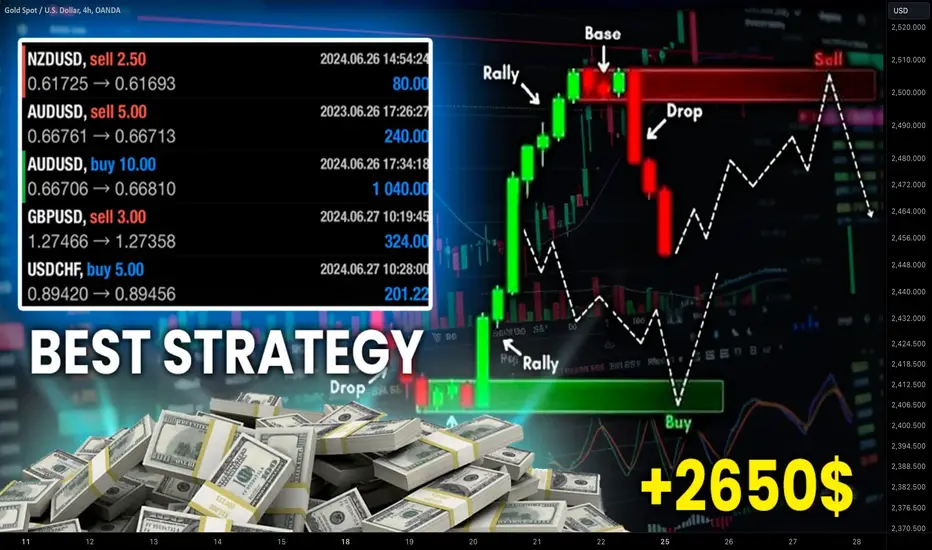
How to Spot Crypto Gems & Sleeping Giants Before Their Big PumpEveryone wants to be the genius who snagged Bitcoin BTCUSD at $1 or scooped up Ethereum ETHUSD when it was cheaper than your morning latte. Spotting a crypto gem before it rockets to the moon is the holy grail of digital asset trading, a pursuit that blends Sherlock Holmes-level detective work with a pinch of gambling spirit.
Before you dive into the crypto rabbit hole armed with little more than Twitter/X tips and Reddit whispers, let’s talk strategy. Because while you might get lucky chasing the next moonshot, a structured approach will give you far better odds. Let’s break it down 🤸♂️.
What Exactly Is a “Crypto Gem”?
First, let’s define the term. A crypto gem (or a sleeping giant) is not just any token with a buzz around it or an active Telegram group with “early adopters.” In a nutshell, it’s a project with solid fundamentals, a strong community and the potential to deliver real-world utility or disrupt an existing market. Think of it as a startup stock with global access, high risk and the potential for astronomical returns—assuming it doesn’t implode under its own hype.
Spotting one in the vast sea of cryptocurrencies requires more than just coffee-fueled optimism and good vibes. You’ll need a keen eye, a skeptical mindset and the ability to tune out the noise of endless shilling.
Step One: Research the Team Behind the Token
When it comes to crypto, the team is almost everything. This isn’t just about having developers with LinkedIn profiles full of buzzwords; it’s about real-world credibility.
Are they public and transparent? Anonymous developers might sound edgy, but they’re also a flight risk. Google “rug pull” if you need a refresher on why trust matters.
Do they have experience in blockchain, fintech or relevant fields? A team with Silicon Valley cred or a history of building successful projects in tech (or even better—Big Tech) is a big green flag.
Are there notable backers? Big-shot venture capital firms like a16z lend credibility. That said, even legends like Sequoia Capital got burned by FTX, so don’t let big names be your only criteria.
Step Two: The Whitepaper—Your Cheat Sheet
Think of the whitepaper as the project’s pitch deck, manifesto and homework assignment rolled into one. A good whitepaper will answer three critical questions and a great one won’t let you fall asleep before you finish it:
What problem is the project solving? No one needs another tokenized version of something that already exists. Look for innovation, not replication.
How does the technology work? You don’t have to be a blockchain engineer, but if the tech sounds like sci-fi or is overly vague, it might be all smoke and no fire.
What’s the roadmap? This is big—promises of “future features” without timelines or specifics are red flags. A realistic, actionable plan is what you want.
Pro tip: If the whitepaper reads like it was run through Google Translate three times, run. Or if it reads dry, dull and plain boring, it might’ve been churned out by none other than OpenAI’s chatbot ChatGPT. In this case, also run.
Step Three: Community and Hype—The Double-Edged Sword
The crypto community is both its greatest strength and its Achilles’ heel. A strong, engaged community can help drive adoption but blind hype can also inflate worthless projects.
Check social media channels. Look at the size and engagement of the community. Thousands of followers mean nothing if they’re all bots.
Beware of echo chambers. If every post is a variation of “TO THE MOON 🚀,” you’re probably dealing with a FOMO factory rather than a serious project.
Gauge the vibe. Are people discussing real use cases, or is it all price speculation? Thoughtful discussions are a green flag.
Step Four: Tokenomics—Follow the Money
Tokenomics is the economic blueprint of a cryptocurrency. It answers key questions about supply, demand and utility and helps you understand where the crypto belongs. Is it memecoin or a DeFi token ? Or maybe something else ?
What’s the total supply? A limited supply can create scarcity (à la Bitcoin), but infinite supply tokens often struggle to maintain value.
What’s the circulating supply? Tokens locked up in vesting schedules or owned by the team can flood the market later, tanking the price.
How is the token used? If the token has no clear utility, it’s just Monopoly money with better branding.
Bonus points for projects that have thought about deflationary mechanisms, staking rewards, or other incentives for holding the token long-term.
Step Five: Partnerships and Real-World Applications
You know what’s better than promises? Receipts. Partnerships with established companies, platforms, or organizations lend credibility and show that the project is more than just a good idea on paper.
Is the project solving real problems? A blockchain that speeds up supply chain logistics or enables decentralized finance for underserved communities has a tangible use case.
Are there active collaborations? Look for integration with existing platforms, APIs, or other cryptocurrencies.
Do the partnerships drive adoption? True partnerships should go beyond brand association and actively expand the project’s user base, utility, or reach.
The Red Flags You Can’t Ignore
Now that you know what to look for, let’s talk about what to avoid. Some warning signs are so obvious they might as well be written in neon:
Overpromising. Claims of “guaranteed profits” or “the next Bitcoin” are the crypto equivalent of snake oil.
Poor transparency. If the team, roadmap or financials are vague, think twice before you make your move.
Lack of progress. If a project has been “in development” for years with nothing to show, you’re most likely looking at vaporware.
The Role of Timing
Spotting a gem isn’t just about finding a good project—it’s about finding it at the right time, before the pack. Ideally, you want to enter before the masses catch on but after the project has proven its viability. Pre-launch phases and early adoption stages often offer the best opportunities.
To borrow a quote from hedge fund boss David Tepper: “I am the animal at the head of the pack. I either get eaten or I get the good grass.”
That said, even if you manage to find that one true gem, it might take years for its potential to unfurl and take you to the moon. On another note, something fundamental might go wrong along the way—the project might change course and abandon its original mission, vision and goals.
Wrapping It All Up
Spotting a crypto gem before it hits the moon is hard work. And it mostly comes down to hours and hours of preparation, research and analysis before you hit the exchange and grab the coin.
Also, not every gem will be a 100x moonshot, and that’s okay. Just make sure you set your priorities straight and align your expectations to the most volatile market out there.
So, what’s your crypto gem you wanna tell us about? Or you’re still looking for it? Share your thoughts and tips in the comments—let’s uncover the next moonshot together!
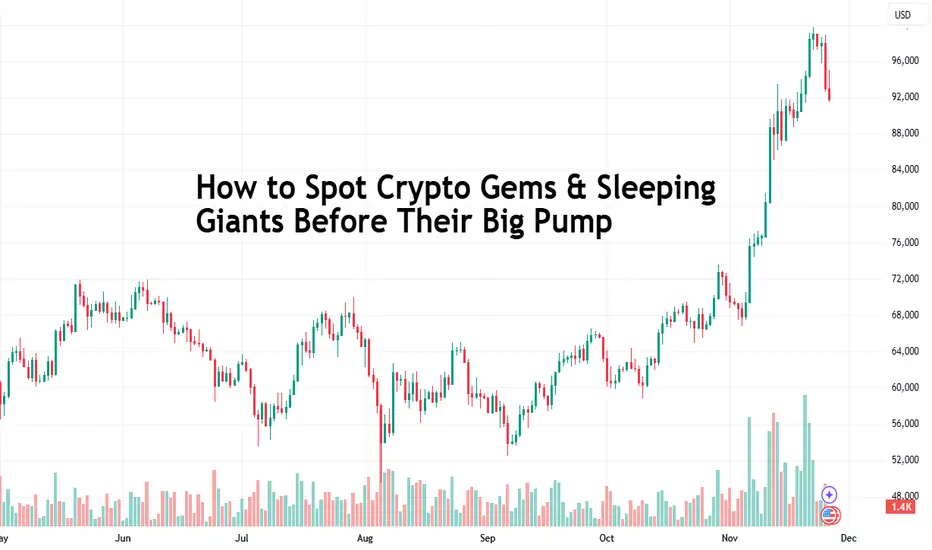
How To Setup Your TradingView RightHey,
In this video I show you how my charting setup looks like.
I use the monthly, weekly, daily time-frames in one layout.
I use the 4hour and 1hour time-frame in my other layout.
Then I show you everything I trade for FX in my watch list.
Then I show you my crypto and stock market watch list.
Kind regards,
Max

Quantum Mechanics & Market Behavior At this stage of my research, I would like to share the primary inspirations behind my style of analysis. As you've already noticed, I don’t create forecasts, as they are subjective and inherently disconnected from the objective nature of markets. Instead, I focus on predictions grounded in the captured dynamics of market behavior in order to actually get closer to its causality.
"QUANTUM MARKET"
In the unpredictable world of trading, price action often mirrors the strange principles of quantum mechanics. Concepts like wave function collapse, entanglement, chaos theory, the multiverse, and even the double-slit experiment provide a unique lens to understand why markets behave as they do—particularly when they defy the majority of forecasts and move in unexpected directions.
The Collapse of the Market Wave Function
In quantum mechanics, a particle exists in a state of possibilities described by its wave function until it is measured. When observed, the wave function "collapses" into one definite outcome. Similarly, in markets, price exists as a spectrum of probabilities, influenced by fundamental data, sentiment, and technical levels. These probabilities reflect the collective forecasts of traders, analysts, and institutions.
The "collapse" of the market wave function can be likened to the moments when price unexpectedly moves against the prevailing sentiment, proving the majority wrong. For instance, when experts predict a bullish breakout, only for the market to reverse sharply, it resembles the moment a quantum system resolves into a state that surprises its observers.
This metaphor highlights the fragile relationship between market expectations and actual outcomes. Just as the act of measurement influences a quantum system, the collective observation and positioning of traders directly impact market movements.
The Multiverse of Price Action
The Many-Worlds Interpretation (MWI) of quantum mechanics posits that every possible outcome of a quantum event occurs, creating branching universes for each scenario. This offers a useful metaphor for the multiverse of market possibilities, where price action simultaneously holds countless potential paths. Each decision by traders, institutions, and external forces influences which path the market ultimately "chooses," much like the branching of quantum states into separate realities.
When the market takes an unexpected turn, it can be thought of as moving into a "branch" of the multiverse that was previously considered improbable by the majority. For example:
A widely anticipated bullish breakout may fail, with the price collapsing into a bearish reversal. This outcome corresponds to a "parallel universe" of price action where the market follows a path contrary to the consensus. When they say market has its on path, chances are they're definitely referring to approach from Fractal Market Hypothesis.
The moment traders observe the market defy expectations, their reality shifts into this new "branch," leaving the discarded probabilities as theoretical relics.
While traders only experience one "reality" of the market—the observed price movement—the multiverse perspective reminds us that all potential outcomes coexist until resolved by market forces.
Chaos Theory: The Hidden Order Behind Market Behavior
Markets may appear chaotic, but their movements are not entirely random. Instead, they follow principles reminiscent of chaos theory, where complex systems display patterns that arise from underlying order.
In trading, this hidden order emerges from the entanglement of price action—the intricate relationship between buyers, sellers, sentiment, and external events. Counter-oscillations of opposing forces, such as bullish and bearish sentiment that has stake in patterns. When these forces reach a critical point, they can produce dramatic reversals or breakouts.
A fascinating aspect of this hidden order lies in the measurement of cycle intervals, which can decrypt the path and stops of price action. These intervals, often influenced by Fibonacci ratios, reflect the inherent chaos of the market while maintaining a surprising consistency. In chaotic systems, the ratios of results inherit the domestic chaos properties of the system itself. This means the measured intervals not only explain past behavior but also project future movements, where price has no option but to adhere to the golden ratio in its path, regardless of direction.
Tools like Fibonacci Channels on TradingView combine these ratios with the angle of the trend, revealing fractal-based timing measurements that highlight potential trend shifts. These tools demonstrate how price action, driven by the chaotic yet structured forces of the market, aligns with these self-similar patterns over time.
Entanglement and the Double-Slit Experiment in Markets
Einstein described quantum entanglement as "spooky action at a distance," where the state of one particle instantaneously influences another, no matter how far apart they are. Markets also mirror another iconic quantum experiment: the double-slit experiment, which demonstrates how particles behave as waves when unobserved but collapse into definitive points when measured.
In the double-slit experiment, an electron passes through two slits, existing as a wave of probabilities until observed. Without observation, it creates an interference pattern, suggesting it travels through both slits simultaneously. However, when measured, the electron collapses into a single state, taking a definitive path through one slit and landing at a specific spot on the detector.
Price action behaves in a strikingly similar way. Just as an electron "feels" it is being observed and alters its behavior, ongoing price action appears to respond to the collective observation of millions of traders. Despite this intense scrutiny, price action frequently surprises both bulls and bears, defying expectations as if reflecting the duality of probability and definitiveness.
When unobserved or in a state of uncertainty, markets exhibit wave-like behavior, oscillating between potential paths. Trends consolidate, creating a balance of opposing forces. However, as traders act on their observations—placing bets, setting stop losses, or predicting breakouts—price "collapses" into a definitive state, choosing a path that often defies the collective expectations of the market.
Logical Deductions
Understanding the market through the lens of quantum mechanics, chaos theory, and the multiverse offers valuable insights for traders:
Expect the Unexpected: Just as a quantum particle's state cannot be precisely predicted, markets are inherently probabilistic. Even the most widely expected outcomes can collapse under the weight of unforeseen variables or simply change of incentive during overheat volatility.
Beware of Herd Mentality: When the majority aligns behind a forecast, the market becomes entangled in their collective assumptions. This might create conditions for a dramatic reversal, much like how a quantum system shifts into an unanticipated state.
Recognize Counter-Oscillations: Price action is driven by the push and pull of opposing forces. Trends often mask the tension beneath, and understanding these dynamics can help traders anticipate critical turning points.
Measure Cycles with Ratios: Fibonacci-based tools, when combined with trend angles, reveal fractal rhythms and the frequency of reversals. These measurements help traders predict price shifts with greater accuracy.
Embrace the Multiverse: Just as the Many-Worlds Interpretation suggests all outcomes coexist until resolved, traders should recognize that multiple possibilities are always present in the market. Being prepared for alternative scenarios helps mitigate risk and improve decision-making.
General Interconnectedness:
Markets are a dynamic interplay of order and chaos, shaped by the entanglement of opposing forces and the constant tension between consensus and contrarian dynamics. The collapse of the wave function—those moments when price defies expert predictions—reminds us of the deep complexities underlying actual behavior of masses.
Through the lens of the multiverse, every market outcome can be seen as a branching reality, where the price action we observe is just one of many potential paths. By embracing this perspective, traders can better navigate the intricate dance of probabilities and entanglement, understanding that markets are not linear systems but ever-changing, interconnected realities. This mindset empowered me to thrive in the environment of duality, where adaptability and probabilistic thinking are the actual keys to understanding price mechanism in Financial Markets.
Disclaimer:
You don’t have to accept these observations as true. Always trust your own judgment and cultivate independent thinking. Personally, I find that the behavior of particles at the quantum scale is the closest phenomenon that mirrors the chaos of the market.
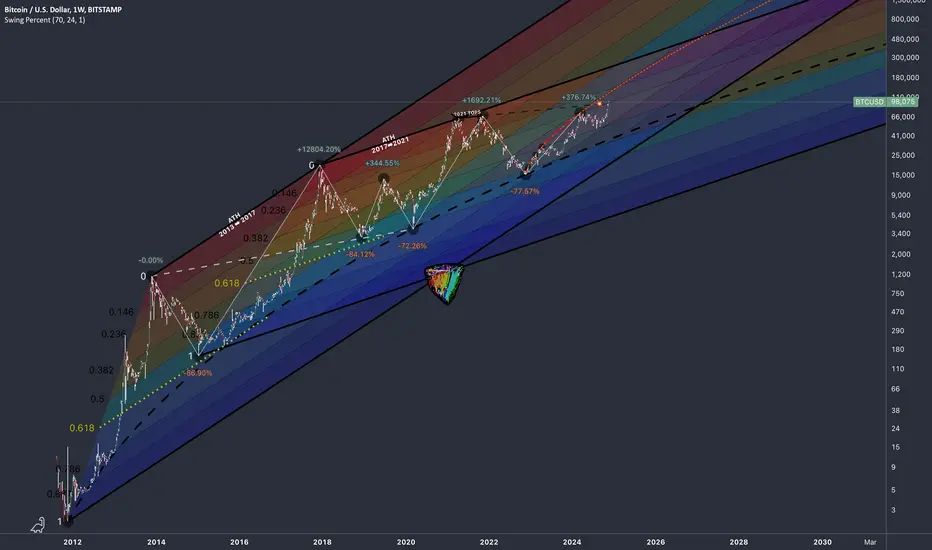
Understanding Leverage in Forex: Steep Risks and Big RewardsLeverage is the not-so-secret sauce to accelerate your gains at breakneck speed or blow up the entire operation if you don’t know what you’re doing (or you just want too much.) It’s a simple concept with profound implications—a multiplier that lets traders control positions far larger than the capital they actually have. Sounds like a dream, right? But in forex , dreams can turn into nightmares faster than you can say “margin call.”
Let’s unravel this seductive, high-stakes game changer.
❔ What Is Leverage?
“We were always leveraged to the hilt when we bought something and ran out of money, we would look at the portfolio and push out whatever appeared to be the least attractive item at that point,” explains Jim Rogers, George Soros’s partner, in Jack D. Schwager’s book “Market Wizards: Interviews with Top Traders.”
At its core, leverage is borrowed capital. When you trade with leverage, you’re essentially using your broker’s money to amplify the size of your position. Let’s say you want to invest $1,000 and use a leverage ratio of 100:1. This means you can control a position worth $100,000. A small 1% movement in your favor equals $1,000 in profit—doubling your initial investment in a single move. Sounds good, doesn’t it?
But here’s the catch: leverage works both ways. A 1% move against you wipes out your entire $1,000. It’s the double-edged sword that can turn modest accounts into heavyweights—or into dust.
🧲 The Allure of Amplified Gains
Forex traders are drawn to leverage like moths to a flame, and for good reason. The ability to turn small price movements into significant profits is exhilarating and means you don’t have to chip in gargantuan amounts of cash to make bank.
In a market where currency pairs often move fractions of a percentage daily, leverage is what makes those movements meaningful. Without it, most traders would struggle to eke out gains worth their time.
Consider a scenario where you’re trading a major currency pair like the EUR/USD . The price moves 50 pips in your favor, and each pip is worth $10 on a standard lot. Without leverage, you might only afford a micro lot, making your profit $5—not exactly a game changer. But with 100:1 leverage, you control a full lot, turning that $5 into $500. Suddenly, your modest deposit has real firepower.
This potential for outsized returns is intoxicating, especially for new traders. But like any powerful tool, misuse can be catastrophic.
💣 The Flip Side: Risks That Loom Large
If leverage is the hero of ever-moving forex trading space , it’s also the villain. For every dollar it helps you earn, it can take away just as quickly. While a 50-pip move in your favor feels like striking gold, the same move against you might be a financial disaster.
Even seasoned traders aren’t immune to the dangers of leverage. The forex market is inherently volatile, with prices influenced by everything from central bank policies to geopolitical tensions. Leverage amplifies these fluctuations, turning minor market noise into account-draining chaos if you’re not prepared.
Here’s the brutal truth: most traders underestimate the risks of leverage. Maybe because it’s so common they’ve gotten used to it. Overleveraging—taking on more risk than your account can handle—is the silent account killer. And it doesn’t take a market meltdown to wreck your balance. A sudden spike caused by unexpected news or a tweet can trigger a margin call, leaving you with nothing but a hard lesson.
🤙 Margin Calls: The Grim Reality
Let’s talk about margin calls, the dreaded phone call (once upon a time) no trader wants to receive—except it’s not a phone call anymore. It’s an automated popup notification from your broker informing you that your account equity has fallen below the required margin. Essentially, you’ve run out of money to sustain your positions and the broker is stepping in to close them before you owe more than your account balance.
This is where overleveraged and undercapitalized traders often meet their doom. A market move that would’ve been a minor setback on a properly sized position becomes a catastrophic loss when leverage is maxed out and equity is dried up. The lesson? Never let your enthusiasm for big trades overshadow your need for risk management.
🎯 Mastering Leverage: The Balanced Approach
Leverage isn’t inherently bad—it’s neutral. Like any tool, its impact depends on how it’s used. Successful traders respect leverage. They don’t treat it as a shortcut to riches but as a calculated risk multiplier.
Risk management is the cornerstone of surviving—and thriving—in a leveraged environment. This includes using stop-loss orders to limit potential losses, never risking more than an acceptable percentage of your account on a single trade and maintaining sufficient margin to weather market fluctuations.
And let’s not forget the importance of choosing the right leverage ratio. Many brokers offer leverage as high as 500:1, but that doesn’t mean you should take it. A lower ratio, like 10:1 or 20:1, gives you more breathing room and reduces the chances of wiping out your account. And if you decide to go for the upper echelons of leverage, say 100:1, then you should consider scaling down your positions to get that same breathing room.
🤔 The Psychology of Leverage
Leverage does more than magnify financial outcomes; it amplifies emotions too. The thrill of quick profits can lead to overconfidence, while the fear of losses can paralyze decision-making. Understanding your psychological tendencies is crucial when trading with leverage.
Patience and discipline are your best allies. Stick to your trading plan, avoid impulsive decisions, and don’t let the lure of high leverage cloud your judgment. The goal here isn’t just to make money once or twice—it’s to stay in the game for as long as possible.
So, how do you handle leverage? Are you the as-good-as-your-last-trade trader or you’re the more cautious, risk-averse type? Comment below and let’s spin up the discussion!
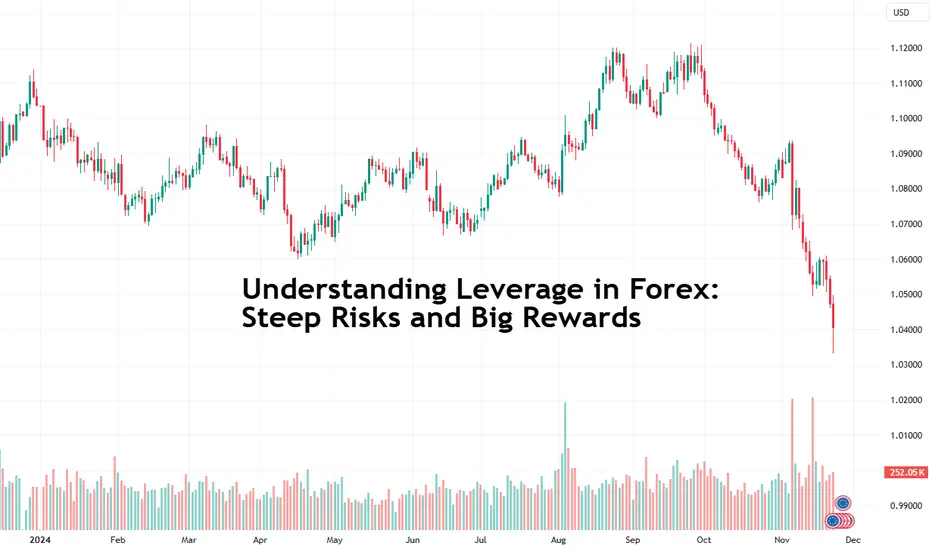
Dynamic Relationship Between Bitcoin and CoinbaseGreetings, esteemed readers. Today, we shall delve into the profound and intricate relationship between Bitcoin and Coinbase. It is my earnest hope that you will find this discourse both enlightening and engaging.
The Interdependence of Coinbase’s Equity Valuation and Bitcoin’s Market Dynamics-:
The nexus between Coinbase's stock performance and Bitcoin's market valuation offers a compelling illustration of the interplay between cryptocurrency markets and traditional equity spheres. As one of the preeminent cryptocurrency exchanges, Coinbase's financial trajectory is inextricably linked to Bitcoin's price fluctuations and the broader crypto milieu. This symbiosis stems from Coinbase's operational foundation and the intricate financial mechanisms tethering the two.
1. Coinbase’s Revenue Architecture-:
Coinbase accrues its income predominantly from transaction fees, custodial services, and auxiliary crypto-related operations. A substantial portion of its revenue model hinges on trading volumes, which are profoundly influenced by the oscillations in Bitcoin’s valuation and the crypto market’s inherent volatility.
Ascendant Bitcoin Valuations: An upward trajectory in Bitcoin's price galvanizes retail and institutional investor interest, catalyzing heightened trading activity on Coinbase’s platform. This surge amplifies revenue inflows and, by extension, bolsters the company’s stock performance.
Depressed Bitcoin Valuations: Conversely, during bearish market phases or periods of price stagnation, trading activity tends to wane, thereby contracting revenue streams and exerting downward pressure on Coinbase’s share price.
2. Correlative Dynamics Between Bitcoin and Coinbase Equity-:
Empirical evidence suggests a pronounced positive correlation between Bitcoin’s price dynamics and Coinbase’s share valuation. Robust Bitcoin performance often translates to multifaceted benefits for Coinbase:
Enhanced Trading Volumes: Bullish Bitcoin trends entice heightened investor activity, resulting in elevated transaction frequencies.
Augmented Market Optimism: An appreciating Bitcoin price engenders a more sanguine market sentiment, which is advantageous to entities like Coinbase that are emblematic of the cryptocurrency sector.
Institutional Engagement: Bull markets in Bitcoin invariably attract institutional capital, with regulated exchanges such as Coinbase serving as their primary operational venues.
3. Volatility as a Revenue Catalyst-:
Bitcoin’s price volatility is a pivotal determinant of Coinbase’s financial outcomes. Volatility, irrespective of its directional bias, acts as a stimulant for trading activity:
Intensified Volatility: Sharp fluctuations in Bitcoin's valuation—whether upward or downward—propel trading volumes, thereby amplifying Coinbase's revenue streams.
Muted Volatility: Periods of relative price stability often precipitate a diminution in trading activity, adversely impacting Coinbase’s revenue generation and share valuation.
4. Exogenous Influences on the Bitcoin-Coinbase Nexus-:
While Bitcoin serves as a cornerstone for Coinbase’s financial performance, other variables also modulate this interconnection:
Cryptocurrency Ecosystem Trends: The valuation and trading activity of other significant cryptocurrencies, such as Ethereum, exert ancillary influences on Coinbase’s revenue architecture.
Regulatory Shifts: Alterations in regulatory landscapes can simultaneously affect Bitcoin’s valuation and Coinbase’s operational framework.
Firm-Specific Developments: Strategic initiatives, partnerships, and financial disclosures unique to Coinbase may engender deviations in its stock performance independent of Bitcoin’s market trends.
5. Risks in the Symbiosis-:
The dependence of Coinbase’s equity on Bitcoin’s performance is fraught with risks:
Bitcoin-Centric Exposure: The firm’s disproportionate reliance on Bitcoin-centric revenues exposes it to market downturns and regulatory adversities.
Competitive Pressures: The proliferation of alternative cryptocurrency exchanges threatens to erode Coinbase’s market share, diminishing its revenue potential even amidst Bitcoin bull markets.
Regulatory Vulnerabilities: Both Bitcoin’s valuation and Coinbase’s operations remain susceptible to abrupt regulatory shifts, which could destabilize their interdependence.
6. Prognostications for the Future-:
As the cryptocurrency domain matures, the interplay between Bitcoin and Coinbase may undergo recalibration:
Revenue Diversification: Coinbase’s foray into staking, institutional services, and NFTs aims to mitigate its dependency on Bitcoin-driven revenues.
Institutionalization of Crypto: The progressive institutional adoption of cryptocurrencies could stabilize Coinbase’s revenue streams.
Market Equilibration: The maturation of the cryptocurrency ecosystem might temper Bitcoin’s extreme price oscillations, leading to a concomitant stabilization in Coinbase’s equity performance.
Conclusion-:
The intrinsic linkage between Coinbase’s share valuation and Bitcoin’s market dynamics is both potent and multifaceted. While this connection offers substantial growth opportunities, it also entails significant vulnerabilities. As Bitcoin maintains its preeminence within the crypto sector, Coinbase’s strategic initiatives to diversify its offerings may gradually attenuate its reliance on Bitcoin. Nonetheless, for the foreseeable future, Bitcoin’s price trajectory will remain a critical bellwether for Coinbase’s equity performance.
Best Regards- Amit
Hope you like this publication.

EUR/USD and the Fakeout Swing Reversal PatternThe Fakeout Swing Reversal pattern is a straightforward and robust candle pattern that has stood the test of time. In this analysis, we’ll explore how the pattern has recently appeared on EUR/USD’s daily candle chart, examining both its successes and failures while identifying the key factors that influence its performance.
What is the Fakeout Swing Reversal Pattern?
The Fakeout Swing Reversal pattern is a technical setup that captures moments when price fakes a breakout beyond a key swing high or low, only to sharply reverse. This pattern is particularly effective when the fakeout occurs within two candles, signalling that the market’s initial push was unsustainable and trapping traders on the wrong side.
Bullish Scenario:
The bullish Fakeout Swing Reversal begins with price breaking below a key swing low, seemingly triggering a downside move. However, within one or two candles, the price sharply reverses and closes back above the swing low, signalling a potential upward reversal. The psychology here lies in trapping short sellers who entered on the perceived breakout, forcing them to cover as buyers regain control.
Bearish Scenario:
In the bearish version, the price breaks above a key swing high, appearing to continue an uptrend. Yet, within one or two candles, it reverses and closes back below the swing high, indicating bearish momentum as long traders scramble to exit.
Fakeout Swing Reversal Pattern: EUR/USD Daily Candle Chart
Past performance is not a reliable indicator of future results
Key Elements for Execution
• Entry Trigger: Traders typically enter after the reversal candle closes, confirming the fakeout.
• Stop Placement: Stops are often placed just beyond the extreme of the fakeout candle, keeping risk tightly managed.
• Targets: Initial targets may be the midpoint of the prior range or a key support/resistance level, with traders adjusting based on market conditions.
Successful and Failed Signals: A Reality Check
No pattern works flawlessly every time, and the Fakeout Swing Reversal is no exception. Successful signals offer strong potential, but managing failed trades is equally, if not more, critical. How you handle losses defines your trading discipline and long-term success.
On EUR/USD’s recent daily chart, we can identify several instances of this pattern, showcasing its effectiveness in both bullish and bearish scenarios. Some of these signals led to rewarding reversals, while others quickly invalidated, reminding us of the need for a clear plan to handle both outcomes.
Examples: EUR/USD Daily Candle Chart
Past performance is not a reliable indicator of future results
Factors Influencing the Pattern's Effectiveness
Several elements impact the success of the Fakeout Swing Reversal pattern:
1. Momentum Leading into the Test: Strong momentum approaching the swing high or low can increase the likelihood of a breakout.
2. Strength of the Fakeout: A sharp rejection after the breakout adds credibility to the reversal.
3. Prevailing Trend: Patterns aligned with the long-term trend often have a higher probability of success.
Managing Trades: Cutting Losers and Letting Winners Run
Cutting Losers Early: When this pattern works, it tends to work quickly, so if the reversal doesn’t play out promptly, consider exiting early. By cutting losers short, you keep the size of your average losing trade small, preserving capital for better opportunities.
Letting Winners Run: Reversal trades inherently go against short-term momentum, making it challenging to let winners run. However, traders can manage this by taking partial profits at key levels and moving their stops to break even. This approach protects gains while allowing the trade room to capitalise on a sustained move.
By understanding the nuances of the Fakeout Swing Reversal pattern and applying disciplined risk management, traders can add a robust swing trading strategy to their trading arsenal.
Disclaimer: This is for information and learning purposes only. The information provided does not constitute investment advice nor take into account the individual financial circumstances or objectives of any investor. Any information that may be provided relating to past performance is not a reliable indicator of future results or performance. Social media channels are not relevant for UK residents.
Spread bets and CFDs are complex instruments and come with a high risk of losing money rapidly due to leverage. 82.67% of retail investor accounts lose money when trading spread bets and CFDs with this provider. You should consider whether you understand how spread bets and CFDs work and whether you can afford to take the high risk of losing your money.