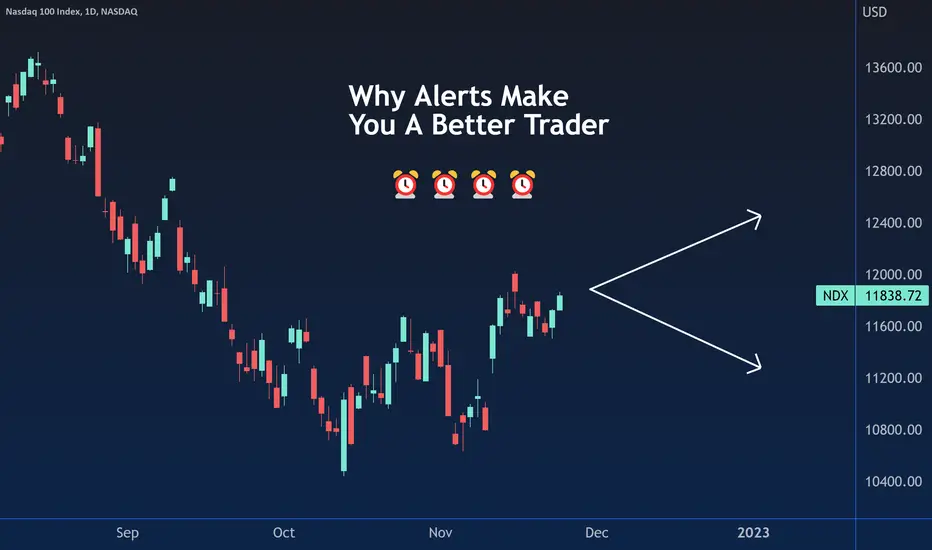
Alerts: 3 reasons they can make you a better traderHey Everyone! 👋
We hope you’re enjoying Black Friday week and have helped yourself to some of the great discounts we are offering. We only do this once a year, so it really is the best time to get a plan!
Now, let’s jump into today’s topic: Alerts .
While alerts have a ton of potential applications when it comes to trading, they are often underutilized because it can take some time and ingenuity to build a system where they can work well. Let's take a look at some reasons that that investment is well worth it .
1. They can help build good habits 💪
Stop us if this sounds familiar: you hear an awesome investment story, and then immediately go out in the market and purchase the asset, with no plan in place.
While this can work, it’s not a great strategy for long term success, because in reality it can be extremely hard to sit in that position without a plan and trade it efficiently. You may choose to exit the position based on nothing more than momentary greed or fear, and moves like that can prevent consistency and long-term profitability.
Alerts are great because they can take out the guesswork of entering and exiting a position. Simply set alerts for the prices you would like, then place a trade if, and only if, the conditions are met. Then, let the market do its thing and let the probabilities work in your favor.
Alerts can turn the experience of trading from a constant search for ideas - and always feeling behind - into a relaxing job of waiting for your own pre-approved conditions to trigger before taking action. In short, alerts can make you much more well prepared for the market’s ups and downs.
2. They increase freedom and reduce anxiety 🧘
There is a well-known maxim in trading and in life that states that negative emotions are felt twice as strongly as positive emotions. This factoid has lots of applications, but it can be especially useful to understand as a trader.
Consider the following investors:
A dentist who checks quarterly reports from his brokerage
A position trader who checks his positions once a month
A swing trader who checks his positions once a week
A Day trader who checks his positions once a day, if not more
Given the natural volatility that markets experience, which market participant is least likely to be mad or upset? The dentist. Why? Because he is receiving less data points from the market. Even world class day traders are exposed to tens or hundreds of negative situations in their positions on a day-to-day basis as a result of volatility, which they cannot control. This level of negative stimulation can reduce mental health and trading effectiveness.
Alerts allow well prepared traders with some edge to step back from the markets and allow the trades to come to them.
3. Our alerts don’t let anything fall through the cracks ✅
While the previous two points are benefits when it comes to price alerts, our alerts also step the game up considerably when it comes to user utility. Once you have setups that you like to trade, you can set alerts on trendlines, technical indicators, customizable scripts, and so much more, so you can ensure that your favorite setups aren’t being missed.
This can be as simple as a long-term investor setting RSI alerts on Dow 30 stocks, in order to buy dips in strong names, to as complex as an intraday futures spread scalper setting alerts for pricing inefficiencies within his top 40 contracts.
Our customizable alerts can really allow well organized traders to capture every opportunity as they see it.
And there you have it! 3 reasons to take advantage of alerts, and all of the awesome benefits they bring.
Thanks for reading and stay well!
Love,
Team TradingView ❤️❤️
Community ideas
Celebrating 50 Years of Financial FuturesThis is a Thanksgiving Special Report.
Swiss Franc ( CME:6S1! ), Canadian Dollar ( CME:6C1! ), Japanese Yen ( CME:6J1! ), British Pound ( CME:6B1! ), Mexican Peso ( CME:6M1! )
In May 1972, International Monetary Market (IMM), a division of the Chicago Mercantile Exchange (CME), launched futures contracts on seven currency pairs. This was the world’s first financial futures instrument, a futures contract based on something other than physical commodities.
What has made a Midwestern Exchange, known mainly for its Pork Bellies contract, a frontrunner in financial innovation?
Bretton Woods System and its Collapse
At the end of World War II, the United States and its allies created the Bretton Woods System. Essentially, it was a global monetary system governed by fixed currency exchange rates. The US dollar was backed by gold, at a fixed rate of $35 per troy ounce. Other currencies were pegged to the U.S. dollar. In 1955, one dollar was exchanged for 0.3572 British Pound, 4.2 Deutsch Mark, 3.3 France Franc, 0.986 Canadian Dollar, 360 Japanese Yen, 625 Italy Lire, etc.
Each country was responsible for maintaining its exchange rate within 1% of the adopted par value by buying or selling foreign reserves when necessary. The U.S. was responsible for maintaining the gold parity. Its big commitment was allowing anyone with $35 to exchange for an ounce of gold at the US Treasury window.
As global inflation rose sharply in the 1970s, many countries could not maintain the official peg. They responded by redeeming dollars for gold at the US Treasury window.
With US gold reserve depleting rapidly and a gold run looming, in August 1971, President Richard Nixon announced the "temporary" suspension of the dollar's convertibility into gold. This marked the breakdown of the Bretton Woods. Central banks around the world were no longer obligated to peg their exchange rates to the US dollar.
Leo Melamed and Milton Friedman
With fixed rates, there was no exchange rate risk in international trade. However, flowing rate exposes importers and exporters to significant uncertainty to the amount of dollar or foreign currency they will receive or are obliged to pay for.
Since its founding in 1898, CME has been the place where producers, processors, merchants, and commercial users come together to hedge price risks for a wide range of commodities. Leo Melamed, then Chairman of the CME, was convinced that the futures market is the solution to tackle the rise in exchange rate volatility.
Leo set up an International Monetary Market division within the CME and prepared for new futures contracts derived from foreign exchange rates. Initially, this breakthrough idea found no friends on Wall Street. According to Leo, one investment bank president tossed it out saying he didn’t want the Chicago “Pork Belly Shooters” to contaminate the FX market.
Leo met with Milton Friedman, a well-respected economics professor at the University of Chicago. Milton fully supported the ingenious design and published a feasibility study, “The Need for Futures Markets in Currencies” in 1971.
Milton Friedman (1912-2006) won the Nobel Prize in Economic Science “for his research on consumption analysis, monetary history and theory and the complexity of stabilization policy” (the Nobel Committee).
This changed everything. When Leo went to Washington to lobby the idea of listing foreign exchange futures, Treasury Secretary George Shultz said, “If it’s good enough for Milton, it is good enough for me.”
George Shultz (1920-2021) served as Secretary of State in the Regan Administration and as Treasury and Labor Secretary under Richard Nixon. He was also the Dean of Graduate School at the University of Chicago, and a good friend with Milton Friedman.
If you are interested in the story of FX futures, you may find it online and at Leo’s 1996 memoirs, “Escape to the Futures”.
Foreign Exchange Futures
On May 16, 1972, IMM simultaneously launched seven futures contracts based on the US dollar exchange rates to British Pound ( CME:6B1! ), Japanese Yen ( CME:6J1! ), Canadian Dollar ( CME:6C1! ), Swiss Franc ( CME:6S1! ), Mexican Peso ( CME:6M1! ), Deutsch Mark and Italy Lira.
Five of those original FX contracts are still actively trading at the CME. Deutsch Mark and the Lira have been delisted since Germany and Italy joined the Euro currency. The new contract, Euro/USD FX ( CME:6E1! ), becomes the most active CME FX future contract.
FX contracts saw exponential growth in trading volume in the next fifty years. In the first 9 months of 2022, average daily volume for all FX futures and options reached 983,000 lots, according to the CME Group. On November 15th, Euro FX alone traded 359,000 lots and had an open interest of 683,293 contracts.
My writings on TradingView include a number of trade ideas on FX futures contracts. Please take a look if you haven't yet.
FX Futures were the start of a “Financial Revolution” in the futures industry. The next few years saw new breeds of futures contracts, including interest rate futures between 1975 and1977 and equity index futures in 1982.
During the holiday season, I would start a series on the leaders and innovators at CME, CBOT and KCBT. They brought GNMA Futures, T-Bill and T-Bond Futures, Eurodollar Futures, Value-Line Index Futures and S&P 500 Futures to life and revolutionize the financial derivatives world as we know it today.
Happy Trading.
Disclaimers
*Trade ideas cited above are for illustration only, as an integral part of a case study to demonstrate the fundamental concepts in risk management under the market scenarios being discussed. They shall not be construed as investment recommendations or advice. Nor are they used to promote any specific products, or services.
CME Real-time Market Data help identify trade set-ups and express my market views. If you have futures in your trading portfolio, check out on CME Group data plans in TradingView that suit your trading needs tradingview.sweetlogin.com

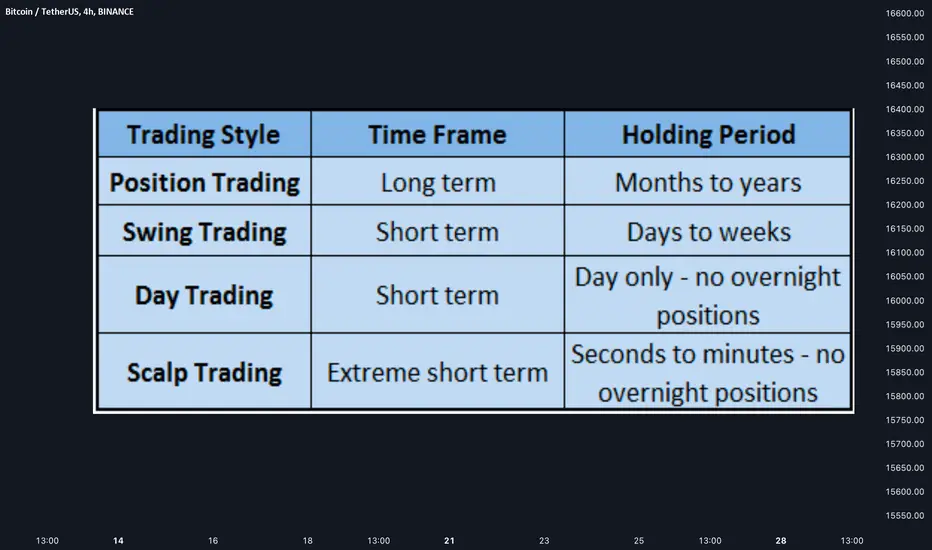
What Are The Pros And Cons of Intraday vs Swing TradingHello traders,
There is not such a good or bad timeframe.
Like cooking, everything depends on how you use the ingredients for your meals.
Intraday timeframes
Pros
Earlier entries
Earlier exits => losers are smaller compared to losers with SWING trades
You make your daily goals earlier
With Intraday trading, we're not impacted by contracts expiration, rollover, over-weekend, overnight fees
It's rarely boring (especially with indices trading)
Leverage isn't needed
Perfect for beginners or small capital
Cons
More in/out entries => you have to enter, exit, enter, exit until the real move happen
You have to be more reactive and accurate when taking a position or exiting.
Swing timeframes
Pros
More time to react and prepare
We don't need to be too accurate with our entries and exits
You're less impacted by news/events/rumours/tweets - They have a real visible impact on intraday but generally don't change a thing for the swing trend
Cons
Bigger drawdown by design
Forces to hold trades over multiple days/weeks.
In a range, we pay a lot in funding/rollover fees before the real move happens.
Being double digits percent down because of fees isn't pleasant.
Big capital required to afford to lose a few percentages sometimes with those trading fees
1 click takes 5 seconds.
Then you wait and wait and wait and wait, and then look on Twitter for ideas to invalidate your entries.
When your favorite guru shares a contrary setup, you follow his/her call and wreck yourself.
You really need patience with SWING trades.
If the patience for you is an issue, I'd stick with Intraday.
Have a great day
Dave
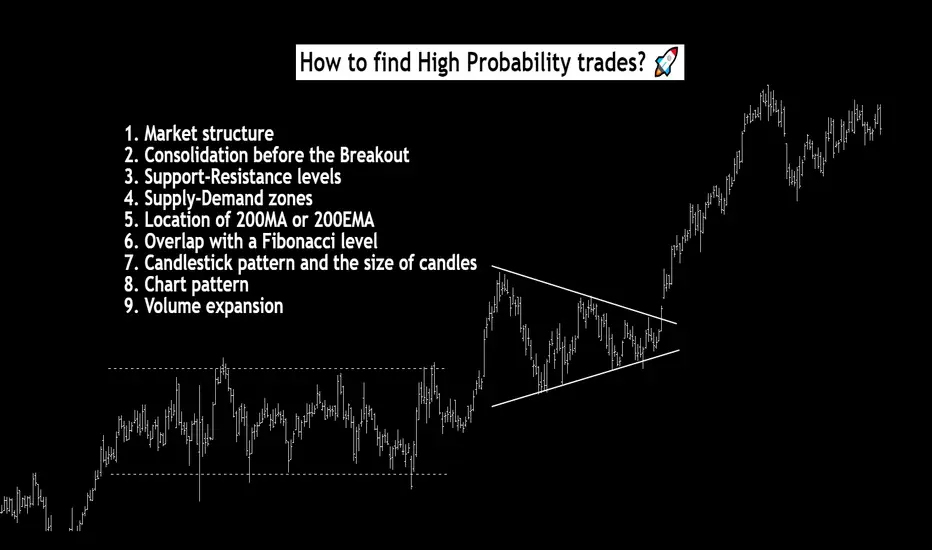
How to find High Probability trades?Hi all, hope you guys are doing well.
In this post, we are going to see how we can combine different indicators/concepts to create confluence zones and find high-probability trades.
Introduction
A trade that has a greater chance of success than a regular trade is called a high-probability trade. Obviously, it's our assumption that some trades have higher chances of success as compared to others because they have more supporting factors. Nevertheless, a high probability trade can also result in a loss.
How to find high-probability trades?
There are a few things that you can observe to find a confluence of various important factors such as a support/resistance level, demand/ supply zone , Fibonacci level, moving averages, volume , RSI , etc.
Depending on your knowledge and trading style, the confluence zone can be derived using a combination of various different concepts or indicators. In this post, I am going to share the factors that I look at for finding good trades.
How to find confluence zones?
In order to find the confluence zones, you need to understand the concepts and the indicators, then combine them together to create the whole picture. It's like building a jigsaw puzzle - first, you need to identify the individual pieces, and then you need to put them together.
Let’s dive into all of these concepts one by one.
1. Market structure
Market structure is simply a basic form of understanding how the markets move. The price action is how the market moves based just on price, without the consideration of trends and how they may continue. But the market structure is focused mainly on the trend.
I have covered market structure in various different threads that you can read here:
a) Introduction to Market structure
b) Bullish market structure
c) Bearish market structure
2. Consolidation before Breakout
If a stock consolidates before giving a breakout, there are higher chances that it will be a true breakout. This is because all the residual supply gets absorbed at the resistance zone and most of the pending demand orders get filled.
Ideally, once a stock goes into consolidation, one of the two processes occurs:
Accumulation
Distribution
In layman’s terms,
- If demand is more aggressive than supply, then the price rallies, which confirms accumulation.
- Similarly, if the supply is more aggressive than the demand, then the price falls down, which confirms distribution.
If you are struggling with identifying the breakouts, be sure to read this post.
3. Support-Resistance levels
S/R levels are critical parts of trend analysis because they are used to highlight important zones. The fact that these levels flip roles between support and resistance can be used to determine the range of a market, trade reversals, bounces, or breakouts. These levels exist due to the influx of buyers and sellers at key junctures.
Flip zone acting as resistance:
Flip zone acting as support:
If you are looking for an in-depth tutorial on support and resistance, please check out my old guide here:
4. Supply-Demand zones
S/D demand zones are one of the most important things that I look at while charting. The stronger the S/D zone, the higher the chances of a reaction. Always look for these zones in the direction of the major trend.
5. Location of 200MA or 200EMA
Always observe the position of 200MA/ EMA with respect to price. Once the price interacts with the moving average, study the reaction. If you are looking for a long trade, then look for a positive reaction as the price reacts with the moving average.
6. Overlap with a Fibonacci level
A lot of times, the price will come back to a Fibonacci level. You need to observe the price behavior near these levels.
If you are not familiar with the Fibonacci tool, please check my old guide on Fibonacci retracement and extension.
7. Candlestick pattern and the size of the candles
The candle spread plays an important role in determining the strength and mood of the underlying trend. In layman's terms, big-bodied candles indicate strength and small-bodied candles act as noise.
In any case, the candlestick pattern and candle spread should only be viewed at an important level. The context plays a crucial role.
8. Chart patterns
This is pretty self-explanatory. If you trade patterns, you can combine them with other factors to strengthen your analysis.
9. Volume expansion
Ideally, at the time of the breakout, the volumes should rise. The volume can be deceiving and we need to see orderflow for a clear picture. Obviously, the majority of us are not looking at the orderflow and hence the volumes can be deceiving. But, for a normal trader, the simple volume indicator is more than enough.
So, these are mainly all of the factors that I look at while analyzing the charts. Please note that the usage of the concepts will vary with charts. Sometimes only 3-4 factors may be at play and the other times, 6-7.
High Probability trade checklist:
1. Market structure
2. Consolidation before the Breakout
3. Support-Resistance levels
4. Supply-Demand zones
5. Location of 200MA or 200EMA
6. Overlap with a Fibonacci level
7. Candlestick pattern and the size of candles
8. Chart pattern
9. Volume expansion
In the example above, you can notice the following things:
1. The market structure was bullish before the breakout, which was evident from the formation of higher highs and higher lows. Don't confuse the internal structure (Low time frame structure) with the external structure (High time frame structure).
2. The price was consolidating in the rectangle / parallel channel for a good amount of time.
3. When the price reached the previous demand zone, the selling pressure started to decrease and the buyers started to step in.
4. When the price interacted with 200MA/ EMA, there was a strong reaction to the upside. This means that the buyers want to take the price higher.
6. The buying interest can be seen by an increase in the volume in the last few sessions before the breakout. The volume can be deceiving and we need to see orderflow for a clear picture. But in general, you do not need to complicate this, just use volumes in conjunction with other factors.
7. We always look for some reversal or indecision candlesticks in the confluence zone. In the chart above, at the point of interaction with the moving average and the demand zone, we can see the formation of exhaustion candles.
Again, we need to look at these patterns only at specific important levels (like support or resistance levels) and disregard the formations in between the levels.
8. When the price broke above the previous major resistance with a massive bullish candle, there was a heavy volume expansion.
More examples:
You can read and revise this post until you understand all the concepts.
Thanks for reading. I hope you found this helpful! 😊
Disclaimer : This is NOT investment advice. This post is meant for learning purposes only. Invest your capital at your own risk.
Happy learning. Cheers!
Rajat Kumar Singh (@johntradingwick)
Community Manager (India), TradingView
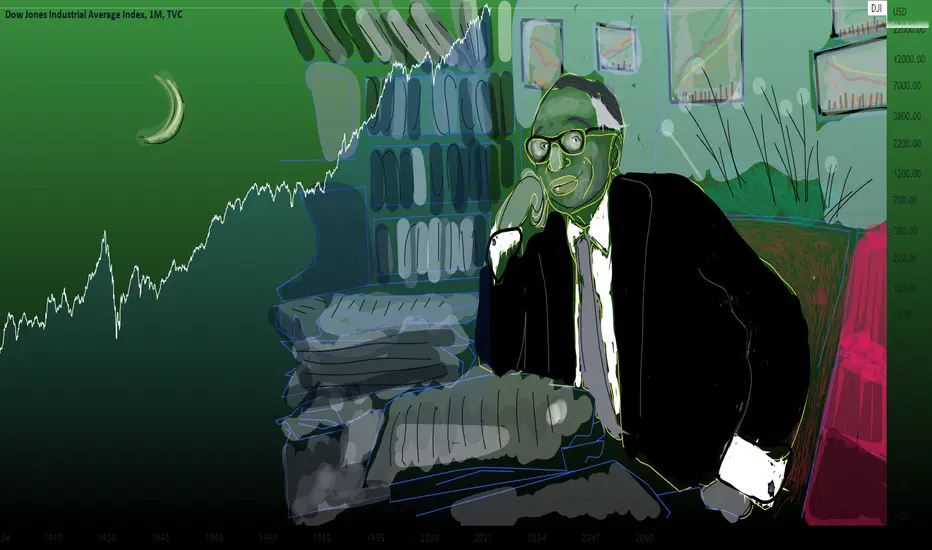
My crazy partner is Mr. Market!We are used to the fact that the world's most prominent investors are known for their outstanding deals, returns and stability of results over a long time horizon. Yes, all this is certainly a sign of excellence, but no investor has gained his popularity through books. The books he wrote.
This man created his writings back in the 1930s and 1940s, but they still inspire anyone who has taken the path of smart stock investing. You've probably guessed by now who we're talking about. It's the humble author of The Intelligent Investor and Warren Buffett's teacher, Benjamin Graham.
It's amazing that after many years, this book is still considered the bible of investing on the basis of fundamental analysis - Graham wrote such a thorough description of how a person investing in stocks should think. His insight into the market can be useful to anyone who is exposed to this chaotic environment.
To understand Graham's philosophy, imagine that the market is your business partner "Mr. Market." Every day he stops by your office to visit and offer you a deal on your mutual company stock. Sometimes he wants to buy your stock, sometimes he wants to sell his own. And each time he offers a price at random, relying only on his gut. When he panics and is afraid of everything, he wants to get rid of his shares. When he feels euphoric and blind faith in the future, he wants to buy your share. That's the kind of crazy partner you have. Why is he acting this way? According to Graham, this is the behavior of all investors who don't understand the real value of what they own. They jump from side to side and do it with the regularity of a "maniac" every day.
The task of the prudent investor is to understand the fundamental value of your business and just wait for another visit from the crazy Mr. Market. If he panics and offers to buy his stock at an extremely low price - take it and wish him luck. If he begs to sell him the stock and calls an unusually generous price - sell it and wish him luck.
Of course, after a while, it may turn out that Mr. Market was not bad at all and made a very profitable deal with you. But the fact is that on the long horizon of time his luck will be washed away by a series of stupid things he will inevitably do. As for you, rest assured that tomorrow you will meet another Mister. So, as Graham has taught us, is teaching us, and will continue to teach us - you just have to be ready for it. Understanding the fundamental value of the company, this meeting will bring you nothing but pleasure!
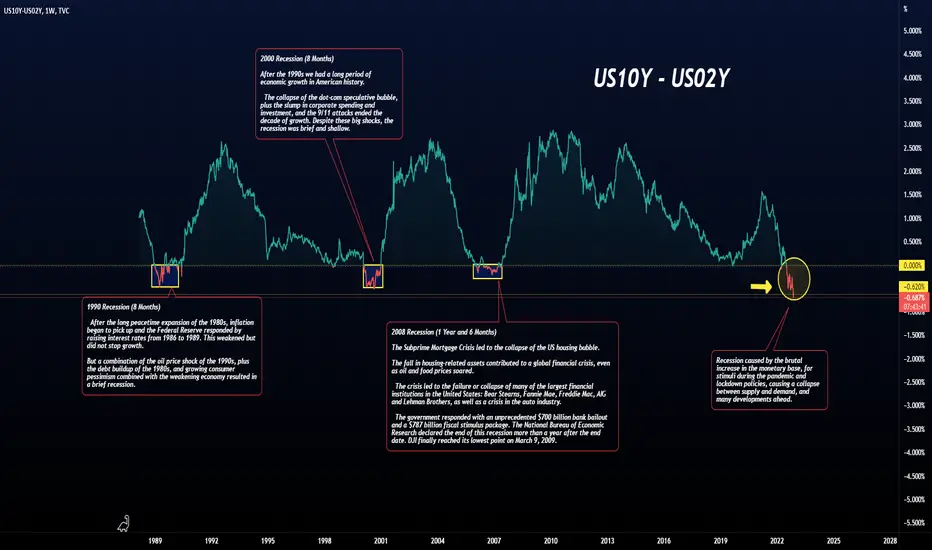
Does the yield curve inversion signal recession?The famous negative curve.
This market concept is used when the US02Y or US03Y operate at higher levels than the US10Y, this behavior usually anticipates recessions, but why does this happen?
The inversion of the yield curve distorts the expected functionality of the financial system.
Under "normal" conditions, raising funds in the short term for investment in longer terms is used to provide positive arbitrage between interest rates on liabilities (paid) and assets (received), a strategy subject to the limits of the rollover capacity of the liabilities and raising new funds.
The availability of assets with higher premiums and liquidity, US02Y and US03Y, makes it less attractive to offer funds for longer terms < US10Y, and more expensive to raise funds for those who demand funds for shorter terms.
So the interest curve is considered a kind of thermometer of what lies ahead in an economy, and it is the graphic representation of how much investors are charging to lend money in different maturities, and once it is inverted, it means that it is more expensive to borrow in the short term than in the long term – an unusual thing, because more distant payment dates mean greater risks for the borrower.
In the US economy, a widely documented fact is that yield curve inversion (i.e., when there is a negative differential between long-term versus short-term bond yields) is a good leading indicator of periods of economic contraction. four to six quarters ahead.
According to data available on the Federal Reserve website, yield curve inversion has preceded every US recession since 1950, with the exception of a false signal in 1967.
There is also evidence that indicators of this nature are important predictors of periods of economic contraction in other countries.
But are there any silver linings to this unusual reversal scenario? Yes, in these moments of greater uncertainty we have an interesting opportunity to buy good companies at low prices.
This is because after the monetary tightening cycle, the economy usually weakens, during this period risk assets suffer, considering that their future projections will suffer due to the scenario, so many of the market participants seek security in bonds, others seek to anticipate the recovery considering that as soon as this CORRECTIVE cycle ends, a new UPWARD CYCLE tends to maintain perennial companies and give birth to many new companies that arise in the face of challenging scenarios.
Types of Gaps !!!👨🏫Hello👨🏻🏫, dear traders from all over the world🗺️.
I'm Pejman🙋🏻♂️ & welcome🌸 to one more educational adventure🧭 in Tradingview, but we will not be traders💹 today; We want to look at our charts like a hunter🏹.
We look for every clue🐾 we see so that we can hunt suitable positions💱 like valuable creatures💰 and transfer them to the cages as our accounts💳 or wallets💸.
Although I'm not too fond🙍🏻♂️ of hunting, either legally or illegally.
But I know that hunting good positions in the forests🏞️🌳 of Tradingview is not prohibited😉❗.
So let's get acquainted with these clues🔎 as soon as possible because the price is skittish🙈, and we don't want to waste the hunting time⏳✅.
I said that in Technical Analysis , we look for ways to trade by using the price information, which is recorded on the charts📈. (such as the prey's tracks🔎🐾)
Today I want to introduce one of these clues so that you can become a professional position hunter🏹 by identifying the clues👀;
But don't forget that you should practice🙌🏻, be careful⚠️, and watch your positions👀, so you don't miss them or rush 🏎️💨to the wrong❌ position🙂.
Today's clue is the GAPS . First, let's see what the GAP is🤔.
The gap is nothing. I mean, it is something that is nothing😶🙄.
It is incredibly paradoxical💥! I'm kidding😉, but the space between candles🕯️ or bars is called a GAP.
A gap is created when we see👀 a price gap between two candles🕯️ or bars when the trading volume is high⏫ or low⏬. This difference or space between two candles is called a gap🤏🏻.
It is said that gaps are more valuable✅ in higher time frames among the traders, so much coin, much care👀.
Gaps, or as the Japanese🎌 term "windows," are significant for hunting🏹 positions, so as hunter traders, we should learn these gaps well👌🏻.
The reason🧐 for creating gaps can be factors such as important positive🆒 or negative🙈 news or an increase🔺 or decrease🔻 in supply and demand.
It is interesting to know that gaps are primarily seen in Forex , Stocks , and Commodities (especially when markets close and open).
The space👌🏻 between the candles means that the price has jumped like a rabbit🐰 from one number to the upper☝🏻 different number.
Or, like a monkey🐒, it moved from one number to a lower👇🏻 number.
I tried to make it funny😊 and straightforward👌🏻, but these gaps that move up or down have different types, like the year's seasons🌈☁️.
We have 4️⃣ seasons in a year and also 4️⃣ types of gaps in the charts.
According to personal taste😊, I relate the gaps to the year's seasons and, simultaneously, do not forget the case of hunting positions🏹💰.
So fasten your seat belts💺 because we want to travel in time🧳⏳ to all the year's seasons with this post🚩 and learn about the different price gaps, which are one of our clues🐾 to trap positions🪤.
Let's start with the autumn🍂 season because we are still in it and can understand it better😌.
---------------------------------------------------------------------------------------------------------------------------------------------------------------------------------------------------------------
The name of this type of Exhaustion 🥱 gap.
They are seen at the end🔚 of a process, which means that the process may change🔄 at any moment.
Just like the autumn🍁 season, it may rain☔ anytime after seeing the clouds🌥️.
Another feature of this gap is the increase🆙 in trading volume, so by paying attention👀 to these points and practicing by reviewing the charts📈, you can easily recognize🔎 this gap.
---------------------------------------------------------------------------------------------------------------------------------------------------------------------------------------------------------------
The next💁🏻♂️ gap is the Breakaway 🏃🏻♂️ gap.
The breakaway gap is associated with an increase⤴️ in trading volume.
This gap occurs when a critical range is broken🤞🏻, representing a strong💪🏻 start🏁 trend or a sign of trend change.
Like the blooming🏵️ of some trees🌳 in winter☃️ or the sprouting🌱 of plants from under the snow❄️.
Also, This gap is created when the price starts moving from a limited area, like support or resistance ( I'm going to talk about them in the future😉. )
I have to say that the breakaway gap plays a critical👌🏻 role in some of the classic reversal patterns, such as the Head and Shoulders Pattern , Double Top/Bottom Patterns , etc.
When The breakaway gap is combined with Classic Reversal Patterns, the breakaway gap adds to these patterns' validity✅.
If you want to get acquainted with the most important Classic Reversal Patterns of Technical Analysis , I suggest you read the following post👇.
---------------------------------------------------------------------------------------------------------------------------------------------------------------------------------------------------------------
Now it's time for spring🌸🍀, and I'm going to introduce a gap like spring.
Spring season is a sign✌🏻 of the continuation of life💐, and this gap in technical analysis shows the continuation of a trend📈.
The Continuation gap is also known as a Runaway 🏃🏻♂️ gap, occurring in the middle of a downward↙️ or upward↗️ trend.
This type of gap creates a kind of confidence for traders to enter.
It doesn't occur when the price fluctuates or corrects in a limited area but occurs during a rapid increase or decrease.
So, as a result ☑️, if this gap occurs in an upward trend🔺, it indicates the continuation of the upward movement.
And when it is created in a downward trend🔻, it indicates the entry of more sellers and further price decline.
---------------------------------------------------------------------------------------------------------------------------------------------------------------------------------------------------------------
Now we have reached✌🏻 the last gap🥰.
This gap is Common , but I should introduce it as the summer☀️ season.
These gaps are very common, And considering the time frame it has, it is expected to fill quickly, which is also called "closing the gap."
The filling or closing of the gap means that the price returns🔁 to the same area where the gap was created, like a criminal returning to the crime scene😄.
This can be true✅ for gaps as well.
Time flies in summer🏝️, and Common and Exhaustion 🥱gaps fill as soon as a blink👁️.
You may have heard👂🏻 that gaps are always filled, but this is not permanent🙅🏻♂️ and only a strong possibility🤏🏻.
For example, Continuation 🏃🏻♂️ & Breakaway gaps usually take a long time⌛ to fill.
But what if the gap doesn't close🤷🏻♂️?
Go to any currency pair and examine👀 the recorded data🗄️; You will find that many gaps take a year or more to close.
It is interesting😃 to know that the Japanese🎌 have another interpretation of the price gap.
They use gaps as continuation and reversal trading patterns (as I said, I'll explain them in future posts🔜😉).
It is interesting to know that the combination of gaps can create the Island reversal pattern.
The Island pattern consists of two gaps ; One up⬆️ and one down⬇️.
We will definitely✅ learn more about these patterns in the following posts🔜, but today we are only focusing on the gaps🧐.
---------------------------------------------------------------------------------------------------------------------------------------------------------------------------------------------------------------
Another thing I want to add➕ is about the Heikin-Ashi charts💹 that we learned about in the previous post🔙.
Gaps are filtered❌ in Heikin-Ashi charts.
As I said, in this chart, the average is displayed between two✌🏻 consecutive candles; even candlestick patterns are filtered❌.
So, the type of chart is also essential👌🏻 for finding gaps.
Well, I gave you the basic tips to identify these gaps🤏🏻, and now you can carefully look👀 for them in your charts💹.
Practice this information for a bit, as I will be back soon🔜 with an educational post👨🏻🏫 on how to trade💰 with these gaps.
If you have any questions❓, you can ask me💬.
We will get acquainted with new clues🔎 in new posts, so until that day, take care of your knowledge📊 and increase it every day📈, because according to Kofi Anan:
Knowledge is power💪🏻, and information is liberating. Education📚 is the beginning of progress in every society🏙️, in every family👨👩👧👧.
I hope you become stronger🙌🏻 daily by using your knowledge, and I will also increase your progress by teaching you the introduction.
I wish🙌🏻 you happiness, health😍, and success😎.

It’s trading wheaty (pretty) high now...Continuing the topic of spreads between related commodities, the Hard Red Winter Wheat – Soft Red Winter Wheat spread is another one trading at an extreme level now.
A brief explanation on the different types of wheat we are referring to here:
1) The Hard Red Winter Wheat (HRW) is the most widely grown class of wheat. A high protein product, used for breads, some types of Asian noodles and general-purpose flour.
2) The Soft Red Winter Wheat (SRW) is the third largest class of wheat variety grown in the US, lower protein wheat used in producing confectionary products such as cookies, crackers, and other bread products.
Generally, the HRW Wheat Futures (KE) trades at a premium to the SRW Wheat Futures (ZW) due to the higher protein content, however other factors such as production levels and supply demand dynamics may disrupt this spread, as seen from the wide range it has been trading since 1977.
Currently, this spread is trading close to 132 cents, with only one instance where it has traded higher, which was in March 2011 when this spread reached an all-time high of 164.
We attribute the spread trading at a high now due to the following 2 reasons:
1) The 2022 HRW production is currently the lowest on record since 1963, due to widespread droughts across many of the HRW production regions.
2) The average protein content of the 2022 yield is higher than last year, as well as the average of the past 5 years, resulting in a higher quality crop.
As a result, HRW is trading at a premium as supply shortage and a higher quality product pushes the price higher, while SRW sees average production and quality.
While it is challenging to assess the production levels and quality for the next season, from a risk reward perspective, we see an opportunity here. The past few spread peaks have been clearly marked out by Relative Strength Index (RSI) pointing oversold. With the 10-year average for the spread at 6.3 cents and the RSI now oversold, we lean bearish on the spread.
Referencing the average of the past 3 declines at 150 cents and lasting 511 days, we could set out trade levels.
If the historical pattern holds this time, a conservative target of 120 cents and a trade length of 500 days points us to the 15-cent level. We see the current set-up as an opportunistic one, with similar episodes in the past pointing lower. CME also has the synthetic KC HRW Wheat-Wheat Intercommodity Spread, which can be used to express the same view and is financially settled.
The charts above were generated using CME’s Real-Time data available on TradingView. Inspirante Trading Solutions is subscribed to both TradingView Premium and CME Real-time Market Data which allows us to identify trading set-ups in real-time and express our market opinions. If you have futures in your trading portfolio, you can check out on CME Group data plans available that suit your trading needs tradingview.sweetlogin.com
Disclaimer:
The contents in this Idea are intended for information purpose only and do not constitute investment recommendation or advice. Nor are they used to promote any specific products or services. They serve as an integral part of a case study to demonstrate fundamental concepts in risk management under given market scenarios.
Sources:
www.uswheat.org
www.cmegroup.com
www.cmegroup.com
www.usda.gov

4 tips on surviving Black Swan eventsHey everyone! 👋
Considering the events from the last few days, we thought it would be a good time to re-visit some of the best things you can do, as a trader and as a human being, to insulate yourself from Black Swan events. While a massive crypto exchange going insolvent is only the most recent example of a Black Swan, Black Swans can exist across all different realms - personal, political, environmental, and more. Because of that, we're going to walk you through some tips discussing how you can insure your future against unexpected calamity.
1.) Don't keep all your eggs in the same basket. 🪺
This one is glaringly self-evident following FTX's recent troubles, but spreading your assets out among custody providers is an excellent hedge in case any of them have solvency issues. That way, you're always protected against single-provider risk. Various global governments have tried to take steps to mitigate this (FDIC insurance, financial regulation), but nobody looks out for your interests like you do. Make sure you're in a good spot.
Never keeping your assets in one place also applies to asset class and geography. Own a lot of property in a single region? You're suddenly exposed to natural disasters that could hit the area, drastic political changes, and more. Only own a single asset class? Maybe the macro situation just changed against you quickly and it's all worth a lot less than you thought.
Diversity is the name of the game, not only from a position perspective, but from a total risk perspective. Where are you vulnerable?
2.) Keep some cash on hand 💵
This one is also self-evident for those who are currently unable to access their funds as a result of the recent turmoil, but keeping cash on hand in order to cover short term expenses is a life saver should you ever need it. To some, getting laid off is a great example of a personal black swan event, and something that could set someone back years in their personal finances. Make sure you're in a position that you're not financially stressed if something abnormal happens to your regular, everyday life.
3.) Carry no liabilities 🏦
While some purchases in our lives often necessitate the use of debt, the strongest-positioned people during a crisis are those who are not beholden to others financially. Considering that most Black Swans often cause all sorts of financial damage to their victims, having liabilities can cause undue additional stress that removes options from people who would otherwise be able to take advantage of the conditions. Also, those with a strong financial position are often those best able to improve their own standing when bad situations strike, buying up assets at prices that would normally never be available. Debt can prevent this level of flexibility, and therefore in order to reduce risk, you shouldn't carry any.
4.) Keep some assets on hand, in person. 🪙
This tip is for broader, more macro-scale black swan events like extended power outages, communications network failures, meteor strikes, war, and other things that would typically fall into that category.
But, in a broader regional or global societal collapse, having assets on hand is the best thing you do for yourself. In a situation where you're unable to access the broader societal infrastructure to which we all buy in, having a backup on hand where you live is really the ultimate insurance blanket. Whether this is cash, gold, seeds or food, don't get caught without a plan.
We realize this isn't the most fun topic to talk about, but if you follow these tips, it's likely you're much better insulated against all of the disasters and misfortunes the world can throw at you.
Stay safe out there!
-Team TradingView ❤️❤️

Charts Museum!!!👨🏫Hello, my dear traders🙋🏻.
Welcome🌸 to the Charts section📈. My name is Pejman, and this is the Museum🖼️ of Technical Analysis in Tradingview. I'm your tour leader on this visitation, and we will get to know all the Charts well together📊. I'll provide the necessary information about each Chart and answer your questions✅.
🚫So during this tour, please don't eat🍟or touch the charts🙅🏻😄.
But it would help if you tried everything you learned at home.👍🏻😉
And if you have any questions, ask me in the comments👨💻.
In the previous post, I reviewed the life story of technical analysis💹. I said that the best friend of technical analysis was the Chart📉, which didn't separate from technical analysis all these years🤝🏻.
On the other hand, I said that fundamental analysis was closely related👥 to the Chart and fundamental information was also present in the charts.
So the Chart plays a significant👌🏻 role in the market.
(Definitely, the monitor🖥️ plays an essential role in using the computer🧑🏻💻 otherwise, we should all look at our motherboards💽😄.)
If you're a beginner and want to join us, read the previous post so that you can take the critical steps in learning technical analysis one by one.📃
Now, let's start this post with an example.😊
Each book can contain different information, but the amount of information obtained from each book is different and depends on you.📖
For example, maybe an adult learns valuable information about life from a children's storybook and likes that. Or perhaps a child, despite his age, will relate to a science book about astronomy and like it.👨🔬📕
So the amount of information we get depends entirely on us.💁
Regarding the charts, each Chart, like any book, gives us different information, but what you get from each Chart or which type of Chart you are comfortable with is entirely up to you.🙇♂️
So, like a good bookseller, I have to tell you all the information about my books so you can use the book that suits you.😉
But ultimately, the choice is yours. The customer is always right. 😂👌
So let's start this tour right away because learning the charts is one of the essential steps in this path.🏃♂️
-------------------------------------------------------------------------------------------------
The information about a price or stock can be displayed using different charts📊, and in the Tradingview platform, it is possible to use the best charts and even customize them🔧⚙️.
Charts are traders' working tools, like a painter👩🏻🎨 who paints with his tools🖌️🎨. Everyone likes to have the best tools🛠🥇.
In the TradingView platform, you can adjust your tools in any way you like👨🏻🔧.
On the other hand, if you get a Pro+ or Premium account, you can use most of the features for charts.✅️
In the following, we will get to know these features and facilities🙆🏻♂️.
Before starting the explanation, I used SWOT to easily understand the content in each chart, and I tried to share the information simply and based on the existing facts.💁♂️
SWOT stands for Strengths, Weaknesses, Opportunities, and Threats.
SWOT analysis facilitates a realistic, fact-based, and data-driven examination of information strengths and weaknesses.📈📉
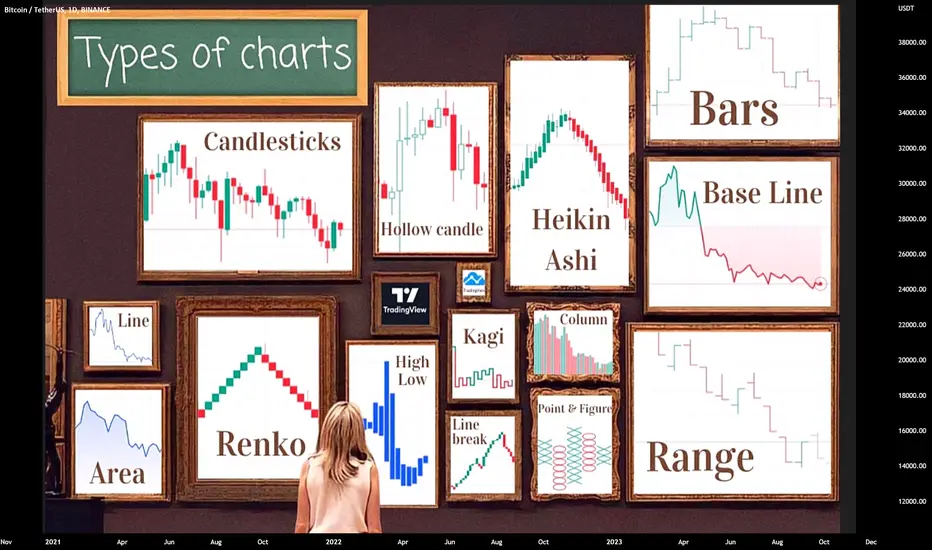
We will check these characteristics in all the charts. So let's dive into the types of charts, learn about their advantages & disadvantages, and even compare them with each other.
👇
Let's go through the chart types in order of Tradingview's formation.
-----------------------------------------------------------------------------------------------------
Bars Chart :📊
The Bar Chart is very similar to Candle charts in terms of the information it provides.
This chart shows us information using horizontal and vertical lines.
Bar Charts give us four types of information about an asset.
This information is called OHLC , in which O means the Opening price, H is the Highest price, L signifies the Lowest price and C represents the Closing price of a bar in a time frame.💵
Each vertical line represents price changes over a time frame.
The horizontal lines on the left indicate the bar's opening price, and the horizontal line attached to the bar on the right side shows the closing price of that bar.➡️
Also, other information is obtained by continuing the vertical lines from above and below.
When a bar has an extra line at its bottom, that means the end of this line represents the bar's lowest price.
The upper line also represents the highest price in that time frame.
Finally, I want to say that bars charts and candles chart may seem a bit complicated, but they can reduce our trading mistakes with the information they provide.🙅♂️
For sure, choosing which type of chart you can trade better with is entirely up to you.
In the Tradingview platform, you can change the colors of the bars and customize your chart. 🔁
I have to say that this option is not available on some platforms, and if you can’t see the colors & the chart is only seen in black, using this chart will be a bit confusing.😟
-----------------------------------------------------------------------------------------------------
Candles Chart :🕯
You might have seen the Candles chart or heard their name.
This type of chart has become the most popular among traders.
What do you consider is the cause of the popularity of this type of chart?
Now that it's time for the most popular chart among traders let me talk more about the advantages and disadvantages of this chart.
However, certain things about this chart have made it the most popular chart.
Candles are like the scoreboard of a stadium, which shows the result of the match between buyers and sellers in a time frame.
Candles have a body & a wick like a real candle, and these wicks show the same highest and lowest price in a time frame.
The body of the candle also indicates price changes.
If the color of a candle is red, the price has decreased from the time of opening to closing.
And on the contrary, if the candle is green, the price closed higher than when it was opened.
In my opinion, this type of price display has a better visual effect. It can be an essential reference for making trading decisions, guessing the next candlestick, continuing a trend, or finding the reversal trend.
Candlesticks can form patterns alone or in pairs that help us predict the subsequent movements of the chart.
Candlestick patterns are either a continuation of a trend or reversal patterns, which generally have more number and variety and are even more helpful.
If you need to become more familiar with reversal candlestick patterns, check out the post below.
Also, most indicators work best with candle charts. If indicators are relevant to a particular trading system, often candlestick charts are required.
Candlestick charts display who controls a market or market sentiment over a given time frame. Through various candlestick patterns and formations, such as the Doji Patterns, etc. A trader can assess the overall bias over a specific time horizon.
Overall, Japanese candlesticks are clear, simple, and easy to describe. But definitely, there are some disadvantages.
One of these disadvantages is Apophenia(A tendency to relate unrelated things to each other).
It is a mental bias to see patterns in things that are accidental. Our brains want to see patterns, and so they do.
We are also looking for meaning, so we find meaning in meaningless things.
By combining technical analysis, we see patterns in random data and attach importance where there is none to said data. Candlestick charts are great for this trap.
When I was a beginner and couldn't control my emotions, I often saw trends the way I wanted to & this was far away from logic.
You can escape these emotional traps by practicing and studying to decide with logic and thinking.
Don't worry; as I said, you can count on my help because we will travel together on the technical analysis training road.
-----------------------------------------------------------------------------------------------------
Hollow Candles Chart :
This chart looks very similar to the Candles chart, but it may look a little more complicated, and as a beginner, you may need help understanding the meaning of these candles at first glance.
The system and function of candlesticks & hollow candles are entirely the same, and the difference between them is their appearance.
But still, I will write some points about this chart.
This chart shows OHLC the same as Candles and Bar charts, but on some platforms, it may be seen in colors other than the default colors (green and red - black and white).
But in general, this chart will show the price fluctuations entirely, and because of the similarity to the candle chart, it is less used.
-----------------------------------------------------------------------------------------------------
Column Chart :
As you can see, this chart consists of colored rows. For example, the green row indicates a price increase, and the red row shows a decrease.
It may give us incomplete information for trading, but if you want to compare statistics with each other or get information quickly and with a simple glance, these charts are suitable.
-----------------------------------------------------------------------------------------------------
Line Chart :
I want to examine the Line chart, which is the simplest type of Chart.➡️
A line chart consists of points connected by a line, and these points only represent the final price ( closing price ) of a currency or share.
This Chart can be suitable for comparing the information with each other at a superficial glance because it doesn't have any extra data. Apply two line charts on top of each other and see correlations between different assets.
Line charts are less used for trading; Because a line chart consists of points connected by a line, and these points indicate the closed price in a time frame and give us less information.
There are some other charts similar to line charts that are suitable for comparing information, which I will discuss below.
-----------------------------------------------------------------------------------------------------
Area Chart :
This Chart shows the changes in one or more sets of data and can be checked with other variables, but usually, the second variable is time, and the price is measured relative to time.
This Chart will be suitable for comparing two or more charts.
I put the advantages and disadvantages of this chart in the picture like other charts.
-----------------------------------------------------------------------------------------------------
Baseline Chart :
You may have noticed the similarities and differences between this chart and the Line and Area charts.
The Baseline chart looks similar to the above charts but with different levels; it provides us with more information than these two charts.
By default, there is a hypothetical line, as the average price line in the middle of this chart.
When the area is green, the price is above the average level, and if the area is red, the stock or currency is traded below the average price level.
You can adjust the baseline level. This level has a comparative aspect, and this type of chart is very suitable for checking the market's fluctuations.
-----------------------------------------------------------------------------------------------------
High-Low Chart :
This chart provides us with more information than the line and area chart. But this chart is not complete and does not show the opening or closing price & it only expresses the price changes from the lowest to the highest amount in a time frame.
-----------------------------------------------------------------------------------------------------
Heikin Ashi Chart :
The Heiken Ashi chart is well-known among traders, like the candles chart, and was first used in Japan.
By filtering price fluctuations and averaging between two consecutive candles, this Chart makes it easier to identify trends and helps traders avoid market excitement.
Take a look at the below chart to get to know this type of chart better.
I have to say that this chart type is helpful in the stock market and commodity market, which is associated with more gaps because they determine the price direction without gaps.
So if you feel it can be useful for you, test this chart along with your other strategies.
-----------------------------------------------------------------------------------------------------
Renko Chart :
This type of chart does not pay attention to time, so the time axis is not present in its structure.
This chart consists of sections called bricks or blocks, for which the amount of price change is determined, and the minor changes are not taken into account.
Each block shows a price move covering a user-defined number from the recent close. If the user selects ten numbers, each block will represent a ten-number movement in either direction.
New blocks will only form when the price moves by the set amount of numbers. However, these can be tricky because more price movement can happen than expected.
The Renko chart is one of the oldest and most famous Japanese charts. You can use this chart any time frame if you have a Pro + or Premium account on the Tradingview platform.
Otherwise, you can only have this chart in the daily time frame.
-----------------------------------------------------------------------------------------------------
Line Breaks Chart :
These charts are excellent indicators of momentum.
Each bar is called a "line," A new line will form if the new closing price is higher than the current close or the new close is lower than the last 3 bars.
You can change this number to any number of lines in the past.
But the most popular number among traders is "three lines in the past."
For this reason, this chart is also known as three broken lines.
-----------------------------------------------------------------------------------------------------
Kagi Chart :
Now it's the turn of a fancy line chart with a formula.
The Kagi chart works established on price and discounts the time axis.
Think of it as someone's finger showing you, "We reached -this- high & then -this low” 😂.
Kagi lines do not reverse unless the price changes the minimum amount.
However, what defines what gets plotted is if the price moves by more than a specified percentage from the most recent close.
The color of the lines will change based on new highs and lows.
If the new high is higher than the previous high, the color changes to green & if the new high is lower than the previous one, it would be red, signaling weakness in price.
-----------------------------------------------------------------------------------------------------
Point & Figure Chart :
Point and Figure charts were initially developed as a price recording system and later became technical analysis charts.
Before computers entered the world of Technical Analysis, this chart was widely used. Still, fewer people use it these days due to the complexity of understanding this chart and the limited information it provides.
These charts are like Renko blocks. The X's denote bullish moves, and the O's designate bearish moves by a set number.
All the rules involved in Renko blocks apply here; however, these charts look additional.
These simple charts focus only on significant price movements and completely filter out noises (minor price movements).
The unique aspect of these charts is that, unlike Candles, Line, and Bar charts, the time isn't directly considered in the chart.
Sometimes we can obtain good results and price targets from these charts, which are sometimes very special and significant.
So if you are curious to learn point & figure charts do more research (remember to practice a lot😊.
-----------------------------------------------------------------------------------------------------
Range Chart :
The last chart of this museum is another chart related to the price movement.
This chart may look like a bar chart, but I have to say that it's not.
It contains some of the information that the bar chart had.
If you add this chart, you will see that it has a different time frame than other charts.
100 ranges; As the name indicates, it includes 100 of the latest price movements you can see in different time frames. But, it has more than 100 ranges, and you can determine the number of these movements, which varies from 1 to 1000.
How To Know When To Quit (Part 1/2)Hello traders,
All the below are based on my preferences, I don't give any financial recommendations and I have nothing to sell you with this article.
I'm sharing content because I see a lot of traders being/becoming broke and I don't want you to be one of them.
Splitting this article in 2 parts because it’s dense and I don’t want to lose people who might think “too much text I won’t read”
Let’s talk about:
– Cognitive biases
– Decision-making
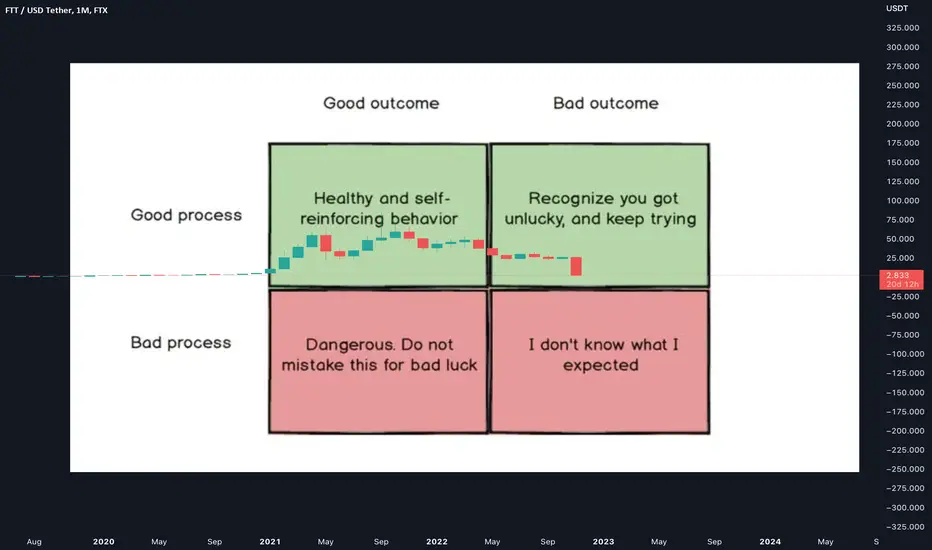
1. Be at ease with a bad outcome
Focus on the decision-making process instead.
Think in probability and play to the best of your hand.
Don’t dwell on a bad outcome if the process and decision-making were sound.
You have no control over outcomes when luck is involved.
Embrace uncertainty.
Understand that you have to get down to what do I have control over, and what don’t I have control over.
And I have to accept the tremendous influence of luck, I have to accept the fact that I’m having to make these very high-stakes decisions without being able to accurately predict where the candles are going.
2. Advice from Eric Seidel: Do not dwell on unlucky events
Eric Seidel is a 9-time world series of poker bracelet winner who made $40 million.
By all means, discuss what could have been done better.
If you played to the best of your "cards", that’s all that matters.
He goes, “I don’t want to hear about it if there’s not a question. I don’t care that you got unlucky.
I get unlucky too.
And I have to deal with losing with two jacks against two nines all the time also.
I certainly don’t want to take on your emotional trash about it myself.
And what’s the point of talking about it? You made a great call and lost, who cares?
Would you have changed anything about what you did? Do you think you got the read wrong?
It sounds to me like you did everything right. So why are we even talking about this?
I mean this is the thing, if it really was just bad luck, who cares?
This is about embracing that uncertainty, right?”
3. All decisions are probabilistic
And we make these probabilistic decisions all the time.
Consciously or subconsciously.
Whether its choosing your partner or the route you are taking to work.
You’re making a forecast.
The moment we make it explicit, we start to create feedback loops we can learn from.
Even if you don’t think you’re doing it explicitly, literally every single decision you make is probabilistic, because it’s a forecast.
It’s a forecast made under conditions where you don’t have all the facts.
You generally know very little in comparison to all there is to be known.
We have to reject the idea that if you’re not doing it explicitly, that you aren’t thinking probabilistically because every decision is a probabilistic decision just by its nature because the world is probabilistic, that is how we decide.
Now the act of trying to make these things explicit will make you better at it, because what it will start to do is allow you to create good feedback loops.
4. Don’t trade if you don’t have an edge
And we are very good at fooling ourselves into believing that we have an edge.
Set up structures, write down your thesis.
What new information will break your thesis?
When should you quit?
I think we’re very good at fooling ourselves into believing that we have a rational reason, that we have an edge.
And I think that that’s particularly so when we’re in a situation where the thesis would affirm other things that we already believe about the world.
I think it’s particularly so when we’re already in the investment/trade.
So one of the things that we need to do is set up structures around us that will allow us, first of all, to be better at those, are we really being rational and starting… but more importantly, because the starting decision is always uncertain, is to say, as we discover new information after we’ve started, are we stopping, right?
Are we figuring out when we should stop?
Because it turns out that we’re very, very dense when it comes to actually paying attention to the signals after we’ve started something that we ought to stop it.
And that’s where we get particularly irrational.
Quotes of the day
“Pain is temporary. Quitting lasts forever.” ― Lance Armstrong
“The elements of good trading are: (1) cutting losses, (2) cutting losses, and (3) cutting losses. If you can follow these three rules, you may have a chance“ ― Ed Seykota
"Confidence is not “I will profit on this trade.” Confidence is “I will be fine if I don’t profit from this trade." ― Yvan Byeajee
I'll post the second part tomorrow
I'll keep bringing a few articles like this every week because it helps me clarifying my thoughts AND giving back to the community makes me feel good about myself somehow :)
Thank you for reading
Dave
How to Blow Your Account | Step-By-Step Guide 💰 to 🪙
Hey traders,
In this article, we will discuss the set of actions, habits and beliefs that will blow your account.
1. Trades are based on emotional decisions
Behind each trading position must be a reason.
The entry reason of a professional trader is based on a very strict and objective conditions, while an unprofitable trader follows emotions and intuition.
2. Stop loss placement is for losers
A lot of traders consistently neglect placing a stop loss. Remember, just one single trade without that may blow your entire account.
3. Set unrealistic goals
There is a common misconception concerning trading: that the equity size is not proportional to potential gains. Such a reasoning leads to various false conclusions.
One who is trading with 100$ account and expecting to buy lambo, will inevitably blow the account.
4. No time for trade journaling
Why to even bother yourself with trade journaling?! It is just waste of time.
Remember, that trading journal is one of that best tools for learning. Constantly assessing your past decisions, you identify the flaws of your strategy and fix that, increasing your future gains.
5. Trading plan is for fools
I know a lot of traders who trade without a plan.
Remember, that the trading plan is your roadmap. Without that, it is impossible to become a consistently profitable trader.
6. Blindly following other's view
While you are learning how to trade, your task is to learn the reasoning behind the trades of the pro's in the industry. Following them without reflections, you are not learning and, moreover, you are becoming dependent. Losing, you put the responsibility on their shoulders instead of yours.
Such an approach will lead you to failure.
Learn to become responsible in your trading decisions and execute your own analysis before you follow any other trader.
7. Who needs economic data
As we discussed many times, fundamentals are the driver of the market. Neglecting the trends and global situation, not studying the news, you will unavoidably be fooled by the market.
8. Indicators are the magic pill
I know a lot of traders, who spend thousands of dollars looking for a magic indicator - the instrument that will make tons of money.
The fact is that indicators are just a tool in your toolbox. Its goal is to provide some minor additional clues to your analysis.
Overestimating the importance of indicators, you will most likely blow your account.
9. Not investing in education
Many traders are spending their money not on education but on fancy tools, signal services, robots and indicators.
However, the fact is that only knowledge gives freedom, only skills can make you independent.
10. Back testing is pointless
Trying different strategies, many traders intentionally skip the back testing part.
Remember, that back testing is the most proven way to verify the efficiency of a strategy, allowing you to save time and money simultaneously.
11. Paper trading does not make any sense
Same thing with paper trading. For some reason, the majority of the traders skip demo trading, quickly opening a real account.
However, the fact is that demo trading is the best, risk-free tool for learning how the market works.
Unfortunately, these 11 fallacies and misconceptions are very common. Analyze your trading and make sure that you are not making these classic mistakes.
What would you add in that list?
❤️If you have any questions, please, ask me in the comment section.
Please, support my work with like, thank you!❤️

10 Common Lies and Misconceptions About Trading 🥺🤮1. People are born traders. While it is true that certain personal characteristics make it easier to trade, no one is born a trader. One of the main themes of the Market Wizards books written by Jack Schwager is that almost none of the market wizards was successful from the start. They all worked hard at it.
2. You have to have a high IQ to trade. Just not true. In some ways, an above average IQ may be a hindrance. Trading is a human performance activity where strong intellectual abilities are unnecessary.
3. Top traders are successful because they have the "right trading personality." There is no such thing as the "right trading personality." Researches have been unable to find a strong correlation between personality type and trading success. It is important, however, to understand your personal characteristics and how they may help and hinder your trading.
4. Trading is easy. It sure looks that way, doesn't it? Just draw a few lines on the chart, watch your indicators, and follow the price bars. The truth is that trading is a difficult business to master. It involves different skill sets and abilities from what are needed in most other professions and careers. The trader must understand his or her personal strengths and limitations and develop specific skills to deal with the mental and emotional demands of trading. The later skills are the most difficult to develop and the most overlooked.
5. You must be tough, hard charging, and fearless to be successful. That's more media hype than anything else. It glorifies a strong ego, which is a detriment in trading. The most successful traders I know quietly do their research, study the charts, and patiently wait for the right moment. They strive to keep their ego out of their trading.
6. You must trade without emotions. If you are human, that's impossible. More importantly, when you understand your emotions you will realize they are assets, not liabilities. The real keys are:
To be aware of how your emotions interact with and influence your trading, and
To develop the skills needed to trade with them.
7. Top traders are usually right about the market. Top traders have many, many scratch and losing trades. Top traders are at the top because they exercise good risk control, limit the amount of loss from any given trade, and have developed a psychological edge that allows them to be unfazed by small losing trades. Most of their trading consists of modest profits and very small losses. When conditions are right, they step up size and let the profitable trades run.
8. Paper trading is useless - it's not a real trade without money behind it. If you aren't paper trading,you are doing yourself a disservice. You should always be paper trading your trading ideas. Why limit your education and experience by the amount of capital you have? Paper trading keeps you sharp ; you learn the conditions under which your trading ideas work best. Where else can you get such vital education at so little cost?
9. Master the technical skills and you will be successful. This is where most traders spend the vast majority of their time, but it's only part of the picture. You also have to learn important performance skills. Traders should spend as much-if not more-time learning to develop their psychological edge as they do in developing their technical trading edge.
10. Trading is stressful. It certainly can be stressful, and it certainly is stressful for many. It doesn't have to be. Successful traders have a certain mindset. They put little importance on any given trade. Their focus is on the long haul. They know that if they attend to the aspects of trading that are within their control (i.e., trade selection, entry, risk control, and trade management) the profits will take care of themselves.
source: DailyFX

TOP 20 Key Patterns [cheat sheet]Hi guys, This is @CRYPTOMOJO_TA One of the most active trading view authors and fastest-growing communities.
Consider following me for the latest updates and Long /Short calls on almost every exchange.
I post short mid and long-term trade setups too.
Here are some Educational Chart Patterns that you should know in 2022.
I hope you will find this information educational & informative.
>Head and Shoulders Pattern
A head and shoulders pattern is a chart formation that appears as a baseline with three peaks, the outside two are close in height and the middle is the highest.
In technical analysis, a head and shoulders pattern describes a specific chart formation that predicts a bullish-to-bearish trend reversal.
>Inverse Head and Shoulders Pattern
An inverse head and shoulders are similar to the standard head and shoulders pattern, but inverted: with the head and shoulders top used to predict reversals in downtrends
An inverse head and shoulders pattern, upon completion, signals a bull market
Investors typically enter into a long position when the price rises above the resistance of the neckline.
>Double Top (M) Pattern
A double top is an extremely bearish technical reversal pattern that forms after an asset reaches a high price two consecutive times with a moderate decline between the two highs.
It is confirmed once the asset's price falls below a support level equal to the low between the two prior highs.
>Double Bottom (W) Pattern
The double bottom looks like the letter "W". The twice-touched low is considered a support level.
The advance of the first bottom should be a drop of 10% to 20%, then the second bottom should form within 3% to 4% of the previous low, and volume on the ensuing advance should increase.
The double bottom pattern always follows a major or minor downtrend in particular security and signals the reversal and the beginning of a potential uptrend.
>Tripple Top Pattern
A triple top is formed by three peaks moving into the same area, with pullbacks in between.
A triple top is considered complete, indicating a further price slide, once the price moves below pattern support.
A trader exits longs or enters shorts when the triple top completes.
If trading the pattern, a stop loss can be placed above the resistance (peaks).
The estimated downside target for the pattern is the height of the pattern subtracted from the breakout point.
>Triple Bottom Pattern
A triple bottom is a visual pattern that shows the buyers (bulls) taking control of the price action from the sellers (bears).
A triple bottom is generally seen as three roughly equal lows bouncing off support followed by the price action breaching resistance.
The formation of the triple bottom is seen as an opportunity to enter a bullish position.
>Falling Wedge Pattern
When a security's price has been falling over time, a wedge pattern can occur just as the trend makes its final downward move.
The trend lines drawn above the highs and below the lows on the price chart pattern can converge as the price slide loses momentum and buyers step in to slow the rate of decline.
Before the lines converge, the price may breakout above the upper trend line. When the price breaks the upper trend line the security is expected to reverse and trend higher.
Traders identifying bullish reversal signals would want to look for trades that benefit from the security’s rise in price.
>Rising Wedge Pattern
This usually occurs when a security’s price has been rising over time, but it can also occur in the midst of a downward trend as well.
The trend lines drawn above and below the price chart pattern can converge to help a trader or analyst anticipate a breakout reversal.
While price can be out of either trend line, wedge patterns have a tendency to break in the opposite direction from the trend lines.
Therefore, rising wedge patterns indicate the more likely potential of falling prices after a breakout of the lower trend line.
Traders can make bearish trades after the breakout by selling the security short or using derivatives such as futures or options, depending on the security being charted.
These trades would seek to profit from the potential that prices will fall.
>Flag Pattern
A flag pattern, in technical analysis, is a price chart characterized by a sharp countertrend (the flag) succeeding a short-lived trend (the flag pole).
Flag patterns are accompanied by representative volume indicators as well as price action.
Flag patterns signify trend reversals or breakouts after a period of consolidation.
>Pennant Pattern
Pennants are continuation patterns where a period of consolidation is followed by a breakout used in technical analysis.
It's important to look at the volume in a pennant—the period of consolidation should have a lower volume and the breakouts should occur on a higher volume.
Most traders use pennants in conjunction with other forms of technical analysis that act as confirmation.
>Cup and Handle Pattern
A cup and handle price pattern on a security's price chart is a technical indicator that resembles a cup with a handle, where the cup is in the shape of a "u" and the handle has a slight downward drift.
The cup and handle are considered a bullish signal, with the right-hand side of the pattern typically experiencing lower trading volume. The pattern's formation may be as short as seven weeks or as long as 65 weeks.
>What is a Bullish Flag Pattern
When the prices are in an uptrend a bullish flag pattern shows a slow consolidation lower after an aggressive uptrend.
This indicates that there is more buying pressure moving the prices up than down and indicates that the momentum will continue in an uptrend.
Traders wait for the price to break above the resistance of the consolidation after this pattern is formed to enter the market.
>What is the Bearish Flag Pattern
When the prices are in the downtrend a bearish flag pattern shows a slow consolidation higher after an aggressive downtrend.
This indicates that there is more selling pressure moving the prices down rather than up and indicates that the momentum will continue in a downtrend.
Traders wait for the price to break below the support of the consolidation after this pattern is formed to enter in the short position.
> Channel
A channel chart pattern is characterized as the addition of two parallel lines which act as the zones of support and resistance.
The upper trend line or the resistance connects a series of highs.
The lower trend line or the support connects a series of lows.
Below is the formation of the channel chart pattern:
>Megaphone pattern
The megaphone pattern is a chart pattern. It’s a rough illustration of a price pattern that occurs with regularity in the stock market. Like any chart pattern, there are certain market conditions that tend to follow the formation of the megaphone pattern.
The megaphone pattern is characterized by a series of higher highs and lower lows, which is a marked expansion in volatility:
>What is a ‘diamond’ pattern?
A bearish diamond formation or diamond top is a technical analysis pattern that can be used to detect a reversal following an uptrend; the however bullish diamond pattern or diamond bottom is used to detect a reversal following a downtrend.
This pattern occurs when a strong up-trending price shows a flattening sideways movement over a prolonged period of time that forms a diamond shape.
Detecting reversals is one of the most profitable trading opportunities for technical traders. A successful trader combines these techniques with other technical indicators and other forms of technical analysis to maximize their odds of success.
Technicians using charts search for archetypal price chart patterns, such as the well-known head and shoulders or double top /bottom reversal patterns, study technical indicators, and moving averages and look for forms such as lines of support, resistance, channels and more obscure formations such as flags, pennants, balance days and cup and handle patterns.
Technical analysts also widely use market indicators of many sorts, some of which are mathematical transformations of price, often including up and down the volume, advance/decline data and other inputs. These indicators are used to help assess whether an asset is trending, and if it is, the probability of its direction and of continuation. Technicians also look for relationships between price/ volume indices and market indicators. Examples include the moving average, relative strength index and MACD. Other avenues of study include correlations between changes in Options (implied volatility ) and put/call ratios with a price. Also important are sentiment indicators such as Put/Call ratios, bull/bear ratios, short interest, Implied Volatility, etc.
There are many techniques in technical analysis. Adherents of different techniques (for example Candlestick analysis, the oldest form of technical analysis developed by a Japanese grain trader; Harmonics; Dow theory; and Elliott wave theory) may ignore the other approaches, yet many traders combine elements from more than one technique. Some technical analysts use subjective judgment to decide which pattern(s) a particular instrument reflects at a given time and what the interpretation of that pattern should be. Others employ a strictly mechanical or systematic approach to pattern identification and interpretation.
Contrasting with technical analysis is fundamental analysis, the study of economic factors that influence the way investors price financial markets. Technical analysis holds that prices already reflect all the underlying fundamental factors. Uncovering the trends is what technical indicators are designed to do, although neither technical nor fundamental indicators are perfect. Some traders use technical or fundamental analysis exclusively, while others use both types to make trading decisions.
Trade with care.
If you like our content, please feel free to support our page with a like, comment
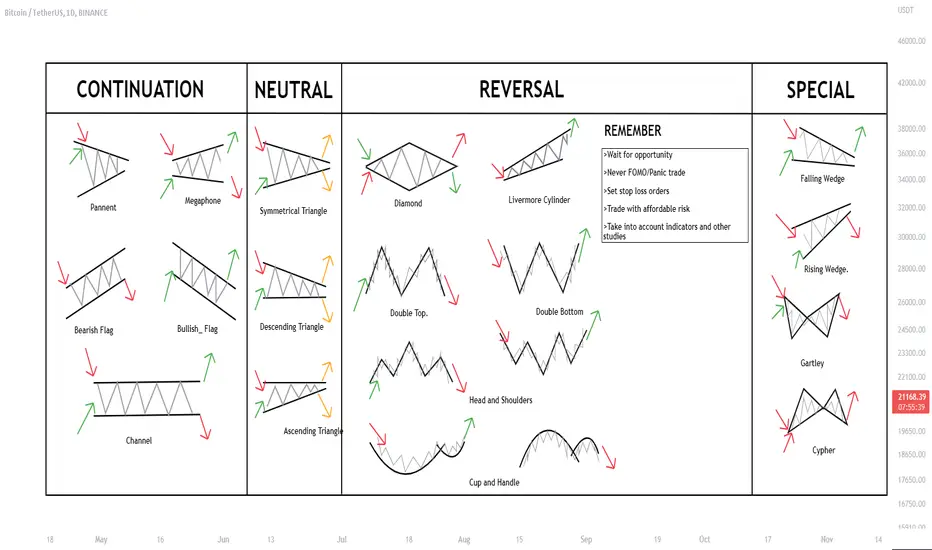
Why my indicators are open-source, and why yours should be tooThis post explains my mindset of why i publish only indicators and only under open-source.
A common opinion is that if an indicator or strategy is publicly known, then it cannot be profitable. In economics theory, this is known as the efficient market hypothesis(1), which states that once a strategy is widely adopted, it is integrated in prices and hence cannot be profitable anymore.
Hence, it is a legitimate question to ask: are any of the open-source indicators useful for professional trading?
I do not believe in magic bullet indicators, those that are claimed to indicate when to buy or when to sell. I don't think any indicator, or even any set of indicator, can reliably do that over the long term in any market without human intervention to decide at some point when the signals are true or false positives. Likewise, i do not believe automated strategies can reliably be profitable.
Hence, my focus is to design indicators that can help reveal hiddee structures or simply help in visualizing faster and more easily market's data. As profitable traders know, the raw price action still rules above all, with volume and order flow being the next best metrics, but we can design indicators to give us an edge in terms of time spent analyzing the market, and this is what all my work is focused on: to save me time and reduce interpretation errors. And maybe it can be useful to you too.
Indicators are merely a tool, and no two people will use them exactly the same. Just like giving a fishing rod doesn't make the recipient a fisher, i don't believe that just because indicators are free or open-source they lose their utility. The whole world is fishing, yet any competent fisher can still catch fishes, because they know where, when and how, it's not just because they have a fishing rod, and arguably, the fishing rod is only a necessary tool, but not the most important thing that makes them competent fishers: what makes them competent fishers are skills.
In summary, i am trying to help in understanding the market, not in predicting it. Assessing likelihoods and probabilities of future events and knowing what you can do are your job and depend on your skills solely. If you don't know how, there are free online tutorials(2) to get started, but nothing replaces experience acquired through hard work.
For example, one of my favorite ways to visualize is to encode sentiment related infos as a coloret bar at the bottom, or by highlighting the background. These representations may be simplistic, and that's the goal, anybody can understand them intuitively without even looking at the description, yet they can encode very complex and heterogenous information.
The human brain remains the best informational system when it comes to integrating huge volumes of heterogenous data, as the financial markets generate. So my indicators are meant to boost brains, not replace them. Even artificial intelligence bots have a hard time being profitable (i know, this is my original field of expertise, they require near constant monitoring to avoid potentially catastrophical errors and tweakings to adapt to the market). There is simply no shortcut to hard training when it comes to becoming a good, profitable trader.
Hence, even if my indicators are, I believe, vezy helpful to understand the market and can gice an edge, and ecen though I use several all the time, to be honest, you likely won't get any benefits if you don't know what you are doing, if you are inexperienced with trading.
The above explains why i think publicly available indicators can still be useful, but not why i publish under open-source, which is anither step beyond free but clised-source publication. Truth is, I am marvelled by the open-source spirit in the TradingView community, which is the biggest database of open-source financial indicators ever. As I strted above, these indicators are unlikely to be profitable on their own, but that's not the point: sharing indicators is sharing an idea, a concept, a blueprint, that can then be developed further, or be food for thoughts for a whole new indicator, or just broaden your horizons of how you view the markets.
Therefore, I decided to stay in this spirit and publish all my indicators under open-source. I am very grateful for the giants on which shoulders I stay, and I am eager to hear feedbacks on my work, so we all further our collective understanding of markets!
Enjoy, and be safe!
Tartigradia
(1) Timmermann, A., & Granger, C. W. (2004). Efficient market hypothesis and forecasting. International Journal of Forecasting, 20, 15-27.
(2) cobie.substack.com
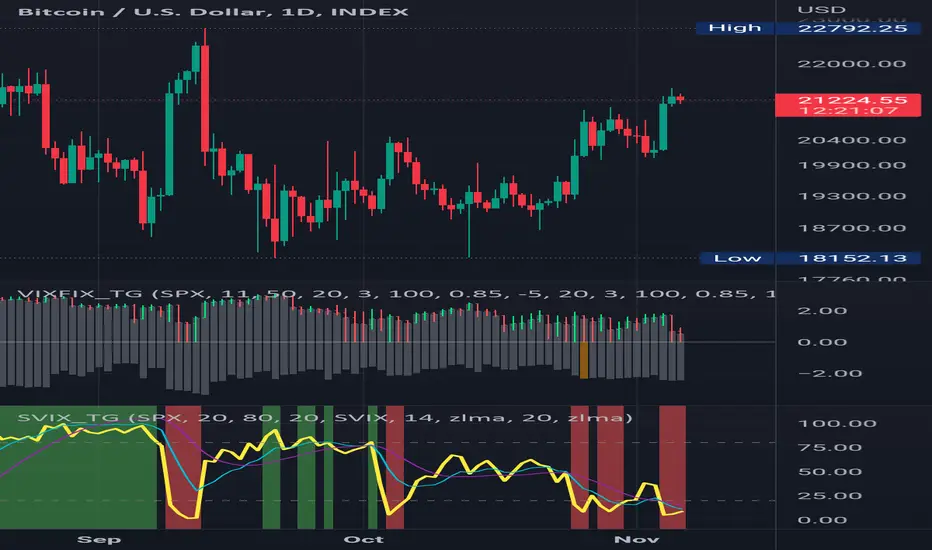
Bites Of Trading Knowledge For New TOP Traders #17 (short read)Bites Of Trading Knowledge For New TOP Traders #17
----------------------------------------------------------------
What is a custodian? -
A custodian is a financial institution that holds customers' assets or securities for safekeeping to prevent them from being stolen or lost. The custodian may hold equities, bonds, derivatives, or other assets in electronic or physical form on behalf of its customers. Custodians could offer related financial services such as account management and reporting, transaction settlement, and compliance related to anti-money laundering and tax regulations.
What is an exchange? -
An exchange is a venue where buyers and sellers trade equities, bonds, derivatives, and other tradable assets. Exchanges are often regulated by financial regulators and provide liquidity, which give market participants the ability to buy and sell assets at a fair market value.
What is a financial regulator? -
Governments have various agencies in place given the responsibility to regulate and oversee financial markets and companies participating in the financial system. These agencies each have a specific range of duties and responsibilities that enable them to act independently of each other while they work to accomplish similar objectives. For example, in the United States, the Securities and Exchange Commission (SEC) has oversight of the securities industry (stocks and shares), whereas the Commodity Futures Trading Commission (CFTC) regulates and oversees derivative markets (futures, swaps, and options).
RISKS AND OPPORTUNITIES FOR CORPORATES AND INDIVIDUAL INVESTORS -
Common application of financial market instruments for managing risk and opportunities.
Position and Risk Management
Risk management is the responsibility of market participants designed to limit risk exposures that specifically applies to the participants financial profile in the market.
The financial profile of a participant may include their role in the financial market or the amount of capital under their responsibility to be managed in the market, and therefore the risk variables that each would need to identify may be unique.
For both corporate and individual investors, the market to trade would be a key variable to clearly state and support with reasons for trading or investing. Reasons for selecting one market over another could include price volatility, liquidity, daily volume traded, size of the minimum price increment, and value of the minimum price increment. Comparing these variables between markets will help decide the suitability and/or risk of each.
For example, if Mini-Brent Crude Oil futures (BM) moves around $2.00 per day (or 2 points) and a point is worth $100, a trader might experience a $200 fluctuation in their account balance for one day. Another example is the U.S Dollar / Singapore Dollar (USDSGD), which could move 70 pips or more per day and trading a standard lot size with each pip worth $10, a $700 fluctuation could be expected for one day.
Market participants may also manage their risk through the size of their positions. The larger their position size, the greater is their exposure and the smaller their position size their exposure is lower. Investors should determine the risk that would result from various position sizes and select the size that ensures that their risk limit is not exceeded. Finally, setting stops with a specified loss amount provides protection if the market does not move in the desired direction. It helps to prevent creating a loss scenario which is larger than an account can handle.
TRADDICTIV · Research Team
--------
Disclaimer:
We do not provide investment advice, nor provide any personalized investment recommendations and/or advice in making a decision to trade. Before you start trading, please make sure you have considered your entire financial situation, including financial commitments and you understand that trading is highly speculative and that you could sustain significant losses.
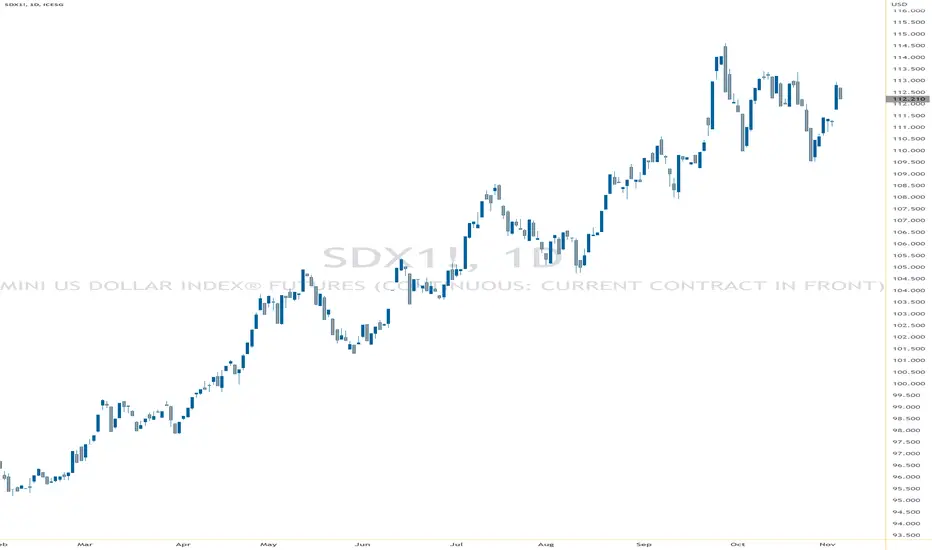
HOW-TO: Using Data Gathered in Divergence BacktesterHello Everyone,
Here is a small video describing the idea on studying divergence data based on divergence backtester script.
To understand further, you can study some of my older scripts on divergence. You can find them under my profile: tradingview.sweetlogin.com
Filter only open source scripts so that you will see only free to use scripts with code available. This is not a fully fledged strategy. But, just means for studying the impact of divergence data on price action. Please let me know if you have any questions.

FOMO - Analysis from a Trading Psychologist FOMO.
Fear of Missing Out. We have all heard this phrase. It could pertain to that VERY LAST concert of your favorite band in the middle of the week and coming late to work the next day. Scrolling through Instagram and making a split-second purchase that never works out. We get the idea.
I can feel FOMO’s omnipresence in the trading world right now. We have seen some large career changing moves in commodities as of late. Extend the lookback time a few years and we could probably open a FOMO Crypto clinic, complete with padded rooms. Why didn’t I catch that move in Euro Power? I can’t just sit here and watch my neighbor get rich; I missed the only opportunity to make money!
Well, Crude Oil, Gold and Wheat all taught traders suffering from FOMO a healthy lesson these past few weeks. Or are they doomed to repeat it again? Traders rarely want to admit weakness, but it’s essential to becoming profitable. Hi. My name is Paul Wankmueller, and sometimes I suffer from FOMO.
I decided to turn to my favorite trading psychologists, Brett Steenbarger, PhD. Brett has been in the trading game since the late 1970’s and his Nov 21’ speech on Trading Fomo piqued my interest. Below is a summary of what I took away from it, and some preventative ailments attributed to Brett’s psychological evidence-based outcomes.
FOMO is a PnL Killer! At its core FOMO is a fear. The problem is not that we missed the trade, it’s that our brains perceive that missed trade as a threat to our future, our success, our reputation. When humans are afraid of something, or see a threat, it produces anxiety. This fear takes blood away from the part of the brain where higher level thinking takes place and sends it to the part that impulsive thinking lives. There WILL be poor decision making under the influence of anxiety. The key to solving this issue is to take the threat out of the situation.
Solutions:
Taking a break from the screen is healthy but it is not a long-term fix. Brett explains how to train in exposure therapy (His presentation explains this in greater depth.) Slow breathing and visualization are more adept at battling FOMO. If you can visualize a calming place or situation and pair it with that fear, daily practice and dedication will prevent blood flow to the impulse zone. Gradually, when FOMO comes around, you will experience feelings of safety. Combined with expanding your time of reference, understanding, and acknowledging FOMO will make those events look like potholes on a long highway.
Missing a trade is a bummer, but is that going to end my career? No. Will buying at the top, and then being so irate that I add to a losing trade and forgo stop orders end my career? It might. Will I be thinking clearly on my next trade with a fresh mistake permeating my thoughts? Nope. The best motivation to avoid FOMO is to develop emotional hate towards the negative consequences of it. In the fullness of time, the desire to avoid negative outcomes becomes self-reinforcing with repetition and therefore cements as an internal priority. This works across the board in other life scenarios as well.
Tapping into other motivations besides PnL is one that really hit home with me as well. Brett dives into the desire to learn and grow as a greater motivator than just PnL alone. This addition will create a dual purpose to each trade. You are diversifying your outcome! If you come away from a trade with a negative PnL, but with a positive learning experience, you are building your LC (Learning Capital). With time under this premise, your LC will be indistinguishable from your monetary statement.
Instead of tying your value as a trader strictly to your PnL, tie your value to your consistency and risk management. The magnitude of your PnL is nothing without consistency. Risk management begets larger positions, lower drawdowns, and an overall better quality of work life.
A day comes with myriad experiences. Maybe you woke up next to the love of your life, saw your kids off to school, got an extra good boy wag of the tail from the pup, the list goes on. Create a diversified life with people and activities that fulfill you outside of trading and your trading will improve. Reminding yourself daily of this is important.
Tying all of this together is the practice of keeping a daily ABCD Journal.
A- Activating Event – What got you upset? - Missing the trade in this case.
B- Beliefs about the event – Little voice in your head – Why is this upsetting to you? “Other people are getting ahead of me, I’m not as good as they are”
C- Consequences from the event – How does negative thinking affect your subsequent trading? I’m so upset about missing the opportunity I go ahead and miss the next one!
Becoming proficient in ABC will allow you to recognize the triggering event in real time. You begin to identify the negative beliefs and become a pro at understanding the magnitude of the consequences. You can change the pattern of your behavior because the consequences are so front and center.
D- [Disputation- You are talking back at that negative thinking. How would you talk to someone you care about who is in that situation? Mentoring a teammate that missed a big play involves constructively lifting them up and helping them learn from it with a comforting tone. You aren’t going to beat them up.
I welcome all feedback and am also here if you want to chat about a particular experience. Happy Trading!
-Paul Wankmueller, CMT
The reason you are not successful...Hello traders,
All the below are based on my preferences, I don't give any financial recommendations and I have nothing to sell you with this article.
I'm sharing content because I see a lot of traders being/becoming broke and I don't want you to be one of them.
Yesterday, I posted an article about how to NOT overtrade when you're emotions are running high:
Now, I'd like to flip the other side of that coin showing how "overtrading" can be beneficial for beginners to achieve their desired outcome. 🧵
I - Alex Hormozi
I discovered this OUTCOME equation thanks to Alex Hormozi on Youtube.
He helped me defining clearly with words how to get to the outcome I want.
Props to him for being such a wonderful business/sales/marketing/thinker.
II - The OUTCOME equation
The equation is defined as: VOLUME x SKILL x TIME = OUTCOME
VOLUME = number of repetitions
SKILL = quality of each repetition
TIME = total duration of practicing those repetitions
Based in foundational principales
The more we do.... the better we get
The better we get.... the more we do
The longer we do it....the better we get
The better we get....the longer we do it
The longer we do it...the more what we did compounds on itself (profit, reducing losses, etc)
In this way, each of the three feed the others, but it all starts with doing .
It's a virtuous wonderful cycle: imgur.com
It works for any skill you want to acquire but let's focus on trading for now.
After years of trading, any of my trade has a higher quality than my trades from my early days.
Why?
Because I spent an enormous amount of time trading intraday first with a demo account, and then with a live account trading with micro-lots/micro-pips.
Once I got profitable CONSISTENTLY for a few weeks, I allowed myself to increase my lot size slightly.
I repeated this cycle made of mini weekly cycles for more than 5 years until I'll reach a capital allowing me to trade the indices futures.
III - Why 97% of traders fail at trading
The majority of traders lose due to a lack of experience which can only come with taking a lot of trades during an extended period of time.
There is no other way....
Forget about getting rich quickly, forget about your 100% automated bots - if such wonders existed, no one in their right mind would sell them and they'd invest everything they and their family own in those magical cashflow generating machines instead...
New traders think only a few weeks of practicing is required to learn about themselves and about the markets.
Your favorite influencers won't tell you this: trading is very hard, most lose all their money, lose their family, lose their home, lose themselves in the process.
The only hedge you have is your WORK.... you can't cheat the GAME.... you have to take a lot of trades for an extended period of time.....
And then, at some point, you'll be able to capture more opportunity per trade, to lose less whenever your Stop Loss is hit, to not get frustrated when the price is leaving without you
All those skills cannot be acquired in weeks ....
One cannot develop character traits required to be a good trader in a short timeframe - talking about patience, discipline and motivated.
Motivated too because it's hard to keep one's dopamine level high after some consecutive days of losing
Don't cheat the game, it's impossible
If you're not profitable yet, forget about leverage please please please please.
How many times do you have to get margin called to understand that leverage wasn't invented for you to make money but to depart from it faster.
IV - True Effort
When learning a new skill at the beginning, everyone sucks.
I certainly sucked at it and you will too.
THAT IS FINE, THIS IS OKAY, THERE IS NOTHING WRONG
How could you not expect to suck at a skill you don't know yet.
What I'm saying is unpleasant because everyone wants to get rich quick (me included)
My only guarantee to YOU guys is that if you can afford to follow this process with a decent trading strategy and stay consistent, your gains are going to be tiny at the beginning and then PARABOLIC after some time.
As the desired OUTCOME is to become richer and/or live off your trading again, this is the ONLY way
It's IMPOSSIBLE to suck at trading after taking thousands and thousands of trades.
As it's impossible to suck at anything after months and months of constant practice and effort.
And you can learn with a DEMO account (risk-free) or with betting pennies per every trade using CFDs or other similar product.
If you want to learn how to play piano, if you follow some tutorials on Youtube every day and practice 2-3 hours a day for years, I guarantee you that you'll have an excellent playing level.
Stop being lazy, stop cheating the game, stop searching for the way to get rich quick.
Accept the magic pill doesn't exist BUT another way that no one is doing will allow you be DIRECTIONALLY RIGHT and eventually reaching your desired OUTCOME.
Conclusion
I wanted to post this content because this outcome equation is dear to my heart and changed my life for the better
I'm literally kicking ass because I outworked everyone I know
And now that I'm more skilled than them, I can put off my foot from the accelerator working less than them, making more $$ than them
Thank you for reading by dear followers
PS
To all those in the comments about to tell me they have a magical bot printing $$ for them and their community, I invite you to show me your track records and bank account statements and any proof I could believe you didn't use photoshop on to sugarcoat what the reality is...
Tug of War Among Central BanksThere is a tug of war situation among the central banks to hike interest rates. What is the bad and the good that will come out from this?
i. Last week of October, European Central Bank officials announced another massive 75 basis point hike, increasing interest rates at the fastest pace in the history of the euro currency.
ii. This week, the Federal Reserve is expected to increase rates by 75 basis points for the fourth time in a row.
iii. The Bank of England could join the club on Thursday.
Content:
. The Interest Rate race has just started, why?
. The impact on different currencies
. It may not be all bad news, why?
With higher interest rates, it attracts investors to buy its currency, in this case the USD.
Currency is always a pair, when USD strengthens, the other side weakens.
When a currency gets weaker, it is very bad news for inflation because they will have to pay more on their imports.
Therefore in order to counter inflation, one of the best measures is to hike rate
Expect more volatility in the currencies market, meaning currencies will take its turn to move.
And if you are a trader, you should welcome volatility. Because with volatility, there are opportunities.
GBP Futures
0.0001 = $6.25
0.001 = $62.50
0.01 = $625
0.1 = $6,250
1.1000 to 1.2000 = $6,250
Disclaimer:
• What presented here is not a recommendation, please consult your licensed broker.
• Our mission is to create lateral thinking skills for every investor and trader, knowing when to take a calculated risk with market uncertainty and a bolder risk when opportunity arises.
CME Real-time Market Data help identify trading set-ups in real-time and express my market views. If you have futures in your trading portfolio, you can check out on CME Group data plans available that suit your trading needs tradingview.sweetlogin.com

Fundamental Analysis in Forex Trading
Economic indicators and announcements are an essential part of fundamental analysis. Even if you’re not planning on finding trades using fundamentals, it’s a good idea to pay attention to how the overall economy is performing.
Here’s a cheat sheet covering six key indicators and announcements to watch out for.
1. Non-farm payrolls (NFP)
The non-farm payrolls report estimates the net number of jobs gained in the US in the previous month – excluding those in farms, private households and non-profit organisations.
2. Consumer price index (CPI)
The chief measure of inflation is the consumer price index, which measures the changing prices of a group of consumer goods and services.
3. Central bank meetings
As we’ve seen, most traders follow economic figures so they can anticipate what a central bank might do next. So, it only makes sense that we pay attention to what happens when they actually meet and make decisions.
4. Consumer and business sentiment reports
Multiple organisations are constantly surveying consumers and business leaders to create sentiment reports. While the number of reports they produce is staggering, they all play their part in shaping the markets’ expectation for the future.
5. Purchasing manager index (PMI)
Purchasing manager indices measure the prevailing direction of economic trends in a given industry, according to the view of its purchasing managers. They are used as an indicator of the overall health of a sector.
Pay close attention to these fundamentals.
They play a crutial role in trading.

Trading Psychology - Knowledge Matrix
A - Unknown unknowns - You don't know what you don't know.
This is the first level of the knowledge matrix. There are skills or things, that you are not even aware of, that are completely new to you, and that you need to learn.
Let's say that for a person, this is the first contact with trading as a beginner trader.
B - Known unknowns - You know what you do not know.
On the second level, you are starting to be aware of the skills you need to develop, and the information you need to learn in order to advance in personal development.
This is the learning and practice phase.
C - Known knowns - You know what you know.
On the third level, you have acquired all the necessary knowledge and skills, and you are now aware of your level of competence.
The psychological part at this level, is that you have all the necessary skills as a trader, and you are taking decisions at a conscious level. Because the decisions are at a conscious level, many times you might not stay on your predetermined course.
D - Unknown Knowns - You don't know what you know
This is the highest and ultimate level on the knowledge matrix. Basically, after acquiring all the skills and information, they are now deeply implemented on a subconscious level, and many times, you might take good decisions based on feeling or gut.
At this level, decision-making is not difficult, and you follow your rules without struggling, having a trading career as a full-time job.
Which level are you at?
A
B
C
D
Don't stumble trading. Trade Safe!
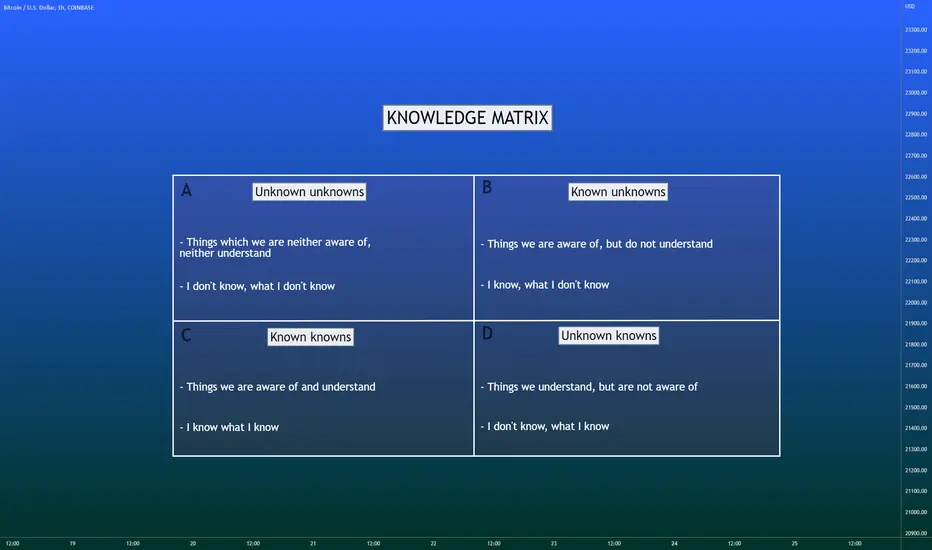
Technical Analysis !!!👨🏫Hello, my trader friends🙋🏻.
I want to tell you the story of Technical Analysis, its advantages & disadvantages.
We're even gonna learn about its branches.
Like any other science, Technical Analysis has come a long way, and it's still evolving. But why should we learn it and know it well?🤷🏻
When you're trading, you may be afraid or greedy. But how do professional traders control these two?🤔
Let me start with a simple example.
If someone turns off the lights & challenges you in a new room, you will feel scared or lack confidence because you don't know that place. But if the challenge happens in your bedroom or home🏡, you'll feel more powerful 💪🏻 and confident because this environment is familiar & you can act better.✅
Fear is caused by the unknown. When you don't know this market, you can't get good results (or at least permanent good results).
So follow this page to conquer all the peaks⛰️ of Technical Analysis together🙌🏻 and learn from A to Z of it.
Also, I'm a fellow traveler on this route🛤️, not your tour guide.
So, if you have any questions, ask me in the comments💬.
My trader fellas, let's take one step👣 at a time because taking long and hurried steps will only hit you harder. I'm with you in all these steps🪜 & get started with the first type of market analysis.
Technical Analysis is old. I mean, it's almost 300 years old📜, but it doesn't like to talk about its age, so we couldn't find the exact information about its birth date🗓️😑.
Maybe it’s from Japan⛩️🎌 and was born in the 18th century, or perhaps its date of birth is in the Middle Ages.
But there is some more information that I'm sure about. For example, in 1879, the Technical Analysis found a friend by the name of Chart📈, and they have not separated until today.
Let's skip this story and be serious☺️. Technical analyzers believe that everything is in the Chart.
In Technical Analysis, there is all the necessary information for trading, such as entry points, exit points, market volume, stock prices in the past and present, etc. (The Chart is a complete encyclopedia for Technical analyzers!!🤦🏻😶 )
There is another type of analysis that examines the available information about a stock (from the founder of a stock or company to the cost and income and even the company manager's records), called Fundamental. But the Technicalists say that even some of the Fundamental information is in the Chart! 😐
Overall, Technical and Fundamental are both complementary to each other and opposite to each other. But both are related to the Chart. (These three have a complicated relationship; I mean, there is a love triangle, so we should stay out of it !!🤫😂 )
Let's skip the joke. All these things are just like the gears⚙️ of a car, but it's not enough. You need to follow more rules in the market to pass the finish line🏁 with your trading car🏎️ . Don't worry cause I'm gonna tell you everything you need to know to win🏆 this trade racing with your strategy car.
Now that we have learned a little about the history of Technical Analysis, it is better to learn about its contents.
The price chart, our most important resource and tool in Technical Analysis, consist of the price-time, Charts, and Candles.
But these candles🕯️ existed 100 years before bar and dot charts.📊📉
In 1700, a Japanese man named Huma realized that the price of rice depended on the emotions of traders in addition to supply and demand.
Candles show these feelings with their colors.
For example, the green candles🟢 show trust and good feelings among people who invested in a stock.🤑
But red candles🔴 indicate doubts or hopelessness of people about a stock, and they sell it.😞
I don't know why I remembered Moody's octopus doll🐙 :)
But candles tell you the feelings of other traders just like these dolls. But only its color is not essential.
Can you guess the other important factors about candles? I will tell you the rest of them soon.😉.
Have you heard that history repeats itself?
By looking carefully🧐 at the old charts, some creative people found that the prices behaved similarly to their past.
They realized that the candles make interesting shapes next to each other, and they made these shapes repeatedly in different periods.🔁
They formed different geometric shapes and patterns & continued to make these shapes until today :)
Let's accept that the Chart is creative and artistic! 🎨🖌️😊
For example, they found a shape called a Head & Shoulders Pattern. This type of pattern will cause a downward trend⤵️ in the Chart.
I tried to find it & place it on someone's Head & Shoulders to remember it better. 😁
Many patterns can be found in any chart, and I have already taught the reversal patterns in my previous posts, But I want to go over all the patterns in detail again in the future, so let's dive into the other contents of Technical Analysis.👇
Using formulas, mathematical🧮 ratios, and advanced calculations, indicators were created that can generally show the market's present and past and give a relative opinion about the future (Please don't get the indicators wrong with magic 8 ball🎱 or Professor Dumbledore's wand✨. )
Let's be serious about it. Maybe you know that indicators depend on the two factors of time and place of price.
In terms of time🕦, they are divided into two categories: leading and lagging.
In terms of price movement💹, they are divided into three categories: trend indicators, oscillators, and volume indicators.
The indicator that I made the above meme for is a leading oscillator.
Now it’s time to go for the other various tools that are made by using numbers🔢 and people’s actions in the market.
A person named Nelson Elliott made a useful tool, although, after his death, many people worked on this tool and improved it until today it reached us, but we are going to discuss it better in the following posts like the rest of the contents of Technical Analysis.😉
But I have to say Elliot believed that the market is not disordered and always repeats a repetitive cycle, and Eliot called these repeated movements waves.
According to him, if you can perfectly identify the repeating patterns in the price, you can predict how the price will change (or not change) in the next phase.
Eliot published his experiences and theories in a book called the waves principle, which I recommend if you want to get good information in this field; it's better to start from the origin of this theory.
I think there is no better definition for the word "Wave" than sea waves🌊, and I tried to draw Elliot waves like sea waves reaching the shore. 🏖️
In the end, I want to say that whatever style of analysis you have or whatever type of Chart you use, in the future, this machine will not go the right way without following a series of principles.
Suppose you have the best car in the world, but you neither know how to drive nor the rules. It can be guessed that you will either crash with someone or break the car💥.
You should have risk management along with your trading system, and don't forget that no trading system is perfect.🙅🏻
It is better to try each method on demo accounts before making real trades.
Of course, you can count on me and ask any questions you may have.🙂💭
In the following posts, I’ll talk more about the things that have been said and introduce you to good trading systems that can be obtained from any method.
I'm by your side so that if you are a beginner, you can find your own way, and if you know the market, we can learn the basics of this market better & together🤝🏻.
Wish you happiness, health & success guys🙋🏻.
