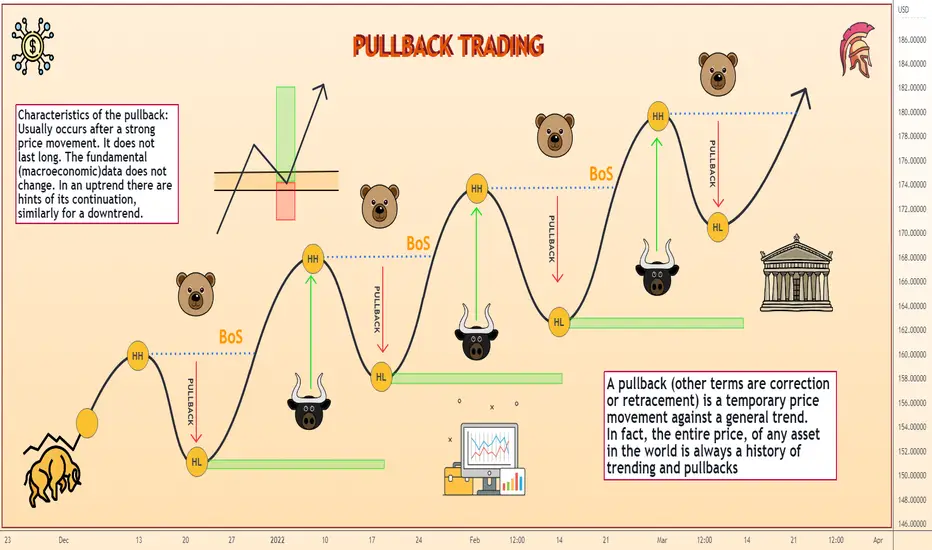
PULLBACK TRADINGTrading on a pullback is one of the options for trading in Price Action patterns. Like trading on a breakout, this style implies the use of pending orders. Trading on a pullback is more popular than on a chart breakout. If Price Action signals are used correctly, it can bring more profit with less risks.
🔵 Characteristics of the strategy of trading on a pullback
This strategy, as well as all other trading strategies based on Price Action, is considered universal and multicurrency, suitable for any asset and timeframe. However, it is recommended to trade on liquid currency pairs, such as EURUSD or GBPUSD on hourly or four-hour charts. The daily D1 is also suitable for trading. When trading on a pullback, traders place limit orders (as opposed to a breakout, where stop orders are used).
🔵 The principle of trading on a pullback and the algorithm of placing orders
The basic idea of the strategy is that the price, before it goes in the necessary direction after the formation of the pattern, usually pulls back, and if you catch the moment trend continuation, you can enter the same trade on more favorable conditions, with a smaller stop-loss and larger take-profit.
Trading on a pullback is performed as follows:
1. A Price Action pattern appears on the chart. This can be a pattern of engulfing, a doji candle on a trend reversal, etc.;
2. At the opening of the next candle, a Limit pending order is placed (to buy, if an uptrend is expected, and to sell, if a downtrend is in progress). The order is placed approximately in the middle of the signal candle;
3. Stop Loss is set a few points beyond the extremum of the signal candlestick (below the minimum if trading to buy, above the maximum if trading to sell);
Take Profit is set at trader's discretion. As an alternative, you can multiply the value of a stop-loss by 3 or 4, or set the take profit at the next key level, so that the price is guaranteed to catch it when it reaches this level.
🔵 Example of pullback trading
As an example, we will consider trading on a pullback on the hourly chart of the EURUSD in detail. As an alternative, we will also consider the variant of opening a breakout order in this situation and compare the results.
Events have developed as follows:
1. After a bullish move, a bearish doji candle was formed, signaling at least a correction;
2. At the opening of the next candle a Sell Limit order was placed (in this case the order was opened at the market, since the price at that moment was at the level of the supposed pending order);
3. Stop Loss is set above the maximum of the signal candle, Take Profit - in the area of the nearest support level;
4. The stop loss ratio is approximately 1:2.5, which provides a positive mathematical expectation of the trade;
5. After 6 hours the deal closed in profit.
In this case both trades would be profitable, but profit on breakout of the support level would be almost twice less, and the stop/stop profit ratio would be 1,5:1 not in favor of take profit, which is considered inappropriate from the money management viewpoint.
🔵 Additional details of pullback trading
Despite the fact that, in the example above, trading on a pullback was more profitable than trading on a breakout, it cannot be argued that this style is absolutely better. There are drawbacks to trading on a pullback as well. Unlike trading on a breakout which can be applied to all possible Price Action patterns, limit trading is not possible in every situation. Due to this the number of signals and possible transactions is reduced, and therefore the potential profit will also be less. In spite of the fact that as a rule the take profit at breakthrough trading is less than at limit trading. As we have more trades during the same test period, trading on the breakout can bring more profit.
For example, the screenshot above shows the trend continuation pattern of an inside bar. When trading on the breakout, a pending order is placed above the maximum of the parent bullish candle which opens after several hours and the trend goes upwards, bringing profit to the trader. There are no reasons for the limit trade in this situation.
It is impossible to place a pending order in the middle of the inside bar, and there is no logical reason to place it in the middle of the mother candle.
It happens that the signal not to open a trade on a pullback on the limit order does not work, even when there are all the conditions for it. For example, during the formation of an engulfing pattern on the screen above placing a limit order in the middle of this pattern was quite logical.
However, the signal candle turned out to be too strong, the pullback movement has not reached the pending order placed and the trade was not opened. In the same situation when trading on the breakout the trade would have been opened on the next candle, and in a few hours the trader would have fixed the profit.
🔵 Conclusion
Trading by Price Action on a pullback has both advantages and disadvantages. On the one hand, this style allows you to make more profits with less risk in the same situation, when trading on the pullback shows less attractive dynamics. On the other hand, not all price action patterns are suitable for this style, in addition even suitable signals sometimes do not work, leaving the trader without profit.
The choice of trading style largely depends on the trader's temperament. The pullback method suits the patient and conservative traders who are willing to wait for the signal for days and even weeks. As a result, such waiting will be rewarded with high profits on each of trades. More aggressive traders would be better suited to trading on the breakout which allows them to enter the market more often compensating the small profit and probable losses with the number of profitable trades.
Community ideas
Leveraged Share Conversion Calculcator Indicator coming soon! To be released this upcoming week :-).
Going over the functionality and setting up of my leveraged share conversion calculator indicator.
I will link it below upon its release.
This is the third and final reference indicator in my series, the other 2 being the Technical Dashboard and the P&L Indicator (I will link those below).
At this point, I will be going back over feedback to make improvements on all of the indicators while I wait for a stroke of ingenuity to realize again ;).
If you have feedback or technical problems with any of the indicators, please let me know in the comments but also if you can please include a chart image of any issue you are having, that would be very helpful.
Any recommendations, please leave in the comments below. I have received a couple that are on the agenda for implementation, its just a slow process :-).
Let me know your questions/comments and recommendations.
Safe trades everyone!

Get ahead of the Game of Crypto with Dow TheoryWelcome to @TradingView , this is @Vestinda! We're excited to share with you our insights on the Dow Jones Theory and how it can benefit cryptocurrency traders.
Dow Theory, also known as Dow Jones Theory, is a trading strategy developed by Charles Dow in the late 1800s.
Charles Dow did not write any books during his lifetime, but he did co-found The Wall Street Journal and the Dow Jones & Company. He also wrote many editorials for The Wall Street Journal. Here is a quote from one of his editorials that is particularly insightful:
"The successful investor is usually an individual who is inherently interested in business problems."
Dow theory continues to dominate and is regarded as one of the most sophisticated contemporary studies on technical analysis even after 100 years.
What exactly is Dow Theory?
Charles H. Dow compared the stock market to the tides of the ocean in the Wall Street Journal on January 31, 1901.
"A person watching the tide come in and wanting to know the exact location of the high tide places a stick in the sand at the points reached by the incoming waves until the stick reaches a position where the waves do not come up to it and finally recedes enough to show that the tide has turned." This method is effective for observing and predicting the flood tide of the stock market."
Dow believed that the current state of the stock market could be used to analyse the current state of the economy.
The stock market can provide valuable measures for understanding the reasons for high and low trends in the economy or individual stocks.
How Does the Dow Theory Work?
The Dow Theory is based on several fundamental tenets, which are outlined below:
1. The Averages Reflect Everything:
The market price takes into account every known or unknown factor that may impact both supply and demand. According to this observation, the market reflects all available information, even information that is not in the public domain. However, natural disasters such as droughts, cyclones, floods, or earthquakes cannot be considered.
Major Geopolitical Events are Already Priced In:
All significant geopolitical events, trade wars, domestic policies, elections, GDP growth, changes in interest rates, earning projections, or expectations are already priced in the market.
Unexpected Events Affect Short-Term Trends:
While unexpected events may occur, they usually only affect short-term trends, and the primary trend remains unaffected.
Overall, the Dow Theory emphasises the importance of analysing the primary trend of the market and understanding that all available information is already reflected in the market price.
2. The Market Has Three Trends:
The primary trend:
It can be as long as one year to several years and is the ‘main movement’ of the market. These movements are typically referred to as bull and bear markets. This primary uptrend is called as bullish on the other hand primary downtrend can be considered as bearish trends.
The reality of the situation is that nobody knows where and when the primary uptrend or downtrend will end.
As you can see in the image above when a stock is moving in primary uptrend it makes new high followed by few lows not lower than the previous lows.
Similarly the same patterns follows when it is in primary downtrend.
The objective of Dow Theory is to utilize what we do know, not to make chaotic guess about what we don’t know. Through a set of guidelines from Dow Theory one can measure to identify the primary trend and stay with it.
The intermediate trend or secondary trend:
This trend can last between 3 weeks to several months. Secondary movements are reactionary in nature, think of them as corrections during bull market, or rallies & recoveries in the bear market.
In a bull market, a secondary trend is considered a correction. In a bear market, secondary trend are called reaction rallies.
So suppose if a stock during its primary uptrend made a high, it will retrace back to some points to make a low (known as intermediate trend or correction).
Likewise during an primary downtrend, a stock can make a high after falling for several months or years(known as bear market rallies).
The minor trend or daily fluctuations:
This trend is least reliable which can be lasting from several days to few hours. Dow theory suggests not to put much attention to these trends. As a Long-term investor it is just the part of corrections in secondary uptrend or downtrend rally.
This are just daily fluctuations happening in market on day to day basis. It constitutes of noise in market and perhaps be subject to manipulation.
Out of the three trends mentioned only primary and secondary trends are trustworthy. However, the study of daily price action can add valuable insight, if you look in context of the larger picture.
So when you are looking for daily price action of several days, or weeks try to evaluate bigger structure getting formed. By putting enough attention one can certainly benefit in short term rallies.
A few pieces of a structure are meaningless, yet at the same time, they are essential to complete the entire picture.
3.Major Trends Have Three Phases:
Dow significantly paid attention to the primary trends (major) in which he spotted three phases. These are Accumulation phase, Public participation phase and Distribution phase.
These phases are cyclic in nature and repeats over the time.
A) Accumulation phase:
This phase occurs when the market is in bearish trend, sentiments are negative with no hope for any upcoming uptrend. For example as we saw in Indian share market a steep low in mid cap stocks, making new lows every other day.
Most of the investors see them stay in this trend for unknown time period. However, this is the time when big investors, huge fund houses, institutional investors start accumulating them gradually.
This is known as smart money keeping their view for long term investment. Although you would see sellers in market still selling, they find the buyers easily.
B) Public participation phase:
At this phase the market have already absorbed the negativity with ‘smart money’ getting invested. This is the second stage of a primary bull market and is usually sees the largest advance in prices.
During this phase majority of public(retailers) also thinks to join in as the price is rapidly advancing. However most of them are left behind due to speed in rallies as well as the averages start heading higher.
If you are also a trader or investor you might have this experience and a regret of not able to participate with rally. It is a period followed by improved business conditions and increased valuations in stocks.
C) Distribution phase:
The third stage is the excess phase which eventually be turned to distribution phase. During the third and final stage, the public (retailers) gets fully involved in the market, as they get mesmerized by the bull market rally.
Some of them who felt left will still try to look for valuations and want to be part of the rally.
But this is the time when ‘smart money’ starts liquidating shares on every high. Whereas public will try to buy at this level absorbing all liquidating (sell-off) volumes made by big investors.
On contrary in the distribution phase, whenever the prices attempt to go higher, the smart money off loads their holdings.
This is the beginning of bear market, where sentiments will start turning negative, you will see more and more companies filing bankruptcy, change in economic growth etc.
During bear market the level of frustration rises among retail investors as they start loosing all hopes.
4.The Averages Must Confirm Each Other:
Dow used to say that unless both Industrial and Rail(transportation) Averages exceed a previous peak, there is no confirmation or continuation of a bull market.
Both the averages did not have to move simultaneously, but the quicker one followed another – the stronger the confirmation.
To put it differently, observe the image above, as you can see both the averages are in bull market, trending upward from Point A to C.
5. Volume Must Confirm the Trend:
Volume is a tool to know how many shares have been bought and sold in a given period of time. It helps in analysing the trends and patterns.
Now according to Dow theory, a stock must be in uptrend with high volume and low in corrections.
Volumes may not be an attractive piece of information but you should try to combine the volume data with resistance and support levels to get a clear picture.
6. Trend Is expected to Be Continued Until Definite Signals of Its Reversal:
Quite similar to Newton’s first law of motion which states that an object will remain at rest or in uniform motion in a straight line unless acted upon by an external force.
In simple words an object will remain in their state of motion unless a external force acts to change the motion.
Likewise, the market will continue to move in a primary direction until a force, such as a change in business conditions, is strong enough to change the direction of this primary move. You can also see the signals for reversals when a trend is about to change.
7.Signals and Identification of Trends:
One of the major challenges faced while implementing Dow theory is the accurate identification of trend reversals. Remember, if you are following the dow theory one should be not only looking for overall market direction, but also the definite reversal signals.
One of the main skill used to identify trend reversals in Dow theory is peak and trough or high and low analysis. A peak is defined as the highest price of a market movement, while a trough is seen as the lowest price of a market movement.
Dow theory suggests that the market doesn’t move in a straight line but from highs (peaks) to lows (troughs), with the overall moves of the market trending in a direction.
An upward trend in Dow theory is a series of successively higher peaks and higher troughs. A downward trend is a series of successively lower peaks and lower troughs.
8. Manipulation In the Market:
According to Charles dow the manipulation of the primary trend is not possible. where as Intraday, or day to day trading and perhaps even the secondary movements could be vulnerable to manipulation.
These short movements, from a few hours to a few weeks, could be subject to manipulation by large institutions, speculators, breaking news or rumors.
There is possibility that speculators, specialists or anyone else involved in the markets could manipulate the prices in short run.
Individual shares could be manipulated for example the security rise up and then falls back and continues the primary trend. With this in mind one need to be aware of the situations while trading and investing.
However, it would be next to impossible to manipulate the market as a whole. The market is simply too big for any kind of manipulation to occur.
Why Dow Theory Is Not Infallible?
Dow Theory is not a sure-fire means of beating the market hence it is not something which is infallible or fault-less. Some of the criticism received about Dow Theory is that it is really not a theory.
Charles Dow's principles and theories, while developed for the stock market, can still be applied to crypto investing.
Here are a few ways his knowledge can be used:
Follow the trend: Dow's first principle is that the market moves in trends. In crypto investing, you can identify trends by looking at price charts and technical analysis. If the price of a particular cryptocurrency is in an uptrend, it may be a good time to consider buying. If it's in a downtrend, you may want to consider selling or waiting for a better entry point.
Consider market breadth: Dow's second principle is that the market's movements should be confirmed by market breadth. This means looking beyond just the price of one cryptocurrency and examining the overall health of the market. For example, if a particular cryptocurrency is in an uptrend but the majority of other cryptocurrencies are in a downtrend, it may not be a sustainable trend.
Use volume as a confirmation: Dow's third principle is that volume should confirm the trend. In crypto investing, volume can provide insight into the strength of a trend. For example, if the price of a cryptocurrency is increasing with high volume, it may indicate a strong uptrend. On the other hand, if the price is increasing with low volume, it may not be a sustainable trend.
Be aware of market cycles: Dow's fourth principle is that the market moves in cycles. This means that there will be periods of growth and periods of decline. In crypto investing, it's important to be aware of these cycles and adjust your strategy accordingly. For example, during a bull market, you may want to focus on buying and holding, while during a bear market, you may want to consider shorting or staying on the sidelines.
Overall, while the crypto market is different from the stock market, many of Dow's principles can still be applied to crypto investing to help you make more informed decisions.
In conclusion, Dow Theory, developed by Charles Dow in the late 1800s, remains one of the most respected theories in financial market history.
The theory's primary tenets are based on the idea that the stock market reflects all available information, and there are three trends in the market: primary, intermediate, and minor.
The primary trend is the most important and can last several years, while the intermediate trend and minor trend are reactionary in nature.
Dow Theory provides an excellent framework for traders and investors to evaluate the current state of the economy, and it has remained relevant even after 100 years. Whether you are an intraday trader, a short-term trader, or a long-term investor, the knowledge of Dow Theory will undoubtedly help you develop various strategies for your investments.
So, in conclusion, Dow Theory is a respectful theory that has stood the test of time and continues to be an essential tool for anyone who trades or invests in the financial and crypto market.
Unleash Your Inner Trader — Read Story About Bulls and Bears That Will Change Your Mindset!
Hey there, our lovely friends! 😊 If you enjoyed reading this, please hit the "like" button 👍 and share it on your social media and groups. By doing so, more people can discover this interesting information, and we'll be encouraged to create even more awesome content for you! ♥️

How to use the 24-hour gold price chart for trading?
Gold is a precious metal trading derivative product originated in London, but it has now become popular worldwide. How to use the 24-hour gold price chart for trading?
In addition to its high leverage and high yield characteristics, the 24-hour trading time is also an important product highlight. The significant fluctuation of international gold prices presents a great opportunity for investors to profit if they can learn to trade according to the characteristics of its price chart.
1.Pay attention to the market trends of different market sessions
For spot gold investors, the 24-hour trading time can be roughly divided into the Asian, European, and American market sessions. Due to the influence of different fundamental factors in various regions, gold prices will show different trends in these market sessions.
However, the basic trends can be roughly divided into uptrend, downtrend, and sideways trend. Investors should adopt different response strategies to different market trends.
For example, in the American market session, the international gold price is often in a volatile stage, and the ample market momentum makes the probability of one-way up or down movement higher. When investors find a sign of an uptrend, such as a small-bodied "red three soldiers" pattern appearing in the 15-minute chart, they can enter long positions during the time when the price is pulling back on the minute chart. Conversely, when the price rises and prepares for a correction, investors should adopt a strategy of selling on the rallies.
As for the Asian market session, since the price mostly corrects yesterday's trend, the weakening momentum often keeps the gold price in a sideways trend. In the narrow fluctuation range, investors can flexibly trade by using the support and resistance levels of the box.
2.Using Fibonacci time zones to calculate turning points
Fibonacci Time Zones are evolved from the Fibonacci sequence, which is a set of vertical lines drawn using Fibonacci time intervals of 1, 2, 3, 5, 8, 13, 21, 34, 55, 89, etc. The change in the spot gold price is more likely to occur near these lines, and it is possible to achieve a reversal from one trend to another. When drawing the lines, investors should pay attention to the following:
1. Start from the highest or lowest point of recent market trends.
2. The first candle after the Fibonacci line is crucial. It generally determines the trend of the following period. If it is a bearish candle, the period ahead may be dominated by a decline. If it is a bullish candle, the period ahead may be dominated by an increase.
3. Generally, the longer the analysis period used to draw the lines, the higher the reliability. However, in practice, if investors find that the rise and fall of gold prices during a certain period are in line with the periodicity, the probability of this pattern continuing is also very high.
That's all for the techniques of investing in gold. I will frequently share more investment techniques with you in the future! Stay tuned.
TVC:GOLD FOREXCOM:XAUUSD COMEX:GC1! MCX:GOLD1!

3 Tips Can Help You Boost Your Trading Whether we're tinkering with our demo accounts or playing with a few dollars in our live accounts, it's never been far from our minds that our accounts will go big in the future.
Unfortunately, many traders struggle with taking the next step and trading larger positions.
Some find it difficult to risk losing the small profits they've worked hard for over the last few months, while others simply can't stomach risking larger positions.
Taking on more risk has its benefits. But be cautious...!!!
While increasing your risk can result in bigger wins, it can also magnify your losses and wipe out your entire account.
To help you avoid the pitfalls of big trading, I'm sharing three simple tips for increasing your risk:
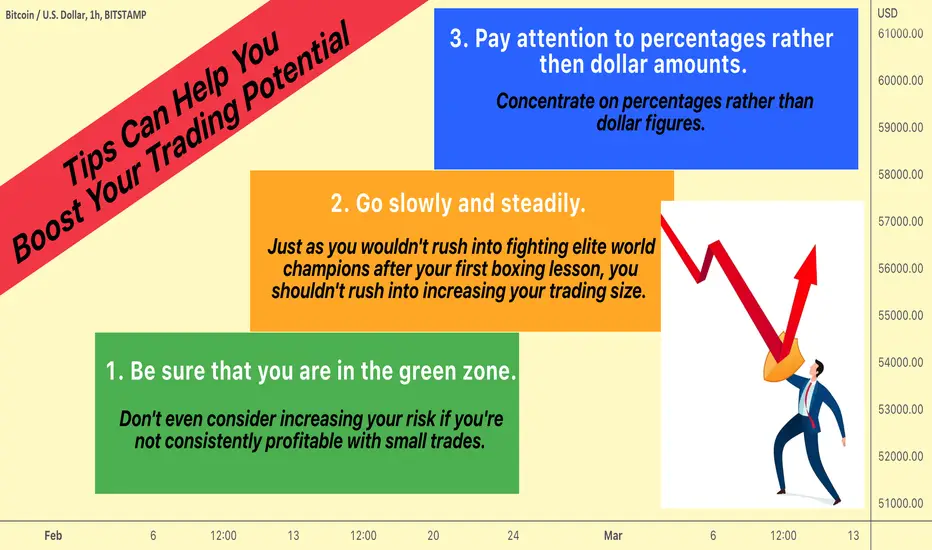
📌 1. Be sure that you are in the green zone.
Don't even consider increasing your risk if you're not consistently profitable with small trades.
If you can't trade small positions successfully, what makes you think you'll be able to trade larger ones?
If you believe you are prepared but your account is still in the red, prioritize getting it back into the black. That's why demo and small accounts exist.
Continue to trade small positions until your performance justifies trading larger ones. After all, you don't want to compound your losses by taking larger positions.
📌 2. Go slowly and steadily.
Just as you wouldn't rush into fighting elite world champions after your first boxing lesson, you shouldn't rush into increasing your trading size.
Do you want to bite off more than you can chew?
The key to becoming comfortable with taking a larger risk is to gradually increase the size of your positions.
If you're not completely comfortable with the level of risk you're taking, it will most likely be reflected in your account balance.
Rather than making a big jump, aim for small, steady increases. It will have a less negative impact on your trading mindset and will allow you to adjust to larger risks more smoothly.
📌 3. Pay attention to percentages rather than dollar amounts.
I'll reveal a little trading secret that will assist you in adjusting to larger trading sizes:
Concentrate on percentages rather than dollar figures.
A 1% risk on a $10,000 account is the same as a $100 risk. Risking 1% on a $100,000 account, on the other hand, is equivalent to risking $1,000. You can trade larger by risking the same percentage on a larger account.
When you focus on percentages, it also helps to put profits and losses into proper perspective.
Losing 1% on a $100,000 account will feel very similar to losing 1% on a $10,000 account. However, when expressed in raw dollar terms ($1,000 versus $100), it is much more difficult to swallow.
If you take it slow and steady, and focus on percentages rather than dollar amounts, you should be able to smoothly transition to trading larger trading positions. Above all, don't increase your risk if you're not already consistently profitable trading small.
Thanks for Your attention!
Always yours Kateryna💙💛
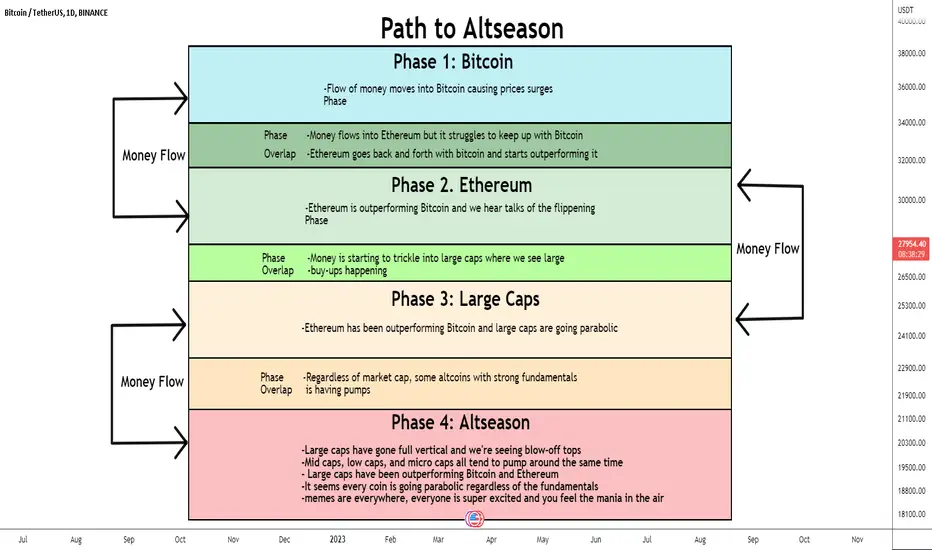
Path to AltseasonHello traders, today we will talk about Path to Altseason
BASIC INFO
Altcoin season, or ‘Altseason’, is the home of face-melting gains & high volatility. It’s pretty much Christmas for crypto traders.
Within a brief period (usually a few weeks or months), the prices of altcoins (all coins besides Bitcoin) skyrocket as investors move their money out of Bitcoin and into other cryptocurrencies.
Once prices start to rise, FOMO investment kicks in, causing a snowball effect which drives altcoin prices even higher to astronomical (and often overvalued) heights for a short period of time.
Many investors can make the majority of their profits for the year during an Altseason if they are able to sell their altcoins before Alts
Bitcoins & Altseason
Put simply, Altseason begins when altcoins start to outperform Bitcoin (when prices of alts rise in comparison to Bitcoin), and Altseason ends when Bitcoin outperforms altcoins.
However, this does not mean that when Bitcoin’s price goes down alts automatically go up. In fact, historically, Bitcoin has tended to lift altcoins when it rises and also bring them down after a major crash, with the price of Bitcoin and altcoins often being closely correlated. Previous bull markets have generally seen Bitcoin enjoy an uptrend before altcoins join the wave and head for the moon.
Key Takeaways
An altcoin is simply any other cryptocurrency that is not Bitcoin. They are usually more volatile than Bitcoin, offering high-risk high-reward opportunities.
When Bitcoin dominance (the amount of the total crypto market share held in Bitcoin) declines rapidly, it leads to an increase of investments in Altcoins, which causes an Altseason.
Predicting Altseason is not an exact science, and it is not something that’s officially announced at a certain time or date.
An Altseason can occur several times a year and they often happen within a relatively short period of time.
For maximum gains it’s crucial to sell your altcoins before Altseason is over. Alt’s prices drop just as quickly as they rose.
There have been many Altseasons in the last decade, with all of them beginning right after Bitcoin dominance declined.
The sharper the decline in BTC dominance the bigger the Altseason.
How to take advantage of Altseason?
The key to taking advantage of Altseason is to have your money in altcoins before Altseason begins, or just as it is beginning. Pay close attention as prices begin to rise, and make sure you sell out from most of your positions before Altseason ends and prices fall as quickly as they rose – don’t worry about trying to sell at the very peak, just take profits on the way up and be ready for things to end as quickly as they begun!
Top tips for navigating Altseason
Altseason is often the most lucrative time during a crypto market cycle, however, it is also the most volatile time. As the potential for gains rises so does your risk. Here are some tips to keep in mind during an Altseason:
Altseason is both an exciting and emotional time. If you’re a new investor, proceed with caution. Separating your investment decisions from your emotions is a tried-and-tested strategy for mitigating risk and maximising profits.
Having a solid exit strategy prepared will decrease the chances of you HODLing your alts through the peak only to see them fall when Altseason comes to an end.
Depending on your commitment level, spreading yourself too thin by investing in lots of altcoins can be confusing and difficult to keep track of. A bit of diversification is always good but don’t invest in more coins than you can keep track of!
Accept that you cannot be involved in every pumping altcoin. Choose your best picks and stay up to date on the relevant news and market movements.
Be sure to take profits on the way up to ensure that you realise most of your gains before prices come back down again. If you get a sizeable gain, you may want to reduce your position before the inevitable price correction!
Using your profits from Altseason to reinvest into Bitcoin while it is at a good price (and vice versa) is a popular strategy.
Risk management is the best way to make the most out of Altseason, given the sheer number of investment opportunities that will arise. Never risk so much that you won’t be able to keep playing – there can be multiple Altseasons in a year!
The key to taking advantage of Altseason is to have your money in altcoins before Altseason begins, or just as it is beginning. Pay close attention as prices begin to rise, and make sure you sell out from most of your positions before Altseason ends and prices fall as quickly as they rose – don’t worry about trying to sell at the very peak, just take profits on the way up and be ready for things to end as quickly as they begun!
The Altcoin Season Index is a helpful (but not exact) tool to see where we are in relation to Altseason. According to the Altcoin Season Index, if 75% of the Top 50 altcoins performed better than Bitcoin over the last season (90 days), it is Altcoin Season.
They also give an indication of where we are in terms of an Altcoin Month or Year, with an easy to interpret graph that shows the general long-term trends of previous Altseasons.
Altcoin season is not something that’s officially announced at a certain time or date. Nobody knows for sure when it’s upon us, nor when it will end. All we have are certain indicators that can help us know if we have entered Altseason.
Why does Altseason see such huge gains?
FOMO and the snowball effect play a big part. Part of the reason Altseason sees such a dramatic rise in prices is because many new investors see prices beginning to rise, and immediately invest out of FOMO.
This creates a snowball effect which pushes prices higher and higher until they are overvalued and in a bubble. When people realise they are riding a precarious rollercoaster that may crash at any moment, they begin to sell. This causes panic which leads to more mass selling and the price plummeting back down to earth, bringing Altseason to an abrupt end.
When is the top of Altseason/the bull market?
The million-dollar question that no-one can really answer. While crypto markets follow cycles which can be predicted based on past market movements, every bull run is different and it is incredibly difficult predict the very top of Altseason, or any bull run for that matter.
Given the fact that no-one really knows exactly when the top of the bull run or Altseason will be, it is wise to take profits along the way as your portfolio gains value. Dollar-cost-average selling (DCA) can be useful to minimise the impact of the market’s volatility while you invest.
If Bitcoin’s price goes up will altcoins also go up?
Generally, yes. The price of most altcoins is highly correlated with the price of Bitcoin. It is Bitcoin dominance, however, that indicates when Altseason is beginning.
Why are altcoins dependent on Bitcoin?
A major reason that altcoin’s and Bitcoin’s prices are so highly correlated is that many altcoins are purchased with Bitcoin. Bitcoin is often bought before the purchase of an altcoin, pushing the price of both coins up.
Similarly, if someone wants to cash out on an altcoin, many exchanges require you to first sell that altcoin for Bitcoin, and then sell the Bitcoin for cash, which pushes both prices down at the same time.
Another reason the prices are highly correlated is simply because they’re in the same asset class and things that are in the same asset class tend to go up and down together.
What to look out for to predict an Altseason
The most important thing would be a decrease in Bitcoin dominance, usually occurring after an exponential increase and subsequent consolidation. Additionally, relative trade volume, social media activity, mainstream interest, new coin listings and the volume of news articles published from crypto projects seem to be good indicators of when Altseason might be approaching.
What is Ethereum’s relationship to Altseason?
Ethereum, seen as the second most trusted cryptocurrency and the silver to Bitcoin’s gold, is at the heart of the altcoin market. The start of bullish moves for Ethereum is often the start of Altseason, especially with so many alts and DeFi projects being built on top of the Ethereum Blockchain.
Generally, after Bitcoin rallies upwards and consolidates, Ether’s price will also need to break out before altcoins can see a sizable rally.
Can altcoins lift Bitcoin?
Not really. Bitcoin rarely gets boosted by altcoins.
Generally, once altcoins have pumped and claimed dominance from Bitcoin, the steps in to take back the bulk of the crypto market share, marking the end of Altseason.
What is an example of Bitcoin Dominance influencing Altseason?
On December 9, 2017, Bitcoin Dominance had gone from 69% to 37% in the space of just 35 days (which means it went from owning 69% of the total crypto market share to 37% in just over a month).
Looking at the Altcoin market cap chart, December 9 coincides exactly with the beginning of the largest Altseason that crypto had ever seen. The sharper the decline in Bitcoin Dominance, the bigger the spike in Alts.
History also repeated itself on March 30, 2018 when a sharp decline in Bitcoin Dominance from 50 to 38 in 40 days led to a significant increase in the Altcoins market cap.
What have previous Altseasons and bull runs taught us?
Previous bull runs and Altseasons suggest that larger-cap altcoins (starting with Ethereum) pump before smaller-cap altcoins begin moving up. This usually happens after Bitcoin has had a big move up, followed by some sideways movement, causing investors to seek gains in altcoins, thus decreasing Bitcoin dominance and starting the party that is Altseason.
IMPORTANT
BTC Rises - Altcoins Not Rising
BTC drops - Altcoins Super Drop
The scenario is confirming this - Be sure to survive before Altseason arrives
Never stop learning
I would also love to know your charts and views in the comment section.
Thank you
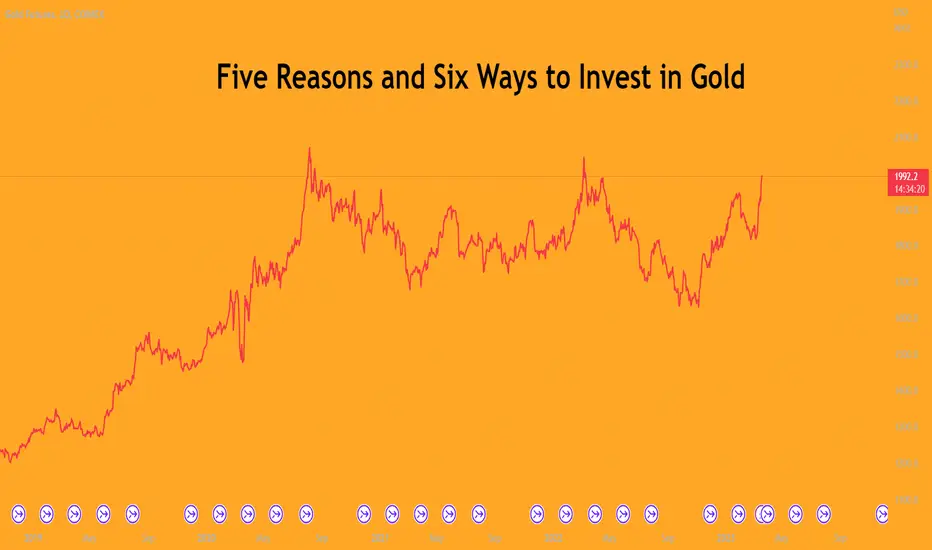
Five Reasons and Six Ways to Invest in Gold"Gold is money. Everything else is credit.", said John Pierpont Morgan. When borrowers default, markets collapse and banks run into crisis, gold prices skyrocket. Gold is trading at a 12-month high on March 18th.
Gold has been valued for thousands of years. Gold has unique properties. It has been enchanting women and men since humans set foot on the planet.
Polycrisis. That aptly describes the current times. The US regional bank crisis haunts markets. Credit Suisse - the bank to the wealthiest was so frail that Swiss National Bank had to step in to provide liquidity backstop. Regulators worked over the weekend to broker an acquisition by UBS to prevent a banking crisis from spreading. Inflation is raging hot at levels unseen in 40+ years. Compounding Chair Powell's quagmire, the US Fed has been forced to switch from QT to QE by providing support to its regional banks from collapsing under crisis of confidence. Geo-politics remains tricky.
In times of crisis, investors seek flight to safety. Safest of all assets since civilisation began has been gold.
This educational piece provides an overview of (a) physical gold market dynamics, (b) largest holders of gold reserves, and (c) gold price behaviour against other asset classes. It also describes five primary reasons for investing in gold, contrasts six methods of doing so, and highlights the downsides of holding gold.
PHYSICAL GOLD DYNAMICS
Gold performs multiple functions. It is a currency to some. Store of wealth to others. It is an industrial metal used in consumer electronics. The rich love gold in clothing and food.
A bird's eye view of physical gold can be summarily described in three parts:
1. Consumers : Gold is used in consumer electronics due to its high conductivity and low corrosive properties. Gold used as industrial metal represents 6%-8% of total demand. Unsurprisingly, >50% of global gold demand is for jewellery. Jewellery is a multi-tasker. It meets aesthetic goals, serves as a status symbol while also being a form of investment.
2. Gold Reserves : Central banks hold gold as reserves. They are the most significant holders of gold. The haven nature of gold compels central banks to increase holdings during economic uncertainty, high inflation, or currency devaluation. Central Banks added >382 tonnes to their reserves in 2022.
3. Producers : Gold mining is a cyclical industry. Mining output has been in decline over the past decade as major gold producers shift to mining minerals and other metals like copper with the proliferation of lithium-ion batteries in EVs. Gold mining took a huge output hit during the pandemic and may not recover any time soon as capital expenditure into new gold mines is limited.
GOLD RESERVES - THE MOVERS AND SHAKERS
According to the World Gold Council, as of end 2022, central banks in Western European (11.8k tons) have the largest gold reserves followed by North Americans (8.1k tons), Central & Eastern Europeans (3.5k tons), and East Asians (3.4k tons).
Last year, central banks of Turkey, China, Egypt, Qatar, and Uzbekistan were the largest buyers of gold.
FIVE REASONS WHY GOLD SHOULD BE IN INVESTMENT PORTFOLIOS
Gold is a resilient store of wealth, provides meaningful portfolio diversification, has limited price volatility, extends benefits of hedge against inflation & currency debasement, and is limited in supply.
1. Resilient Store of Wealth
Gold outperforms equities during periods of economic instability. Due to its material properties and scarcity, it can even become more valuable during such periods as investors seek shelter in classic risk-off assets such as gold.
2. Portfolio Diversification
Gold can have both positive and negative correlation with other asset classes during different periods. This makes it an attractive addition to a diversified portfolio.
3. Limited Volatility
Due to its large market size and diverse supply origins, gold is less volatile than equities and other asset classes making it a safer asset class for investors.
4. Inflation Hedge
Gold is often seen as an inflation hedge. Which means that it can maintain its value or appreciate during periods of high inflation due to its scarcity and safety.
However, in some cases monetary policy changes like interest rate hikes may make gold a less attractive investment compared to treasury yields during inflationary periods.
5. Limited in supply
Gold is a finite resource, that too, one of the rarest precious metals in the world. Moreover, more than 200,000 tonnes of gold have already been dug up.
This represents more than half of the total reserves. The gold that is yet to be mined is much more difficult to extract economically.
Scarcity creates rarity, which in turn drives the value of the existing gold higher.
Many governments, banks, and people also use gold as a long-term investment, which means a huge portion of the gold supply is taken out of circulation, shrinking available supply even more.
SIX WAYS OF INVESTING IN GOLD
There are multiple ways of investing in gold. Six primary ones are:
1. Physical Gold : Gold can be bought and stored in the form of jewellery or gold bars. Costs of storage, insurance and making charges can be substantial and also inconvenient. Investing in physical gold is not optimal for reasons of poor convenience and higher transaction costs.
2. Gold ETF : Exposure to gold can also be acquired through buying exchange traded funds (ETF) backed by physical gold. There are multiple ETFs that track physical gold prices. The SPDR Gold Shares ETF (GLD) was the pioneer and began trading in 2004. It has an expense ratio of 0.4% and tracks gold bullion prices. GLD holds both physical gold bullion and cash.
GLD provides a liquid lower-cost method to buy and hold gold. Gold can be bought and sold during the trading day at market price. Investors must pay heed to taxation as gains from ETFs in some jurisdictions can be treated differently compared to other forms of gold.
3. Gold Futures : CME’s COMEX Gold futures is the world’s most liquid derivatives which enables capital efficient exposure to Gold. With round the clock liquidity, tight bid-ask spread and benefits of a cleared contract, investing through COMEX Gold futures is widely popular.
Each lot of COMEX Gold Futures provides exposure to 100 oz of Gold. Enabling affordable access to investors and to facilitate accurate granular hedging, CME also offers Micro Gold Futures. Each lot of Micro Gold contract provides exposure to 10 oz of Gold.
4. Gold Options : CME also offers options on Gold Futures. Gold options is a useful investing and hedging tool. Using options, investors can lock in unlimited upside potential of price moves while limiting the adverse impact of downside price moves.
5. Shares of Gold Producers : Gold mining is an international business. Gold is mined on every continent except Antarctica. Top gold miners include Newmont (USA), Barrick (Canada), Anglogold Ashanti (South Africa), Kinross (Canada), Gold Fields (South Africa), Newcrest (Australia), Agnica Eagle (Canada), Polyus (Russia), Polymetal (Russia), and Harmony (South Africa).
As is evident from the chart above, investing in gold miners for exposure to gold is a poor proxy as most of them have underperformed relative to gold prices. Furthermore, FX exposures must be hedged separately for some stocks which trade in emerging markets. In summary, securing gold exposure through miners is not optimal relative to other alternatives.
6. Gold CFDs : CFDs also known as contract for differences allows for synthetic access to the price of spot gold. These CFDs are OTC derivatives contracts which carry non-trivial counterparty risk with investors being exposed to the credit risk of the CFD provider.
The table below summarises the merits of various gold investment instruments across key investment attributes.
GOLD TOO HAS ITS DOWNSIDES
Gold is a non-yielding asset. Shares of profitable companies pay dividends. Holding debt earns interest. Real estate delivers rents. But gold provides zero yield.
For every problem, innovation in markets provides a solution. In a future paper, Mint Finance will demonstrate how gold can be transformed into a yield generating asset.
Rising interest rates are headwinds to gold. As rates on treasury, bonds and deposits rise, investors rotate their money out of gold and into yield generating assets.
Not only is gold non-yielding, but the returns also fade into insignificance relative to gains from innovation. In times of crisis, gold is a great hedge. However, while positioning portfolios for the long term, investors must astutely balance between safety versus growth.
GOLD RETURNS IN RELATION TO OTHER ASSET CLASSES
1. US Equities and Emerging Markets
Gold outperforms equities during periods of crisis. During equity bull runs, gold underperforms equities. Cumulatively, over the last 20 years, Gold has outperformed Dow Jones, S&P 500, and MSCI Emerging Markets. Only Nasdaq, which represents tech, innovation and growth has surpassed gold returns.
2. Treasuries with 2-Year and 10-Year Maturities
Unsurprisingly, when sovereign risks rise and treasury yields fall to zero, gold shines. Between two non-yielding assets, investors prefer to take shelter in gold as a preferred haven. However, when rates rise, investors rotate out of gold and into treasuries.
3. Crude Oil, Copper, and Silver
Over the last two decades, Gold has outperformed crude oil, copper, and silver.
4. Dollar Index, Bitcoin and Ethereum
While US Dollar and gold are both global reserves, gold has outperformed the Dollar Index which is the value of the USD against a basket of six international currencies.
However, relative to bitcoin and ethereum, gold pales into insignificance. Bitcoin is perceived as millennial gold and ethereum is the millennial oil. Both assets have obliterated gold in terms of price returns.
5. Major Currencies
Over the last 3 years, as markets emerged out of the pandemic, gold has outperformed all the major currencies. Yen, under the influence of Governor Kuroda’s liberal QE program, has depreciated 63% against gold.
Indian Rupee has deflated 47% while Euro and Sterling have shed 38% and 32% against gold.
The US Dollar, Chinese Renminbi, and Aussie Dollar have depreciated 31%, 29% and 20% against gold, respectively.
Key Takeaways
Gold is money. Everything else is credit. Gold glows in crisis. It is a knight in shining armour for investors. Gold is the only asset which exhibits negative correlation.
These are times of polycrisis. As investors seek flight to safety from banks even, gold is the safest among the few remaining alternatives.
Gold is a resilient store of wealth, offers durable diversification within a portfolio, exhibits much lower volatility relative to equities, and serves as an inflation hedge albeit with less than a perfect record.
Clients can invest in gold in multiple ways. Gold futures is the most convenient and optimal among the six alternatives.
Gold has its downsides. It is a non-yielding asset and performs dismally against innovation and growth.
Except for Nasdaq, bitcoin and ethereum, gold has outperformed currency majors, equity indices, US treasury, and commodities.
In a future paper, Mint Finance will explore ways in which gold can be transformed into a yield generating asset.
MARKET DATA
CME Real-time Market Data helps identify trading set-ups and express market views better. If you have futures in your trading portfolio, you can check out on CME Group data plans available that suit your trading needs tradingview.sweetlogin.com
DISCLAIMER
Trade ideas cited above are for illustration only, as an integral part of a case study to demonstrate the fundamental concepts in risk management under the market scenarios being discussed. They shall not be construed as investment recommendations or advice. Nor are they used to promote any specific products, or services.
This material has been published for general education and circulation only. It does not offer or solicit to buy or sell and does not address specific investment or risk management objectives, financial situation, or needs of any person.
Advice should be sought from a financial advisor regarding the suitability of any investment or risk management product before investing or adopting any investment or hedging strategies. Past performance is not indicative of future performance.
All examples used in this workshop are hypothetical and are used for explanation purposes only. Contents in this material is not investment advice and/or may or may not be the results of actual market experience.
Mint Finance does not endorse or shall not be liable for the content of information provided by third parties. Use of and/or reliance on such information is entirely at the reader’s own risk.
These materials are not intended for distribution to, or for use by or to be acted on by any person or entity located in any jurisdiction where such distribution, use or action would be contrary to applicable laws or regulations or would subject Mint Finance to any registration or licensing requirement.
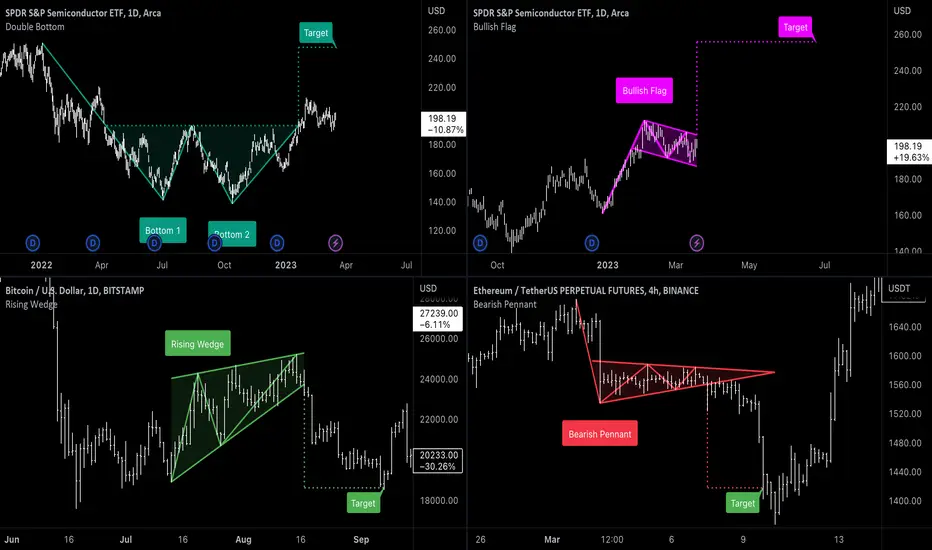
Automatically identify chart patterns using built-in indicatorsHey everyone! 👋
⚠️ Before we get started, please know the information about expected price targets provided by Auto Chart Patterns isn't a recommendation for what you should personally do. Do not take this data as investment advice. It should only be used for education and research. As with any trade, always look first and then leap. Read more in the Terms of Use .
That being said, let's get into it.
This chart showcases a few of the Automatic Chart Patterns indicators recently announced in this blog post . If you are a technical trader who relies on chart patterns to make trading decisions and hold a Premium TradingView plan, check them out. They automatically identify these popular technical setups:
Bearish and Bullish Flags
Double Bottom
Double Top
Elliot Wave
Head and Shoulders
Inverse Head and Shoulders
Bearish and Bullish Pennants
Rectangles
Triangles
Triple Bottom
Triple Top
Falling and Rising Wedges
You can add the indicators to your chart from the "Indicators, Metrics & Strategies" search window by selecting "Patterns" from the "Technicals" tab in the left pane and choosing an indicator from the list:
Once you have selected a chart pattern, the indicator will automatically draw it on the chart for you when it detects the pattern.
The chart pattern indicators are easy to use and customize. You can alter the pattern detection criteria and visible attributes like color, line thickness, and style of the lines.
We hope you enjoy these new indicators.
— Team TradingView ❤️
The Role of ChatGPT in Algorithmic TradingThe Role of ChatGPT in Algorithmic Trading
1. Introduction
In recent years, algorithmic trading has become an increasingly important aspect of the financial markets. Algorithmic trading involves using computer programs to execute trades based on predetermined rules and algorithms, with the goal of maximizing returns and minimizing risk. The use of algorithms allows traders to make rapid, data-driven decisions and respond to market conditions faster than traditional human traders.
Natural language processing (NLP) is a field of computer science that focuses on the interactions between computers and human language. In the context of algorithmic trading, NLP techniques are used to analyze vast amounts of financial news, social media, and other sources of information to identify potential trading opportunities. By analyzing this data, traders can make informed decisions and gain a competitive edge in the market.
One of the key tools used in NLP for algorithmic trading is ChatGPT, a large language model trained by OpenAI. ChatGPT is a powerful tool that can analyze vast amounts of text data and generate human-like responses. Its capabilities include natural language understanding, machine translation, text summarization, and text completion.
With its ability to analyze and understand large amounts of text data, ChatGPT is an essential tool for traders looking to gain a competitive edge in the market. For example, ChatGPT can be used to analyze financial news articles and social media posts to identify companies that are likely to experience a significant change in their stock price. By analyzing the sentiment of these articles and posts, ChatGPT can determine whether there is a positive or negative outlook for a particular company, which can be used to inform trading decisions.
In addition to sentiment analysis, ChatGPT can also be used to generate summaries of news articles, which can save traders valuable time and allow them to quickly digest important information. ChatGPT can also be used to generate text responses to customer inquiries, freeing up traders to focus on more important tasks.
Overall, the use of NLP and ChatGPT in algorithmic trading is becoming increasingly important. As the amount of data available to traders continues to grow, the ability to quickly and accurately analyze that data will become essential for achieving success in the market. With its powerful NLP capabilities, ChatGPT is poised to play a significant role in the future of algorithmic trading.
2. NLP Techniques for Algorithmic Trading
Natural language processing (NLP) is an essential tool for algorithmic trading, enabling traders to quickly and accurately analyze large volumes of text data. In this section, we'll explore some of the key NLP techniques used in algorithmic trading, including analysis of financial news and social media, sentiment analysis, and identification of potential trading opportunities.
One of the most powerful applications of NLP in algorithmic trading is the analysis of financial news and social media. By analyzing news articles and social media posts, traders can gain insight into the market sentiment and identify emerging trends or potential trading opportunities. For example, if a large number of news articles and social media posts are discussing a particular company, it may be an indication that the company is about to experience a significant change in its stock price.
Sentiment analysis is another important NLP technique in algorithmic trading. Sentiment analysis involves using NLP algorithms to determine the emotional tone of a particular piece of text. By analyzing the sentiment of news articles, social media posts, and other sources of information, traders can gain insight into the market sentiment towards a particular company or industry. This information can then be used to inform trading decisions.
Identification of potential trading opportunities using NLP is another key application of this technology. By analyzing large volumes of data, including news articles, social media posts, and other sources of information, traders can identify emerging trends or potential trading opportunities. For example, by analyzing news articles and social media posts, traders may identify a new technology that is rapidly gaining popularity, indicating a potential investment opportunity.
Overall, the use of NLP techniques in algorithmic trading is becoming increasingly important. With the amount of data available to traders continuing to grow, the ability to quickly and accurately analyze that data will be essential for achieving success in the market. NLP techniques, including the analysis of financial news and social media, sentiment analysis, and identification of potential trading opportunities, are powerful tools that can help traders gain a competitive edge and achieve success in the market.
3. Predictive Models with ChatGPT
Predictive models are an essential tool for algorithmic trading, enabling traders to identify patterns and predict future market trends. In this section, we'll explore how ChatGPT can be used to develop predictive models and the advantages of using this technology.
At its core, predictive modeling involves using historical data to identify patterns and predict future trends. This process involves analyzing large volumes of data to identify patterns and trends that can be used to inform trading decisions. With the increasing amount of data available to traders, the ability to quickly and accurately analyze that data is becoming essential for achieving success in the market.
ChatGPT is a powerful tool that can be used to analyze large datasets and identify patterns that may be missed by other analytical tools. With its ability to understand natural language, ChatGPT can analyze vast amounts of financial news, social media, and other sources of information to identify patterns and trends. This information can then be used to develop predictive models that can be used to inform trading decisions.
One of the key advantages of using ChatGPT in developing predictive models is its ability to understand the context of the data it is analyzing. Unlike other analytical tools, which may only be able to identify patterns based on simple statistical analysis, ChatGPT can analyze text data to understand the context and nuances of the information being analyzed. This allows traders to identify patterns and trends that may not be immediately apparent using other analytical tools.
Another advantage of using ChatGPT in developing predictive models is its ability to learn from new data. As more data becomes available, ChatGPT can be trained to recognize new patterns and trends, improving the accuracy of its predictions over time.
4. Machine Learning with ChatGPT
Machine learning is a critical component of algorithmic trading, allowing traders to develop sophisticated models that can identify patterns and make real-time trading decisions. In this section, we'll explore how ChatGPT can be used in machine learning models for algorithmic trading, the advantages of using this technology, and some examples of its use.
Machine learning involves using algorithms to analyze large amounts of data, identify patterns, and make predictions. This process involves training the algorithm on historical data to recognize patterns that can be used to inform trading decisions. With the increasing amount of data available to traders, the ability to quickly and accurately analyze that data is becoming essential for achieving success in the market.
ChatGPT can be used in machine learning models to analyze text data and make real-time trading decisions based on that data. For example, ChatGPT can be used to analyze financial news and social media to identify patterns that may not be immediately apparent to other analytical tools. This information can then be used to inform machine learning models that make real-time trading decisions.
One of the key advantages of using ChatGPT in machine learning models for algorithmic trading is its ability to understand natural language. Unlike other analytical tools, which may only be able to analyze structured data, ChatGPT can analyze unstructured data such as news articles and social media posts. This ability to understand the context of the data being analyzed is essential for developing accurate machine learning models.
Another advantage of using ChatGPT in machine learning models is its ability to learn from new data in real-time. As more data becomes available, ChatGPT can be trained to recognize new patterns and trends, improving the accuracy of its predictions over time. This ability to adapt to changing market conditions is essential for achieving success in the algorithmic trading market.
There are several examples of machine learning models that use ChatGPT in algorithmic trading. For example, ChatGPT can be used to analyze financial news to identify patterns and inform machine learning models that make real-time trading decisions. ChatGPT can also be used to analyze social media sentiment to inform trading decisions based on public perception of a particular stock or market.
5. Limitations and Future Directions
While ChatGPT and NLP techniques have a lot of potential in algorithmic trading, there are also limitations to their use. In this section, we'll discuss some of the challenges associated with using ChatGPT and NLP in algorithmic trading, as well as potential future directions for these technologies.
One of the main limitations of using ChatGPT and NLP in algorithmic trading is the potential for bias in the data being analyzed. NLP techniques rely on training data to identify patterns and make predictions, but if that data is biased in some way, it can lead to inaccurate predictions. For example, if a machine learning model is trained on historical data that reflects biased trading practices, it may perpetuate those biases in future trading decisions.
Another limitation of using ChatGPT and NLP in algorithmic trading is the potential for the model to be fooled by fake or misleading information. As we've seen in recent years, social media platforms can be manipulated by bad actors to spread false information or manipulate public sentiment. If ChatGPT is trained on this misleading information, it can lead to inaccurate predictions and trading decisions.
Despite these limitations, there are several potential future directions for ChatGPT and NLP in algorithmic trading. One of these is the development of more sophisticated machine learning models that can better handle unstructured data. While ChatGPT has shown promise in this area, there is still much work to be done to improve the accuracy of these models.
Another potential future direction for ChatGPT and NLP in algorithmic trading is the use of natural language generation (NLG) to create more sophisticated trading strategies. NLG involves using machine learning to generate human-like language that can be used to describe trading strategies and other complex financial concepts. This can help traders better understand the decisions being made by their machine learning models and make more informed decisions.
In conclusion, while ChatGPT and NLP techniques have a lot of potential in algorithmic trading, there are also limitations to their use. By addressing these limitations and exploring new directions for these technologies, we can continue to improve the accuracy and effectiveness of algorithmic trading models. As the amount of data available to traders continues to grow, the importance of these technologies in the trading industry will only continue to increase.
6. Conclusion
In conclusion, ChatGPT and natural language processing techniques have become increasingly important in algorithmic trading. By analyzing large amounts of unstructured data from sources such as financial news and social media, ChatGPT can help identify potential trading opportunities and provide valuable insights to traders.
One of the key advantages of using ChatGPT in algorithmic trading is its ability to analyze and understand human language. By analyzing sentiment and other linguistic patterns, ChatGPT can provide valuable insights into public opinion and market trends, which can be used to inform trading decisions.
Another advantage of ChatGPT in algorithmic trading is its ability to analyze large datasets and identify patterns that may not be immediately apparent to human traders. By using machine learning models to analyze historical data, ChatGPT can identify trends and make predictions that can help traders make more informed decisions.
Looking to the future, it's likely that ChatGPT and other NLP techniques will continue to play a significant role in algorithmic trading. As the amount of data available to traders continues to grow, the importance of these technologies in the trading industry will only continue to increase.
However, there are also potential challenges and limitations associated with using ChatGPT and NLP in algorithmic trading. It's important to be aware of these limitations and to work to address them in order to ensure that these technologies are used in a responsible and effective way.
Overall, the use of ChatGPT in algorithmic trading represents an exciting development in the field of finance. By using machine learning and natural language processing techniques to analyze large amounts of data, traders can gain new insights and make more informed decisions. With continued research and development, the potential applications of ChatGPT and other NLP techniques in algorithmic trading are sure to grow and evolve in the years to come.

Why Trading Should be like Watching Paint DryIt has to be said.
If you want excitement, take $10,000 and go to Las Vegas for a day.
Trading should not bring about the same level of excitement.
I’m not saying, the entire process should be boring.
In life and with the careers you choose, you have to love what you do.
You have to keep the reward and vison in your mind, to drive you each morning.
And you need to have the discipline and integration to follow your plan each day.
So, should trading be boring? Um, yes and no.
Let’s start with where trading should be exciting and fun.
When Trading is a Thrill
This is where most people stay. They don’t take the necessary steps to open a trading account, fund it and grow their portfolios.
Instead, they stay in a feel safe and in control of their non-growing finances.
I still have members who’ve followed me for 10 years, and haven’t taken ONE single trade.
You need to jump out and take action.
The thrill of trading should be before the execution takes place.
This includes:
Analysing the markets
Optimising your strategies
Searching for high probability trades
Reading up on new trading developments and fundamentals
Monitoring your results and working on your statistics
Finding new markets and instruments to trade and add to your strategy
This part is an absolute blast. And requires no risk and no waiting.
But then, when you do find your trade line up and put in your trading levels and click buy / sell… Then…
Trading needs to be like watching paint dry or grass grow
Once you have taken your trade, set your entry, stop loss and take profit levels – you’ve done your job.
You now need to let it go and let the market to take over.
Don’t interfere…
Don’t get excited when it’s in the money.
Don’t fear when it’s going against you.
Don’t watch every tick.
It will drive you insane.
Just leave it alone.
It should be boring to even see what your trade is doing, because it’s out of your control.
If it hits your stop loss – cool… You’ve got your risk management in play.
If it hits your take profit – cool… You’ve got your reward management in play.
If you have rules to adjust your stop loss, when the market is moving in your favour – cool… You’ve got your reward management in play.
Rather focus on the next trade idea or the other bullets I mentioned in the beginning.
Keep control with what you can control and leave what you can’t control to the “stars”.

Trading Psychology: How Does Your Mind Matter In Making Money?Hello traders, today we will talk about Trading Psychology
The most famous book on trading psychology, “Tradingpsychologie” aptly remarks, ‘The greatest enemy of the trader is fear. He who is afraid loses!’.
As a trader, you must have gone through emotions such as fear, greed, regret, hope, overconfidence, doubt, nervousness etc.
While every trader goes through this emotional rollercoaster, a successful trader knows that it’s never a good idea to let your emotions influence your investment decisions.
Not letting your emotions affect your trading decisions is the real meaning of trading psychology!
In this article, we will educate you on the meaning of trading psychology. We will also reveal trading tips and tricks to mentally prepare you to trade with confidence!
So, let’s begin!
What is Trading Psychology?
Trading psychology or investor psychology refers to the trader’s emotional and mental state which dictates their trading actions.
Some of these emotions like hope, confidence are helpful and should be embraced. But emotions like fear and greed must be contained. Another emotion that is very common in financial markets is the fear of missing out or FOMO.
It is essential to understand and develop a sharp mindset along with knowledge and experience to become a successful trader.
Let us take a look at the various psychological factors that affect a trader’s mindset and some pro-tips to deal with them.
1. Fear
Fear is a natural reaction that we sense when something is at risk. While trading, risks could occur in many forms –
Some bad news about the stocks or the market
Placing a trade and realising it’s not going the way you had hoped
Fear of loss of capital
Traders generally overreact and tend to liquidate their holdings because of fear. A strong trading psychology is when traders do not let fear dictate their buy/sell strategy.
What should you do?
Every trader must first understand what they are afraid of and why? Reflect on these issues ahead of time so you can quickly identify the problem and find a solution. Your focus should be to not let the fear of loss refrain you from making profit.
2. Greed
Greed enters when you desire excess profits. Rome was not built in a day and neither will your stock market fortune. If you find yourself on a winning streak, then book your profits and move on. Majority of the time, your greed will turn a winning streak into a disaster!
What should you do?
To combat greed, you should have a predefined profit booking level. Even before you enter a trade, define your stop-loss and book-profit levels to avoid being swayed by greed.
A sound trading psychology is when you are content with your profits and do not chase irrational profits.
3. Regret
Regret in trading comes in two ways.
A trader could regret placing a trade that didn’t work or
Regret not placing a trade that could have worked.
A trading psychology based on regret can be dangerous for a trader as it may result in placing wrong trades.
What should you do?
The best way to avoid a regretful trading psychology is to accept that you can’t have all the opportunities in the market. The equation in the stock markets is very simple – You win some; you lose some.
Once you accept this rule, your trading psychology will automatically change for the better.
4. Hope
Investors often think that trading is gambling. It’s because they hope to win all the time and when they don’t, they get dejected.
What should you do?
To become a successful trader, you must have a solid trading psychology which is not dependent on hope. If you keep hoping for things to change in the near future, you’re putting your entire investment at risk.
Don’t let hope keep you invested in a loss making trade. Be practical, and book your losses at the correct time.
To attain and maintain success as a trader, you have to work hard to cultivate a mindset! Let’s see how trading psychology helps you cultivate a better mindset!
How to Improve Your Trading Psychology
1. Get Yourself in the Right Mindset
Before you even start your trading day, simply remind yourself that markets are never constant. You will have some good days and some bad days, but the bad days too shall pass.
Another effective strategy to improve your trading psychology is to give yourself time. You are not going to make a fortune on your very first trading day. You need to spend time and efforts in creating a rock solid trading strategy which isn’t affected by the market sentiments.
While you cannot completely eliminate emotions from trading, the goal is to reduce the extent of emotions controlling your trading psychology.
2. Have a Great Knowledge Base
One of the best ways to improve your trading psychology is to increase your knowledge and trading skills. Having a strong knowledge base of the stock market is key to defeating negative trading psychology. Remember, knowledge is power!
3. Remind yourself that you are Trading in Real Money
When you’re trading online, it’s easy to forget that the numbers on your screen actually represent real money. There’s nothing wrong in risking your money in hopes of generating returns. But remember to be cautious and make smarter investment decisions.
4. Observe the Habits of Successful Traders
Stock market is unique because it treats each trader differently. When it comes to trading, you should be aware of what your peers are doing, not to copy them but to learn from them.
By observing the positive characteristics of successful traders and inculcating few habits or strategies into your own trading, you can improve your trading strategies manyfolds.
5. Practice! Practice! Practice!
Last but not the least, practice is the best and most reliable way to gain mental strength. It helps you improve your trading psychology over time as you build well practised trading strategies and are well prepared for any ups or downs.
Final Thoughts
Understanding trading psychology and implementing it is a time consuming process. You have to continuously refine your trading psychology over long time periods.
To sum up, remember these three golden principles of trading psychology
Be disciplined
Be flexible
Never stop learning
I would also love to know your charts and views in the comment section.
Thank you

How to achieve quick profits through short-term trading?Many friends enjoy short-term trading, mostly due to the short holding time, quick results, and the thrill of the process. However, short-term trading is the most challenging among all trading methods and requires careful consideration.
Today, I will share my early experience of short-term trading with you. Specific methods and strategies will be provided in the later part of this article, which are closely related to practical applications and, I believe, will be helpful for you.
The article is quite lengthy. If you find it helpful, please give it a thumbs-up at the end of the article. Thank you.
Advantages and disadvantages of short-term trading
Short-term trading does not have a strict definition standard. When the market moves quickly, positions can be closed within a day, but if the market moves slowly, it may take two or three days to close the position, all of which belong to short-term trading.
On charts, I usually consider trades at the 5-minute, 15-minute, and even 1-hour level as short-term trades.
The advantages of short-term trading are:
(1) Short holding time and quick results. People are naturally curious about the unknown and want to know the results quickly. Short-term trading fits human nature, making it easier to control emotions.
(2) High trading frequency, providing a thrilling experience. Many traders are restless and want to trade multiple times a day, short-term trading meets this human need.
(3) The decay cycle of the short-term trading system is short, and the distribution of trading results is more evenly distributed, making it easier to execute. Sometimes, even with a losing streak of 5 times, the long-term trading strategy may take over a month to recover, while the short-term trading strategy may only take two or three days. Thus, short-term trading is less torturous to human psychology during a losing streak.
Disadvantages of short-term trading:
(1) High trading frequency requires more time and energy and is not suitable for part-time traders.
(2) Frequent trading generates high trading costs. Therefore, short-term traders need to pay attention to their commission fees. I have seen many futures traders who have had their accounts charged two or three times, or even ten times, the commission fees. How can they make a profit like this?
(3) Requires higher professionalism and attention to trading details. Short-term trading is more sensitive to changes in the market. Sometimes, when the market changes, you don't have much time to think and must act decisively. People with more procrastinating personalities are not suitable for short-term trading. Additionally, the margin of error for short-term trading is relatively low. Long-term trades do not require very precise entry points, and being off by 5 or 10 points does not have a significant impact on the overall trade. However, in short-term trading, being off by 5 or 10 points can be the difference between profit and loss.
Therefore, short-term trading is a delicate operation, and all trading details must be clear and easy to execute. Short-term traders also need to possess qualities such as attention to detail, boldness, calmness, and decisiveness.
So, how can you quickly profit from short-term trading? Next, I will share two strategies.
2.Plan One: Choosing Volatile Markets with Large Amplitude for Short-term Trading
As a short-term trader, we only need to capture a small segment of market volatility, and it doesn't have to be the overall trend, as long as the market volatility is fast and the amplitude is large.
The faster the market volatility and the larger the amplitude, the easier it is to make profits. For the same 100-point profit, it may take only one day to achieve it when the volatility is fast and the amplitude is large, while it may take several days to achieve it when the volatility is slow and the amplitude is small, resulting in a much lower trading efficiency and different challenges to our mentality.
Therefore, the amplitude of the product is the key to making profits in short-term trading. We need to selectively engage in short-term trading and not try to swallow all profits. There are two specific strategies to consider.
Strategy One: Directly select high amplitude products for short-term trading.
Different products have their own characteristics when operating in the market. Some products have fast volatility and large amplitude, while others have slow volatility and small amplitude. Before engaging in short-term trading, we must select the most suitable products.
For example, in the same breakout trading opportunity, products with high volatility and larger amplitude can achieve greater profits more quickly.
As traders, we all understand that the faster we can lock in profits, the more confident we feel. Therefore, selecting the right products makes short-term trading easier.
Moreover, if you choose a slow-moving product, your holding time will be longer, and your position may be occupied, which will reduce the utilization rate of your funds and affect the final profit. Short-term trading is about paying attention to details and maintaining a strong mindset, as even the smallest details can determine your success or failure. Therefore, do not be careless.
FXOPEN:XAUUSD FOREXCOM:EURUSD

📊 DBR & Demand Zone📍 What is Drop Base Rally in Trading?
The drop base rally pattern in technical analysis is a chart pattern that appears when the market falls, then enters a period of sideways price action, and finally, shows explosive upward movements. Market makers open buy orders from demand zones to have a long position in trading. This is some kind of study for technical analysis known as DBR. These patterns are the basis of supply/demand logics. In the showcased example, after a steep drop, the sale finally stopped, leaving bulls the option of buying at lower prices. However, purchasing power at that point was insufficient to reverse the market. Instead, the market starts moving sideways because neither buyers nor sellers could defeat the other party. Eventually, the price action entered the demand zone that was formed and recovered back to higher prices.
📍 How to identify Drop Base Rally pattern?
The drop base rally pattern contains three waves. As shown in the figure above.
🔹 Bearish wave: Drop
🔹 Sideways wave: Base.
🔹 Bullish wave (rally).
📍 Demand Zone
A demand zone is a price level where a significant amount of buying interest or demand for an asset is believed to exist. Traders use demand zones as potential areas of support where buying pressure could increase, causing the price to rebound or reverse. As shown in the example above, we entered a long trade once the price action reached that demand zone, with the entry being inside the zone and the stop loss below the zone.
👤 @AlgoBuddy
📅 Daily Ideas about market update, psychology & indicators
❤️ If you appreciate our work, please like, comment and follow ❤️

The logic and laws of the marketBefore entering the market, we knew about the Pareto principle in the trading field. But after studying it for a while, you may enter the market with confidence, thinking that trading is not that difficult and that you are superior and can beat the so-called "housewives." This is the human tendency to overestimate oneself and be overconfident.
After entering the market and making a few trades recklessly, you will soon find yourself with bruises and swelling. Your confidence will be shattered, and you will begin to realize that even though you are a genius, you still need to learn.
So, the two major factions in the speculative field, fundamental and technical, are waiting for you.
During this period, which faction you join is entirely determined by your "destiny." If everyone around you is focused on fundamentals, you will join the fundamental camp; if everyone around you is focused on short-term, technical analysis, you will join the technical camp.
This is almost the inevitable path for every investor and trader.
In these two factions, the vast majority of investors are eager to elevate their skills to the highest level in this field. If you choose fundamental analysis, you should become a person who has a mastery of fundamental analysis. If you study technical analysis, you should push various technical indicators, trading volume, open interest, and other factors to the extreme.
We may experience losses, but the reason for our losses is that our research and development capabilities are not strong enough to prevent them. We will continue to work hard until we have the ability to grasp the overall trend at the highest level and achieve stable profits in the end. This is what most investors pursue.
However, most investors fail in this process because they are surrounded by too much noise that distracts them. After joining the fundamental or technical camp, they often lose control. They often find that their precise control of the future seems a bit self-deceptive, but they only doubt it because everyone around them is doing the same thing.
They occasionally shout in anger because of continuous losses, which is impossible. As a result, they will find a group of people who have made huge profits by accurately predicting the market. They will also feel helpless due to heavy losses. They want to cut their losses, but they find that losses are incurred by stop-losses. Only those who hold on to their losses and make more bets can make big money.
Every time they try to break free, they are dragged back by endless reality. They feel like they cannot predict the market, but countless people are making accurate predictions and making money. They feel that they should cut losses, but reality often does not give them positive feedback. They feel that they should manage their funds, but they find that those who make big money are all making big bets. They think that fundamental analysis is useless, but a bunch of people will tell them, "I make a profit with fundamental analysis!" They believe that technical analysis cannot predict the future, but someone who has made a hundredfold return will tell them that it was all due to the exclusive MACD strategy.
And just when you've struggled and managed to understand a little bit of the logic, you meet a friend who has a funding curve that never retraces and has multiplied his wealth by 8 times in just 2 months, generously sharing his experience with you... Just as you're about to start thinking about how to build a trading system, your wife's friend's boyfriend is hailed as having an unbeatable market sense. It is said that when he places an order, the mountains shake and the heavens weep... True or false, an endless stream of information bombards you. You look at various platform analysis reports every day, listen to the legends of celebrities making huge profits, watch videos on how to analyze and predict, read books, and everyone around you is giving you their "secrets"...
Your mind is filled with countless pieces of knowledge and information. And you, in this ocean of information, piece together your own trading cognition. This cognition contains too much content, and you believe it to be correct, but in reality, you cannot imagine how far it is from the truth.
This is the fundamental difficulty of trading: insight into the truth of trading. The reason why it is difficult to gain insight into the truth of trading is not only because the truth itself is very secretive, but also because you have to complete this task under endless distractions.
Why is this so?
Because trading is a field where the ratio is 28:1 or even 19:1, the vast majority of people, including traders, analysts, professionals, media personnel, and XX personnel, fundamentally misunderstand it. However, they do not know that they are wrong. Most people are likely to sincerely and wholeheartedly share their knowledge, but the key is that their understanding of what is correct is itself wrong. Therefore, the market is filled with endless noise and fallacies. These things are mixed together with the truth, forming an endlessly complex information flow. Here, the halo effect, survivorship bias, and unfalsifiability illusions form a maze, making it difficult for people to find a way out.
For a trader who wants to become a master trader, their only mission is to extract the truth from this endlessly complex information flow through their own experiences and independent thinking. They need to simplify the complex and unravel the threads in the endless flow of information, identify and discard everything that is incorrect, and form their own trading philosophy. Then, resist endless temptations and execute with consistency.
That is why it is said that the core of speculative trading has long been established, and what we need to do is not to innovate, but to understand and execute. This is the difficulty of trading. Therefore, what the trading test is actually testing is a person's trading cognition and understanding of the market. If the cognition is wrong, it is impossible to escape the maze. The trader's entire trading career will be a continuous interweaving of hope and powerlessness, ultimately leading to their downfall. Only when the trading cognition is correct can they truly understand and execute, and eventually reach the end.
As the recent popular saying goes, it also applies to the trading field: you can never earn money beyond your trading knowledge range, unless you rely on luck. But the money earned through luck often ends up being lost due to lack of skill, which is inevitable. Every penny you earn is a manifestation of your trading knowledge, and every penny you lose is due to a deficiency in your understanding of trading.
The biggest fairness in the speculative world lies in the fact that when a trader's controlled funds exceed their trading knowledge, there are 10,000 ways for the uncertain market trend to harvest them until their knowledge and fund curve match. In the long river of time, real trading knowledge is the only answer.

What is the golden stop-loss rule?
For trades such as stocks, futures, or forex, stop loss is a part of the trade, and it only works for investors if there is a stop loss in each transaction and it is adhered to. Today, I bring you a 3:1 gold stop loss rule, hoping to help with your investments.
Stop loss is a way to minimize losses in current market trades and is frequently mentioned. However, the essence of stop loss is not just setting a stop loss price. In particular, in markets such as forex and futures where long and short positions can be taken, too many stop losses will undoubtedly cause significant loss of capital. Market leaders use people's fear to cause repeated shocks, even unilateral rises or falls to trigger short-term traders' stop loss prices, and then quickly retract. The normal daily volatility of the stock market is also around 5%, so if your stop loss is set at 5%, won't it often be hit?
This requires attention to two issues: first, judging the trend of the market, whether it is a volatile market or a clear trend market; second, setting a reasonable stop loss position.
First of all, it's important to understand that the most notable characteristic of the trading market is volatility, and most of the time it's in a volatile trend, regardless of whether it's in a larger time frame or a shorter time frame. Therefore, the investment strategy for a volatile market should be the preferred strategy for short-term traders.
Secondly, identifying the range of volatility is crucial. Find the highest and lowest prices in recent price fluctuations. After a sharp rise or fall in the market, a corrective wave will form between these highest and lowest prices, sometimes lasting a long time. For example, commonly seen patterns such as triangle consolidation or box consolidation require a longer period of time before forming a new breakthrough. As for what prices to choose as the range, it depends on your trading period, whether it's daily, weekly, 60-minute, or even minute-by-minute. By using price analysis to determine the operational cycle, you will find a clear pattern of fluctuation range. The stop-loss price for such fluctuations should be set outside the highest or lowest points, and smaller stop-loss or trailing stop-loss should not be used.
When the price breaks through the highest point, it is necessary to observe its sustainability. In most cases, it will return to the range-bound area again. However, if the sustainability is strong, it continuously sets new highs, and trading volume continues to increase, a new trend can be determined, and the stop-loss can be changed to a trailing stop. Its price should be set at a price that falls more than one time period beyond the highest or lowest price, and there is no new high or low in three consecutive time periods. At this time, it can be judged that the trend has stopped and entered a range-bound market. For example, if the time period is a 5-minute candlestick chart, then the trailing stop should be set at a price formed by a relatively large 5-minute candlestick chart. But generally, it should not exceed two candlestick chart prices, because beyond this price, the profit left is often very small.
The 3:1 golden stop-loss rule in trading skills means that the profit of the take-profit point is three times the loss of the stop-loss point. For example, if you buy a stock and it falls by 7% or 8%, you should close your position in a timely manner. When your stock rises by 20% to 25%, you should consider selling some of it, and not be greedy and wait for it to rise further. Of course, the percentage values here can be changed according to the market situation, but the ratio should always be maintained at 3:1.
Some investors may have doubts, what if I set a stop loss at 8% and then the stock rises significantly, even by more than 50%, after I sell it? It seems like a big mistake to sell it, and many investors may no longer believe in the 3:1 rule. Actually, the reason why we set a stop loss at 8% is to prevent it from falling by 10%, 20%, 25%, 40% or even more. You can think of it as a small insurance premium to ensure that an 8% loss doesn't turn into a 60% loss. Isn't it easier to handle that way? For most investors, an 8% loss is manageable, but a 60% loss is a burden that many cannot afford.
In the market, human weaknesses will be reflected. When you hold a stock that falls, you will lose some capital, and you will fear that it will continue to fall, rather than hoping it will rebound to make up for previous losses. As a defensive measure, trading systems should still follow the 3:1 rule for stop losses. Finally, I wish everyone a happy investment journey.

5 Tips For Managing Losing Trades (It Happens To Everyone)Losing trades happen. They are apart of the journey. There is simply no such thing as a trader or investor who wins all the time. All the famous investors or traders you know have LOST many times in their career. It is perfectly normal. Did you know the famed hedge fund manager Ray Dalio lost everything in his 30s? He went broke. He had to start over from scratch.
This post will address what losing trades really mean and how to deal with it.
Before we begin, let us state the obvious:
- Be careful of people who claim they don't lose.
- Avoid people who flaunt win rates or success rates that are simply not possible.
- Losing trades happen to everyone! You are not alone.
Now, let's talk about what bad trades mean and 5 tips for managing them:
Number 1: A losing trade is different from a bad trade
The most experienced traders are well aware of their risk before they ever place a trade. Each losing trade is a small component of a bigger process that relates to a system, plan or strategy that has been thoroughly tested and studied. A losing trade is a calculated event for experienced traders. They defined their risk, position size, stop loss, and profit target. 🎯
A bad trade is very different. A bad trade implies someone risked their hard earned money with no plan or process. A bad trade is reckless and indiscriminate trading. This often happens to new investors or traders who do not yet understand the time, studying, and research that goes into making a rock solid plan. Be sure to remember the difference between a calculated losing trade and a bad trade with no plan or process.
TradingView Tip: there are several ways to get started with a plan, system or process. Paper trading, backtesting and/or working with proficient traders who give valuable feedback are all ways to get started. Don't risk your money without first doing research.
Number 2: Every losing trade provides data to get better
As we've mentioned several times now, losing trades happen to everyone. But remember, losing trades are also filled with insightful information and data. You can learn a lot from analyzing losing trades. 🔍
At the end of each trading day, week or month, experienced traders will analyze their losing trades in detail. What patterns are appearing? What do they share in common? Why did they happen? With this information, a trader or investor can adjust their strategy based on what they've uncovered.
Number 3: Do not let losing trades impact your health
Your mental and physical health are just as important as your financial health. Do not let losing trades impact either of those.
If your system is breaking down or several losing trades are starting to impact your emotions, step away from the computer or phone. Turn everything off and walk away. The markets have been open for hundreds of years and are not going away. When you're ready to come back, they'll be there.
Get up, get some fresh air, and get back in the arena when you're ready.
Number 4: Share your experiences with others
Traders and investors across the globe want to learn from your stories and losing trades. These are invaluable experiences that we all share in common. Social networks allow you to chat, share, and meet people who are going through similar things. We can all learn from each other.
Sure, the temptation to share your winners or act like the best trader who ever existed is tempting 😜 - but it's clear we learn together and get better when we share lessons from the loses. This is where the deepest insights are found, and together, it's where we can grow as a community of traders all trying to outperform the market.
Share and ask for constructive feedback!
Number 5: Keep Going
Markets are a game of learning, relearning, and progressing forward. New themes, trends, and stories appear and disappear daily. The journey is long and it never stops. When implementing your trading plan or investing plan, it's important to do it with the long-term in mind. One or two losing trades in a single day or week is a small fraction of what's to come many months and years down the road. 🌎
Keep going. Keep building. Keep refining your plan. Study the data.
We hope you enjoyed this post!
We hope you learned something new or informative!
Please leave any comments below and our team will read them.
- TradingView ❤️

📉 4 Common Bearish PatternsIn trading, a bearish pattern is a technical chart pattern that indicates a potential trend reversal from an uptrend to a downtrend. These patterns are characterized by a series of price movements that signal a bearish sentiment among traders.
📍Bear Flag
🔸 A small rectangular pattern that slopes against the preceding trend
🔸 Forms after a rapid price decline (flagpole)
🔸 The pattern is completed when the price breaks below the lower trend line of the flag
📍Descending Triangle
🔸 A bearish continuation pattern that forms with a horizontal support line and a descending trendline
🔸 Forms as the price reaches lower highs, while the lows remain at the same level
🔸 The pattern is completed when the price breaks below the horizontal support line
📍Rising Wedge
🔸 A bearish reversal pattern that forms with a series of higher highs and higher lows
🔸 The pattern forms as the price moves up in a narrowing range
🔸 The pattern is completed when the price breaks below the lower trendline
📍Triple Top
🔸 A bearish reversal pattern that forms with three peaks at the same price level
🔸 The pattern forms as the price reaches resistance at the same level multiple times
🔸 The pattern is completed when the price breaks below the support level, which connects the lows between the peaks
👤 @AlgoBuddy
📅 Daily Ideas about market update, psychology & indicators
❤️ If you appreciate our work, please like, comment and follow ❤️

CURRENCY CORRELATION HEAT MAPCurrency correlation is important to understand in forex trading because it could impact your trading results often without you even knowing it.
In this post, I will share some information about correlations in forex trading and how you are able to use it to your advantage to avoid unnecessary losses. Throughout my journey as a beginner trader, I have bought or sold 2 different currency pairs many times without knowing they are negatively correlated just to let the gains be offset by
the other pair.
My aim in this short post is to bring awareness about the positive and negative correlations between the currencies, specifically the most traded major pairs in the forex market.
What is correlation in forex trading?
A foreign exchange correlation is the connection between 2 different currency pairs. There is a positive correlation when 2 pairs move in the same direction, a negative correlation when they move in opposite direction, and no correlation if the pairs move with no relationship. In order to understand the relationship between 2 currencies, you must know the correlation coefficient and how it relates.
What is correlation coefficient?
A correlation coefficient represents how strong or weak a correlation is between 2 forex pairs. They are expressed in values and range from -100 to 100 or -1 to 1, with the decimal representing the coefficient. The higher the value of the correlation coefficient will largely reflect the movement of the other pair.
See Figure 1. Correlation Heat Map
For example, If the reading is -70 and above 70, it is considered to have strong correlation between the two. Readings anywhere between -70 to 70 means that the pairs are less correlated. With coefficients near the 0 mark, means little or no relationship with one or another. As traders, implementing risk management in our trading plan also reflects to correlations as you may think its a good ides to buy 2 highly correlated pairs thinking you will double your profits when in reality you may lose double the money as both trades could end up in a loss as you're doubling your risk.
Figure 2 . Positive Correlation: EURUSD / AUDUSD
As we can see on this line chart between EURUSD / AUDUSD, both pairs have a strong correlation coefficient as they are moving in almost the same direction. The correlation coefficient is valued at 75 as noted on the heat map. For example, if you place a buy order EURUSD and place a sell order on AUDUSD, expect a win and a loss in most cases.
Figure 3. Negative Correlation: EURGBP / GBPUSD
On this line chart, we can see that both of these parts are moving in opposite directions which are showing a negative correction between the two which in fact is also known as an inverted correction. The correlation coefficient is valued at -90 on the heat map which means if you place a buy order on EURGBP and a place a sell order on GBPUSD you may double your profits, but again you're doubling your risk.
Figure 4. No Correlation: GBPJPY / USDJPY
This line chart shows that both of these pairs move in the same direction with a correlation coefficient of -9 which has almost no correlation. If you place a buy order on GBPJPY and place a sell order on USDJPY, one of these trades will most likely end up in a loss. The pairs that have no correlation usually have different and separate economic conditions therefore coefficient values tend to be lower.
In summary, understanding which pairs are correlated with one another will be able to help build your strategy and improve your trading results. Every trading strategy NEEDS to have Risk Management implemented in it as it is the key to sustainability for the long run.
Trading is a marathon NOT a sprint.
To learn more about forex correlations and their relationships, please see the following links.
References:
tradingview.sweetlogin.com
ca.investing.com
If you felt this information was helpful, and hit the LIKE button and FOLLOW me for more educational
posts and analysis.
Feel free to leave a comment if you have any questions!
I appreciate all the feedback.
Thanks
Trade Safe

▶️▶️▶️ What is Wyckoff method? ◀️◀️◀️▶️▶️▶️ What is Wyckoff method? ◀️◀️◀️
This trading method was developed by Richard Wyckoff in the early 1930s. It consists with series of principles and strategies originally designed for traders and investors. Wyckoff devoted much of his life experience for studying market behavior, and his work still influences much of modern technical analysis (TA). Currently, the Wyckoff method is applied to all types of financial markets, although initially it was focused only on stocks.
Richard has conducted a large amount of research that has led to the creation of several theories and methods of trading. This article provides an overview of his work and includes three fundamental laws.
✔️ Three Laws of Wyckoff ✔️
1️⃣ Law of supply and demand
The first law states, that the value of assets start rising when demand exceeds supply, and accordingly falls in the opposite direction. That's one of the most basic principles in the financial markets, that Wyckoff doesn't rule out in his writings. We can represent the first law as three simple equations:
📍 Demand > Supply = price Max;
📍 Demand < supply = price falls;
📍 Demand = supply = no significant
price change (low volatility).
In other words, Wyckoff's first law suggests, that an excess of demand over supply causes prices to rise because there are more buyers than sellers. But in a situation where there are more sales than buyers, and supply exceeds demand, it indicates a further drop in value.
2️⃣ Law of Cause and Effect
The second law states, that the differences between supply and demand are not a coincidence. Instead, they reflect preparatory actions resulting from certain events. In Wyckoff's terminology, an accumulation period (cause) eventually leads to an uptrend (effect). In turn, the distribution period (cause) provokes the development of a downtrend (consequence).
3️⃣ The law of connection between efforts and results
Wyckoff's third law states, that changes in price are the result of a collective effort that's reflected in trading volume. In the case when the growth in the value of an asset corresponds to a high trading volume, there is a high probability that the trend will continue its movement. But if the volumes are too small at a high price, the growth is likely to stop and the trend may change its direction.
❗️❗️❗️ For example, let's imagine that the Bitcoin market starts consolidating with very high volume after a long bearish trend. High trading volumes indicate great effort, but sideways movement (low volatility) suggests little result. If a large amount of bitcoin changes hands and the price does not fall significantly, this may indicate that the downtrend may be ending and there will be a reversal soon.
You can find more my educational posts by hashtag #rocketbombeducational (You can click it under the pic of this post)
Thanks for your attention
I'll be glad to see your feedback
Sincerely yours Kateryna💙💛

How to Earn Self-Respect as a TraderIntegrity…
It’s what gives you certainty, confidence and trust for yourself.
It’s what tells you, you can do it.
It’s what makes you leap forward in life.
And it’s what earns you self respect.
With trading, you need to achieve self respect, to help feel more assertive with the trading decisions you make.
In this short letter, I’ll give you some actions to help you earn the self respect as a trader.
Action #1:
Do the hard things
Anything that requires risking your hard earned money is tough.
I get it.
You didn’t make money just to lose it right?
Well, you need to understand that in life there are no HIGH rewards without taking some element of risk.
So, force yourself to sit down, deposit money into your account, wait for the proven trading setup to line up and TAKE THE TRADE.
Next hard thing to do is, wait for the trade to hit your stop loss or take profit and don’t interfere with the process.
And the last hard thing, is having tunnel vision and not listening to anyone about your trading decisions.
Don’t listen to the news, your friends, strangers or even your family.
You have your plan and system, follow it and you’ll feel in control and you’ll gain more self respect.
Action #2:
Don’t think it – DO IT
Coming up with ideas are easy. Writing down goals and gluing your vision board with mansions and cars – are easy.
What’s hard is actually taking the action.
There is never the right time because it’s always the right time.
So buckle up and take action with what you need to do to achieve trading success.
Action #3:
Take control and learn from your losses
Losses are parts of the ying and yang of trading. You need a bit of good and a bit of bad to balance and build.
Remember, the markets move in a zig – zag shape and so will your trading account. So when you realise this you’ll be able to acknowledge, own, take control and learn from your trading losses.
But most importantly. The losses must only come from your proven plan. Don’t move a stop loss to make you risk more.
Don’t remove a stop loss because you believe the market will turn.
Take small losses so that the big winners make up and drive your portfolio up.
Action #4:
Don’t quit when it gets hard
You only fail when you quit something.
Read that again.
When you quit, you lose. When you quit, you give up. When you quit due to premature excuses you lose self respect.
Too many traders quit because they think the market is out to get them. This is either because they are taking a few losses or because they are trying to OUTBEAT the market through emotions.
Listen if you have a few rules to manage your money like:
~ Risk 2% per trade.
~ Never allow your portfolio to be in -20% drawdown.
~ Never hold more than 7 to 8 trades at a time. You’ll be able to control your risk and boost your portfolio.
Let’s sum these 4 actions up to trading self respect.
Action #1: Do the hard things
Action #2: Don’t think it – DO IT
Action #3: Take control and learn from your losses
Action #4: Don’t quit when it gets hard

The Simpliest Math Behind Every Succesful TraderWhat exactly is risk management?
The ability to control your losses so that you do not lose all of your equity is referred to as risk management. This is a system that may be applied to everything that involves probabilities: trading, poker, blackjack, sports betting, and so on.
Many inexperienced traders underestimate the significance of risk management or don't understand the basics when it comes to risk management.
Would you risk $5,000 on every trade if you had a $10,000 trading account? Probably not. Because it only takes two consecutive losses in order to lose everything.
🧠 Now, let's imagine a thought experiment, in wich 🤩Alex and 🤨Peter are both traders with $10,000 in their accounts. Alex is a high-risk trader who puts $2500 risk on every trade. Peter is a cautious trader who puts $100 risk on every trade. Both apply a trading strategy that has a 50% success rate with an average risk-to-reward ratio of 1:2.
For good example, let's imagine the next 8 trades had the following results:
4 losing trades in a row
4 winning trades in a row
Here is the result for Alex: -$2,500, -$2,500, -$2,500, -$2,500 = -$10,000 Loss of the total account 😭😭😭😭
Here is the result for Peter: -$100, -$100, -$100, -$100, +$200, +$200, +$200, +$200 = +$800 Profits. 🏆 🏆 🏆 🏆
Can you tell the difference? See how risk management show the difference between being a profitable or losing trader. Peter managed to recover losing trades, and get into good profits after 8 trades. Alex didn't survive 4 trades...
🚨 You might have the finest trading strategy in the world, but if you don't manage how much you lose, you'll lose it all. It's only a matter of probability and time.
However, following this basic example will assist you to make your trading more profitable. Simply give it a shot.
Kind regards
Artem Crypto
Follow, Like and Share are appreciated!
Take a look at my other Educational ideas below:
Biases that influence your decisions Biases that influence your investment decisions
Most people who invest in the stock market don't reach their goals. The top 1% of investors can double or even triple their returns from the market.
Reason: how investors think
How this article will help you avoid these biases: * Awareness - Knowing what biases affect your decision making is half the battle.
*Routine: I've made a list of biases that affect your analysis and biases that make you overestimate investments.
Cognitive frivolity
All of the following biases work so well because of the way people's minds work. Cognitive light-mindedness is a state of mind that is wanted and linked to good feelings. This is the main reason why people make bad choices.
Halo effect
It is much easier to think in black-and-white stereotypes than in gray ones. The halo effect explains why we like or dislike everything about someone or something that is connected to them. It's harder than we think to agree with some ideas and disagree with others.
What You See Is All There Is
All there is is what you see. You can't think about something you don't know. In a strange way, self-righteousness goes up when you only listen to one point of view. Again, we choose certainty over uncertainty.
Anchoring
Our decisions are mostly based on the first information we get. If you know that Apple shares are worth $150, they will look like a good deal at $120. Not even knowing if $150 is close to what something is really worth.
Regression (Correction)
We love to find links between things that don't have any. Regression to the mean can be one of the most important, but often overlooked, factors. Due to price balancing, everything tends to be worth about the same.
Perceptual bias
We think that events were easier to predict than they really were because of what we already thought. In hindsight, it's easy to make up connections between things. The truth, though, is more complicated. There are a lot of good ways to guess what will happen.
The Fallacy of Mastery
Both buyers and sellers know the same things. They buy and sell stocks based on what they think. People don't believe that short-term stock picking is good luck because it's done by smart people.
Loss aversion
Loss aversion makes us ignore even gambling that has a good chance of going our way. A loss has twice the weight of an equal gain.
Dedication bias
Commitment is linked to good traits like consistency and intelligence. In this way, we don't break our promises. Investment decisions must be talked about in public. The more you talk, the more you can persuade yourself of something.
Leaning toward recent events
We tend to give too much weight to things that have happened recently. Because of this effect, the market tends to move in a certain direction most of the time. When things are going well, we think they will only get better. We think that when things go wrong, they will only get worse.
Effect of ownership
When we own something, we value it more. This is one way we can explain why we did what we did. Before we buy a stock, we look at it critically and try to find any risks. After making a purchase, we think about the good things about it to justify our choice.
This is called confirmation bias
We choose what to believe based on what we already know. What doesn't fit with our ideas is either ignored or called a lie.
Thinking based on odds
We often think based on how we feel. But in our lives, everything is a game of chances. Using reasoning to think about the most likely outcomes will help us make better decisions.
Hope you enjoyed the content I created, You can support with your likes and comments this idea so more people can watch!
✅Disclaimer: Please be aware of the risks involved in trading. This idea was made for educational purposes only not for financial Investment Purposes.
---
• Look at my ideas about interesting altcoins in the related section down below ↓
• For more ideas please hit "Like" and "Follow"!

Live stream - How ChatGPT and AI can affect the stock markets - Live-streaming of our Malta event on how ChatGPT and AI can affect the stock markets. A discussion on the opportunities and threats, for a breakthrough that is about to revolutionise the world!
