The TradingView Show: Live With OKX & TradeTravelChillGreetings, TradingViewers worldwide! This interview was conducted live and is now available for playback and on-demand viewing on our TradingView account, accessible for free. This program delves into trader education, cryptocurrencies, and the flexibility of trading from anywhere with an Internet connection.
Keep in mind that this show was streamed LIVE, so you might come across references to our live chat. No worries, though; you can still watch the show instantly and access the comments section below. Feel free to leave us your feedback!
Here's a glimpse of what we cover in this episode:
1. Gain insights into crypto trading, specific strategies, and the essence of trading them.
2. Understand the dynamics of trading on-the-go and establishing personal rules in an era where crypto trades round-the-clock and connectivity is constant.
3. Discover how TradeTravelChill began on TradingView and OKX, now leveraging our integrated broker partnership. TradeTravelChill and OKX are partners, with OKX being a broker partner on our platform, facilitating seamless connections for traders.
4. Dive into trade ideas and setups in crypto markets, particularly focusing on major coins.
5. Explore some of the hottest topics in crypto markets at the moment.
Our objective with this show is to educate traders worldwide! While we don't provide direct advice, our focus is on empowering traders to learn, practice, and excel in the markets.
Relax, ask questions, and enjoy the show!
Community ideas

Trade identification: Using bitcoin as an exampleHello,
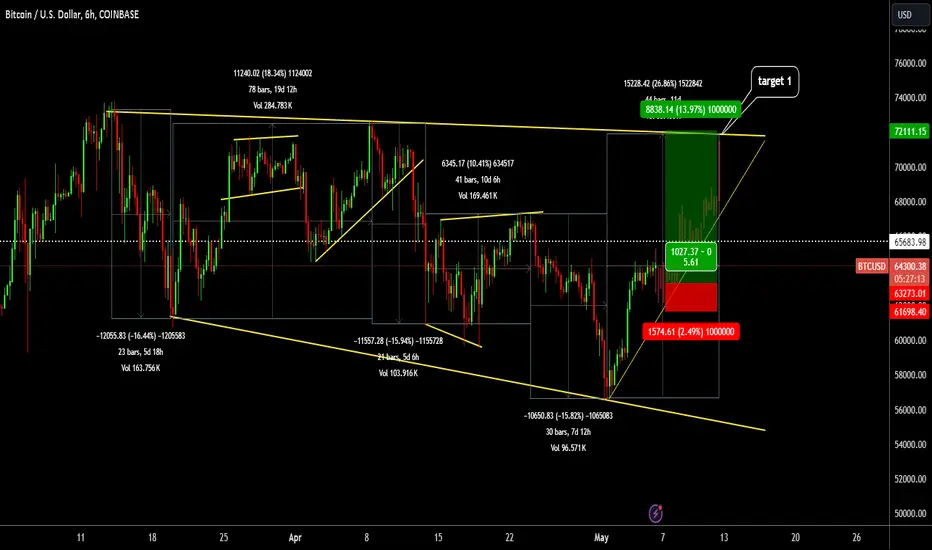
Trade identification is the process through which you are able to identify setups that can be actioned on in the markets. For this example, I shall be using the BTCUSD chart to chant my path as I look for tradeable setups.
1: Structure drawing
Identifying the structure of trades is very key since it creates a sense of knowing where the market is at from a greater point of view.
The structure on a 2 weeks chart shows that the crypto is at the top of the chart. This shows that it might not be a good time to buy since it is advisable to buy at the bottom and sell at the top. However, we can always look for smaller trades using lower timeframes and get better setups.
2: Move to lower time frames & identify patterns.
Patterns are very key in helping you identify tradeable assets. For my asset I moved to the 6h timeframe to zone in and identify tradeable opportunities. This helped me identify the Expanding triangle setup on a bigger scale.
This is a sideways move that will help me trade on the asset for the short term. In the expanding triangle I was able to identify other smaller correction patterns that guide me on how the market is moving.
3: Entry identification
After you have determined where you are at in the eco cycle, very key is now to identify the next causes of action. You must never trade at the top (buying overpriced assets). Very important is to always note that there will always be more opportunities in the future and never to chase trades that have already gone. The ideal situation is to look for corrections as entry points and buy/sell with them.
Next now will be to look for areas where you can enter on an even lower timeframe.
The chart shows that a correction is happening on a lower timeframe (1hour). Now have an alert at the bottom of the correction also coupled with indicators.
Thats the entry point of the trade.
4: Target setting
The exit target shall be set using the 6 hour chart and will be at the top. A stop loss will be just behind the trendline as shown below. This is very key for risk management.
Now wait for the price to come close to your entry points and good luck. We shall follow this trade to end.
How to activate the DOM on TradingView with AMP Futures.In this video we will demonstrate how to access the DOM (Depth of market), and place simple trades.

Putting Risk Reward into PerspectiveMost newbies, and even intermediate traders don't really understand what high risk to reward trades require from themselves and from the market. They think it is something to strive for, and that high RR trades are reserved for the pros. This is far from the truth.
In this video I try to give more perspective to this concept.
- R2F

Uncommon Inflation Measures for Analyzing Attitude towards Risk In this analysis we breakdown certain inflation measures that can aid us in capitalizing on longer term trends in various asset classes. The Baltic Dry Index or BDI gives us a real world view of shipping costs. The Index is a measure of the cost to move commodities by the Sea. Therefore, It's a leading indicator for the demand of commodities around the world. The Baltic Dry Index dates back to the mid eighteenth century as the majority of sea trade was done between London and surrounding Baltic states. Each day the price is updated just prior to New York stock exchange open by the 26 largest shipping companies in the world. The Baltic dry index is a pure piece of data because there is no government or central bank manipulation behind it. The BDI can be quite volatile and this is due to the fact that there are a finite number of available transport ships at any given time. If suddenly commodities come into high demand globally .. this means there will be less ships.. and this results in higher prices to ship goods. This signals us that Inflation may be increasing and therefore higher interest rates may result as the economy heats up. A Falling Baltic Dry Index indicates to us a slowdown of demand for commodities and also of the broader world economy.
Next, we observe the GCC or an Exchange Traded Fund that is based upon the Continuous Commodity Index. The Fund intends to provide broad-based exposure to four commodity sectors : Energy, Agriculture, Precious metals, and Industrial Metals. The Baltic Dry Index generally leads commodity prices(and the commodity index) which was a concept we identified in our analysis.
If this was useful or interested you, Please leave a Rocket or comment in support of similar analysis in the future.
General Disclaimer:
The trade ideas presented herein are solely for informational and educational purposes only. The ideas are not to be interpreted as investment recommendations or financial advice. They do not endorse or promote any specific trading strategies, financial products, or services. Trading in financial markets involves risks, including the potential loss of principal. Each individual should conduct their own research and consult with professional financial advisors before making any investment decisions. The author or publisher of this content bears no responsibility for any actions taken based on the information provided or for any resultant financial or other losses.

Options Blueprint Series: Debit Spreads - Precision InvestingIntroduction to Options on Corn Futures
Corn Futures are one of the staple commodities traded on the Chicago Board of Trade (CBOT), representing a critical component of the agricultural sector's financial instruments. Each Corn Futures contract is standardized to 5,000 bushels, and the price is quoted in USD-cents per bushel.
Contract Specifications:
Point Value: 1/4 of one cent (0.0025) per bushel = $12.50.
Margins: Trading on margin allows traders to leverage positions while only needing to cover a fraction of the total contract value. For Corn Futures, the initial margin requirement is set by the CME Group and varies based on market volatility: Currently $1,300 per contract at the time of this publication.
Options trading introduces another layer of complexity and opportunity. Debit spreads involve purchasing one option and selling another, which helps manage the overall cost of entering the market.
Margin for Debit Spreads:
The margin for debit spreads typically reflects the premium paid for the long position minus any premium received from the short position. This results in a significantly lower margin requirement compared to trading the underlying futures contract outright. (In the below example the net premium paid for the spread is 7.26 points = $363, which is significantly lower than $1,300).
Understanding Debit Spreads
Debit spreads are a sophisticated options trading strategy utilized primarily to achieve a targeted investment outcome while managing risk exposure. They are constructed by purchasing an option (call or put) while simultaneously selling another option of the same type (call or put) but with a different strike price, within the same expiration period. The aim is to reduce the net cost of the position, as the premium received from the sold option offsets part of the cost incurred from the bought option.
Mechanics of Debit Spreads:
Long Position: You buy an option that you expect to increase in value as the market moves in your favor.
Short Position: You sell another option with a higher strike (in the case of a call spread) or a lower strike (in the case of a put spread). This option is expected to expire worthless or decrease in value, offsetting the cost of the long position.
Advantages of Using Debit Spreads:
Defined Risk: The maximum loss on a debit spread is limited to the net premium paid plus transaction costs. This makes it easier to manage risk, especially in volatile markets.
Potential for Profit: Although the profit potential is capped at the difference between the strike prices minus the net debit paid, these spreads can still offer attractive returns relative to the risk undertaken.
Lower Cost of Entry: Compared to buying a single option, spreads typically require a lower upfront investment, making them accessible to a wider range of traders.
This strategic application is what we'll explore next in the context of Corn Futures, where market conditions suggest a potential breakout.
Application in Corn Futures
For traders looking to harness the volatility in the agricultural sector, especially in commodities like corn, debit spreads can be a precision tool for structured trading. Given the current trading range of Corn Futures, with prices oscillating between 424 cents and 448 cents per bushel for a number of weeks, a strategic setup can be envisioned aiming for an upward breakout towards 471 cents, a resistance level indicated by Sell UnFilled Orders (UFOs).
Strategy Implementation with Debit Spreads:
Long Call Option: Buying a call option with a strike price near the lower end of the current range (450) positions traders to benefit from potential upward movements. Premium paid is 10.39 ($519.5)
Short Call Option: Simultaneously, selling a call option with a strike price at 475 cents caps the maximum profit but significantly reduces the cost of entering the trade. This strike is chosen because it aligns closely with the expected UFO resistance level, enhancing the probability of the short option expiring worthless. Premium received is 3.13 ($156.5).
The net cost of the spread ($519.5 - $156.5 = $363) represents the total risk. We are using the CME Group Options Calculator in order to generate fair value prices and Greeks for any options on futures contracts.
Setting up the Trade
To potentially capitalize on the anticipated market movement for Corn Futures, our debit spread strategy will involve a detailed setup of options trades based on specific strike prices that align with market expectations and technical analysis. This step-by-step guide will provide clarity on how to effectively enter and manage this options strategy.
Trade Details:
Long Call Option: Buy a call option with a strike price of 450. This option is chosen as it is near the current upper boundary of the trading range, providing a favorable entry point as we anticipate a breakout.
Short Call Option: Sell a call option with a strike price of 475. This strike is selected based on its proximity to the identified resistance level at 471, suggesting a high likelihood that the price may not exceed this level before expiration.
Cost and Profit Analysis:
Net Premium Paid: $363 as discussed above.
Break-even Point: Long strike price (450) plus the net premium paid = 457.26.
Maximum Profit: The maximum profit for this debit spread is capped at the difference between the two strike prices minus the net premium paid = 475 – 450 – 7.26 = 17.74 = $887.
Maximum Loss: The maximum risk is limited to the net premium paid.
Risk Management
By entering a debit spread, traders not only define their maximum risk but also set clear targets for profitability based on established market thresholds. This methodical approach ensures that even if the anticipated price movement does not fully materialize, the financial exposure remains controlled.
Risk Management Techniques:
Position Sizing: Determine the appropriate size of the position based on overall portfolio risk and individual risk tolerance.
Stop-Loss Orders: Although the maximum loss is capped by the nature of the debit spread (the net premium paid), stop-loss orders can be used if the underlying asset moves against the trader.
Rolling the Spread: If market conditions change or the initial price target is reached earlier than expected, consider 'rolling' the spread.
Adjusting the Trade:
If the price of Corn Futures approaches the short strike price (475) faster than anticipated, and market sentiment indicates further upward potential, the short call option can be bought back while a new higher strike call can be sold. This adjustment aims to extend the profitable range of the spread without increasing the original risk by much.
Conversely, if the price seems unlikely to reach the 450 mark, reassess the viability of keeping the spread open. It may be prudent to close the position early to preserve capital if fundamental market factors have shifted negatively.
Importance of Continuous Monitoring:
Regularly monitor market conditions, including factors like weather reports, agricultural policies, and economic indicators that significantly impact corn prices.
Stay updated with technical analysis charts and adjust strategies according to new resistance and support levels identified.
Effective risk management not only protects from downside risk but also enhances the potential for profitability by adapting to changing market conditions.
Conclusion
The strategic use of debit spreads in Corn Futures options trading offers a balanced approach to leverage market opportunities while maintaining strict control over potential risks.
Recap of Key Points:
Corn Options on Futures: Understanding the contract specifics is crucial for informed trading decisions.
Debit Spreads: These allow traders to benefit from expected price movements with reduced upfront costs and limited risk.
Trade Setup: Focused on a potential breakout from the 448-424 range aiming towards 471, utilizing 450 and 475 strikes for the long and short calls respectively.
Risk Management: Emphasizes the importance of position sizing, potential use of stop-loss orders, and the flexibility to adjust or roll the spread according to market changes.
When charting futures, the data provided could be delayed. Traders working with the ticker symbols discussed in this idea may prefer to use CME Group real-time data plan on TradingView: tradingview.sweetlogin.com This consideration is particularly important for shorter-term traders, whereas it may be less critical for those focused on longer-term trading strategies.
General Disclaimer:
The trade ideas presented herein are solely for illustrative purposes forming a part of a case study intended to demonstrate key principles in risk management within the context of the specific market scenarios discussed. These ideas are not to be interpreted as investment recommendations or financial advice. They do not endorse or promote any specific trading strategies, financial products, or services. The information provided is based on data believed to be reliable; however, its accuracy or completeness cannot be guaranteed. Trading in financial markets involves risks, including the potential loss of principal. Each individual should conduct their own research and consult with professional financial advisors before making any investment decisions. The author or publisher of this content bears no responsibility for any actions taken based on the information provided or for any resultant financial or other losses.

The ultimate guide on Elliott waves in crypto tradingMost of you have probably heard about Elliott waves and we are sure that you don’t use it in cryptocurrency trading strategy because it’s very complicated and subjective approach. Crypto trading for beginners is very challenging and stressful even without Elliott waves. To be honest when we first time tried to implement it to my crypto trading strategies it was a complete disappointment. We were sure that it does not suit for both trading bot and manual trades. Elliott waves were thrown into a garbage bin for almost two years and we developed our crypto trading algorithm using only linear programming approaches.
While we have been trying to invent the best automated trading bot using only indicators and support and resistance levels, best crypto traders have been successfully using Elliott waves in their analysis. Finally we make a decision to have a deep dive in this popular crypto trading tool and studied in details all available literature. As a result we found that Elliott waves will ruin your trading if you use it without special indicators for confirmation. Now we have 2 years of experience in trading with waves and almost one year ago we implemented them into our algorithmic trading bot. Today we prepared the best ultimate guide ever on Elliott waves using best practices and our unique experience how to use them in developing your own profitable crypto trading strategies. Let’s go!
Why it’s vital to use Elliott waves?
Before answer this question, let me ask another one! Why is important to use map to reach the final destination? I think here is the obvious answer! Talking about Elliott waves it’s almost the same reason. This is the only one approach which gives you a map for a price chart. I think you agree that technical indicators or support and resistance levels will not give you the answer which direction the price will choose. When you have, for example Stochastic Oscillator crossover or RSI oversold area hit you just open long because this is the most common strategy. You buy asset like a blind kitten. We are not criticize this approach, because using proper risk and money management you will earn with almost every strategy, but understanding the Elliott waves concept will dramatically increase your profit even if you combine them with your ordinary strategy. Why it’s happening? The answer is easy, because Elliott waves in the underlying structure of the market. You will be aware when you shall use your signals and when it’s better to skip trade. Now let’s dive into the Elliott waves to understand how to find them on the price chart. In the first part we will give you all needed theory and after that we will show in the real charts how it works.
Elliott waves
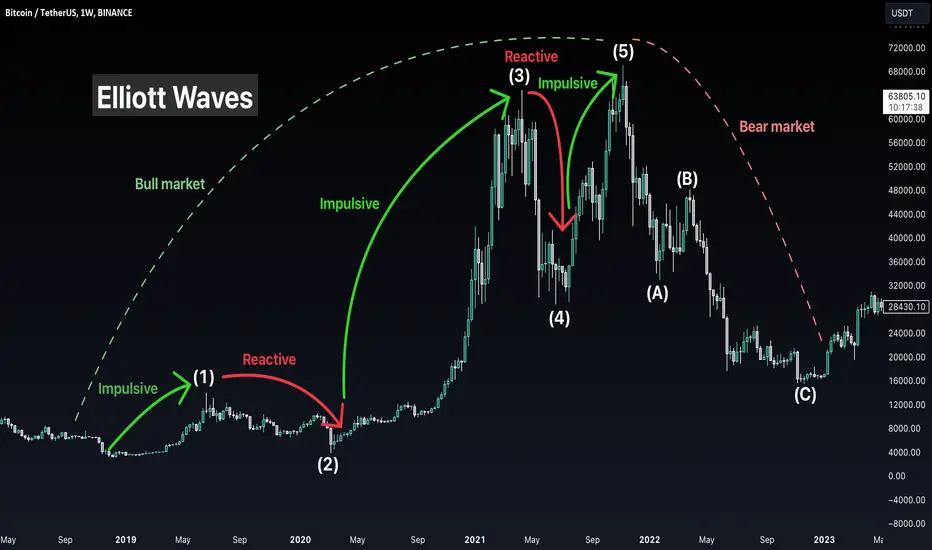
In general, Elliott waves concept is pretty easy. All markets are globally moving up with the five waves formations and then show the pullback with at the reactive waves. On the Bitcoin price chart above you can see the most common picture for Elliott waves. We had the bull run which consists of five waves and then was the bear market represented with the ABC correction.
Waves can be divided into two groups: impulsive and reactive. On the bullish phase waves 1, 3 and 5 are impulsive, 2 and 4 reactive. Impulsive waves consists also with five sub waves, while reactive have usually three waves (exception the triangle correction, will be covered later). On the bearish phase we have the opposite situation: waves A and C are impulsive, while wave B is reactive. Now let’s discuss each wave in details.
What will stop every wave in 90% of cases?
Before we will observe the wave it’s very important to understand what are the early signs that current wave is about to be finished. This is really crucial concept because without it almost impossible to use Elliott waves for profitable trading. We need four tools to make sure that our counting is correct. In this article we will not spend to much time for these indicators, we just show you in practice how to use them. These tools are: Awesome Oscillator, Market Facilitation Index (MFI), Fibonacci retracement and extension and Fractals. These four indicators produce five wave’s end conditions.
Divergence with Awesome Oscillator. If you found five sub waves inside any wave and you can see that price set the higher high (or lower low for bearish case), while AO set lower high (or higher low) it’s divergence between wave 3 and 5. This is the most powerful signal that trend is over.
Fractal at the top or bottom. When you see the divergence it’s just the first sign of trend weakness, we need confirmation with the fractal forming at the top or bottom. You can easily find this indicator in TradingView, it will show you all fractals.
MFI squat bar. We will cover MFI in one of the next educational articles, now you just need to know that it has squat state - the last battle between bulls and bears. One of the three top bars will be the squat in 80% of waves end. You can also find this indicator in TradingView.
AO momentum change. Another one confirmation that trend is over is when AO histogram changes color. It’s better to wait three consecutive columns of the other color or when AO will cross back the signal line, 5 period MA of the AO.
Target area. Using Fibonacci extension and retracement we can find the area where the reversal is the most likely. We will show you this targets when talking about waves.
Now you know the five basic rules and we are ready to discuss every wave using this concept.
Wave 1
When the previous trend is over the impulsive wave 1 begins. We can define the wave 1 start only establishing the previous wave end. It could be wave 5, C or E. It does not matter. You just need to apply our five rules: divergence, momentum change, target area, squat bar and fractal. On the chart you can see how in theory wave 1 can be looks like.
Wave 1 always consists of five waves. That’s why we can wait for the same five rules to complete between wave 3 and 5 inside the wave 1. When you anticipate the wave 1 finish you have two options: close trade and re-enter at the wave 2 bottom or hold for the entire cycle.
Wave 2
When wave 1 ends, you will see pull back in wave 2. It’s important to catch wave 2 bottom because wave 3 will bring you a lot of profit. Wave 2 can be classical ABC zigzag, flat or irregular correction. 70% probability it will be ended inside 0.38 and 0.62 Fibonacci retracement range of wave 1, in rare cases it can ends higher or lower. That’s why it’s better t count waves inside wave 2 and do not miss when all five trend killing conditions are met in wave C inside 2.
Wave 3
The most impulsive wave in the entire cycle is obligatory for trading. Here you can have the less risky and the most easy trading. Wave 3 has the great fundamental factors as a price drivers. For example, Bitcoin spot ETF triggered a huge pump recently. Let’s imagine you correctly entered at the wave 2 end. Now we have to define wave 3 targets. The target area using fibonacci extension can be found between 1 and 1.61. This is the most likely case. In crypto it’s very often when waves 3 are extended.
To have the most precise target it’s highly recommended to count waves inside wave 3. Found five waves? Check our favorite trend killing rules to exit a trade at the top. We know it sounds fantastic, but we managed to buy the exact bottom and sell at the top many times, but to be honest, we have never caught the top of the extended wave 3. Need more experience for that.
Wave 4
Wave 4 can be the most complicated because it has a lot of different variants: zigzag, flat, irregular or even triangle. But at the same time in wave 4 we can have the easiest setup. When you predicted wave 3 top, it’s time to setup the target for the wave 4. The most reliable one is between 0.38 and 0.5. This wave is not so rapid as wave 2 and takes much more time (up to 70% of all cycle).
The very important tip here is to look at the price where wave 4 inside wave 3 has been ended. If this level coincides with the 0.38-0.5 zone it can give you much more confidence. We have never made a mistake using this technique. As usual you have to look for the five trend killing rules in wave C inside wave 4 as well.
Another one thing we want to point out. You know the axiom, that wave 4 has not overlap wave 1 top. This rule can be slightly violated and we will show you the case. Don’t pay attention that much to this rule.
Wave 5
Finally we are in wave 5. This is really vital to define it’s top because bear market will follow this wave and can destroy your deposits. The target area for the wave 5 is defined as the distance between wave 1 bottom and wave 3 top, measured from wave 4 bottom. Area between 0.61 of this distance and 1 Fibonacci level is our target. There you have to find trend killing rules as usual but this time for all cycle, not subwaves.
Corrections
The most dangerous place for trading is the correction. From our experience only wave C in zigzag is tradable. You would better to skip corrections and try to catch it’s end. We have four types of corrections, but the most important knowledges is that wave C and E are always consists of five waves. It means you can use the rules how to catch wave 5 end inside these waves.
Zigzag ABC. If wave A consists of 5 waves the most like we will see zigzag. Wait when wave B reach 0.5-0.61 Fibonacci of wave A and be ready to trade in wave C.
Flat. Wave A has 5 waves inside. Waves A, B and C are almost equal to each other.
Irregular. Wave B top is higher that the previous impulsive wave. Wave A consists of 3 waves.
Triangle. Consists of A, B, C, D and E waves. Wave E consists of five waves. Usually occurs inside waves 4 and B of higher degree.
Now you have a theoretical description. It’s time to trade!
Trading Diverging Chart PatternsContinuing our discussion on trading chart patterns, this is our next tutorial after Trading Converging Chart Patterns
This tutorial is based on our earlier articles on pattern identification and classification.
Algorithmic Identification of Chart Patterns
Flag and Pennant Chart Patterns
In this tutorial, we concentrate on diverging patterns and how to define rules to trade them systematically. The diverging patterns discussed in this tutorial are:
Rising Wedge (Diverging Type)
Falling Wedge (Diverging Type)
Diverging Triangle
Rising Triangle (Diverging Type)
Falling Triangle (Diverging Type)
🎲 Historical Bias and General Perception
Before we look into our method of systematic trading of patterns, let's have a glance at the general bias of trading diverging patterns.
🟡 The Dynamics of Diverging Wedge Patterns
Diverging Wedge patterns are typically indicative of the Elliott Wave Structure's diagonal waves, potentially marking the ending diagonal waves. That means that the patterns may signal the ending of a long term trend.
Hence, the diverging rising wedge is considered as bearish, whereas the diverging falling wedge is considered as bullish when it falls under Wave 5 of an impulse or Wave C of a zigzag or flat.
For an in-depth exploration, refer to our detailed analysis in Decoding Wedge Patterns
Both rising wedge and falling wedge of expanding type offers lower risk reward (High risk and low reward) in short term as the expanding nature of the pattern will lead to wider stop loss.
🎯 Rising Wedge (Expanding Type)
Expanding Rising Wedge pattern is historically viewed with bearish bias.
🎯 Falling Wedge (Expanding Type)
Expanding Falling Wedge pattern is historically viewed with bullish bias.
🟡 The Dynamics of Diverging Triangle Patterns
Diverging pattern in general means increased volatility. Increased volatility during the strong trends also mean reducing confidence that may signal reversal.
🎲 Alternate Approach towards trading diverging patterns
Lack of back testing data combined with subjectivity in Elliott wave interpretation and pattern interpretation makes it difficult to rely on the traditional approach. The alternative method involves treating all expanding patterns equally and define a systematic trading approach. This involves.
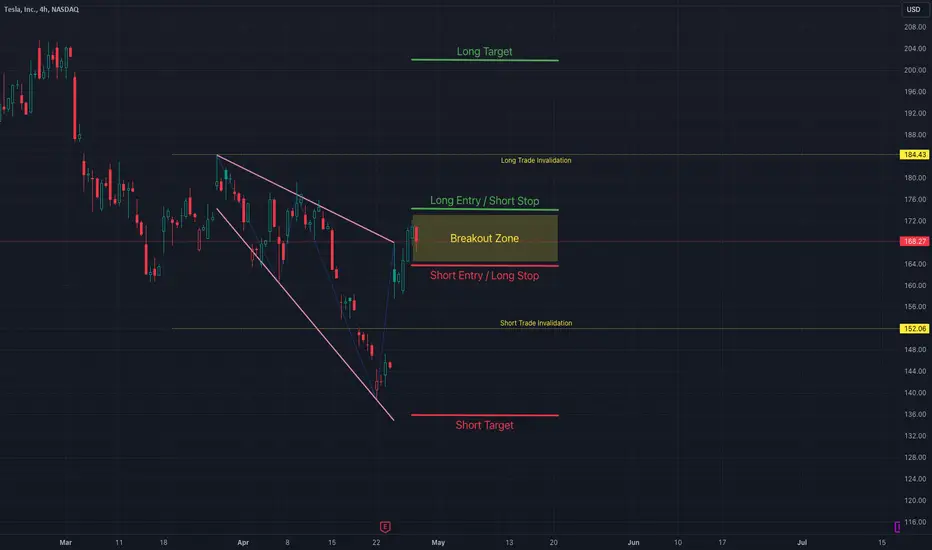
When the pattern is formed, define a breakout zone. One side of the breakout zone will act as breakout point and the other side will act as reversal point.
Depending on the breakout or reversal, trade direction is identified. Define the rules for entry, stop, target and invalidation range for both directions. This can be based on specific fib ratio based on pattern size.
Backtest and Forward test the strategy and collect data with respect to win ratio, risk reward and profit factor to understand the profitability of patterns and the methodology.
Breaking it down further.
🟡 Defining The Pattern Trade Conditions
Base can be calculated in the following ways.
Distance between max and min points of the pattern. (Vertical size of the pattern)
Last zigzag swing of the pattern (This is generally the largest zigzag swing of the pattern due to its expanding nature)
This Base is used for calculation of other criteria.
🎯 Breakout Zone - Entry Points
Breakout zone can be calculated based on the following.
Long Entry (top) = Last Pivot + Base * (Entry Ratio)
Short Entry (bottom) = Last Pivot - Base * (Entry Ratio)
If the direction of the last zigzag swing is downwards, then top will form the reversal confirmation and bottom will form the breakout confirmation. Similarly, if the direction of the last zigzag swing is upwards, then top will become the breakout confirmation point and bottom will act as reversal confirmation point.
🎯 Stops
Long entry can act as stop for short and vice versa. However, we can also apply different rule for calculation of stop - this includes using different fib ratio for stop calculation in the reverse direction.
Example.
Long Stop = Last Pivot - Base * (Stop Ratio)
Short Stop = Last Pivot + Base * (Entry Ratio)
🎯 Invalidation
Invalidation price is a level where the trade direction for a particular pattern needs to be ignored or invalidated. Invalidation price can be calculated based on specific fib ratios. It is recommended to use wider invalidation range. This is to protect ignoring the potential trades due to volatility.
Long Invalidation Price = Last Pivot - Base * (Invalidation Ratio)
Short Invalidation Price = Last Pivot + Base * (Invalidation Ratio)
🎯 Targets
Targets can either be set based on fib ratios, as explained for other parameters. However, the better way to set targets is based on expected risk reward.
Target Price = Entry + (Entry-Stop) X Risk Reward
🟡 Back Test and Forward Test and Measure the Profit Factor
It is important to perform sufficient testing to understand the profitability of the strategy before using them on the live trades. Use multiple timeframes and symbols to perform a series of back tests and forward tests, and collect as much data as possible on the historical outcomes of the strategy.
Profit Factor of the strategy can be calculated by using a simple formula
Profit Factor = (Wins/Losses) X Risk Reward
🟡 Use Filters and Different Combinations
Filters will help us in filtering out noise and trade only the selective patterns. The filters can include a simple logic such as trade long only if price is above 200 SMA and trade short only if price is below 200 SMA. Or it can be as complex as looking into the divergence signals or other complex variables.
How Does Recession Affect Financial Markets?How Does Recession Affect Financial Markets?
Recessions, marked by widespread economic decline, profoundly impact financial markets. Understanding how different markets – stock, forex, commodity, and bond – respond to these downturns is crucial for traders and investors. This article delves into the varied effects of recessions, highlighting strategies for navigating these challenging times and identifying potential opportunities for resilience and growth in the face of economic adversity.
Understanding Recessions
A recession is a significant decline in economic activity spread across the economy, lasting more than a few months, typically visible in real GDP, real income, employment, industrial production, and wholesale retail sales. Economic experts often cite two consecutive quarters of GDP contraction as a technical indicator of a recession. However, it's more than just numbers; it reflects a noticeable slump in economic activities and consumer confidence.
Historically, recessions have been triggered by various factors, such as sudden economic shocks, financial crises, or bursting asset bubbles. For instance, the Global Financial Crisis of 2007-2008 stemmed from the collapse of the housing market bubble in the United States, leading to a worldwide economic downturn.
Recession impacts nearly every corner of the economy, leading to increased unemployment, reduced consumer spending, and overall economic stagnation.
Effects of Recession on Different Financial Markets
A recession's impact on financial markets is multifaceted, influencing everything from stocks and bonds to forex and commodities. However, each market reacts differently. To see how these various asset classes have reacted in past recessions, head over to FXOpen’s free TickTrader platform to access real-time market charts.
General Impact on Markets
During a recession, the financial landscape typically undergoes significant changes. Investors, wary of uncertainty, often reassess their risk tolerance, leading to shifts in asset allocation. Market volatility usually spikes as news and economic indicators sway investor sentiment. This period is often marked by cautious trading and a search for safer investment havens.
Impact on Stock Markets
Stock market performance in a recession can be quite varied. Generally, stock markets are among the first to react to signs of a recession. Prices may fall as investors anticipate lower earnings and weaker economic growth. This decline is not uniform across all sectors, however.
Some industries, like technology or luxury goods, might experience steeper drops due to reduced consumer spending. Conversely, sectors like utilities or consumer staples often include stocks that do well during a recession, as they provide essential services that remain in demand.
Impact on Forex Markets
In forex, recessions often lead to significant currency fluctuations. Investors might flock to so-called safe currencies like the US dollar or Swiss franc, while currencies from countries heavily affected by the recession weaken. Central bank policies, such as interest rate cuts or quantitative easing, play a crucial role in currency valuation during these times.
Impact on Commodities
Commodities can react differently in a recession. While demand for industrial commodities like oil or steel may decline due to reduced industrial activity, precious metals like gold often see increased interest as so-called safe-haven assets.
Impact on Bonds
Bond markets usually experience a surge in demand during recessions, particularly government bonds, seen as low-risk investments. As investors seek stability, bond prices typically rise, and yields fall, reflecting the increased demand and decreased risk appetite.
Types of Stocks That Perform Well During a Recession
During economic downturns, certain stock categories have historically outperformed others. The stocks that go up in a recession generally belong to sectors that provide essential services or goods that remain in demand regardless of the economic climate.
Consumer Staples: Companies in this sector, offering essential products like food, beverages, and household items, may appreciate during a recession. As these are necessities, demand usually remains stable even when discretionary spending declines.
Healthcare: Healthcare stocks often hold steady or grow during recessions. The demand for medical services and products is less sensitive to economic fluctuations, making this sector a potential safe haven for investors.
Utilities: Utility companies typically offer stable dividends and consistent demand. Regardless of economic conditions, consumers need water, gas, and electricity, providing these stocks with a buffer against recessionary pressures.
Discount Retailers: Retailers that offer essential goods at lower prices can see an uptick in business as consumers become more budget-conscious during tough economic times.
Types of Stocks to Hold in a Recession
While there are some stocks that perform well in a recession due to sustained demand for their products, there are other types of stocks that are valued for their financial resilience and potential to provide long-term stability.
Blue-Chip Stocks: These are shares of large, well-established companies known for their financial stability and strong track records. During recessions, their history of enduring tough economic times and providing dividends makes them attractive.
Value Stocks: Stocks that are undervalued compared to their intrinsic worth can be good picks. They often have strong fundamentals and are priced below their perceived true value, with the potential to rebound strongly as the economy recovers.
Non-Cyclical Stocks: These stocks are in industries whose services or products are always needed, like waste management or funeral services. Their demand doesn’t fluctuate significantly with the economy, which may offer stability.
The Role of Government and Central Banks During Recessions
During recessions, governments and central banks play a crucial role in stabilising financial markets.
Government interventions often include fiscal policies like increased spending and tax cuts to stimulate the economy. Central banks may reduce interest rates or implement quantitative easing to increase liquidity in the financial system.
These actions can bolster investor confidence, stabilise markets, and encourage lending and spending. However, their effectiveness can vary based on the recession's severity and the timeliness of the response.
The Bottom Line
Navigating recessions requires understanding their multifaceted impact on financial markets. From stocks and bonds to forex and commodities, each sector reacts uniquely, offering both challenges and opportunities.
To take advantage of the various opportunities a recession presents, opening an FXOpen account can be a strategic step. We provide access to a broad range of markets and trading tools designed to help traders adapt to a shifting economic landscape.
This article represents the opinion of the Companies operating under the FXOpen brand only. It is not to be construed as an offer, solicitation, or recommendation with respect to products and services provided by the Companies operating under the FXOpen brand, nor is it to be considered financial advice.

How To Grow A Forex or Crypto Acc Scalping A 5m Time FrameIn this video, we delve into a high-probability scalping strategy, building upon the concepts introduced in our previous videos on developing a trading plan and risk management. This third installment in the series focuses on refining entry points for high-probability trades. We explore a basic trend continuation strategy on the 4-hour time frame, then zoom in on the 5-minute time frame to identify specific price action that provides a precise entry point. Our approach involves identifying when price action begins to trade sideways, forming a range on the 5m time frame, and waiting for signs of volatility, where price takes out stop losses above or below the range. Once this occurs, the trend typically sets up on the lower time frame, allowing us to enter our trade on the 5-minute chart. We always place stops above or below the previous high, targeting the previous price swing. Please note that this video is for educational purposes only and should not be construed as financial advice.

The profitability of TA trading rules in the Bitcoin market█ The profitability of technical trading rules in the Bitcoin market
The Bitcoin market, known for its wild fluctuations, poses a unique challenge for traders: Is it possible to consistently profit using technical trading rules?
Recent research analyzing Bitcoin's price data from July 2010 to January 2019 has shed light on this question, focusing on the effectiveness of seven trend-following indicators.
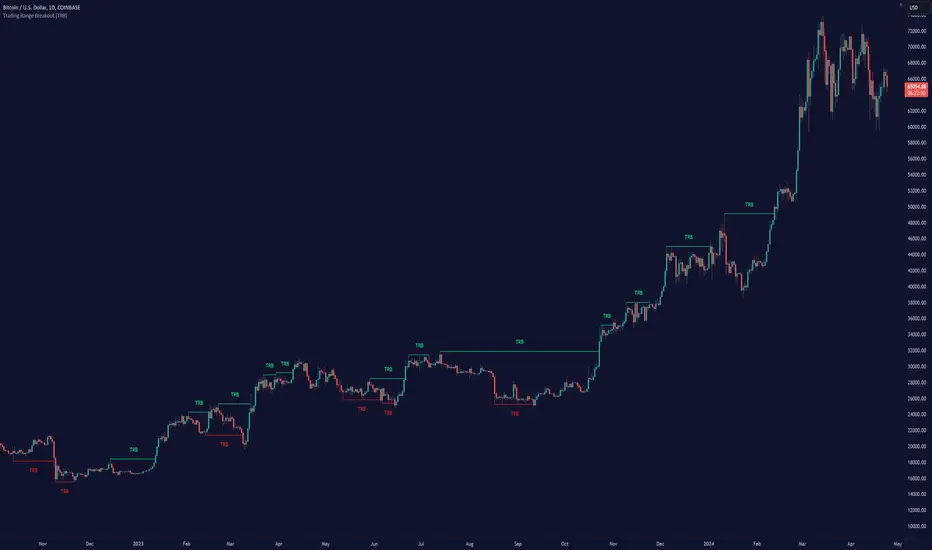
The research was conducted by Gerritsen et al. Notably, the trading range breakout rule emerged as a promising strategy, often outperforming the traditional buy-and-hold approach.
█ Some Background into the Bitcoin Market
Bitcoin's price path suggests market inefficiency, likely due to its short history and the erratic behaviors of market participants. Previous studies on Bitcoin's efficiency mainly focused on its predictability from a random walk perspective, leaving the performance of technical trading rules on Bitcoin prices largely unexplored.
The core aim of this study is to examine the profitability of technical trading rules, specifically to determine if these rules can surpass a basic buy-and-hold strategy.
By applying seven well-documented trading rules and analyzing their performance through the Sharpe ratio, the study seeks to provide practical insights for Bitcoin traders.
█ Methodology
The study uses daily price data from July 17, 2010, to December 31, 2018, totaling 3,084 daily observations. Gerritsen and team removed a brief period in 2011 due to a Mt. Gox hack and integrated data from Coinmarketcap starting April 28, 2013. The research also considers the risk-free rate, using 3-month US Treasury bill returns for its analysis.
█ Trading Rules Analyzed
1. Moving Averages (MA): This strategy issues buy signals when the recent price or its short-term average exceeds a longer-term average and sell signals in the opposite scenario. It tested combinations like 1-day vs. 50-day, 2-day vs 150-day, and 5-day vs 200-day averages.
2. Trading Range Breakout (TRB): It looks for price breakouts beyond the highest and lowest prices of a predefined period (50, 150, 200 days), signaling buys for breakouts above the high and sells below the low.
3. Moving Average Convergence Divergence (MACD): The MACD rule uses two exponential moving averages (EMAs), and triggers buy signals when the MACD line (the difference between a 12-day and a 26-day EMA) is above zero, and sell signals when it is below zero. It also examines the MACD signal line and MACD histogram as additional signals.
4. Rate of Change (ROC): This rule compares the current price with the price n days ago (commonly 10 days) to determine market momentum and issue buy/sell signals. The rule suggests buying when the ROC is positive, indicating upward momentum, and selling when it is negative, indicating downward momentum.
5. On-Balance-Volume (OBV): This volume-based indicator predicts price movements based on volume flow, asserting that volume changes precede price changes. The study applied MA rules to the OBV to generate signals, buying when the short-term MA of OBV crosses the long-term MA from below, and selling when it crosses from above.
6. Relative Strength Index (RSI): A momentum oscillator that identifies overbought or oversold conditions, suggesting buy signals when below 30 and sell signals above 70.
7. Bollinger Bands (BB): This strategy uses a moving average with upper and lower bands based on standard deviations from the MA, issuing buy signals when the price touches the lower band and sell signals at the upper band.
█ Strategies and Evaluation
The study applied each trading rule in three distinct strategies:
Literal Interpretation: Buying or selling Bitcoin directly based on the signal, including short positions.
Long Positions Only: Considering only buy signals due to the practical challenges of shorting Bitcoin on many exchanges.
Default Long Position with Adjustment on Signals: Maintaining a default long position, doubling investment on buy signals, and moving to risk-free assets on sell signals.
The performance of these strategies was evaluated using the Sharpe ratio, comparing the excess returns of the trading strategies over the risk-free rate to their volatility. A higher Sharpe ratio indicates a more efficient risk-adjusted return. The study used bootstrapping to assess the statistical significance of the Sharpe ratio differences between each trading rule strategy and a benchmark buy-and-hold strategy.
█ Key Findings
The study finds mixed results across different technical trading strategies when applied to Bitcoin.
Notably, the trading range breakout (TRB) rule consistently offers higher Sharpe ratios than a buy-and-hold strategy, signifying its superior performance.
On average, TRB strategies yield a Sharpe ratio of around 0.08, marking them as statistically significant against the buy-and-hold benchmark. This rule's success is further highlighted in specific periods, such as 2011–2012, 2013–2014, and 2017–2018, where its Sharpe ratios were notably higher than those of the buy-and-hold approach. The significant outperformance in these periods underscores the TRB rule's adaptability to market dynamics.
While most other technical trading rules did not consistently outperform the buy-and-hold strategy, certain strategies like MACD showed significant outperformance in specific applications (Strategy 2), illustrating the nuanced effectiveness of technical trading rules in the Bitcoin market.
Counter-trend indicators, such as the Relative Strength Index and Bollinger Bands, generally underperformed compared to the buy-and-hold benchmark, sometimes yielding negative Sharpe ratios.
█ Sensitivity to Market Conditions
The effectiveness of the TRB strategy, in particular, seems to be highly dependent on the prevailing market conditions. During periods of strong trends (either bull or bear markets), the TRB rule demonstrated notable outperformance.
However, during more stable periods, like 2015–2016, the TRB rule and most other trading rules did not show a significant advantage over the buy-and-hold strategy, aligning with the adaptive market hypothesis suggesting that the performance of trading strategies is contingent upon environmental factors.
█ Limitations and Future Research
One notable limitation is the focus solely on Bitcoin, leaving the question of whether these findings can be generalized to other cryptocurrencies.
Additionally, the analysis does not account for transaction costs, potentially affecting the trading strategies' profitability. Future research is encouraged to extend the investigation to other leading cryptocurrencies and to consider the impact of transaction costs on the profitability of the trading range breakout rule and other technical trading strategies.
█ Reference
Gerritsen, D.F., et al. (xxxx). The profitability of technical trading rules in the Bitcoin market. Finance Research Letters, xxx(x), xxx-xxx.
-----------------
Disclaimer
This is an educational study for entertainment purposes only.
The information in my Scripts/Indicators/Ideas/Algos/Systems does not constitute financial advice or a solicitation to buy or sell securities. I will not accept liability for any loss or damage, including without limitation any loss of profit, which may arise directly or indirectly from the use of or reliance on such information.
All investments involve risk, and the past performance of a security, industry, sector, market, financial product, trading strategy, backtest, or individual's trading does not guarantee future results or returns. Investors are fully responsible for any investment decisions they make. Such decisions should be based solely on evaluating their financial circumstances, investment objectives, risk tolerance, and liquidity needs.
My Scripts/Indicators/Ideas/Algos/Systems are only for educational purposes!
Assessing Market sentiment using the Vix and Dxy 📑Hello Traders and welcome back to another Video analysis. We break down the relationship amongst different asset classes when gauging market sentiment. In particular, how to analyze market direction on the Nasdaq 100 by looking at the Volatility and Dollar Indexes. We combine this sentiment analysis with candlesticks, and how they leave clues for us when anticipating market direction.
If you aren't familar, the Dollar Index represents the strength or weakness of the USD against a basket of 4 currencies. The Euro, Yen, Aud, and the Gbp. The US dollar is the safe haven of the world and when it increases in value, this represents risk off sentiment as investors and market particpants look to preserve the value of thier monies. On the other hand, the Nasdaq is a stock index, and therefore represents an asset class where investors are looking to grow their capital. In theory, they should be inversely correlated and generally are, thereby giving us clues when anticipating market movements in one another. In this example, we look at how we can use the (DXY) dollar index when anticipating market movements in the Nasdaq 100 stock index.
The Vix or Volatility Index represents the options market for the S&P500 stocks. When the Vix goes up this equates to investors and market participants buying puts and anticipating future downside for the S&P 500 stock index. When the Vix goes down, this represents anticipated upside in the U.S. stock indexes by investors and market particpants buying calls in the options market.
Please a Rocket or comment in support of similar analysis in the future

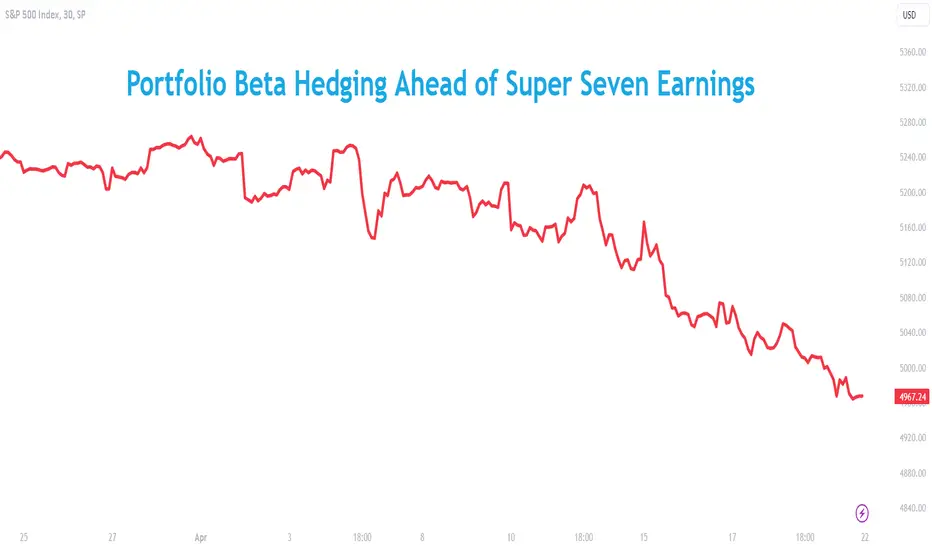
Portfolio Beta Hedging Ahead of Super Seven EarningsYou cannot predict the future. But you can prepare for it. Mega cap tech stocks have collectively lost USD 930 billion in value since Nasdaq 100 peaked on 21st March 2024. Will Super Sevens earnings turn the tide?
Starting this week, the Super Sevens will start announcing first quarter results. NASDAQ:TSLA is up first on 23/Apr (Tue) followed by NASDAQ:META on 24/Apr (Wed) with NASDAQ:GOOGL and NASDAQ:MSFT on 25/Apr (Thu).
NASDAQ:AAPL reports on 2/May followed by NASDAQ:NVDA on 22/May.
Broad US equity markets are facing multiple headwinds. Rate cut hopes are fading. Geopolitics are turning for the worse with tensions escalating in the middle east. Investor sentiments are gloomy. Consequently, both S&P 500 and Nasdaq 100 have endured their worst week in a long time.
Investors are pinning hopes on AI-infused tech earnings to stem the downdraft and to turn the tide. Bloomberg reports that Super Seven earnings are forecast to rise 38% during Q1 2024 compared to a year ago. If true, those earnings would dwarf the overall S&P 500’s meagre +2.4% forecasted YoY earnings growth.
This paper is set in two parts. Part 1 summarises idiosyncratic factors affecting each of the Super Sevens. Second part of the paper illustrates beta hedging using index options to help portfolio managers defend against downside risk while retaining upside potential.
ARTIFICIAL INTELLIGENCE. EXCITEMENT TO EXHAUSTION?
AI hype remains palpable. But monetising AI is hard. That is becoming increasingly clear. Even among the Super Sevens, not everyone has cracked the AI monetisation formula.
Investors are starting to moderate AI linked expectations. They need a clear path to profits from AI initiatives. Investor scepticism is showing up even among Super Sevens.
NASDAQ:NVDA has been selling shovels to AI gold miners. Expectedly, their earnings and consequently their stock prices are up sharply. Its share prices are up 54% YTD leaving the rest in dust. NASDAQ:META is up 36%, compared +10% for NASDAQ:GOOGL and +6% for $NASDAQ:MSFT.
NASDAQ:AAPL and NASDAQ:TSLA are increasingly losing shine. NASDAQ:TSLA (down a colossal 41%) risks being booted out of the Super Seven grouping.
“Investors are expecting not just strong results — but strong guidance,” said Quincy Krosby, chief global strategist at LPL Financial. “Any disappointment from the mega-tech names reporting could push this week’s oversold market deeper into oversold territory” as reported by Bloomberg.
NASDAQ:AMZN is expected to deliver modest EPS growth.
Analysts remain strongly bullish with 60 of 63 analysts giving a Strong Buy or Buy rating.
Source: TradingView
NASDAQ:GOOGL is facing justified scepticism by investors about its AI capabilities after multiple missteps. AI powered search engines potentially threatens Google’s dominance.
Despite the headwinds, analysts remain bullish on NASDAQ:GOOGL with average 12-month price target offering an 8% upside.
Source: TradingView
Falling smartphone market share, slowdown in innovations, nothing to show for in AI, lacklustre demand for Vision Pro, closure of Apple Car project, Anti-trust fines and more. Adverse news is hammering NASDAQ:AAPL share prices non-stop.
While overall analyst rating remains bullish, the number of hold and sell calls are rising fast for NASDAQ:AAPL .
Source: TradingView
Bloomberg reports that NASDAQ:META is expected to show revenue growth of 26% this quarter and almost double the net earnings from a year ago.
Analysts remain very bullish on NASDAQ:META with an average 12-month price target of USD 540.90 a share.
Source: TradingView
NASDAQ:MSFT is expected to benefit from AI. It has cleverly implemented Copilot AI into its product suite. Last quarter, demand for AI fuelled growth in its Azure cloud-services business.
Analysts remain constructively bullish on NASDAQ:MSFT with 54 out of 57 analysts holding a Strong Buy or Buy rating on the stock.
Source: TradingView
NASDAQ:NVDA will be the most watched quarterly earnings yet again. Its stock is priced to perfection. Feeble earnings or guidance could send its share prices into a free fall.
Fifty-three of Sixty analysts have either a Strong Buy or a Buy rating on NASDAQ:NVDA with average 30% upside over next 12-months.
Source: TradingView
EV market contraction. Price wars from Chinese EV makers. Deep discounts. All these are heavily weighing down on NASDAQ:TSLA shares.
Not unexpectedly, analysts remain neutral on NASDAQ:TSLA .
Source: TradingView
ILLUSTRATING BETA HEDGING USING INDEX OPTIONS
Super Seven earnings are critical to US equities given their outsized impact due to substantial index weightings. Valuations remain lofty. Despite the recent selloff, these mega caps trade at an aggregate thirty-one times forward earnings.
Earnings can and does have enormous impact on share prices. When valuations are priced to perfection, even a hint of negative news will plummet stock prices down.
Astute portfolio managers defend their portfolio using beta hedging. Beta hedge requires that notional of the hedging trade is equivalent to the beta-adjusted notional value of single stocks.
Illustration of the beta hedge below assumes that a portfolio manager holds thirty shares in each of the Super Sevens.
TradingView publishes trailing twelve month beta values for each firm which is the stock’s sensitivity to the S&P 500 index.
In the lead up to results, implied volatility on shares expands rapidly. While hedging using equity put options is an alternative, but it is an expensive one.
A portfolio manager can cleverly deploy short-dated equity index options to minimise hedging costs. CME offers Micro E-Mini S&P 500 Options (“Micro S&P500 Options”) with each contract providing a notional coverage of USD 5 times the S&P 500 index which translates to USD 25,000 per lot based on current S&P 500 levels of 4,967.23.
Using Micro S&P500 put options expiring on 25th April 2024 at a strike of 4950, a portfolio manager incurs a premium of USD 105 per lot based on close of market prices on 19th April 2024. It requires approximately 4 lots (USD 25,000 per lot times 4 lots = USD 100,000) notional of put options to hedge the above beta adjusted portfolio of USD 107,153.
Source: CME
Table below illustrates hedging pay-off under different price action scenarios during quarterly earnings:
Long Options delivers financial convexity. Options allow portfolio managers to harvest asymmetric gains. It provides protection when markets plunge and allows portfolio managers to capture gains from rising markets.
MARKET DATA
CME Real-time Market Data helps identify trading set-ups and express market views better. If you have futures in your trading portfolio, you can check out on CME Group data plans available that suit your trading needs tradingview.sweetlogin.com
DISCLAIMER
This case study is for educational purposes only and does not constitute investment recommendations or advice. Nor are they used to promote any specific products, or services.
Trading or investment ideas cited here are for illustration only, as an integral part of a case study to demonstrate the fundamental concepts in risk management or trading under the market scenarios being discussed. Please read the FULL DISCLAIMER the link to which is provided in our profile description.
Why Would Countries Devalue Their Currency?Why Would Countries Devalue Their Currency?
Currency devaluation is a nuanced aspect of fiscal policy with profound implications globally. This article demystifies the strategic reasons and consequential effects when nations choose to devalue their currency. From influencing trade balances to adjusting economic strategies, understanding these dynamics is crucial for traders and investors alike. Dive into the complex world of currency devaluation and its far-reaching impact on global economics.
Devalued Currency Definition
So, what is currency devaluation, and how does a country devalue its currency? Currency devaluation is a deliberate downward adjustment of a country's currency value relative to another currency, group of currencies, or standard. This monetary policy decision is typically made by a national government or its central bank. Devaluation is distinct from depreciation, which is a market-driven decrease in currency value.
In a practical sense, devaluation reduces the cost of a country's exports and increases the cost of imports. For countries with fixed or semi-fixed exchange rates, this involves officially lowering the exchange rate by the revaluation of the peg or a change in the pegged currency.
Countries with a free-floating currency system can influence devaluation through monetary policies like lowering interest rates, which can decrease investor demand for the currency, thereby reducing its value. Also, central banks can intervene by buying foreign currency and selling domestic. These fluctuations are visible across many currency pairs in FXOpen’s free TickTrader platform. Additionally, governments might engage in expansive fiscal policies or public statements to sway market perceptions, indirectly impacting the currency's market value.
Devaluation of Currency Example
In 1994, Mexico experienced a notable devaluation of its currency, the peso. This event is often referred to as the Mexican Peso Crisis. Prior to the devaluation, Mexico maintained a fixed exchange rate regime, pegging the peso to the US dollar. However, due to a combination of political uncertainty, economic pressures, and dwindling foreign exchange reserves, the Mexican government found it increasingly challenging to maintain the peso's value.
In December 1994, the government decided to devalue the peso by around 15%. The immediate effect was a dramatic fall in the peso's value, plunging nearly 50% against the dollar within months. This devaluation led to significant economic turmoil, including high inflation and capital flight, but it also eventually helped to make Mexican exports more competitive in the international market.
Why Might a Country Choose to Devalue Its Currency? 3 Reasons
Why would a country devalue its currency? While this move can have widespread implications, there are strategic reasons behind such a decision. Understanding these reasons is crucial in comprehending global economic dynamics.
Reason 1: Boosting Exports
One of the primary reasons for a country to devalue its currency is to make its exports more competitive in the global market. A weaker currency lowers the price of a country's goods and services in foreign markets, making them more attractive to international buyers. This increase in demand for exports can stimulate the country's manufacturing sector and, in turn, boost economic growth. For instance, a country heavily reliant on exports might use devaluation to gain a competitive edge, especially if its major trading partners have stronger currencies.
Reason 2: Reducing Trade Deficits
Devaluation can be a tool to address trade imbalances. A country with a significant trade deficit – where imports exceed exports – might devalue its currency to make imports more expensive and exports cheaper. By doing so, it can reduce the volume of imports as they become costlier for domestic consumers and businesses, while simultaneously increasing exports due to their lower prices on the international market. This adjustment can help in narrowing the trade deficit, bringing more balance to the country's external trade.
Reason 3: Managing National Debt
Countries with high levels of debt denominated in foreign currencies may resort to devaluation as a strategy to reduce the real value of their debt. When a currency is devalued, the amount owed in the local currency increases, but the actual value in terms of foreign currency decreases. This may ease the burden of debt repayment for the government, particularly if the country is facing fiscal challenges. However, this approach can be risky, as it might lead to loss of investor confidence and increased cost of borrowing in the future.
Devalued Currency Effects
The effects of devaluing a currency ripple through various sectors of an economy. In the short term, it often leads to increased inflation. As the cost of imports rises, domestic prices generally increase, affecting the purchasing power of consumers. This inflationary pressure can be particularly challenging for economies that heavily rely on imported goods.
On the business front, while export-oriented industries may thrive due to increased competitiveness abroad, import-dependent businesses face higher costs, which can lead to reduced profit margins or increased prices for consumers. Additionally, the immediate aftermath of devaluation often includes volatility in financial markets, as investors may react to perceived risks by pulling capital out of the country.
In the long term, if managed well, devaluation can lead to a more competitive export sector, potentially resulting in economic growth and job creation. However, the benefits depend on the elasticity of demand for exports and the country's ability to capitalise on the weakened currency.
Finally, devaluation can impact a country's global reputation. Frequent or large-scale devaluations might lead to a loss of investor confidence, affecting foreign investment and the country's ability to borrow money on international markets. Such decisions, therefore, must balance immediate economic needs with long-term fiscal stability and credibility.
The Bottom Line
Understanding currency devaluation's complex dynamics is vital in today's interconnected world. Whether to boost exports, manage debt, or address trade imbalances, nations employ this strategy with varied outcomes. For those looking to take advantage of forex trading, consider opening an FXOpen account to access comprehensive resources and trading opportunities in this dynamic field.
This article represents the opinion of the Companies operating under the FXOpen brand only. It is not to be construed as an offer, solicitation, or recommendation with respect to products and services provided by the Companies operating under the FXOpen brand, nor is it to be considered financial advice.

How to use Williams Alligator Indicator in crypto trading?You have probably heard about Alligator, indicator which is used by top crypto traders. This powerful tool can increase performance of every cryptocurrency trading strategy and help you to make money on the market. Alligator gives us the precise answer if now price is in impulsive or reactive wave. This knowledge is very useful in building your own crypto trading strategies or even in automated trading bot strategies. Even if you use grid bot strategy Alligator can increase your return on investment because it’s vital to set up grid bot in reactive wave and sideways movements. What is the beast Alligator, let’s have a deep dive into this topic today!
What is Alligator?
Alligator is the best indicator for trend detection. It consist of three moving averages which are called jaw, teeth and lips. Moving averages are frequently used in algorithmic trading bots. They can be exponential, smoothed or weighted depending on particular crypto trading algorithm, but we will use smoothed moving averages (SMA).
Jaw (blue line) - 13 period SMA shifted 8 bars is the future. This is the balance lie of the current time frame, for example 1D
Teeth (red line) - 8 period SMA shifted 5 bars in the future. This is balance line of lower degree time frame, for example 4h
Lips (green line) - 5 period SMA shifted 3 bars in the future. This is balance line of two times lower degree time frame, for example 1h
Please, be careful when you use Alligator on different cryptocurrency trading platforms. Check the correct settings and moving average type. On TradingView it’s correct, don’t worry!
Trend detection with Alligator.
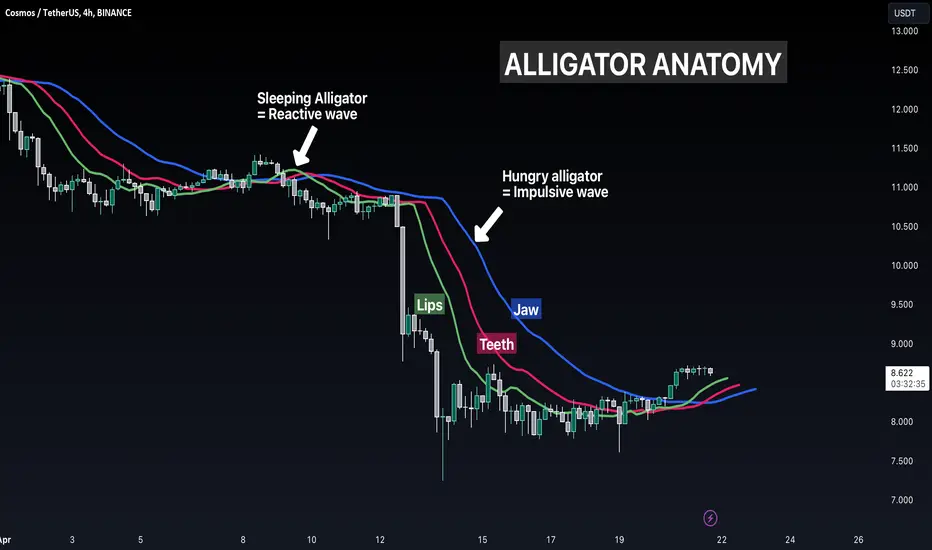
The main Alligator’s feature is the detection the trending markets and markets which are about to explode in any side. This powerful tool can enhance your crypto trading algorithm if you use it in the correct way. On the ATOM price chart you can see the example of an Alligator. As you can see it has two conditions: sleeping and hungry.
Sleeping Alligator is when all lines are crossing each other and the price. This period of time can takes up to 80% of time. This is the market cycle stage where you shall avoid any trading and be prepared for the trending market
Hungry Alligator is when after a long period of consolidation price chose the trend direction. It’s an impulsive move. Alligator’s mouth is widely opened and do not crosses the price.
It’s very important to distinguish the trending market because only this type of a market gives you opportunity for the fast and huge profit. Otherwise, in the range bounded market you don’t have enough space for price to make profit for you. Most of stop losses occur while Alligator is sleeping. Another one very useful hint for you. If you use Elliott waves analysis. You don’t need to understand in which wave market is now. You just jump into the impulses and avoid corrections.
How to trade with Alligator
Here is the most interesting part. How to start crypto trading using Alligator? Our basic strategy is to wait when the price will create the first fractal above the Alligator’s mouth and place conditional order to buy one tick above the fractal’s top. We will discuss fractals in details next time. Now you have to understand how to use Alligator.
Another one hint from our experience is to use fractals only when Alligator has been sleeping for a long time, like you see on the BTC chart. After long sleep and fractal breakout Bitcoin showed the greatest bull run in the history.
Let’s notice where we should close trade. Almost at the top! When price started showing weakness we don’t need to be in the market anymore. Using this strategy on 1W time frame you can hold assets during entire bull run and sell then before bear market. Fantastic! Isn’t it?
Conclusion
In this article we discussed how you can implement Alligator indicator in your trading routine. This indicator will help you to avoid boring market when you can only lose money and catch every big move. Moreover you can use even sideways market detection if you use cryptocurrency trading bot which earns money in range bounded market. For sure this in not the only one strategy using Alligator. Next time we enhance our approach with other tools and see in details how Alligator improve their profitability. Moreover, soon we will live stream where practice trading with Alligator. See you next time!
Best regards,
Skyrex Team
Bitcoin vs. Ethereum: Deciphering the DistinctionsCryptocurrencies have revolutionized the financial landscape, with Bitcoin and Ethereum emerging as two prominent players shaping the digital economy. Despite sharing the common ground of blockchain technology, each offers distinct features and functionalities, underscoring the need to understand their differences.
Introduction to Bitcoin
Bitcoin, introduced in 2009 by the mysterious Satoshi Nakamoto, heralded the dawn of decentralized digital currencies. Its primary objective was to provide an alternative to traditional fiat currencies through a peer-to-peer electronic cash system. Transactions on the Bitcoin network are verified and recorded on an immutable public ledger, known as the blockchain.
Introduction to Ethereum
In 2015, Vitalik Buterin introduced Ethereum, presenting a paradigm shift beyond mere digital currency. Ethereum serves as an open-source platform for executing smart contracts and decentralized applications (DApps) without intermediaries. At its core is Ether (ETH), the native cryptocurrency powering transactions and fueling the ecosystem.
Core Differences
Purpose: Bitcoin functions primarily as a digital currency, aiming to revolutionize financial transactions. Ethereum, on the other hand, is a versatile platform enabling the execution of smart contracts and DApps, with broader implications for decentralization beyond monetary exchange.
Technology: Bitcoin operates on a Proof-of-Work (PoW) consensus mechanism, requiring significant computational power for transaction validation. Ethereum initially adopted PoW but is transitioning to Proof-of-Stake (PoS) with Ethereum 2.0, offering improved scalability and energy efficiency.
Scalability: Bitcoin processes approximately 7 transactions per second, while Ethereum can handle up to 30. Both face scalability challenges, with Ethereum exploring solutions like sharding to enhance throughput and efficiency.
Supply: Bitcoin has a fixed maximum supply of 21 million coins, creating scarcity akin to digital gold. In contrast, Ethereum does not have a predefined supply limit, potentially allowing for continuous production, albeit with economic implications.
Use Cases: Bitcoin is synonymous with a store of value, often likened to digital gold due to its limited supply and scarcity. Ethereum's versatility enables the creation of innovative applications such as decentralized finance (DeFi), non-fungible tokens (NFTs), decentralized autonomous organizations (DAOs), and more, expanding its utility beyond monetary transactions.
Price Dynamics
Bitcoin's market movements often dictate the broader cryptocurrency landscape, impacting the prices of assets like Ethereum. Influencing factors include market sentiment, regulatory developments, and macroeconomic conditions. Ethereum's price dynamics are further influenced by platform upgrades, developer activity, and the burgeoning demand for decentralized applications.
Monthly Bitcoin Chart
Monthly Ethereum Chart
Conclusion
While Bitcoin and Ethereum share the foundation of blockchain technology, their purposes, technologies, and applications diverge significantly. Bitcoin seeks to redefine monetary exchange, while Ethereum aims to revolutionize contractual agreements and decentralized applications. Understanding these distinctions is paramount in navigating the evolving landscape of digital assets and harnessing their transformative potential in the global economy.

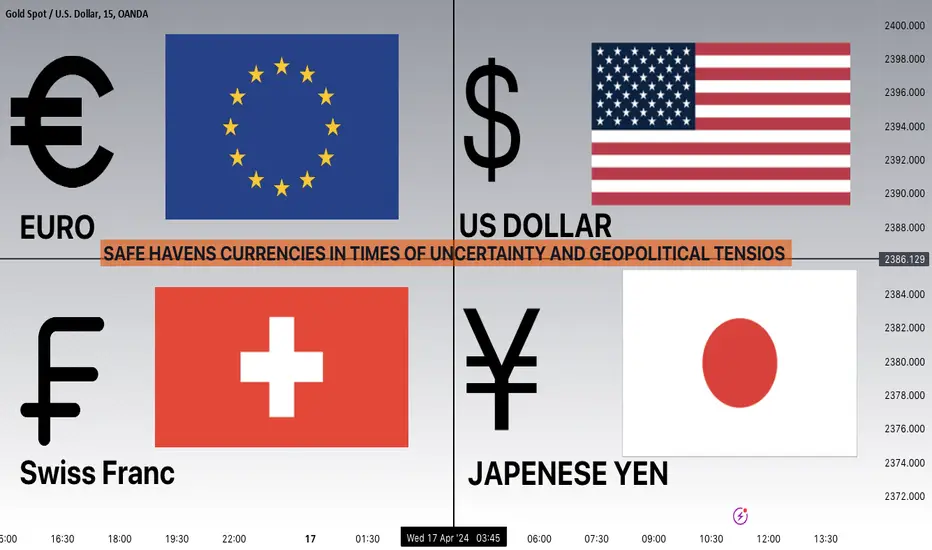
what currencies to buy in times of geopolitical tensions. In times of geopolitical turmoil or war, investors often seek refuge in currencies perceived as safe havens. several currencies are considered safe harbors due to their stability, liquidity, and low risk of depreciation. Some of the notable safe-haven currencies include:
1-US Dollar (USD): The US dollar is often regarded as the ultimate safe-haven currency due to the size and stability of the US economy, as well as the liquidity of USD-denominated assets. During times of uncertainty, investors tend to flock to the USD, driving up its value.
2-Swiss Franc (CHF): Switzerland's reputation for political neutrality and its strong banking system make the Swiss Franc a popular safe-haven currency. Investors view the CHF as a stable and reliable asset during periods of geopolitical tension.
3-Japanese Yen (JPY): The Japanese Yen is considered a safe-haven currency due to Japan's status as a net creditor nation and its large current account surplus. During times of crisis, investors often repatriate funds into the JPY, driving up its value.
4-Euro (EUR): Despite occasional uncertainties surrounding the Eurozone, the Euro is still considered a safe-haven currency by many investors. The Euro's status as the second most traded currency in the world and the stability of major Eurozone economies contribute to its safe-haven appeal.
5-Gold-Backed Currencies: Some countries, particularly those with significant gold reserves, may issue currencies backed by gold or pegged to the price of gold. These currencies offer stability and are perceived as safe havens during times of crisis.
Mind the Gap: How to Trade Price GapsThe Power and Beauty of Price Gaps
Price gaps represent a clear imbalance in supply and demand, making them one of the purest representations of momentum in financial markets. These gaps occur when there is a significant disparity between the closing price of one period and the opening price of the next, indicating a sudden surge in buying or selling pressure.
How to Trade Price Gaps: 3 Different Strategies
1. Gap & Go:
Description: This strategy involves trading in the direction of the gap, anticipating that the momentum will continue.
Execution: Enter trades as soon as the market opens, aiming to capture the initial momentum surge.
Timeframe: Typically applied on shorter timeframes, such as intraday charts.
Risk Management: The gap can be used for stop less shelter, hence stops can be placed above (below) the gap.
Example: Tesla (TSLA) 5min Candle Chart
In this example, Tesla gaps lower at the open – breaking below a key level of support and signalling the breakdown of a sideways range. The gap follows through to the downside during the remainder of the trading session.
Past performance is not a reliable indicator of future results
2. Gap Fill:
Description: In contrast to the Gap and Go strategy, this approach involves fading the initial price movement and trading in the opposite direction of the gap.
Execution: Wait for price to retrace back to pre-gap levels before entering trades, anticipating that the gap will eventually be filled.
Timeframe: Can be applied on various timeframes, depending on the magnitude of the gap and market conditions.
Risk Management: Implement stop-loss orders to manage risk, as price may continue to move against the trade.
Example: Barclays (BARC) Hourly Candle Chart
Barclays gap above key resistance on the hourly candle chart. The gap is filled and broken resistance turns to support prior to the uptrend resuming.
Past performance is not a reliable indicator of future results
3. First Pullback:
Description: This strategy combines elements of both Gap and Go and Gap Fill, focusing on entering trades after the initial momentum surge but waiting for a pullback or consolidation before entry.
Execution: Wait for the first pullback or consolidation after the gap before entering trades in the direction of the prevailing momentum.
Timeframe: Suitable for both shorter and longer timeframes, depending on the magnitude of the gap and market dynamics.
Risk Management: Utilise stop-loss orders to protect against adverse price movements and adjust position sizing based on volatility.
Example: Arm Holdings (ARM) Hourly Candle Chart
Arm’s share price puts in a large price gap which breaks decisively above a key level of resistance on the hourly candle chart. Given the size of the gap, optimal entry requires waiting for the market pullback.
Past performance is not a reliable indicator of future results
Additional Factors to Consider
Catalyst Behind the Gap:
Look for stock-specific news events that recalibrate market expectations, such as earnings surprises or changes in outlook.
Mechanical events like dividends or corporate actions are less likely to sustain momentum.
Size of the Gap:
Larger gaps indicate stronger momentum but also carry a higher risk of mean reversion.
Assess the magnitude of the gap relative to historical price action and volatility.
Levels Broken:
Consider the significance of key support and resistance levels broken by the gap, as they may influence the strength and direction of the price movement.
Prevailing Trend:
Analyse the prevailing trend before the gap and assess whether the gap aligns with the overall market direction.
By incorporating these factors into your analysis and selecting the most suitable strategy based on market conditions, you can effectively trade price gaps and capitalise on momentum opportunities in the financial markets. Remember to exercise proper risk management and adapt your approach as market conditions evolve.
Disclaimer: This is for information and learning purposes only. The information provided does not constitute investment advice nor take into account the individual financial circumstances or objectives of any investor. Any information that may be provided relating to past performance is not a reliable indicator of future results or performance. Social media channels are not relevant for UK residents.
Spread bets and CFDs are complex instruments and come with a high risk of losing money rapidly due to leverage. 84.01% of retail investor accounts lose money when trading spread bets and CFDs with this provider. You should consider whether you understand how spread bets and CFDs work and whether you can afford to take the high risk of losing your money.
1-Indicator Strategy For Beginners...The Stochastic Hey Rich Friends,
Happy Wednesday!
I wanted to share one of my top 3 favorite indicators with you.... The Stochastic (STOCH). As a leading (vs lagging) indicator, it is perfect for beginners because you can find entry and exit signals with only a few key details.
Adding the STOCH to your chart:
1. Search the indicators for "STOCHASTIC" and click once to add to your chart. The only thing that I modify is the thickness of the lines but feel free to make further changes to your liking.
2. Make sure that the "indicators and financial values" option is ON. Right-click your scales, select labels, and make sure "indicators and financial values" is checkmarked.
Entry signals for a buy:
- The STOCH is facing up
- The fast line (blue) is above the slow line (orange)
- The STOCH has crossed above the 20% level, from oversold, back into the blue-shaded area
Exit the trade or take profit once the STOCH has crossed back below the 80% level, from overbought, into the blue-shaded area.
Entry Signals for a sell:
- The STOCH is facing down
- The slow line (orange) is above the fast line (blue)
- The STOCH has crossed below the 80% level, from overbought, back into the blue shaded area
Exit the trade or take profit once the STOCH has crossed back above the 20% level, from oversold, into the blue-shaded area.
I hope that this video helps someone become a more independent and profitable trader. Let me know in the comments if you try this strategy!
Peace and Profits,
Cha

Keltner Bands Pullback StrategyHere we take a look at trading pullbacks using the Keltner Channels. I cover the initial setup, the types of entries, and trades to avoid.
This setup contains 3 parts:
The channel touch
The Pullback
The Entry
The Channel Touch
Here is an example of the beginning signal in our setup, a band touch. The top and bottom bands represent the ATR (Average True Range) of a loopback period. So a touch of the band indicates volatility in the underlying stock or commodity. This also presents us with a chance for a nice pullback with continuation.
The Pullback
The pullback is simple, it is a reversion to the mean. So, the price pulls back to the mean (the ema) that the Keltners are based on. From this point, you can start to determine the entry.
The Entry
Depending on your style, a stop order, or limit order trader, you get to create your style to enter the trade. The following are some ideas: zero line MACD cross, second entry (price action) long or short, a trigger zone (for limit order traders), and an ema touch (limit order traders).
Zero Line Entry
Price pulled back and crossed the zero line on the modified MACD indicator.
Second Entry Long (High2)
The entry is the second attempt to break the previous bars high in a pullback.
The Trigger Zone
I created these based on an internal Keltner channel. You can set your limit orders anywhere inside of them.
EMA Touch
Whenever the price touches an offset ema you can enter. So you can place and move your limit order as the ema moves. I like to offset by one because you are guaranteed a price touch (ema doesn't move). Backtesting is also my accurate with an offset ema.
Conclusion
The Keltner channels offer an extremely powerful way to determine a potential pullback within a trend. They also help define trends (on the first touch) and help objectively identify climatic behavior. This strategy as a whole allows for high-quality setups and the flexibility of entering and exiting trades based on trading style. I like to shoot for a 1:1 based on stop placement.

HERE ARE 10 COMMON TRADING INDICATORS MADE SIMPLE Chart has all 10.
Hope this helps.
Hope it's simple to understand if you still struggle with indicators.
Remember, no one indicator is good on its own.
Think of an indicator as a sign that you should pay attention to a possibility. For example, if I go to the ocean, maybe I have an indicator that says you're closer to sharks than in the great lakes, will I be eaten? Probably not, but also, there are more sharks and my indicator confirms that. I can't use this one indicator to say, I'm probably about to be eaten. BUT.. Let's say I have multiple indicators that I use to give me a better idea if I'll be eaten. Maybe an indicator tells me there is an oddly higher than avg number of a sharks number 1 food source within the area. Can I say I'll be eaten? No, but I could say, maybe due to the increased food supply, there may be more sharks. What if I have a few more indicators, one of which says there are 30 great whites within 10 miles, and another that says, usually at this time of the year, there are only ever between 2 to 7 great whites. Can I say, Yes, I'll be eaten? NOPE, not yet.
What if I have another indicator that says, across the globe, shark attacks are increasing by a certain percentage, and another that says, there is blood detected within the water you're swimming in, which is lower than the threshold for human's to detect, but higher than the threshold needed for sharks to smell. What if I combine that with an indicator that says, on avg there are 1000 swimmers here, but now, there are under 30. Can I say I'll be eaten? Nope, BUT, I can say, hmm. Something is up and if one of us were to get eaten, I'm more likely to be picked out of 30 people than 1000.
When can I say I'll be eaten? Probably if you build an indicator that can detect bite force and compare to known bit forces of sharks that could sense you're actively being eaten, but at that point, the stock moved already... err I mean, the shark ate already, and you're late to the show..
My point being, use them, but don't always assume when it comes to indicators. Take in all the data and then make a decision. Some indicators fit your style, some won't. Do I need 30 stacked indicators for sharks if I'm swimming in Lake Michigan? Probably not, it would make everything a mess.
So, here there are.
Relative Strength Index (RSI): Ah, the RSI, the “I’ve had too much” indicator of the stock market. When it hits above 70, it’s like your stock had too much to drink at the party and is likely to come crashing down. Below 30? It’s been left out in the cold and might be due for a warm-up (a.k.a. price increase). Remember, it’s not foolproof, but then again, neither is your weather app.
On-Balance Volume (OBV): This one’s all about following the crowd. If the volume is increasing, it’s like everyone’s rushing to get the latest iPhone. But remember, even if everyone jumps off a bridge, it doesn’t mean you should too. Always double-check before you follow the herd.
Simple Moving Average (SMA): The SMA is like that reliable friend who’s always a bit behind on the latest trends. It gives you the average closing price over a certain period. It’s simple, it’s moving, it’s average. It’s the SMA.
Exponential Moving Average (EMA): The EMA is the SMA’s hip younger sibling. It cares more about what happened recently than what happened way back when. It’s great for short-term trading, but remember, even the coolest kids can get things wrong.
Moving Average Convergence Divergence (MACD): This one sounds complicated, but it’s not. It’s like watching two rabbits on a race track. If the fast rabbit (the 12-day EMA) overtakes the slow rabbit (the 26-day EMA), it’s a bullish signal. If the slow rabbit overtakes the fast one, it’s a bearish signal. Just remember, rabbits are unpredictable!
Fibonacci retracements: Ah, Fibonacci, the Da Vinci of math. These horizontal lines indicate where support and resistance levels might be. It’s like trying to predict where you’ll meet your ex at a party. It could be useful, but don’t rely on it too much.
Stochastic oscillator: This one’s a bit like a pendulum. When it swings one way, it’s likely to swing back the other way soon. It’s great for spotting potential reversals, but remember, even a broken clock is right twice a day.
Bollinger bands: These are like the elastic waistband of your favorite sweatpants. If the price hits the upper band, it might be time to sell (or stop eating pizza). If it hits the lower band, it might be time to buy (or hit the gym).
Average Directional Index (ADX): This one tells you whether the price is trending strongly or just wandering around like a lost puppy. Above 25 is a strong trend, below 20 is weak. But remember, even lost puppies find their way home eventually.
Accumulation/Distribution (A/D) line: This one’s all about supply and demand. If the line is going up, the stock is being accumulated. If it’s going down, it’s being distributed. It’s like tracking whether more people are buying or selling fidget spinners.
Remember, these indicators are like tools in a toolbox. Don’t try to build a house with just a hammer. Use them in combination, understand their limitations, and always do your own research. Happy trading! 📈

What's in a Trading Plan? Here's All You Need to Include.Ready, set… plan? In this guide, we discuss why you need to plan your trading before trading your plan. Let’s roll.
Table of Contents:
»Importance of a Trading Plan
»The Successful Trading Plan Doesn't Exi...
»What's in a Typical Trading Day?
»Markets, Strategies and Styles
»Summary
Venturing into trading without a plan is akin to setting sail on the ocean without a compass. Or taking the leap without looking first 😉. We can keep the metaphors rolling but if there’s one thing you must remember from this word salad of an article, it’s this: success in trading is possible with a plan. Without a plan, not so much.
In this guide, we'll talk about the importance of creating a trading plan, what you should include in it, and how to follow it.
📍 Importance of a Trading Plan
A trading plan is not just a list of dos and don’ts; it's the roadmap to trading success. Here's why it matters:
➡️ Streamlines Your Actions : Much like a roadmap, a trading plan outlines your objectives, time frames, strategies, and risk management techniques, and offers a clear path forward.
➡️ Limits Emotional Swings : By defining rules and parameters in advance, a trading plan helps to keep emotions in check, limiting impulsive actions that could lead to financial pitfalls.
➡️ Fosters Discipline : Sticking to a plan holds you accountable for your actions and allows you to see where you jump out of your rule book and into undisciplined FOMO-driven pump-chasing revenge trading.
📍 The Successful Trading Plan Doesn't Exi...
Many traders believe that you can be successful by buying and selling random selections of stocks, forex pairs, or commodities. However, the reality is that the most — if not all — successful traders have one thing in common: a well-defined trading plan. Here's what makes for a successful trading plan:
☝🏽 Adaptability : A successful trading plan is not rigid but flexible, allowing for adjustments in response to changing market conditions.
☝🏽 Consistency : A plan helps you stay on track toward your goals as a trader, allowing you to stick to predefined rules and strategies, especially when things get hot and volatile.
☝🏽 Continuous Improvement : A successful trading plan is a work in progress. The more time you use it, the higher probability you will have to refine it as you drift along diverse assets, all swayed by different factors.
📍 What's in a Typical Trading Day?
A typical trading day is a blend of preparation, execution, and reflection. And while you should leave room for new ideas, fresh approaches, and some surprises, there are mainstay components that you need to have in your trading plan.
📰 Reading the News : Staying in the know is always a good idea. For many successful traders, the first thing to do is check what’s the latest on the news front. Known as fundamental analysis, reading the news and doing your research will help you get a sense of investor sentiment.
Moreover, you can stay ahead of the curve and anticipate big market moves by following the economic calendar. Lots of those sharp swings you see in forex or stocks are caused by regular data dumps such as the monthly US nonfarm payrolls report. The Federal Reserve’s decisions on interest rates or the monthly Consumer Price Index are also keys to anticipating volatility.
And what better place to follow all that’s moving markets than the TradingView News section ?
📈 Following the Charts : if you’re here, this one won’t be too new to you. Chart reading, known as technical analysis, is one of the oldest ways to analyze anything — from stocks to crypto and even frozen orange juice.
Think of a chart as your trading canvas. It’s your space to be creative, draft ideas, look for technical patterns and formations, and anticipate potential moves. Observing the chart and watching how prices behave will help you spot where a trend may form, extend, or reverse.
Some of the most popular technical formations include double tops and bottoms, head and shoulders, cup and handle, and more. And some of the most popular technical indicators include the Simple Moving Average (SMA), the Relative Strength Index (RSI), and the Fibonacci sequence.
All of that, and much more, is readily available for you almost anywhere you click on the TradingView platform.
⚒️ Work on Your Skills : Trading doesn’t have to glue you to the screen in constant monitoring of every blip. If you don’t see anything to trade, don’t trade just for the sake of it. Sometimes the best trading position is no position at all.
Instead, use some of your idle time to build out your knowledge base. Grab some books on technical analysis or trading psychology. Or watch interviews of successful traders and investors and gain that educational edge to help you become a more aware, informed, and confident trader.
🏖️ Take a Break : Not everything you do needs to be related to productivity gains and trading improvement. Stare into space or read a great novel. Take your mind off trading and unwind, let the steam off, and recharge your batteries.
Go out, enjoy a walk or do some people-watching. Taking time to zone out every now and then will help you get back to trading sharper, smarter, and more balanced.
📍 Markets, Strategies and Styles
The world of trading is as diverse as it is dynamic, offering a flurry of markets, strategies, and trading styles to explore. Here's a glimpse into the landscape:
💹 Markets : Traders can choose from a variety of financial markets, including stocks , forex , and cryptocurrencies , each with its unique characteristics and opportunities.
When you set out to create your trading plan, think carefully whether you want your portfolio to be concentrated into any one market or asset class. Or maybe you’d like to go for a diverse approach to trading and pull in assets from several markets.
Knowing what your asset preference is will help you phase out markets so they don’t distract you.
🎯 Strategies : From technical analysis to fundamental analysis, you can adopt various strategies to identify trading opportunities and manage risk, ranging from trend following to mean reversion.
News trading is a popular approach to markets as it allows you to bet on economic reports, geopolitical events, central bank updates, and more. On the other hand, technical traders tend to stick to the chart in efforts to gauge price movements and trends. Every chart tells a story. Deciphering it is the tough part.
🌈 Styles : Trading styles are equally important and they’re all tied to a specific time frame of holding your positions. If you’re more into short-term trading, you may pick scalping and target a few pips of gains before jumping out of your trade.
Day trading and swing trading are two popular time-sensitive trading strategies that you may want to explore when building out your trading plan.
📍 Summary
Your trading plan should be exactly that — yours. Tailor it to your specific goals, risk orientation, asset preference, and find out how it stacks up against market conditions.
That way, you can navigate the markets with confidence and direction, instead of letting markets sway your decision making and lead you into uncharted waters. Embark on your trading journey armed with a well-crafted plan, and let it be your roadmap to trading success.
📣With that said, let us know in the comments: do you have a trading plan? What’s the most important element of it and are you always sticking to it?
Don't Trade These Trend Lines | Forex Trading Basics
A lot of traders apply trend lines for trading and making predictions on different financial markets.
Trend line can also be an important element of price action patterns.
However, only few knows that some trend lines are better to be avoided.
In this article, I will share with you the types of trend lines that you should avoid and not rely on for making trading decisions.
Invalidated Trend Line
Even the strongest trend lines may lose their significance with time.
Before you take a trade from a trend line, make sure that it still remains valid.
If the trend line is not respected by the buyers and then by the sellers,
or by the sellers and then by the buyers, we say that such a trend line lost its significance, and it is better to not trade it.
Have a look at that rising trend line on USDCAD.
We see strong bullish reactions to that, and we may expect a bullish movement from that, once it is tested.
However, it was violated and after a breakout it should turn into a vertical resistance.
Retesting that, the price easily went through the broken trend line.
The trend line lost its significance, and it is better to not trade that in future.
2 Touches Based Trend Line
When you are looking for a strong trend line to trade, remember that the trend line should be confirmed by at least 3 touches and 3 consequent bullish / bearish reactions to that.
Above is the example of a valid and reliable trend line.
However, quite often, newbie trade 2 touches based trend lines.
Most of the time, such trend lines are neglected by the market.
Moreover, relying on 2-touches-based trend lines, your chart will look like a complete mess.
Simply because there are too many trend line meeting that criteria.
Receding trend line
There are the trend lines that go against your trade with time while remaining valid.
Have a look at a major falling trend line on NZDCHF on a daily time frame.
You may open a swing long position from that on a daily or a day trade on intraday time frames like an hourly.
You can see that the market may easily go against your predictions for a long time, while perfectly respecting a trend line.
The price was sliding on that trend line for 6 consequent days before it finally started to grow.
Such trend lines are better to be avoided .
Make sure that a trend line and your trade have the same direction.
Trend lines can provide very safe points for trading entries. However, the trend lines are not equal and while some of them can be very profitable, some of them can lead to substantial losses.
❤️Please, support my work with like, thank you!❤️