Forex 3-Session Trading SystemForex 3-Session Trading System
In the dynamic world of forex trading, mastering session-specific strategies can be essential for your trading performance. The Asian, European and US sessions in forex have their own unique rhythms and opportunities. This article delves into three strategies tailored to these sessions, offering insights for traders to navigate the complexities of the forex market.
Understanding Forex Trading Sessions
In forex trading, being familiar with the different forex trading sessions is essential. These sessions correspond to the active hours of major global financial markets, each exhibiting distinct trading characteristics. Wondering what time does the Asian session start? Here’s a concise summary of the major sessions:
Tokyo Session Forex Time: Typically runs from 11:00 AM to 8:00 AM GMT. This session is the primary Asian session, with contributions from other significant markets like Sydney. It's noted for its relatively lower volatility.
London Session Forex Time: Active from 8:00 AM to 5:00 PM GMT (winter) and from 7:00 AM to 4:00 PM GMT (summer), this session encompasses European market activities. It is marked by high volatility and substantial trading volume, particularly during its overlap with other sessions.
New York Session Forex Time: Occurs from 1:00 PM to 10:00 PM GMT (winter) and from 12:00 PM to 9:00 PM GMT (summer), involving American markets. Characterised by high liquidity, its overlap with the London session is particularly notable for trading activity.
Below, you’ll find three session trading systems. To gain the best understanding, consider following along in FXOpen’s free TickTrader platform. Note that they’re considered to be best employed on the 1-minute to 15-minute charts, with the 5-minute being preferred.
Asian-London Breakout
Trading the Asian session can present unique opportunities, especially when combined with the increased volatility of the London session. The Asian-London Breakout Strategy capitalises on this dynamic.
During the relatively calm Asian session, traders often observe the formation of a tight price range. This range is defined by its high and low points, serving as critical markers for the strategy.
Entry
As the London session begins, around 7:00-8:00 AM GMT, traders may set buy/sell stop orders at both the high and low of the Asian session's range. This approach aims to harness the surge in volatility as European traders enter the market.
Stop Loss
Once an order is triggered, a stop loss may be placed above or below the opposing high or low of the range.
The other order that wasn't triggered is usually cancelled.
Take Profit
Traders may look to take profits at the end of the London session or extend into the New York session, targeting major support or resistance levels.
Alternatively, they may trail a stop loss above or below key swing points that emerge as the trading day progresses.
The rationale behind this strategy is that the Asian session's consolidation often leads to a breakout as the London session begins, with new volumes and market participants. By setting orders on both ends of the Asian session range, traders can potentially capture significant moves regardless of the direction.
London Range Retest
The London Range Retest Strategy is a popular method for traders focusing on the volatility and patterns of the London session. It involves identifying a specific range and capitalising on its breakout and subsequent retest.
This strategy focuses on the range formed typically between 7:30 and 8:30 AM GMT during the London session. Traders have the flexibility to adjust this timeframe, possibly extending it from 7:00 to 9:00 AM GMT to better suit their trading style.
Entry
Traders look for a breakout from this defined range.
Once a breakout occurs, they wait for a retest of the range. Entry points may be identified either at the high or low of the range, at the 50% retracement level (the midpoint between the high and low), or at a specific support or resistance level indicated on the chart.
Stop Loss
The stop loss might be set beyond the high or low of the range, potentially ensuring a level of protection against market reversals after entry.
Take Profit
Given that the entry may not be triggered until later in the day, traders might prefer to close the trade at the end of the New York session.
Alternatively, they may set their take profit at a suitable support or resistance level, aligning with the market’s momentum.
The strategy's rationale lies in leveraging the initial volatility of the London session for a range breakout, followed by a patient wait for a retest. This method offers a structured entry point while managing risk with a well-defined stop loss.
London-New York Reversal
The London-New York Reversal Strategy focuses on the trend reversals often observed at the start of the New York session. It combines technical analysis with timing, offering traders a method to capitalise on these shifts.
This strategy leverages the period between 12:30 and 1:30 PM GMT, a time when the New York session's commencement frequently triggers market reversals as the US stock market opens. The key tool here is the Relative Strength Index (RSI) indicator, which is particularly useful for spotting divergences.
Entry
Traders monitor the RSI for divergences with the price movement.
An entry may be considered when a divergence forms, coupled with signs of a market reversal. This might be indicated by a specific candlestick pattern, such as an engulfing candle, confirming the reversal.
Stop Loss
The stop loss may be placed above or below a nearby high or low, depending on the direction of the trade. This placement helps manage risk in case the expected reversal does not materialise as anticipated.
Take Profit
Profit targets might be set at the London opening range, a strategy that aligns with the previous session's initial movements.
Alternatively, traders may choose to take profits at another appropriate support or resistance level in line with the ongoing market trends.
The strategy's basis lies in the observation that the overlap of the London and New York sessions can result in trend reversals, particularly detectable through RSI divergences and specific price patterns.
The Bottom Line
In conclusion, these forex session-specific strategies offer valuable tools for traders. By understanding and applying these techniques, you may enhance your trading performance. To put these strategies into practice and experience the dynamic forex market firsthand, consider opening an FXOpen account. It’s a step towards applying these insights in a real-world trading environment, where theory meets practice.
This article represents the opinion of the Companies operating under the FXOpen brand only. It is not to be construed as an offer, solicitation, or recommendation with respect to products and services provided by the Companies operating under the FXOpen brand, nor is it to be considered financial advice
Community ideas

Using price action & tradingview tools to trade betterHello,
Price action is a vital aspect of trading, and analyzing candlestick patterns is key to understanding market dynamics. The size of candles, representing the range between opening and closing prices, is crucial for traders. Large candles signal strong momentum and potential trends, while smaller candles suggest indecision or lack of clear direction. Traders use candle size to identify entry and exit points, manage risk, and gauge market sentiment. By examining the relationship between candle sizes and volume, traders can make informed decisions based on visual representations of price movements. In summary, candle size is a valuable tool in price action analysis, helping traders interpret market behavior for better decision-making.
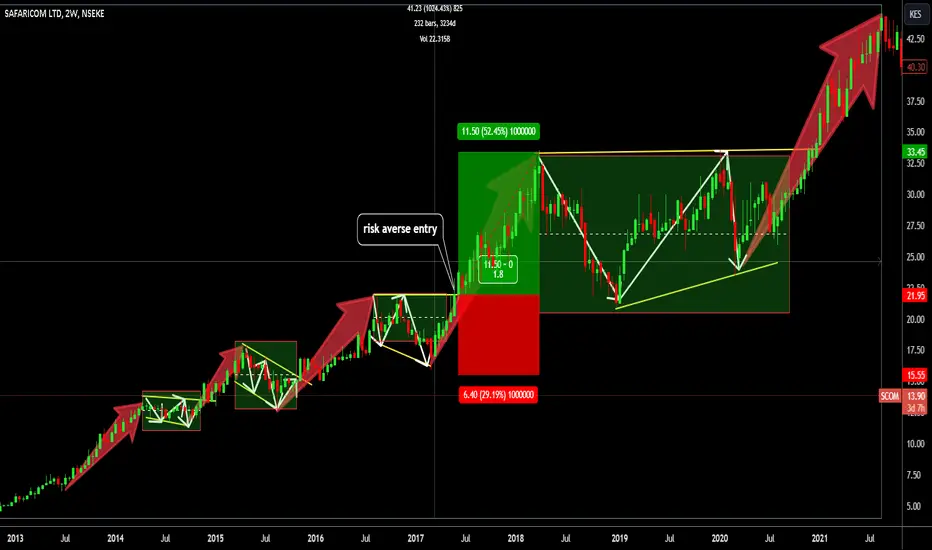
A key tool you can use to measure the momentum of an asset is the Date & price range tool . This tool allows users to place points vertically on two different prices. A Text appears along the box displaying the total size of the price moving in terms of actual share price, percentage and time the move took. E.g the chart below shows the move took 3234 days and was +1024.43% in terms of increase.
Once you've got the hang of price action and figured out which way the trend is going, the next big thing is spotting patterns that tell you when to jump in. We focus on two things: motive moves, which show the trend, and corrections, which give us good entry points . Motive moves are like the big, important moves we want to trade, and corrections are where we can get in on the action. Recognizing these patterns helps us know when it's smart to join the market and increases our chances of making successful trades. a good example of these can be identified below
Once you've identified patterns, the next step is deciding when to get in. There are two main types: risk entries and risk-averse entries. Risk entries often align with motive moves, indicating a trader's willingness to take on more risk for potentially higher rewards. Below is a great way of looking at both of this
Risk taking entry
Risk averse entry
This is where the correction has already been broken and a trend determined. The Risk to reward ratio is lower and therefore less profit can be achieved here.
Next we shall be looking at how to look at the indicators to support your trading hypothesis and make better trades.
Good luck and all the best.
Flag and Pennant Chart Patterns🎲 An extension to Chart Patterns based on Trend Line Pairs - Flags and Pennants
After exploring Algorithmic Identification and Classification of Chart Patterns , we now delve into extensions of these patterns, focusing on Flag and Pennant Chart Patterns. These patterns evolve from basic trend line pair-based structures, often influenced by preceding market impulses.
🎲 Identification rules for the Extension Patterns
🎯 Identify the existence of Base Chart Patterns
Before identifying the flag and pennant patterns, we first need to identify the existence of following base trend line pair based converging or parallel patterns.
Ascending Channel
Descending Channel
Rising Wedge (Contracting)
Falling Wedge (Contracting)
Converging Triangle
Descending Triangle (Contracting)
Ascending Triangle (Contracting)
🎯 Identifying Extension Patterns.
The key to pinpointing these patterns lies in spotting a strong impulsive wave – akin to a flagpole – preceding a base pattern. This setup suggests potential for an extension pattern:
A Bullish Flag emerges from a positive impulse followed by a descending channel or a falling wedge
A Bearish Flag appears after a negative impulse leading to an ascending channel or a rising wedge.
A Bullish Pennant is indicated by a positive thrust preceding a converging triangle or ascending triangle.
A Bearish Pennant follows a negative impulse and a converging or descending triangle.
🎲 Pattern Classifications and Characteristics
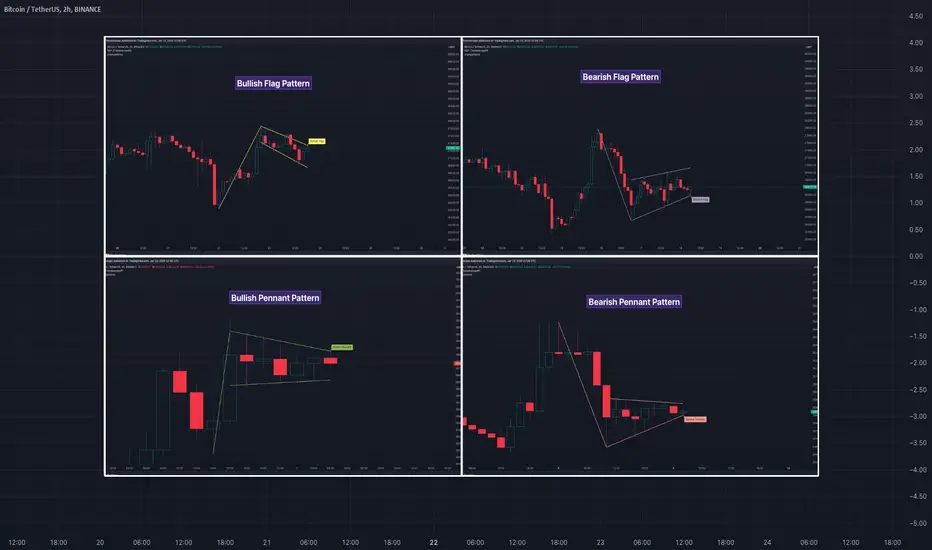
🎯 Bullish Flag Pattern
Characteristics of Bullish Flag Pattern are as follows
Starts with a positive impulse wave
Immediately followed by either a short descending channel or a falling wedge
Here is an example of Bullish Flag Pattern
🎯 Bearish Flag Pattern
Characteristics of Bearish Flag Pattern are as follows
Starts with a negative impulse wave
Immediately followed by either a short ascending channel or a rising wedge
Here is an example of Bearish Flag Pattern
🎯 Bullish Pennant Pattern
Characteristics of Bullish Pennant Pattern are as follows
Starts with a positive impulse wave
Immediately followed by either a converging triangle or ascending triangle pattern.
Here is an example of Bullish Pennant Pattern
🎯 Bearish Pennant Pattern
Characteristics of Bearish Pennant Pattern are as follows
Starts with a negative impulse wave
Immediately followed by either a converging triangle or a descending converging triangle pattern.
Here is an example of Bearish Pennant Pattern
🎲 Trading Extension Patterns
In a strong market trend, it's common to see temporary periods of consolidation, forming patterns that either converge or range, often counter to the ongoing trend direction. Such pauses may lay the groundwork for the continuation of the trend post-breakout. The assumption that the trend will resume shapes the underlying bias of Flag and Pennant patterns
It's important, however, not to base decisions solely on past trends. Conducting personal back testing is crucial to ascertain the most effective entry and exit strategies for these patterns. Remember, the behavior of these patterns can vary significantly with the volatility of the asset and the specific timeframe being analyzed.
Approach the interpretation of these patterns with prudence, considering that market dynamics are subject to a wide array of influencing factors that might deviate from expected outcomes. For investors and traders, it's essential to engage in thorough back testing, establishing entry points, stop-loss orders, and target goals that align with your individual trading style and risk appetite. This step is key to assessing the viability of these patterns in line with your personal trading strategies and goals.
It's fairly common to witness a breakout followed by a swift price reversal after these patterns have formed. Additionally, there's room for innovation in trading by going against the bias if the breakout occurs in the opposite direction, specially when the trend before the formation of the pattern is in against the pattern bias.
🎲 Cheat Sheet
3 of the Top Trading StrategiesTrading in the financial markets requires a blend of intuition, analysis, and well-tested strategies. This article delves into three of the top trading strategies that offer valuable insights to traders of all experience levels. We’ll break down their specific components, entries and exits and explain why they work for stock market trading and trading in other markets.
For the best results, head over to FXOpen’s free TickTrader platform. There, you’ll find all of the charts and tools you need to put these trading strategies into practice.
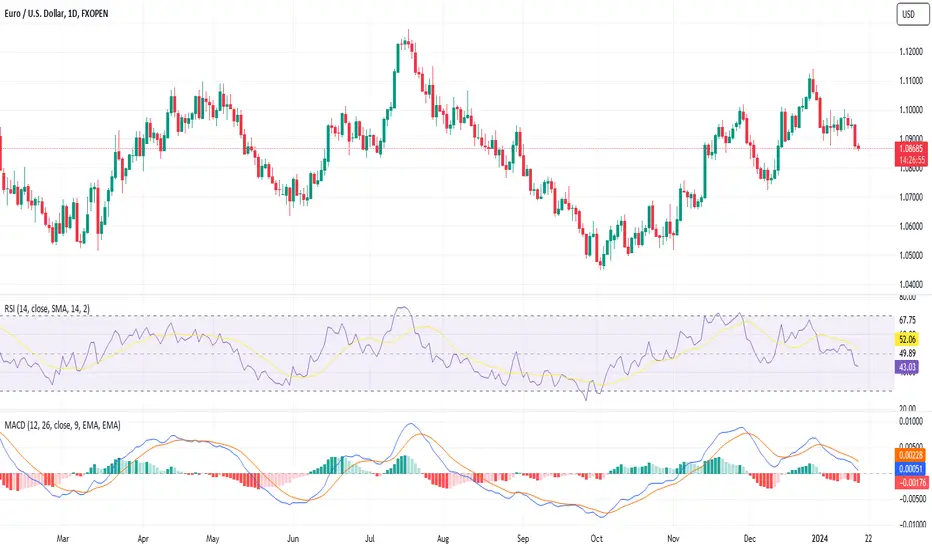
RSI + MACD Divergence
The RSI (Relative Strength Index) and MACD (Moving Average Convergence Divergence) are two common indicators featured in many day trading guides, known for their ability to help traders identify price changes in fast-moving markets. Both the RSI and MACD are used to gauge the momentum of a trend, but when they diverge from the actual price movement, it's often an early warning sign that a reversal may be due soon.
Entry/Exit Criteria
Entry:
Divergence in RSI and MACD: For a bullish divergence, the price makes a lower low while the RSI and MACD make higher lows. Conversely, for a bearish divergence, the price makes a higher high while the RSI and MACD make lower highs.
RSI movement: An entry signal is given when the RSI crosses above 30 (indicative of potential upward momentum) or dips below 70 (suggesting possible downward momentum).
Stop Losses:
For a bullish divergence: Traders will often place a stop loss slightly below the recent swing low or a support level.
For a bearish divergence: It's typical to set the stop loss just above the recent swing high or a resistance level.
Take Profits:
Traders may consider closing their position when there's a shift in the momentum indicated by either the RSI moving back to the 50 level or the MACD line crossing its signal line.
Why Does This Strategy Work?
When both RSI and MACD show divergence with the price, it's like having two witnesses corroborating the same story. Divergence in these indicators often suggests that the prevailing momentum behind a price trend is weakening. This weakening momentum, coupled with other market factors, can lead to a trend reversal.
By entering a trade when the RSI dips below 70 or rises above 30, traders are attempting to catch the initial phase of a potential trend reversal, capitalising on the early momentum shift. The combined strength and validation from both indicators provide a more robust trading signal, reducing the likelihood of false entries and improving the probability of successful trades.
A Pullback to Support/Resistance
Understanding support and resistance levels is fundamental in technical analysis. These levels represent price points where the asset has historically faced buying or selling pressure, making them pivotal areas to watch.
When the price breaks through these levels and then retraces to test them, traders have an opportunity to capitalise on the market's attempt to reconfirm or challenge the breakout. This price action strategy is preferred by many for its simplicity and repeatability.
Entry/Exit Criteria
Entry:
After a bullish breakout: The price should retrace back to what was previously a resistance level. If this resistance-turned-support holds, it's an indication that the breakout is genuine and the price is likely to continue its upward trajectory.
After a bearish breakout: The price should retrace to the former support level. If this support-turned-resistance holds, it suggests the breakout is valid, and the price may continue its decline.
Stop Losses:
Following a bullish breakout: Traders often position the stop loss just below the new support level (formerly resistance) or an adjacent swing low to safeguard against false breakouts.
After a bearish breakout: The stop loss is typically set just above the new resistance level (formerly support) or a nearby swing high.
Take Profits:
As the price progresses away from the support or resistance level post-pullback, traders could eye subsequent support or resistance levels as potential areas to take profits.
Why Does This Strategy Work?
A pullback to support or resistance is essentially the market's way of reevaluating and confirming its initial breakout decision. If resistance is broken and then successfully tested as a new support, it underscores the market's bullish sentiment. Similarly, if a support level is breached and then reaffirmed as resistance, it underlines the bearish stance of the market.
This self-confirmation builds trust in the breakout's authenticity, allowing traders to join the trend with more confidence. As this dynamic unfolds, it attracts more participants, further fueling the trend's direction.
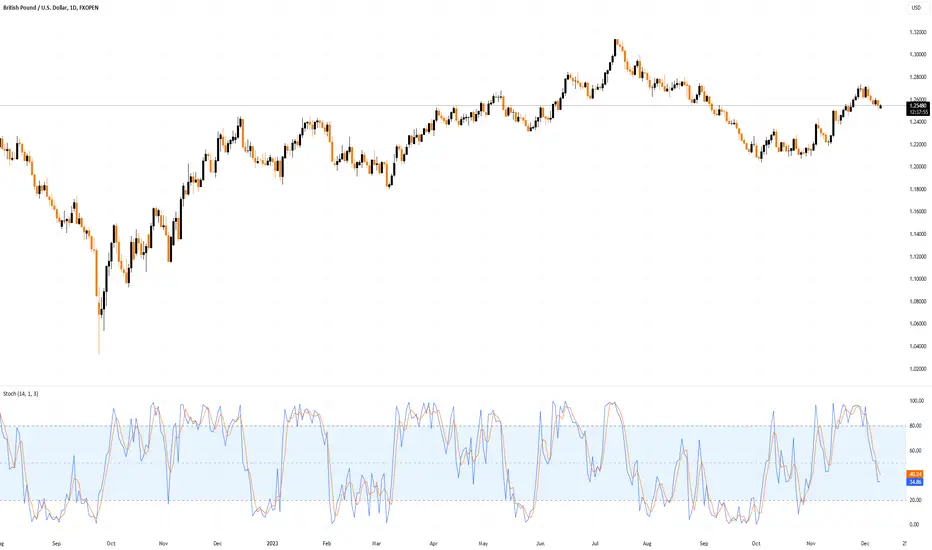
Stochastic + HMA
The combination of the Stochastic Oscillator and Hull Moving Average (HMA) offers a powerful toolset for traders. Let's briefly introduce both indicators before diving into the strategy.
Stochastic Oscillator: A momentum indicator comparing a particular closing price of an asset to a range of its prices over a certain period. Levels above 80 typically indicate that the asset is overbought, while levels below 20 suggest it is oversold.
Hull Moving Average (HMA): A type of moving average that responds faster to price changes than standard moving averages. It reduces lag and increases responsiveness, making it useful for short-term traders.
Note that this strategy works best when trades are taken in the direction of the overall trend.
Entry/Exit Criteria
Entry:
The Stochastic Oscillator should be either in overbought (>80) or oversold (<20) areas. Once the Stochastic moves back below 80 or rises above 20, it indicates a potential momentum shift.
Subsequently, if the 9-period HMA (blue) crosses over the 21-period HMA (red) shortly after, this acts as a confirmation of a trend reversal. For an uptrend, the crossover of the 9-period HMA above the 21-period HMA confirms a buy signal at the close of the candle. Conversely, for a downtrend, the 9-period HMA crossing below the 21-period HMA confirms a sell signal.
Stop Losses:
Traders often set the stop loss just above (for short positions) or below (for long positions) the nearby swing points to manage risk effectively.
Take Profits:
Traders employing the Stochastic + HMA strategy might look for signs of trend exhaustion or a reversal in the Stochastic Oscillator for clues to take profits.
Additionally, monitoring subsequent crossing of the 9-period HMA back over the 21-period HMA in the opposite direction of the trade, or reaching a nearby support or resistance level, could serve as sensible points to lock in gains.
Why Does This Strategy Work?
The Stochastic oscillator's primary function is to identify overextended conditions in the market. Like all indicators used in isolation, it can provide false signals. However, when paired with the faster-reacting HMA, the Stochastic's early warning is confirmed by the HMA. The quick response of the 9-period HMA to price changes combined with the smoother, longer 21-period HMA gives traders a clear indication of short-term momentum shifts, increasing the likelihood of successful trades in fast-moving markets.
The Bottom Line
In summary, traders exploring various types of trading in the stock market can benefit from these strategies. Moreover, they’re not just limited to stocks; you’ll find the same repeatable trades across the forex, commodities, and crypto* markets. However, it’s vital to remember that the strategies are a framework that should be tailored to a specific trade.
The key to using them effectively is in continuous learning and practice. Once you’re ready to apply them for real, you can consider opening an FXOpen account. When you do, you’ll gain access to a diverse range of markets, competitive trading costs, and rapid execution speeds. Happy trading!
*At FXOpen UK and FXOpen AU, Cryptocurrency CFDs are only available for trading by those clients categorised as Professional clients under FCA Rules and Professional clients under ASIC Rules, respectively. They are not available for trading by Retail clients.
This article represents the opinion of the Companies operating under the FXOpen brand only. It is not to be construed as an offer, solicitation, or recommendation with respect to products and services provided by the Companies operating under the FXOpen brand, nor is it to be considered financial advice.
Indicator Insights Part 3: A Different Way to Use RSIIn this instalment of our educational series, Indicator Insights, we shift our focus to the Relative Strength Index (RSI) , exploring a non-traditional approach that harnesses its power to identify strong momentum stocks.
While the conventional use of RSI is often associated with overbought and oversold conditions, our alternative method employs RSI as a relative strength indicator, uncovering stocks exhibiting high levels of relative strength.
Understanding RSI - The Traditional Approach
The RSI is a momentum oscillator that measures the speed and change of price movements. Traditionally, traders use RSI to identify overbought and oversold conditions. The standard interpretation suggests that a stock is potentially overbought when the RSI surpasses 70, indicating a potential reversal or pullback. Conversely, an RSI below 30 might suggest that a stock is oversold, hinting at a possible upward reversal.
A Different Perspective - RSI as a Relative Strength Indicator
Our alternative approach views RSI as more than just an overbought/oversold signal generator. Instead, we leverage it as a relative strength indicator, pinpointing stocks that exhibit robust momentum compared to the broader market. The strategy involves waiting for an RSI reading to reach +75, signalling significant strength, and then strategically entering a position during a pullback when the RSI retreats to 50.
Methodology: Buying Strong Momentum Stocks
Identifying Strong Momentum (RSI +75): Monitor stocks with RSI readings reaching +75, indicating robust upward momentum.
Waiting for the Pullback (RSI 50): Exercise patience and wait for the RSI to retreat to 50. This pullback suggests a temporary cooling-off period in the stock's momentum.
Strategic Entry: Initiate a long position when the RSI starts to move back above 50, anticipating a potential resumption of the strong upward trend.
Advantages of This Approach:
Relative Strength Focus: By emphasising relative strength, this strategy aims to align with stocks demonstrating a sustained and potent upward trend compared to the broader market.
Disciplined Entry: Waiting for the RSI to retreat to 50 provides a disciplined entry point, reducing the likelihood of entering trades during extended periods of overbought conditions.
Momentum Confirmation: Combining RSI readings with a pullback strategy helps confirm the sustainability of the stock's momentum before entering a position.
Potential Limitations:
False Signals: As with any strategy, false signals may occur, especially in volatile markets. Traders should exercise caution and consider additional factors in their decision-making process.
Market Conditions: This method may perform better in trending markets and may be less effective in choppy or sideways conditions.
Worked Example 1: Buying RSI Pullback on Daily Timeframe
Let's illustrate this approach with a practical example:
Stock: Tesco (TSCO)
RSI Reaches +75: RSI for Tesco reaches +75, signalling strong momentum.
Pullback to RSI 50: Tesco experiences a pullback, and RSI retreats to 50.
Strategic Entry: A long position is initiated as the stock shows signs of resuming its strong upward trend and RSI turns back above 50.
Tesco (TSCO) Daily Candle Chart
Past performance is not a reliable indicator of future results
Worked Example 2: Buying RSI Pullback on Hourly Timeframe
Stock: Apple (AAPL)
RSI Reaches +75: Hourly RSI for Apple reaches +75, signalling strong momentum.
Pullback to RSI 50: Apple experiences a pullback, and RSI retreats to 50.
Strategic Entry: A long position is initiated as the stock shows signs of resuming its strong upward trend and RSI moves back above 50.
AAPL Hourly Candle Chart
Past performance is not a reliable indicator of future results
Summary:
This non-traditional use of RSI as a relative strength indicator offers traders a simple way of identifying and capitalising on strong momentum stocks. By waiting for RSI to reach +75 and strategically entering during a pullback to 50, traders can align with stocks exhibiting exceptional strength relative to the broader market.
Disclaimer: This is for information and learning purposes only and is intended for UK audiences. The information provided does not constitute investment advice nor take into account the individual financial circumstances or objectives of any investor. Any information that may be provided relating to past performance is not a reliable indicator of future results or performance. Social media channels are not relevant for UK residents.
Spread bets and CFDs are complex instruments and come with a high risk of losing money rapidly due to leverage. 75% of retail investor accounts lose money when trading spread bets and CFDs with this provider. You should consider whether you understand how spread bets and CFDs work and whether you can afford to take the high risk of losing your money.
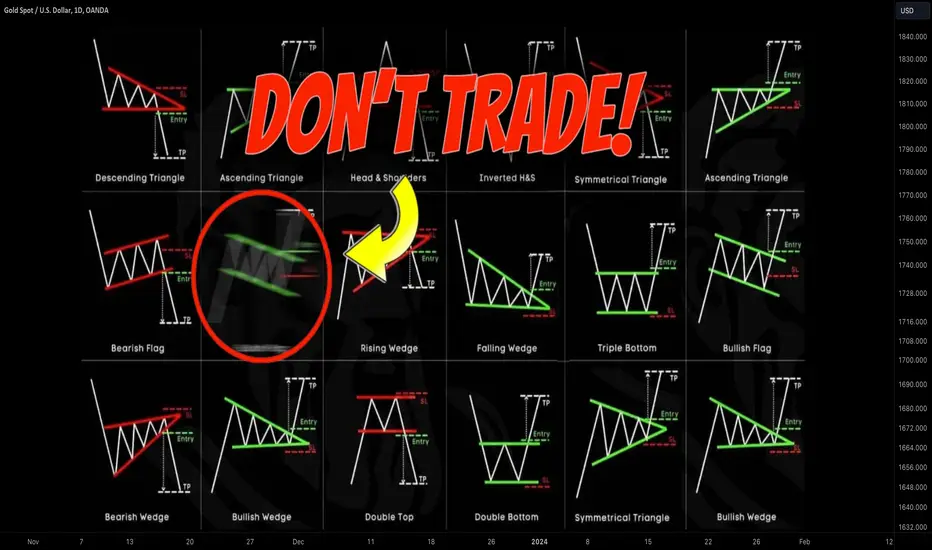
Learn Best Price Action Patterns by Accuracy
Last year, I shared more than 1300 free signals and forecasts for Gold, Forex, Commodities and Indexes.
In my predictions, quite often I relied on classic price action patterns.
In this article, I will reveal the win rate of each pattern, the most accurate and the least accurate formations of the last year.
Please, note that all the predictions and forecasts that I shared this year are available on TradingView and you can back test any of the setup that I identified this year by your own. Just choose a relevant tag on my TradingView page.
Also, some forecasts & signals were based on a combination of multiple patterns.
Here is the list of the patterns that I personally trade:
🔘 Double Top or Bottom with Equal Highs
The pattern is considered to be valid when the highs or lows of the pattern are equal.
The pattern gives a bearish/bullish signal when its neckline is broken.
🔘 Double Top or Bottom with Lower High/Higher Low or Cup & Handle
The pattern is considered to be valid when the second top/bottom of the patterns is lower/higher than the first one.
The pattern gives a bearish/bullish signal when its neckline is broken.
🔘 Head & Shoulders and Inverted Head and Shoulders
The pattern gives a bearish/bullish signal when its neckline is broken.
🔘 Horizontal Range
The pattern is the extension of a classic double top/bottom with at least 3 equal highs/lows.
The pattern gives a bearish/bullish signal when its neckline is broken.
🔘 Bullish/Bearish Flag
The pattern represents a rising/falling parallel channel.
It gives a bullish/bearish signal when its upper/lower boundary is broken.
🔘 Rising/Falling Wedge Pattern
The pattern represents a contracting rising/falling channel.
It gives a bullish/bearish signal when its upper/lower boundary is broken.
🔘 Rising/Falling Expanding Wedge
The pattern represents an expanding rising/falling channel.
It gives a bullish/bearish signal when its upper/lower boundary is broken.
🔘 Descending/Ascending Triangle
The pattern is the extension of a cup & handle pattern with at least 2 lower highs/lows.
The pattern gives a bearish/bullish signal when its neckline is broken.
Please, also note that all the patterns that I identified and traded were formed on key horizontal or vertical structures.
Remember that the accuracy of any pattern drops dramatically if it is formed beyond key levels.
I consider the pattern to be a winning one if after a neckline breakout, it managed to reach the closest horizontal or vertical structure, not invalidating the pattern's highs/lows.
For example, if the price violated the high of the cup and handle pattern after its neckline breakout, such a pattern is losing one.
If it reached the closest structure without violation of the high, it is a winning pattern.
🔍 Double Top or Bottom with Equal Highs
I spotted 85 setups featuring these patterns.
Their accuracy is 62%.
🥉 Double Top or Bottom with Lower High/Higher Low or Cup & Handle
96 setups were spotted.
The performance turned out to be a little bit higher than a classic double top/bottom with 65% of the setups hitting the target.
🔍 Head & Shoulders and Inverted Head and Shoulders
58 formations spotted this year.
Average win rate is 64%
🏆 Horizontal Range
The most accurate pattern of this year.
More than 148 patterns were spotted and 74% among them gave accurate signal.
🔍 Bullish/Bearish Flag
38 setups identified this year.
The accuracy of the pattern is 57%
Rising/Falling Wedge
The pattern turned out to be a little bit more accurate.
Among 62 formations, 59% end up being profitable.
👎 Rising/Falling Expanding Wedge
The worst pattern of this year.
I recognized 24 patterns and their accuracy was just 51%.
🥈 Descending/Ascending Triangle
64 patterns were identified.
The win rate of the pattern is 66%.
The most important conclusion that we can make analyzing the performance of these patterns is that they all have an accuracy above 50%. If you properly combine these patterns with some other technical or fundamental tools, the accuracy of the setup will increase dramatically.
Good luck in your trading!
❤️Please, support my work with like, thank you!❤️
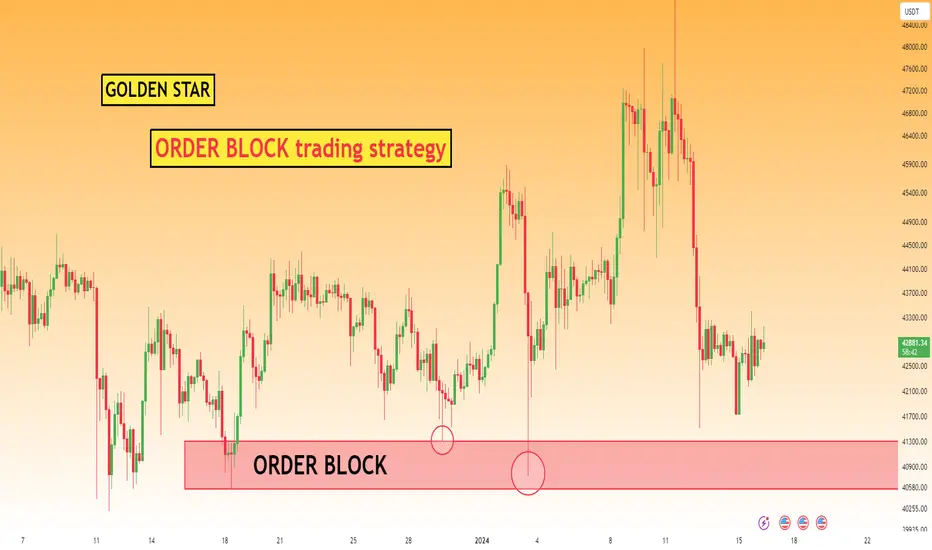
ORDER BLOCK trading strategyThe order block trading strategy is based on the concept of smart money, focusing on identifying specific zones where institutional traders previously executed their orders. Once we have successfully identified these zones, we patiently wait for the price to revisit these levels.
By using a suitable strategy, we then enter our trades in the anticipated direction.
-What is an Order Block in Forex:
Order blocks are special zones within the market where significant buy or sell orders from major market participants, like institutional traders, have been previously executed.
These order clusters, situated in specific price regions, hold considerable influence over price action, market sentiment, and liquidity.
Order blocks serve as a specialized methodology to determine crucial support and resistance levels, derived from the trading behavior of institutional traders. These levels are subsequently employed as strategic points for initiating or concluding trades.
-Understanding Order Block in Trading:
In Forex or any other market, ict order block represent crucial price levels where we observe significant and aggressive price movements. These levels are characterized by large firms strategically placing their orders, which often results in the market moving forcefully from those points.
To influence the market in a specific direction, smart money or hedge funds execute orders worth billions of dollars at particular price levels. However, not all of their orders are immediately filled. As a result, smart money revisits these levels to execute the pending orders, leading to further movement in the desired direction.
-ICT Order Blocks Definition:
Order blocks can indeed be identified on any time frame, ranging from small time frame like 15m,30 m and m5 to larger time frames like daily or weekly charts.
Order blocks can be classified into two main types: Bullish Order Blocks and Bearish Order Blocks.
1. Bullish Order Block:
A Bullish Order Block is recognized as the last downward candle before the price experiences a significant and aggressive upward movement. It represents a key level where institutional traders placed substantial buy orders, causing the market to rally strongly from that point.
2. Bearish Order Block:
On the other hand, a Bearish Order Block is characterized by the last upward closing candle before the price undergoes a sharp and forceful downward movement. It signifies a critical level where large market participants, such as institutional traders, positioned significant sell orders, resulting in a significant decline in the market.
By identifying and analyzing these Bullish and Bearish Blocks, traders can gain insights into a potential reversal or continuation patterns and utilize them as entry or exit points for their trades.
Trading order blocks go beyond solely identifying the last up or down closing candle. To effectively trade order blocks, it is essential to consider several contextual factors, including:
1. Liquidity Hunt: Market participants, especially institutional traders, may strategically place their orders to trigger stop losses or create a liquidity imbalance. Understanding liquidity patterns and how they can influence price action is crucial.
2. Daily Bias: Evaluating the overall market sentiment and bias for the day is important. This involves considering factors such as news events, economic releases, and geopolitical developments that may impact the market and influence order-block behavior.
3. Interest Rates and Fundamentals: Fundamental factors, including interest rates, economic indicators, and central bank policies, can significantly influence market conditions. Understanding how these factors interact with order blocks can provide valuable insights for trading decisions.
By taking these contextual factors into account, traders can enhance their understanding of order blocks and make more informed trading decisions.
To identify order blocks, price action traders typically examine historical price movements on the chart to locate areas where the market has shown strong reactions.
-How to identifying order blocks:
1. Look for strong price reactions: Analyze the chart to identify areas where the price has displayed significant and notable reactions, such as sharp reversals, extended consolidations, or breakouts.
2. Mark potential order block levels: Once you identify these areas of strong price reactions, mark them as potential order block levels on your chart. These levels represent key price zones where institutional traders may have executed large orders.
3. Assess support and resistance characteristics: Consider how the price behaves with the marked order block levels. If the price bounces off a specific level multiple times, it indicates a robust level of support or resistance, depending on whether the price approached the level from above or below.
4. Watch for role reversal: When an order block level is breached, its role as support or resistance can reverse. For instance, a broken resistance level may transform into a support level, and vice versa. In such cases, traders often wait for a retest of the broken level before entering trades in the direction of the breakout.
By following these steps and considering the principles of support and resistance, traders can effectively identify and utilize order blocks in their trading strategies. However, it’s important to note that order block analysis is just one tool among many in a comprehensive trading approach.
-How To Trade Order Blocks:
The steps you’ve mentioned provide a general guideline for trading order blocks in forex. Here’s a breakdown of each step:
1. Point of Interest (POI): Start by identifying potential order blocks on higher time frames, such as daily and 4-hour charts. These could be areas of consolidation or strong price reactions. Once you’ve marked these POIs, move to the next step.
2. Optimization: Switch to lower time frames like 1-hour, 15-minute, or 5-minute charts to refine and optimize your POIs. By zooming in on these lower time frames, you can better analyze the price action within the identified areas.
3. Price Observation: Keep an eye on the price action in the higher time frame. Monitor how the price behaves as it approaches your POI. This observation helps you determine the strength of the order block and potential trading opportunities.
4. Rejection Analysis: When the price reaches your POI, switch to the lower time frame to examine how the order block reacts to the price. Look for signs of rejection, like fair value gap
5. Entry on Lower Time Frame: Once you’ve observed a rejection or a significant reaction at the order block on the lower time frame, you can plan your entry. Look for suitable entry signals, such as a breakout, pullback, FVG price Imbalance, and more
6. Stop Loss Placement: To manage risk, it’s important to place a stop loss order. Consider setting your stop loss 1 to 5 pips below the order block ict to allow for potential market noise and fluctuations. This helps protect your trading capital in case the trade doesn’t go as planned.
Remember, these steps provide a general framework for trading ict order blocks, but it’s crucial to develop a trading strategy that suits your risk tolerance, trading style, and market conditions.
It’s recommended to thoroughly back test and practice your strategy before applying it with real money. Additionally, staying updated with market news and having proper risk management practices are essential for successful trading.
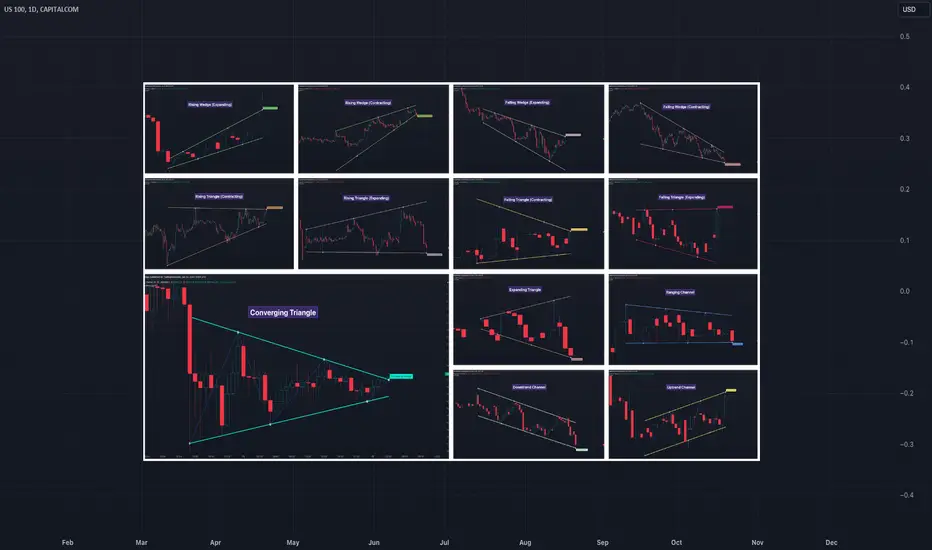
Algorithmic Identification and Classification of Chart PatternsWelcome to the world of technical analysis, where chart patterns play a pivotal role in shaping trading strategies. This is an ultimate guide designed to help users objectively identify the existence of patterns, define the characteristics and classify them. In this discussion, we will mainly concentrate on the patterns formed by trend line pairs. This includes wedges, triangles and channel type patterns.
🎲 Basic Principle of Identifying the Pattern
It is very important to apply definitely set of rules when identifying the patterns in order to avoid biases or fitting patterns to our opinions. The dangers of overfitting the patterns to our bias is documented in the idea
To identify the patterns objectively, we need to set some ground rules or follow a well-defined technique to derive the patterns. Here is the technique we follow to identify chart patterns.
🎲 Only Indicator Required - Zigzag
Tradingview has plenty of free community scripts for Zigzag indicator. For this demonstration, we are going to use our Multi Timeframe Recursive Zigzag implementation.
Once the indicator is loaded on the chart, go to indicator settings and perform these modifications.
Disable the Labels : The Labels contain information that is needed for this exercise.
Set the Highlight level to 1 or 0 : We can iteratively increase the level and check next levels on the go.
You can also adjust Zigzag Length and Depth Parameters.
🎲 Scanning and Identification of valid Pattern
We can either use 5 pivots or 6 pivots for pattern identification. 5-Pivot based scanning will generate more patterns than 6-Pivot based scanning. 6 pivot patterns are geometrically more accurate however, there is no proof that 6-Pivot based patterns produce better trading outcome.
🎯 Step 1 - On each level of zigzag, mark the last 5 or 6 zigzag pivots.
Since we are using Multi Timeframe Recursive Zigzag implementation, we can gradually increase the zigzag level from 0. This means that on every level, we can check if there are any patterns.
On each level - consider only the last 5 or 6 pivots and mark them on the chart.
Markings on Level 0 would look like this for 5 and 6 pivot scanning
🎯 Step 2: Draw Trend Lines
As part of this step, draw two trend lines.
The first trend line will join pivots 1 and 5 marked in the previous step.
The second trend line will join pivots 2 and 4 marked in the previous step for 5 pivot scanning. For 6 pivot scanning, the trend line joining pivots 2 and 6 will be marked.
🎯 Step 3: Inspect the validity of trend lines
A valid trend line is the one that confirm to below two points
Touches all the alternate pivots. For example, the trend line drawn from pivot 1 to 5 should also make contact with the candle of pivot 3. In case of 6 pivot scanning, the trend drawn from pivot 2 to 6 should also make contact with the candle of pivot 4.
All the candles from the starting pivot to ending pivot of the zigzag should be confined within the trend line pairs. Meaning, no candles should completely go above the upper trend line and no candle should completely go below the lower trend line.
Please note that while verifying the above points, minor adjustments in the alignment of the trend line can be made. Start and end of the trend line does not need to be on the high/low points of the candle, it can also be placed in any of the wick positions.
After adjusting the trend lines, in both type of scanning, we can see that the trend lines confirm to the above-mentioned rules. Hence, we have arrived with valid patterns in both types of scanning on the level 0 zigzag.
🎲 Classification of Patterns
Once the patterns are identified, they need to be classified into different types. We need to apply predetermined rules to objectively classify patterns into what they are. Everyone can build their own rules.
🎯 Properties of Derived Trend Lines
Before classifying the trend lines, we need to understand below properties of the derived trend lines.
▶ Direction of Individual Trend Lines
Both the trend lines needs to be individually classified among these categories
Rising - Trend Line is sharply rising up.
Falling - Trend Line is sharply falling down.
Flat - Trend Line is flat across the pivots.
Bi-Directional - Trend Lines are moving in opposite directions
Please note that, it is less probable for trend line to absolutely flat. Hence, allow angle to have certain degree of threshold to be considered as flat. For example, +- 10 degrees can be considered as flat.
Also, the angle of the trend line can further subjective based on how compressed the chart is. It is recommended to use either log/auto-scale or a specific formula based on ATR to identify the angle.
▶ Characteristic of the Trend Line Pairs
This parameter defines how both trend lines are aligned with respect to each other. Possible options are:
Converging - Trend Lines are converging and when extended towards the right will intersect at a visible distance.
Diverging - Trend Lines are diverging from each other and when extended towards the left will intersect at a visible distance.
Parallel - Trend Lines are almost parallel to each other and may not intersect to either right or to left at a visible distance.
To objectively identify the intersection distance, we further need to use some standard. Here are few options
Fixed Number of Bars : If the trend lines do not intersect to either left or right within X bars (Lets say 100), they can be considered as parallel. Otherwise, they can be classified as converging or diverging based on which side the intersection happens.
Relative to the Length of Pattern : If the length of longest trend line is X bars. The trend lines should converge within 1–2 times the X bars to be considered as converging or diverging. Or else, it can be termed as parallel channels.
🎯 Geometrical Shapes Classification
Following are the main geometrical classifications based on the characteristics of the trend lines and the pair.
Channels - Trend Lines are parallel to each other. And hence they both move in the same directions.
Wedges - Trend Lines are either converging or diverging from each other. However, both trend lines move in the same direction. Both trend lines will be either up or down.
Triangles - Trend Lines are either converging or diverging from each other. But, unlike wedges, upper and lower trend lines will have different direction.
🎲 Types of Patterns
Once we identify the direction and characteristics of trend lines, we can go on and classify the pattern in following categories.
Details below. Please note that examples are generated programmatically.
🎯 Rising Wedge (Contracting)
Rules for Contracting Rising Wedge are as follows:
Both Trend Lines are Rising
Trend Lines are converging.
🎯 Rising Wedge (Expanding)
Rules for the Expanding Rising Wedge are as follows:
Both Trend Lines are rising
Trend Lines are diverging.
🎯 Falling Wedge (Contracting)
Rules for the Contracting Falling Wedge are as follows:
Both Trend Lines are falling
Trend Lines are contracting.
🎯 Falling Wedge (Expanding)
Rules for the Expanding Falling Wedge are as follows:
Both Trend Lines are falling
Trend Lines are diverging.
🎯 Contracting/Converging Triangle
Rules for the Contracting Triangle are as follows
The upper trend line is falling
The lower trend line is rising
Naturally, the trend lines are converging.
🎯 Rising Triangle (Contracting)
The rules for the Contracting Rising Triangle are as follows
The upper trend line is flat
The lower trend line is rising
Naturally, the trend lines are converging towards each other
🎯 Falling Triangle (Contracting)
The rules for the Contracting Falling Triangle are as follows
The upper trend line is falling
The lower trend line is flat
Naturally, the trend lines are converging towards each other
🎯 Expanding/Diverging Triangle
Rules for the Expanding Triangle are as follows
The upper trend line is rising
The lower trend line is falling
Naturally, the trend lines are diverging from each other.
🎯 Rising Triangle (Expanding)
The rules for the Expanding Rising Triangle are as follows
The upper trend line is rising
The lower trend line is flat
Naturally, the trend lines are diverging from each other
🎯 Falling Triangle (Expanding)
The rules for the Expanding Falling Triangle are as follows
The upper trend line is flat
The lower trend line is falling
Naturally, the trend lines are diverging from each other
🎯 Rising/Uptrend Channel
Rules for the Uptrend Channel are as follows
Both trend lines are rising
Trend lines are parallel to each other
🎯 Falling/Downtrend Channel
Rules for the Downtrend Channel are as follows
Both trend lines are falling
Trend lines are parallel to each other
🎯 Ranging Channel
Rules for the Ranging Channel are as follows:
Both trend lines are flat
Naturally, the trend lines are parallel to each other.
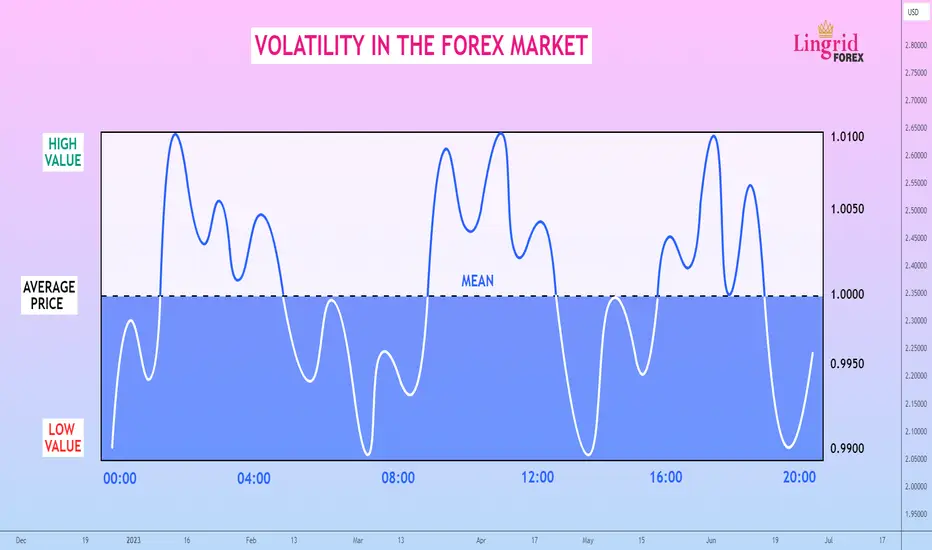
VOLATILITY IN THE FOREX MARKETHello Forex traders. Today we are going to talk about the concept of Volatility in the Forex market. We will talk about what it is, what volatility depends on, and most importantly how we can use this data to build and improve our own trading strategies and, as a result, get more profit from trading.
What Is Volatility?
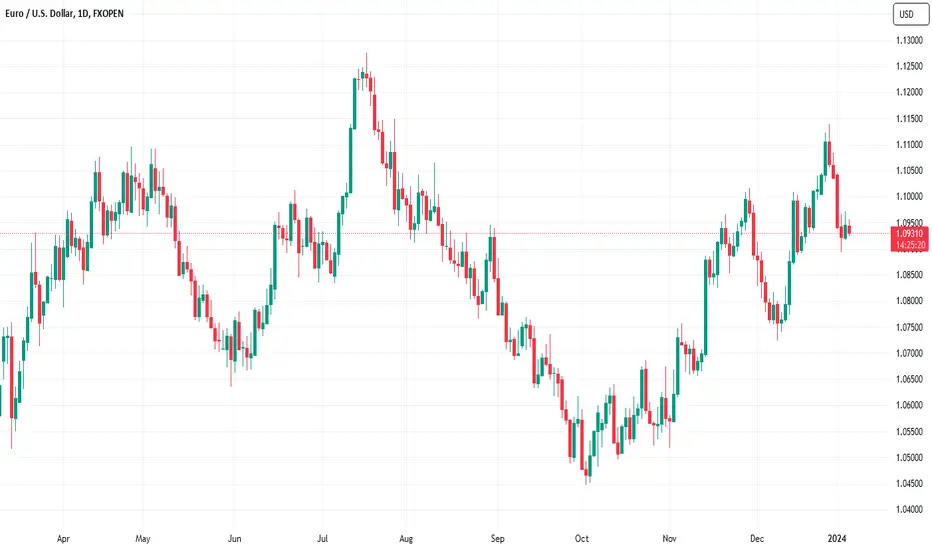
Volatility is the range of price changes from high to low during a trading day, week, or month. The higher the volatility, the higher the range during the trading time period. This is considered to be a higher risk for your positions, but it gives you more opportunities to earn money. Volatility can be measured over different time periods. If we open a daily chart and measure the distance from high to low, we will get the volatility of the day:
It turns out that on the chart above, it was 121 pips.
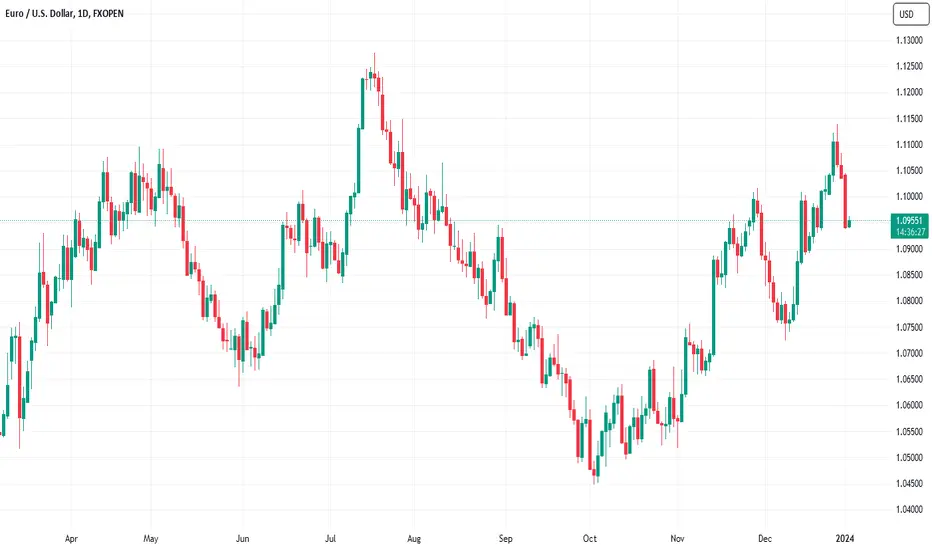
We can also measure on another timeframe, for example, weekly chart. The distance from the high point to the low point was 162 pips. The total volatility during the week was 162 points. Volatility can be measured within a trading session or within a trading hour. This allows us to conclude that it is a fractal value.
As a rule, the average volatility for the last candles is taken into account. If we take daily charts, the average volatility is usually considered for the last 10 days. Roughly speaking, the last 10 candles are summarized and divided by 10.
What Does Volatility Depend On?
It depends on the number of trades in the market, players, trading sessions, the general state of the economy of a currency, and, of course, on speculation. It depends on how speculative the market is about a given currency. Note that volatility can be measured both in points and in percent. But it should be noted that most often, the volatility of stocks is measured in percent. In forex, it is more usual to measure in pips. If you are told that the average price change of EURUSD is 0.7%, you can easily convert it into pips. And vice versa, you can calculate percentages from points if you need them for any research. Now let's move on to the most important question.
How To Apply Volatility Data For Profit?
It's actually quite simple. As they say, everyone knows about it, but no one applies it. This is especially true for intraday trading. Nobody wants to apply the simplest rule.
Suppose you know that the average volatility of GBPUSD is 120 pips. Question: if the price has moved up 100 pips from the beginning of the day, should you open a buy position? The answer is obvious, we should not. Because the probability that the price will go up another number of pips is too low. Therefore, we should not open a buy position and on the contrary, we should focus on bearish positions. But for some reason people forget about this simple technique and follow their system. I believe that it is absolutely necessary to include volatility, at least on intraday strategies, in your checklist for market entry.
The same can be done with higher timeframes. Let's imagine that we know that GBPUSD has an average weekly volatility of 200 pips. If the pair has moved 50 pips since Monday, we can expect that if the price continues to move down, there is a potential of about 150 pips. Of course, there are days when some movements become bigger or smaller, but we try to rely on statistics. With its help we can calculate the sizes of stops and take-outs. If we decided to be guided by the volatility data and open a sale on the pound, then we would try not to put a large (relative to the weekly timeframe) take profit. Because our expectation within the week is 150 pips.
If the average volatility of a pair is 200 pips, it is silly to expect 1000 pips move. At least within a week. Thus, volatility can also be used for risk calculations. If you have opened many positions on different pairs, you can calculate what will happen if all stop-losses are triggered. Of course, the market is not obliged to obey your calculations, but it gives some support for your convenience and trading.
Volatility-based Indicator
The first indicator is ATR
Average True Range indicator invented in 1972. It shows the average volatility and it is used most often to set targets and stop losses. The value of the indicator is multiplied by a multiplier and thus calculate the stop loss or and/or take profit. The calculations will automatically change depending on the current volatility.
Volatility is higher, take profit becomes higher. Volatility is smaller and take profit becomes smaller.
The next indicator is the CCI
It is based on average price and moving average data. It is used as an oscillator, that is, when it is in the oversold zone, it is recommended to buy. And when it is in the overbought zone, it is recommended to sell.
Another indicator, which is known to everyone, is Bollinger Bands
They consist of a standard moving average and a moving average plus and minus standard deviation, which is calculated based on price. These bands are used most often to determine the limits of movement from the standard average. We can draw conclusions based on this indicator about the end of the movement, correction, etc.
Conclusion
In this article I have tried to give you an understanding of what volatility is in the forex market and most importantly how we can apply it in our trading. I hope that it will help you in developing and adjusting your own trading systems.
Traders, If you liked this educational post🎓, give it a boost 🚀 and drop a comment
Fib Circles in TradingFibonacci circles, a unique tool in the trading arsenal, offer a compelling blend of technical analysis and mathematical beauty. Rooted in the Fibonacci sequence, they provide traders with a distinct perspective on market trends and potential reversal points. This article delves into the practical application of Fibonacci circles, shedding light on how they can be integrated with other trading tools for more nuanced insights.
Background on the Fibonacci Sequence and Its Application in Trading
The Fibonacci sequence, discovered by Leonardo of Pisa in the 13th century, is a series where each number is the sum of the two preceding ones, starting from 0 and 1. This sequence, 0, 1, 1, 2, 3, 5, 8, 13, 21, and so forth, holds a mathematical ratio commonly found in nature, art, and architecture. In the financial markets, these ratios, particularly the 61.8% (often referred to as the “golden ratio”), 38.2%, and 23.6%, are used in Fibonacci-based trading methods.
Traders apply these ratios to identify potential reversal levels on price charts, believing that markets might retract or extend by these Fibonacci percentages after a price movement. This belief stems from the observation that financial markets often exhibit patterns and structures that resonate with Fibonacci's mathematical harmony, leading traders to use these ratios for analysing future price movements.
Understanding Fib Circles
Using the Fibonacci sequence, circles can be created. They overlay circular arcs onto a price chart, where each arc represents a potential support or resistance level based on Fibonacci ratios. To construct a Fibonacci circle, one first identifies two significant price points, typically a high and a low. From these points, a circle is drawn, expanding outward in arcs that expand in proportion to the Fibonacci ratios.
The arcs intersect the price axis at key levels, like 38.2%, 50%, and 61.8%, suggesting areas where the market price might experience support or resistance. Extension levels, like 161.8% and 423.6%, are also commonly plotted. This tool is particularly valuable in identifying potential reversal points in market trends.
The Fibonacci spiral circle adds another dimension to analysis, though it’s a separate tool. It visually represents the natural spiral found in the Fibonacci sequence. These spirals can help traders anticipate the speed and trajectory of a price movement within the context of a broader trend.
How to Use Fib Circles in Trading
When utilising trading circles, traders often begin by selecting two significant points on the chart, such as a high and a low. In a bullish trend, this is from a recent swing high to a previous low; in a bearish trend, it’s from a recent swing low to a prior high. The distance between these points is divided by Fibonacci ratios, creating a series of concentric circles. Each represents a potential level where price action might stall or reverse.
Traders typically use these circles to gauge market sentiment and potential trend changes. When the price approaches or touches a level, many prefer to observe the market's reaction, looking for signs of support or resistance. If the price bounces off the line, it could indicate a potential reversal point.
In addition to identifying support and resistance, Fib circles can offer insights into the strength of a trend. A strong trend might see the price break through several levels, while a weakening trend could struggle to surpass them.
While Fibonacci circles can be a valuable tool, traders recognise the importance of context. Market conditions, news events, and other technical indicators are considered alongside these circles. They, therefore, are not standalone predictive tools but part of a broader analytical approach in trading.
Integrating Fib Circles with Other Technical Analysis Tools
Incorporating Fibonacci circles into a broader technical analysis framework enhances their effectiveness in trading. Traders often combine them with other tools for a more comprehensive market analysis. Head over to FXOpen’s free TickTrader platform to get started with over 1,200+ of these trading tools.
One common integration is with moving averages, which help in identifying the prevailing market trend. For example, when a Fib circle level aligns with a key moving average, it can signal a stronger potential support or resistance area.
The Relative Strength Index (RSI) is another tool that pairs well with Fibonacci circles. When the RSI shows overbought or oversold conditions and the price reaches a Fib circle level, it may indicate a higher likelihood of a price reversal.
Additionally, candlestick patterns are utilised in conjunction with Fibonacci circles to validate potential reversal signals. The presence of a bullish or bearish candlestick pattern at a key level can provide further confirmation of a trade opportunity.
Best Practices for Using Fib Circles
Using Fib circles effectively requires specific strategies. Here are some practices you may want to know:
Accurate Placement: Make sure the starting points for the Fibonacci circles are accurately placed at significant highs and lows. This accuracy is crucial for relevant support and resistance levels.
Context Consideration: It’s best to use Fib circles in conjunction with overall market trends and patterns. They aren’t the only consideration when entering a trade.
Confirmation: Wait for price action confirmation when the price reaches a notable level. Candlestick patterns or other indicators can support the potential reversal or continuation.
Adjustment and Flexibility: Be prepared to adjust the circles as new highs and lows form. Market dynamics are constantly evolving, and flexibility is key.
Conservative Use in High Volatility: During periods of high market volatility, it’s a good idea to be more conservative in interpreting Fib circles, as price swings can be erratic and less predictable.
The Bottom Line
In conclusion, mastering Fibonacci circles can greatly enhance your market analysis. These tools, when used effectively, offer deeper insights into market trends and potential reversals. For traders looking to apply these strategies in real-time markets, opening an FXOpen account can be a valuable step. We provide high-speed execution and tight spreads to put these techniques into practice and refine your trading skills. Happy trading!
This article represents the opinion of the Companies operating under the FXOpen brand only. It is not to be construed as an offer, solicitation, or recommendation with respect to products and services provided by the Companies operating under the FXOpen brand, nor is it to be considered financial advice.
Very basic understanding of support and resistance areas (2 min)In trading, support and resistance are key concepts that help traders analyze price movements and make informed decisions. Here's a basic explanation:
Support:
Definition: Support is a price level at which a financial instrument (like a stock, currency pair, or commodity) tends to stop falling and may even bounce back up due to buyers.
Analogy: Think of support like a floor that prevents the price from falling further. It's a level where buyers are more inclined to enter the market, seeing the current price as attractive.
Resistance:
Definition: Resistance is a price level at which a financial instrument tends to stop rising and may face difficulty moving higher due to seller pressure.
Analogy: Picture resistance as a ceiling that prevents the price from going higher. It's a level where sellers may be more active, considering the current price as too high.
In summary, support and resistance are like psychological levels in the market where buying and selling interest tends to cluster. Traders use these levels to make decisions about when to enter or exit trades, set stop-loss orders, or identify potential trend reversals. When the price approaches support, traders may look for buying opportunities, while at resistance, they may consider selling or taking profits.

Strategies for Those Who Trade the EuroNavigating the currency markets can be complex, but arming oneself with simple euro trading strategies can provide a clear path through the volatility. This article unpacks straightforward methods designed specifically for trading the euro, offering clarity and practical steps for both novice and seasoned traders looking to refine their approach to this currency.
Understanding the Euro Market
The euro occupies a central role in the global financial system, functioning as the primary currency for the Eurozone – an economic region encompassing numerous European countries. For those aiming to learn forex trading strategies, grasping the dynamics of the euro market is pivotal.
The EUR/USD pair, particularly, is a favourite among traders due to its liquidity and the volume of economic data available for analysis. Trading this pair requires an understanding of the broader economic indicators that influence its volatility, such as interest rate decisions, employment statistics, and political events within Europe. EUR/USD trading strategies often hinge on these indicators, guiding traders to forecast potential price movements.
To gain the best understanding of the strategies below, consider following along in FXOpen’s free TickTrader platform. There, you’ll find all of the tools and charts necessary to put these strategies to the test.
Pullback Trading With EMA Confirmation
In the realm of currency trading strategies, the pullback strategy with EMA confirmation stands out as a potent method. This approach involves identifying the market trend through higher highs (HH) and higher lows (HL), or the opposite for a downtrend, and anticipating a pullback – a temporary reversal of the prevailing trend. Traders typically employ two key Exponential Moving Averages (EMAs) – the 9-period (blue) and the 21-period (red) – to signal the trend's resumption on an hourly chart.
Entry
Traders may consider entering a position when the 9-period EMA crosses above the 21-period EMA in an uptrend or below in a downtrend. Confirmation of trend continuation through price action is often awaited before execution.
Stop Loss
Many set stop losses beyond a significant swing point, a level that, if breached, would suggest the prevailing trend has been invalidated. Alternatively, some may implement a trailing stop loss, adjusted to follow price movements by sitting below swing points in an uptrend or above in a downtrend.
Take Profit
Profit targets are often established in support or resistance areas.
The rationale behind this strategy lies in its blend of trend-following and momentum. By waiting for a pullback and EMA crossover, traders filter out minor price fluctuations, engaging only when the trend shows signs of continuation. This method aims to capitalise on the natural ebb and flow of market movements while maintaining a disciplined approach to risk management.
Breakouts at Support/Resistance With Engulfing Candles
Spotting breakouts at key support or resistance levels combined with the appearance of engulfing candles is often a cornerstone of potentially profitable forex trading strategies. This method revolves around the keen observation of price consolidation within a discernible range, as traders anticipate a potential breakout signalling a reversal – ideal for day trading EUR/USD.
An engulfing candle, which fully encompasses the range of the previous candle, acts as a robust indicator for many traders. This candle pattern suggests a strong shift in market sentiment. When it occurs at a significant level of support or resistance, the implication is that the market may be setting up for a compelling move.
Entry
Traders might consider a position when an engulfing candle forms at a consolidation point, indicating a breakout. The preference is for the trade to be in the direction of the engulfing candle – bullish or bearish.
Stop Loss
Stop losses are frequently placed just beyond the opposite end of the range or the support/resistance level.
Take Profit
Profits are often targeted at the next substantial support or resistance level, where a reversal could be anticipated.
The rationale for this strategy lies in the combination of price action and candlestick analysis. Engulfing candles at support or resistance levels represents a clear narrative of market dynamics: a struggle between buyers and sellers resolved by a sudden, decisive victory for one side. By entering after such a signal, traders are banking on the momentum generated by the breakout, aiming to ride the wave of renewed market conviction.
Parabolic SAR With ADX
The combination of Parabolic Stop and Reverse (SAR) with the Average Directional Index (ADX) can form the basis of a dynamic strategy especially suited to scalping EUR/USD, where quick, precise trades capitalise on small price movements.
With both indicators set to their default parameters, the ADX serves as a filter to gauge the strength of a trend. A reading above 25 is typically indicative of a strong trend, at which point traders might look to the Parabolic SAR for direction. Entry into the market aligns with the direction of the Parabolic SAR, but only when the ADX confirms the trend's vigour.
Entry
Traders may decide to enter trades in the direction suggested by the Parabolic SAR when the ADX crosses above 25, signalling a strong trend. If the ADX is already above 25 and the Parabolic SAR flips, indicating a new trend direction, this could also prompt an entry.
Stop Loss
Stop losses are often positioned above or below the candle that aligns with the first dot of the SAR indicator to protect against sudden changes in trend or at a nearby swing point.
Take Profit
Taking profits is typically considered when the Parabolic SAR indicates a potential change in the trend's direction.
This strategy effectively harnesses the strength of trend momentum, as confirmed by the ADX, while utilising the Parabolic SAR for precise entry and exit points. In the fast-paced scalping environment, where the EUR/USD can exhibit swift movements, this method provides a structured yet responsive approach. It leverages the inherent market rhythm, enabling traders to make quick decisions with the confidence that comes from a dual-indicator system.
The Bottom Line
In conclusion, these simple euro trading strategies are just a few ways to trade the forex markets. As you apply these methods, consider the advantages of trading with a seasoned broker. By choosing to open an FXOpen account, you gain access to a platform where precision and strategy come together, setting the stage to enhance your trading experience with the euro. Good luck!
This article represents the opinion of the Companies operating under the FXOpen brand only. It is not to be construed as an offer, solicitation, or recommendation with respect to products and services provided by the Companies operating under the FXOpen brand, nor is it to be considered financial advice.
Educational: A case for low volatility 🔹 INTRODUCTION
A prevalent saying in the trading world is that you need high volatility to make money in the markets. However, this statement needs to be more accurate. While high volatility is, in fact, necessary, it is very much based on perspective, and there are many cases where an extremely volatile market will be your downfall.
🔹 UNDERSTANDING THE ISSUE
The image above is an example of what a highly volatile market looks like. There are substantial moves and constant reversals. If you trade using traditional methods such as trend following, the majority will struggle to earn, executing in highly volatile markets.
In highly volatile markets, the odds of reaching your profit target drop significantly, and this is because the market could reverse at any time. You will also often hear that scalpers strive in these kinds of markets, which is very much possible, but this is because scalpers often trade at a negative risk ratio and take small gains from the markets. As a result, they can capitalize on those significant moves. See the image below.
However, what is happening within that highly volatile candle? One would be surprised to know that the market is not volatile within that candle on a lower timeframe. The market was very smooth and very consistent in its behavior.
Notice how the trend was very clear on the lower timeframe? Moreover, there are rarely any large spikes. Well, that is also low volatility, which brings us to another misconception between high and low volatility. Many people are under the assumption that low volatility means the market is not moving much. This is not the case. The market could be moving a lot; however, due to each move being consistent, it is considered low volatility. In other words, there is little variability in the movements. Each candle is within the same range of percentage change.
Notice how there are usually no large spikes in the low volatility charts? As long as that does not happen, trending markets can also be considered low volatility.
🔹SOLUTION
So, with all this understanding, how does one use high and low volatility to one's advantage? Well, at this point, it is clear. What anyone wants to do is use high volatility to enter the market is going to trend. So, we want to establish high volatility from a much higher timeframe. By doing this, we ensure that the market will trend significantly on a lower timeframe. What we then do is go to a much lower timeframe and execute within that volatility to catch extremely large moves in the market. Often, this will be within a single highly volatile candle. See the image below.

Thinking in Pine - Time Series Special CasesHello Everyone,
Welcome back to "Thinking in Pine" short video series. In this session, we have discussed few special cases of time series variables and using historical operator within local scope.
If you have not watched our previous video - "Thinking in Pine - Time Series" , request you to do that before continuing this video.
🎲 Summary of our today's discussion
How historical operator works for variables defined inside an conditional block
How historical operator works for variables defined in a loop.
🎯 Example Program Used
// Time series for variables within a condition
varip showLogInLoop = true
if(bar_index%3 == 0)
specialBarIndex = bar_index
if(bar_index > last_bar_index-3 and showLogInLoop)
log.info('Current and Previous special bar index are : {0} and {1}', specialBarIndex, specialBarIndex )
showLogInLoop := false
// Time series of variables within a loop
arrayOfX = array.new()
arrayOfLastX = array.new()
for i = 1 to 5
x = i*10
arrayOfX.push(x)
arrayOfLastX.push(x )
if(barstate.islastconfirmedhistory)
log.info('Array of X : {0}', arrayOfX)
log.info('Array of last X : {0}', arrayOfLastX)
🎲 References:
Pine Script® User Manual - Execution Model
Pine Script® User Manual - Time Series
Pine Script® User Manual - History Referencing Operator
Pine Script® Reference Manual - History Referencing Operator

Thinking in Pine - var, varip and regular variablesThis is our first video session on "Thinking in Pine" series. Before we start, we want to explain a bit about our new initiative.
🎲 What is "Thinking in Pine"?
In our journey to empower the trading community, we're excited to introduce "Thinking in Pine," a series of concise, 5-10 minute videos dedicated to unraveling the complexities of Pine Script®. We have our own list of topics to be covered, and we will start releasing the videos one by one. However, if you're grappling with any aspect of Pine Script® or stuck on an implementation, we encourage you to reach out to us or drop a comment here. We aim to address your queries by breaking down challenging concepts or implementations into easily digestible content.
What kind of videos are covered in "Thinking in Pine"?
Pine Script® Focus: We try to keep our focus on Pine Script® concepts and implementations.
General Utility: We prioritize topics that offer broader learning value. Though it's challenging to quantify this, we'll use our judgment to select topics that benefit the wider audience.
Time-Efficient Demonstrations: Ideally, we want to keep our demonstrations to 5–10 mins of time.
We're here to demystify Pine Script®, one topic at a time, making it accessible for everyone from beginners to advanced users. Stay tuned for insightful sessions with "Thinking in Pine"!
🎲 Demonstrating var, varip and regular variables in Pine Script®
In this video, we have demonstrated the difference between var, varip and regular variables by using an example implementation of OBV indicator.
🎯 Logic of OBV Calculation
Start with the value 0
On each bar, add volume to the indicator if close price is higher than previous bar close price.
On each bar, remove volume from the indicator is close price is lesser than previous bar close price
🎯 Highlights
Regular variables are initialized separately on each bar and does not propagate value to next bar unless coded to do it.
var variables are initialized once and then can be reassigned any number of times using := operator . The variables declared as var will propagate the current values to the next bar.
varip variables are initialized once and then can be reassigned any number of times using := operator . varip will behave similar to var on historical bars. However, on real time bars, they are recalculated on every tick, and they remember the state of each tick.
🎯 Example Program Used
Here is the example program used in the demonstration.
//Plot built-in OBV value for reference
plot(ta.obv, "OBV Built In", color=color.yellow)
//Volume multiplied by +-1 based on change in close price compared to previous bar.
volumeBySign = math.sign(nz(ta.change(close), 0))*volume
//Obv calculation by using regular variable. Code need to access and add last bar value using obvByRegular
obvByRegular = 0.0
obvByRegular += nz(obvByRegular , 0) + volumeBySign
plot(obvByRegular, "OBV By Regular Variable", color=color.blue)
//Obv calculation using var variable. Since var variables propagate values to next bar,
// we do not need to use historical operator to get the last bar value
var obvByVar = 0.0
obvByVar += volumeBySign
plot(obvByVar, "OBV by var Variable", color = color.maroon)
//Obv implementation using varip. The OBV is calculated based on every tick. Histoical values will match the same as that of other implementation.
//However, in real time, the calculations are done based on the tick values
varip obvByVarip = 0.0
varip lastPrice = close
varip lastVolume = volume
if(barstate.isnew)
lastVolume := 0
obvByVarip += math.sign(close-lastPrice)*(volume-lastVolume)
lastPrice := close
lastVolume := volume
plot(obvByVarip, "OBV by varip Variable", color = color.purple)
🎲 References:
Pine Script® User Manual - Variable declarations
Pine Script® Reference Manual - var
Pine Script® Reference Manual - varip
Pine Script® User Manual - Operators

Full Time Trading. Everything You Need to Know
Once you mature in trading and become a consistently profitable trader, the question arises: are you ready to trade full time?
Becoming a full time trade is a very significant step and my things must be taken into consideration before you make it.
✨ Becoming a full time trader implies that you quit your current job, that you give up a stable income - your salary.
In contrast to classic job, trading does not give guarantees . Please, realize that such a thing as stable income does not exist in trading.
Trading is a series of winning and losing trades, positive and negative periods. For that reasons, remember that in order to become a full time trader, your average monthly trading income must be at least twice as your monthly expenses.
✨ Moreover, even if your trading income is sufficient to cover two months of your life, that is still not enough. You must have savings.
Trading for more than 9 years, I faced with quite prolonged negative periods. One time I was below zero for the entire quarter.
For that reason, supporting a family and living a decent life will require savings that will help you not to sink during the losing periods.
✨ Another very important sign is your correct and objective view on your trading. Please, realize that if you bought Bitcoin one time and made a couple of thousands of dollars, it does not make you a consistently profitable trader.
Please, do not confuse luck with the skill. Your trading must be proven by many years of trading.
✨ You must be emotionally prepared for the living conditions that full time trading will bring you.
Being a full time trader implies that you are constantly at home,
you work from home from Monday to Friday.
You do not see your colleagues, your social life will change dramatically.
I know a lot of people who started to trade full time and then realized that they can not work from home for different reasons.
⭐️ So what are the necessary conditions for becoming a full time traders:
you should have savings that will cover the negative trading periods,
your average monthly trading income should be at least twice as your monthly expenses,
your trading efficiency must be proven by objective, consistent results,
and you must be psychologically prepared for working from home.
When these conditions are met, you can make a significant step and become a full-time trader.
Are you ready?
❤️Please, support my work with like, thank you!❤️

Harnessing Harmonics Part 1: The Measured MoveWelcome to this two-part series on Harmonics! In this first instalment, we'll delve into the foundational concept of the Measured Move using the ABCD pattern. Understanding this essential structure lays the groundwork for precise trading decisions based on harmonic principles.
Introducing the ABCD Pattern
Price action in any market and on all timeframes tends to move from periods of imbalance in supply and demand to periods of equilibrium. This ebb and flow of price discovery is reflected in the ABCD price pattern – a foundational pattern in harmonics which is an area of technical analysis that seeks to utilise the current volatility of a market to predict turning points.
The ABCD pattern illustrates the ‘impulse, retracement, impulse’ nature of trending price action, it consists of three legs:
AB: The initial leg of the move
BC: A corrective phase following AB
CD: The leg that mirrors AB in direction approx. magnitude
Harmonic ABCD Pattern:
Past performance is not a reliable indicator of future results
What is a Measured Move?
The core principle behind the ABCD pattern is that the best approximation of the next phase of directional price movement is the magnitude of the last phase of directional price action. In other words, the best predictor of CD is AB.
A Measured Move is generated by identifying when an AB leg has formed and transposing this AB leg onto the corrective phase at BC.
Understanding the Measured Move within the ABCD pattern serves as a cornerstone for traders seeking to employ harmonic analysis techniques to anticipate market movements with precision.
Measured Move Approximations:
Past performance is not a reliable indicator of future results
How to Use the Measured Move:
The Measured Move is a simple concept but can be very powerful when harnessed correctly. In a world in which the vast majority of technical indicators are lagging in nature, the Measured Move is a forward-looking indicator that is calibrated the volatility of each individual market.
Here are the two cleanest ways to utilise Measured Moves in your trading:
1. Dynamic Profit Target:
Utilise the Measured Move as a dynamic profit target mechanism. Once the initial trend (AB leg) is established, projecting the potential length of the subsequent move (CD leg) provides a quantifiable target for profit-taking. This aids traders in securing gains while the trend continues its momentum.
Benefits:
Offers a clear and predefined target for profit-taking, aiding in trade management.
Can help traders to focus on the trade setups with the most attractive levels of risk-to-reward.
Additional Tips and Tricks:
Confirm the Measured Move target with other technical indicators or patterns for stronger validation.
Adjust trade size and risk exposure according to the projected target to optimise risk management.
Measured Move Profit Target Example:
In the following example, EUR/USD puts in a clear directional move lower which breaks support – forming an AB leg. The market then undergoes a choppy period of retracement – forming our BC leg.
A trend continuation trade setup in which EUR/USD is shorted can then be initiated and a profit target can be generated using a Measured Move (CD) which is generated by transposing AB onto BC.
Part 1: EUR/USD Daily Candle Chart
Past performance is not a reliable indicator of future results
Play if forward (see part 2 below) and we can see that the market comfortably hits the harmonic measured move target and forms a short-term bottom around the harmonic target zone.
Part 2: EUR/USD Daily Candle Chart
Past performance is not a reliable indicator of future results
2. Reversal Zone:
The Measured Move can be used to identify areas where price action may stall or reverse direction. When the CD leg completes near the projected Measured Move level, it serves as a signal for potential trend reversal, providing an opportunity to enter trades in the opposite direction.
Benefits:
Pinpoints potential reversal points, allowing for strategic entry into new trends.
Provides an early indication of trend exhaustion or change in direction.
Additional Tips and Tricks:
Combine the Measured Move analysis with horizontal levels of support and resistance.
Combine with reversal candlestick patterns.
Example 1: FTSE Completes Measured Move into Resistance
In the following example, the FTSE completes a harmonic Measured Move into a clear area of horizontal resistance. Notice how a series of reversal candles form near the harmonic completion zone.
FTSE 100 Daily Candle Chart
Past performance is not a reliable indicator of future results
Example 2: Gold Completes Measured Move into Resistance
Here’s a recent example of a harmonic Measured Move completion in the gold market. Notice how this completion occurs at a key level of resistance and a large bearish engulfing candle forms upon completion.
Gold Daily Candle Chart
Past performance is not a reliable indicator of future results
Summary:
By integrating the Measured Move technique into your trading strategy, you gain a structured approach to both profit-taking on trend continuations and identifying potential reversal areas. This methodical application of harmonic principles aids in enhancing trade precision and confidence.
In Part 2 we'll explore advanced harmonic concepts building upon this foundation.
Disclaimer: This is for information and learning purposes only. The information provided does not constitute investment advice nor take into account the individual financial circumstances or objectives of any investor. Any information that may be provided relating to past performance is not a reliable indicator of future results or performance. Social media channels are not relevant for UK residents.
Spread bets and CFDs are complex instruments and come with a high risk of losing money rapidly due to leverage. 75% of retail investor accounts lose money when trading spread bets and CFDs with this provider. You should consider whether you understand how spread bets and CFDs work and whether you can afford to take the high risk of losing your money.
Navigating the Markets with Fibonacci ChannelsToday we delve into the fascinating world of Fibonacci Channels, a powerful tool for traders looking to identify potential non-horizontal support and resistance levels in the market.
Throughout the video, we provide a step-by-step guide on how to place Fibonacci Channels on price charts, allowing you to visualize and understand their significance in identifying key price levels. We also showcase real-world examples to demonstrate how Fibonacci Channels can be used to find points of interest, such as trend reversals and price targets.
Furthermore, we discuss the integration of Fibonacci Channels with other technical indicators, providing insights into how this combination can enhance your trading strategy. By the end of this video, you will have a comprehensive understanding of Fibonacci Channels and the ability to confidently incorporate them into your trading approach. Get ready to unlock the potential of Fibonacci Channels and take your trading skills to the next level!

Live stream - End of year updateHappy Holidays and here's a little summary of the market - Bitcoin and Forex

Live stream - Candlestick Analysis for Dynamic Scalping and Day The FX Evolution team are back with an advanced session! They're talking Multi-Time Frame Analysis for precise entry and exit decisions in both scalping and day trading scenarios, Candlestick Pattern Combinations & Volume Analysis with Candlesticks.

Technical vs. Fundamental Analysis: Finding a BalanceLooking to make more holistic investment decisions, but not sure how? Understanding the difference between technical and fundamental analysis and how to incorporate both is an essential step to accomplishing holistic investing. Today we will explore how finding a balance between these pillars of trading can help you navigate the complex world of investing.
The Importance of Finding a Balance
Finding the right balance between technical and fundamental analysis can be the key to successful investing. By combining the two approaches, traders gain a comprehensive understanding of a stock's potential, taking into consideration both the short-term market trends and the long-term value.
When it comes to investing, it's important to have a complete view of the market. Relying solely on technical analysis may leave you susceptible to missing out on crucial information about a company's financial health and growth prospects. Similarly, relying purely on fundamental analysis may cause you to overlook short-term market trends that could impact the stock's price in the near future, potentially leading to poor entries and exits.
A balanced approach allows you to leverage the strengths of both technical and fundamental analysis, providing you with a more complete picture of the investment opportunity at hand. So, whether you're a short-term trader or a long-term investor, finding the sweet spot between technical and fundamental analysis can help maximize your chances of making a profitable investment.
Understanding Technical Analysis
Technical analysis focuses on analyzing historical price and volume data to predict future price movements. Traders using this approach often rely on chart patterns, indicators, and trendlines to identify buy and sell signals.
Chart patterns, such as triangles, head and shoulders, and double tops/bottoms, provide insights into potential price reversals or continuations. These patterns are formed as a result of the collective actions of market participants and can signal impending price movements. However, when using price patterns it is critical to understand the statistical odds of success for completion of the pattern. Price patterns can be subjective to the trader's skill and overall directional bias, so traders should combine price patterns with other forms of technical analysis.
Indicators, such as moving averages, Relative Strength Index (RSI), and Bollinger Bands, help traders identify overbought or oversold conditions, measure the strength of a trend, and spot potential entry or exit points. When indicators are combined to form a robust and complementary system traders gain a wealth of information about the near-term health of an underlying asset. It is critical to note that no indicator system is perfect and will not guarantee you a 100% success rate. However, when paired with proper risk mitigation, psychology, and supporting forms of technical analysis, using indicators can lead to long-term success.
Trendlines are used to analyze the direction and strength of a stock's price movement. Drawing trend lines connecting the highs or lows of a stock's price can help identify support and resistance levels, price channels, and potential trend reversal areas.
Support and resistance zones are price levels on a chart that indicates where trends are likely to pause or reverse. Support is a zone where a downtrend pauses due to demand, while resistance is a zone where an uptrend pauses due to supply. These zones are based on market sentiment and human psychology, shaped by emotions such as fear, greed, and herd instinct. Traders tend to congregate near these zones, strengthening them. Support levels indicate a surplus of buyers, while resistance levels indicate a surplus of sellers. It's important to note that these levels are not exact numbers but rather "zones" that can be tested by the market.
Understanding how these tools work and how to interpret their signals is crucial for technical analysis. It allows traders to make intuitive decisions based on historical price patterns and market dynamics. However, it's important to note that technical analysis has its limitations.
Limitations of Technical Analysis
While technical analysis can provide valuable insights into a stock's potential price movements, it's important to recognize its limitations. Technical analysis is primarily focused on historical data and patterns, which may not always accurately predict future price movements.
Market sentiment, news events, and other external factors can significantly impact a stock's price, often rendering technical analysis less effective. If you don't believe me, just look at the price charts for the last four years. Try to pinpoint major world or domestic events such as the start of the pandemic or the Fed's hawkish shift. Additionally, technical analysis does not take into account the intrinsic value of a company, which is a key consideration in fundamental analysis.
Therefore, relying solely on technical analysis to make investment decisions may leave you vulnerable to market uncertainties and potential pitfalls. This is where fundamental analysis comes into play.
Understanding Fundamental Analysis
Fundamental analysis involves examining a company's financials, industry trends, and market conditions to determine its intrinsic value. Investors who lean towards fundamental analysis believe that a company's true worth is reflected in its financial strength and growth potential.
Key factors considered in fundamental analysis include a company's revenue and earnings growth, profit margins, debt levels, competitive positioning, and management team. By analyzing these factors, investors can assess whether a company is undervalued or overvalued, and make investment decisions accordingly. Most, if not all of this information is readily available on the internet, but it can take some digging to find all the information one would need. There is also a wide range of financial-related indicators readily available on TradingView.
Fundamental analysis also takes into account macroeconomic factors, such as interest rates, inflation, and government policies, which can impact the overall market and the performance of individual stocks.
How to Conduct Fundamental Analysis
Conducting fundamental analysis involves a thorough examination of a company's financial statements, such as its income statement, balance sheet, and cash flow statement. These statements provide insights into a company's revenue, expenses, assets, liabilities, and cash flows.
Analyzing financial ratios, such as the price-to-earnings (P/E) ratio, return on equity (ROE), and debt-to-equity ratio, helps investors assess a company's financial health and profitability. Much of this information is available on TradingView under the financials tab. TradingView has done an excellent job of making a majority of the aforementioned financial data available, right at your fingertips.
Industry analysis is another important aspect of fundamental analysis. Understanding the industry dynamics, competitive landscape, and market trends can provide insights into a company's growth potential and its ability to outperform its peers. There is a plethora of this information online, and diligence in your research will make a world of difference.
By combining financial analysis with industry analysis, investors can gain a deeper understanding of a company's overall prospects and make more informed investment decisions.
Finding a Balance Between Technical and Fundamental Analysis
Finding the right balance between technical and fundamental analysis requires a thoughtful approach. Here are some strategies to help you integrate the two approaches:
Start with fundamental analysis: Begin by analyzing a company's financials and industry trends to assess its long-term growth potential. This will provide you with a solid foundation for your investment decisions.
Use technical analysis for timing: Once you've identified a promising investment opportunity based on fundamental analysis, use technical analysis to refine your entry and exit points. Technical indicators and chart patterns can help you identify optimal times to buy or sell a stock.
Consider the bigger picture: While technical analysis focuses on short-term market trends, it's important to consider the long-term value of a company. Evaluate the fundamental factors that can impact a company's growth potential and use technical analysis as a tool to validate your investment thesis.
Keep an eye on market sentiment: Market sentiment can influence stock prices in the short term. By staying informed about news events, economic indicators, and market trends, you can better understand the context in which technical and fundamental analysis are operating.
By finding a balance between technical and fundamental analysis, you can better manage your investment decisions that take into account both short-term market dynamics and long-term value. This balanced approach can help you navigate the complex world of investing and maximize your chances of success.
In conclusion, understanding the difference between technical and fundamental analysis is crucial for making theoretically sound investment decisions. By finding a balance between the two approaches, you can gain a comprehensive understanding of a stock's potential, considering both the short-term market trends and the long-term value. So, whether you're a short-term trader or a long-term investor, incorporating both technical and fundamental analysis can help provide a better view and maximize your chances of making profitable investment decisions.
Happy Trading!

7 Forex Trading Tips (To help you be successful in 2024)7 Tips for all Forex Traders (to succeed in 2024)
So many new traders come into with an expectation of quickly becoming a millionaire. They soon learn that making money from trading isn’t as simple as just placing trades and collecting profits. They need some forex trading tips that can help them to succeed in the market. If they get these useful tips and combine them with a good and hard work there’s a chance that they can become successful as a forex trader. If this sounds like something, you’d like keep reading. This article will give you 7 forex trading tips that can help you improve forex trading results.
Many new traders look to this scalping type of trading where positions are held for a short time, usually less than a day. This type of trading has become so popular because it is also considered as a way to deliver quick profits to a trader’s account. Understanding the dangers of short-term trading are also important. Short-term forex trades typically make far less on each trade, but the higher frequency of trades makes up for this, and at the end of the day this trading style can deliver a good number of . You will choose between short-term forex trading and long-term forex trading at some point in trading career. Whether you stay with the short-term trading or switch to long term trading will be determined by your own and style.
The following forex trading tips are meant to help you control your risk and manage your money effectively. Hopefully these 7 forex trading tips will help you become a better trader, in 2024.
1) Understand your own personality and trading style
It might seem like obvious advice, but knowing your own personality and trading style is much easier said than done. We all have our own personality and goals, and we all have our own unique approach to the markets and trading. You need to know what your personality and approach is if you want to be a successful forex trader.
While some traders are most comfortable with small, safe positions, others love to swing for the fences with the riskiest, but potentially most profitable, trades. Which way is yours?
Also think about whether you like to be a follower who might work well with a trend following approach. Or maybe you like to go against the crowd and are always looking for a different way to approach things. This personality type often does well as a contrarian trader. You don’t need to figure this all out right now, but you should keep it in mind.
2) Choose your Best Broker
You already know there are literally hundreds of brokers you can choose from, and each one is different in some ways. Some focus on specific asset types, while others may work best for broad approach. There are brokers for and others for pro traders. Do you need automatic broker ? Is the regulation of a broker important to you? Ask yourself these questions before choosing a broker.
3) Learn and Practice Several Trading Strategies
If you want to make forex trading a career you should want to become an expert forex trader. That means learning and mastering multiple professional trading strategies. Just as a lawyer will have a different approach to traffic court versus civil court, so you need to have a different approach to different market conditions.
Having several trading strategies at your disposal gives you a broader look and understanding of the market. It also gives you the option of having the best trading strategy no matter how market conditions change.
4) Start Broad and Finish Narrow when analyzing charts
Always begin your analysis from the higher timeframes. Looking at the weekly and daily chart will give you the big picture and long-term trends. From there you can drill down to the 4-hour, 1-hour, or shorter time frames. Once you know the long-term trend you can use the short-term charts to find short-term opportunities in the same direction as the broader market trends.
There’s truth to the old saying that “The trend is your friend.”
5) Always Have a Trading Plan
There’s a saying that goes “Fail to plan, plan to fail” and it is appropriate for forex traders to keep it in mind. Trading plan is what will tell you when to enter and exit your position, the profit target, how much risk you’ll be willing to accept, and everything else regarding trade. It will keep you from getting too fearful or greedy, and should prevent emotional decision making.
In all honesty having a trading plan is one of the most important tips, and it should probably be at the top of this list. And the key is not just to have a plan, but to follow it religiously, and to take the time to analyze how well it performs so you know when changes might be needed.
6) Protect your Capital by Managing your Risk on every trade
Protecting your capital is what will keep you in the trading game when others have been thrown out by their own careless risk taking behavior. Remember that the market will always be there for another day and another trade, and you want to be sure you have capital to take advantage of that in your trading adventures.
This means always calculating your risk on any trade, and knowing when to enter and when to take a day off. Volatility is good, but not if it increases your risk to the point that you blow up your account. Also be sure to always use stop losses to protect from unforeseen moves.
7) Price action on charts (not feelings)/Never stop learning
You might be thinking this is basic, but too many traders fall into the trap of trading on emotions and hunches rather than facts. Always trade what the market shows, not what you hope to see. Wait for your trade setup and avoid trading based on emotions. Two things you can do to help ensure you are trading with facts and not emotions is to have a clear trading plan that you’re following at all times, and to keep a detailed journal of trades.
The forex market is one of the most complex financial systems ever created, and no one will ever know all there is to know about it, especially since market conditions are always changing. This makes it crucial for you to always be learning. Because the forex market is ever-changing you need to understand that what worked yesterday won’t necessarily work today. And when your strategy stops working it would be good to have the knowledge to know why it’s stopped working, and how to fix it.
Always look to try new strategies, find new ways to research the market, master technical tools and your fundamental analyzing strategies. Last of all, keep an eye on evolving technologies like auto-trading, back-testing software, and new technical trading indicators. Each might have a place in your future trading plans.
Fibonacci Retracement StrategiesFibonacci retracements are a cornerstone in the toolkit of many traders, offering a mathematical approach to identifying potential areas where reversals may occur. This article delves into the intricacies of using Fibonacci retracements, covering everything from basic understanding to strategies involving other indicators. Read on to gain insights into how to effectively incorporate these levels into your trading strategy.
What Are Fibonacci Retracements?
Fibonacci retracements are a popular technical analysis tool used to identify potential support and resistance levels on a chart. Developed around the concept of the Fibonacci sequence—a series of numbers where each number is the sum of the two preceding ones—the Fibonacci indicator applies this mathematical formula to financial markets.
Key retracement levels are often considered at 38.2%, 50%, and 61.8% of a price move. The 61.8% level, in particular, is frequently referred to as the Fibonacci retracement golden ratio, owing to its significance in both nature and financial markets. Traders commonly use these areas to anticipate where the price may reverse, thus providing strategic entry and exit points.
Fibonacci Retracements: How to Use Them
Using the Fibonacci tool for trading begins with identifying a significant swing, either an uptrend or a downtrend, on the chart. The tool is then applied at the swing low and swing high of the price movement. In an uptrend, it starts at the swing low and ends at the swing high; in a downtrend, it's the opposite. This action plots horizontal lines at the key Fibonacci levels, providing potential areas where price could reverse.
Concerning the Fibonacci retracement time frame, it's essential to know that this tool can be applied across various time frames—from one-minute charts to monthly charts. However, the reliability of the retracement levels often increases on higher time frames. That means those plotted on daily or weekly charts generally offer stronger support or resistance compared to those on shorter time frames.
Strategies Using Fibonacci Retracements
In trading, combining Fibonacci retracements with other technical indicators can significantly enhance decision-making. Below are three distinct strategies that utilise these retracements in conjunction with other tools to identify high-probability trade setups.
To see how they work, consider following along in FXOpen’s free TickTrader platform. There, you’ll gain access to over 1,200 trading tools—including the ones featured in this article.
Fibonacci Retracement with Moving Average Crossover
In this Fibonacci trading strategy, traders combine Fibonacci retracements with two Exponential Moving Averages (EMAs) set to 9 and 12 periods to pinpoint entry and exit points. After identifying a trend, either bullish or bearish, they apply the retracement tool to gauge potential reversal zones. Specifically, the focus is on the 38.2%, 50%, and 61.8% retracement levels. If the price reacts at any of these zones—potentially confirmed by a bullish or bearish candlestick pattern—the next step is to observe the EMA indicators.
Entry
Traders often watch for a moving average crossover in the direction of the existing trend as an indication of potential entry.
Stop Loss
Stop losses may be placed above or below the nearest swing high or low. Alternatively, some opt for setting it beyond the next level, including 23.6% or 78.6%.
Take Profit
Profits are typically taken at the high or low of the retracement zone where the price initially reacted.
Fibonacci Retracement with Stochastic Oscillator
In this Fibonacci retracement strategy, the initial setup is similar to the one involving moving averages: traders identify a prevailing trend and apply Fibonacci retracements to find possible reversal zones at 38.2%, 50%, and 61.8%. The twist here is the use of the Stochastic Oscillator, a momentum indicator that ranges between 0 and 100. The oscillator helps identify overbought or oversold conditions when the price reaches these areas.
Entry
Traders generally look for the Stochastic Oscillator to exceed 80 (overbought) or drop below 20 (oversold) when the price reaches one of these Fibonacci zones. The entry signal often comes when the oscillator crosses back below 80 or above 20 after a reaction.
Stop Loss
Stop losses can be situated either above or below the closest swing high or swing low. Some traders may also choose to place it beyond an adjacent level, such as 23.6% or 78.6%.
Take Profit
Take profits are commonly located at the level where the price first exhibited a reaction, be it a high or a low.
50% Fibonacci Retracement Strategy
The 50% Fibonacci retracement strategy is a lower risk-to-reward approach but one that’s simple. Unlike other strategies that utilise multiple Fibonacci levels or additional indicators, this method zeroes in on the 50% mark as the focal point for entry, making it straightforward for traders. The 50% point specifically plays into the idea of mean reversion, which states that the price is likely to return to its average over time; however, traders can choose 38.2% or 61.8% areas if preferred.
Entry
Traders typically look to enter a position when the price reaches and reacts from the 50% retracement level, aiming to ride an existing trend.
Stop Loss
Due to the wider scope of this strategy, stop losses are usually set beyond the high or low of the entire Fibonacci retracement, offering a buffer against potential volatility.
Take Profit
Traders often opt to take profits at key support or resistance areas that offer at least a 2:1 reward-to-risk ratio. Alternatively, one may choose to forgo setting a take profit and instead trail a stop loss above or below new swing points that develop.
The Bottom Line
In summary, understanding and applying Fibonacci retracements can enhance your trading strategies, especially when used in conjunction with other technical indicators. These retracement levels offer high-probability zones where price might reverse, creating potential entry and exit points. If you're looking to implement a Fibonacci forex strategy in a secure, low-cost trading environment, consider opening an FXOpen account to access over 50 currency pairs and a comprehensive range of trading resources.
This article represents the opinion of the Companies operating under the FXOpen brand only. It is not to be construed as an offer, solicitation, or recommendation with respect to products and services provided by the Companies operating under the FXOpen brand, nor is it to be considered financial advice.