What Are Cryptocurrency Bear and Bull Traps?What Are Cryptocurrency Bear and Bull Traps?
In volatile crypto markets, traders must contend with many challenges. One of the most common is the bear and bull trap, which can quickly catch traders off-guard if they aren’t careful. In this FXOpen article, we’ll explore how these traps work, provide examples to illustrate their characteristics, and tell about practical ways to avoid them.
What Is a Bear Trap in Crypto?
In cryptocurrency trading, a bear trap is a signal indicating that a crypto asset is declining, luring in short sellers to position themselves for a price drop. However, this signal is false; after reaching a new low, the asset rebounds sharply. On a chart, this may look like a breakout below a support level, then a quick reversal, usually leaving a long wick.
The term ‘bear trap’ comes from the way it ‘traps’ bearish traders. They are almost instantly at a loss and psychologically vulnerable – they have to either realise a loss or risk further losses by holding their position.
Typically, covering these shorts (i.e. closing the short by buying back the position) fuels the bear trap, driving prices higher as traders rush to get out of the market to avoid further pain. It’s also worth noting that long traders expecting the reversal are also often stopped out during a bear trap – after all, it’s commonly repeated advice to set stop-losses beyond a support or resistance level.
It's essential to understand that bear traps are primarily psychological. They often occur when market sentiment is overwhelmingly negative, with traders expecting further price decreases. Institutional players in the market use this negativity to their advantage. They take long positions and briefly push prices down to trap many short traders and trigger long stop-losses. When shorts begin covering, and other traders start to buy, prices rise and put these players in profit.
Example
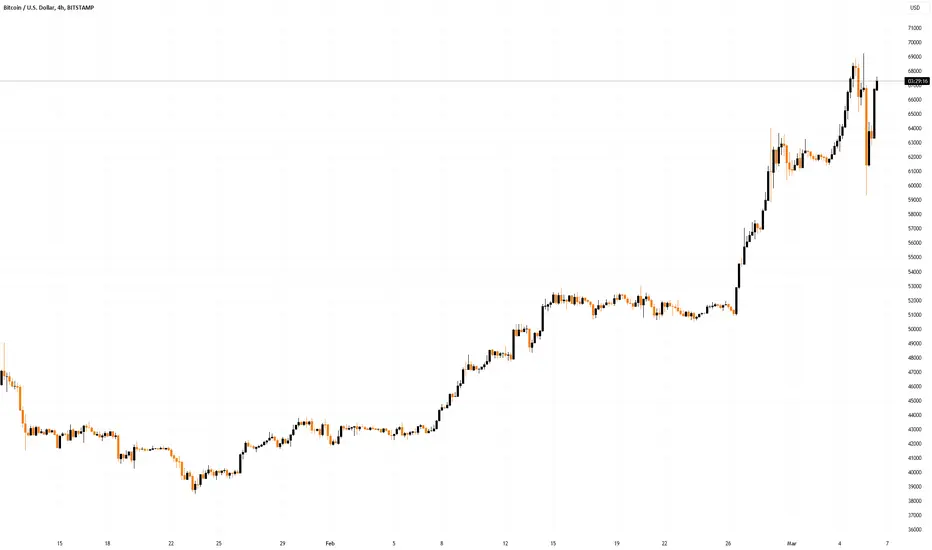
In the example above, we see Bitcoin dropping heavily on the left, continuing a larger downtrend off-screen. Price finds a bottom, creating an area of support that is held throughout the day. It’s reasonable to expect lower prices, given that BTC has been in a long downtrend.
As a result, when the price begins to break down with a sizable candle, breakout traders begin entering short positions. Those who took a long position, anticipating a broader trend reversal, are stopped out.
When the price begins to reverse as buying pressure picks up, short traders are trapped, likely at a small loss; stopped-out long traders are looking for a re-entry. As shorts began closing their positions and long traders rushed to enter again, Bitcoin surged higher.
What Is a Bull Trap in Crypto?
A bull trap is effectively the opposite of a bear trap: prices rise, encouraging traders to buy a cryptocurrency. It makes a new high and shortly reverses, putting traders who bought the breakout at a loss. This is the primary difference between a bull trap vs a bear trap.
Likewise, bull traps are all about emotion. Bulls are trapped, realising that they will likely take a loss. Bears that are correct in predicting an impending downtrend are stopped out and look for another entry. The fear and frustration of both types of traders add selling pressure to the market, driving prices lower.
Example
In the chart above, Bitcoin drops after an extended uptrend off-screen. It forms a low, retraces, and reacts at an area of resistance. Price continues higher, breaking through the resistance and forming a long wick. Traders buying the breakout see their position move to a loss as the long wick forms, while many short traders’ stops are triggered.
As it moves lower, a bear trap on the lower timeframe forces prices higher once more to form the real bull trap. Breakout traders think it’s for real this time as the high is broken and open long positions, while some short traders that found a reentry are stopped out again. When the price begins to decline sharply, the realisation of the market’s true direction forces the price even lower as traders pile in short.
This example is interesting in that it demonstrates that bull traps can occur repeatedly in the same area. While we won’t cover it in this article, learning the Wyckoff methodology can help you deal with and understand why you may see multiple bear and bull traps in a given area.
Want to mark up charts like we’ve done here? Head over to FXOpen’s free TickTrader platform, where you’ll find each of the tools used to create the examples in this article.
How to Avoid Bear and Bull Traps
It can be tricky to avoid falling into bear and bull traps in crypto, meaning traders should take precautionary steps to prevent frustration and potential losses. Here are four ways that may help traders sidestep these traps.
Understand Where Liquidity Lies
Bear and bull traps serve two purposes: to play on the emotions of traders and to tap into liquidity. Liquidity allows traders to take large positions without significantly affecting an asset’s price, reducing slippage/transaction costs. The deepest areas of liquidity are often found just beyond support or resistance levels, where stop losses are placed, and breakout traders are waiting and are usually tapped into before a considerable move occurs (as seen in the examples).
Liquidity builds up in areas with roughly equal highs and lows, along seemingly-strong trendlines, and at round numbers (e.g. $24,000), but is also present beyond every key high and low. In setups where the obvious place to set a stop-loss is one of these areas, you can consider using a wider stop-loss. Beyond the next significant support/resistance level is a good place to start.
Trade With the Trend
The phrase 'trend is your friend' is popular among traders for a reason. More often than not, these traps push the price in the direction of the broader trend. Understanding this can help avoid such traps. If the broader market trend is clearly bearish, for example, traders might want to reconsider taking a long position based on a potential breakout. Similarly, if the trend is bullish, it might be wiser to hold off on initiating short positions. This doesn't mean that counter-trend opportunities should be completely ignored, but rather that they should be approached with caution.
Check Volume
Trading volume often provides valuable clues about market activity. A sudden price movement accompanied by high trading volume can indicate a genuine breakout, while low volume may suggest a trap. This isn’t always the case since bear and bull traps can generate significant volume themselves, so it’s worth comparing a recent breakout’s volume with a potential trap’s volume to gauge strength.
RSI Divergences
Lastly, traders can use the relative strength index (RSI), a popular momentum indicator, to find early warning signs of reversals where traps often occur. Divergences between the RSI and price suggest weakening momentum and the possibility of a bull/bear trap. For instance, if the price reaches a new high but RSI does not, a reversal could be due. Conversely, if the price makes a new low without the RSI confirming, it could be a sign of a potential bull trap.
The Bottom Line
In conclusion, bear and bull traps are just one of the many challenges traders face when navigating the crypto markets. Understanding how they work and how to avoid them can significantly reduce the losses a trader takes and may even present opportunities for profit if taken advantage of correctly.
In fact, these traps occur across all types of markets, not just crypto. If you want to put your newfound knowledge to the test across over 600 stock, forex, and commodities markets, you can open an FXOpen account. You’ll be able to take advantage of the advanced TickTrader platform, low-cost trading, and blazing-fast execution speeds. Good luck!
At FXOpen UK and FXOpen AU, Cryptocurrency CFDs are only available for trading by those clients categorised as Professional clients under FCA Rules and Professional clients under ASIC Rules, respectively. They are not available for trading by Retail clients.
This article represents the opinion of the Companies operating under the FXOpen brand only. It is not to be construed as an offer, solicitation, or recommendation with respect to products and services provided by the Companies operating under the FXOpen brand, nor is it to be considered financial advice.
Community ideas
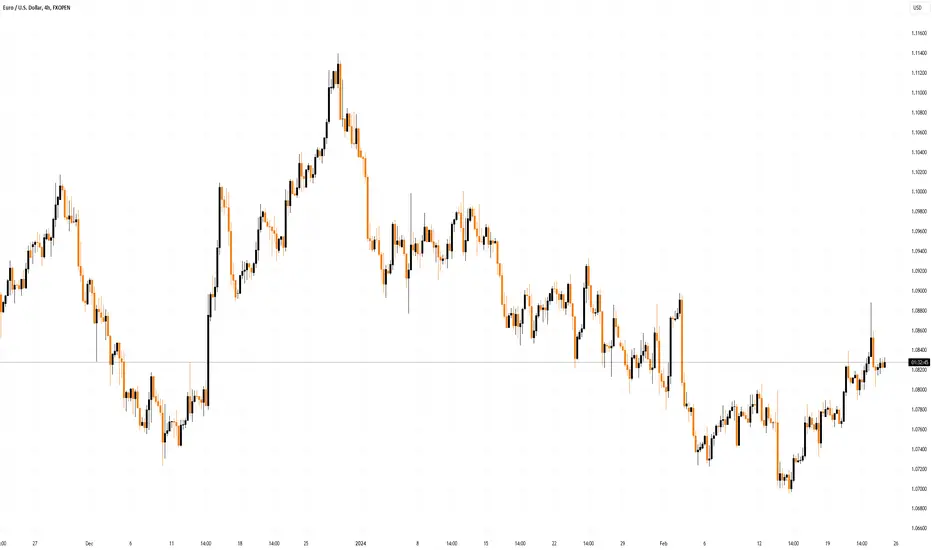
High Volume Times to Trade / Part 1 🔣Hello traders welcome back to another Concept video. In this video, we detail some of the best times to trade the Eur/Usd Currency pair. This happens to be at Session opens. We go through the 3 Session opens and walkthrough examples of increasing volume ( Large candles). Session opens can provide a great catalyst for 1) a continuation of momentum of the preceding trend or 2) a dramatic reversal. The Euro and the U.S. Dollar are not open during the Asian session and so the candles are much smaller and the average volatility is much less. However, the same concept applies regarding the former.

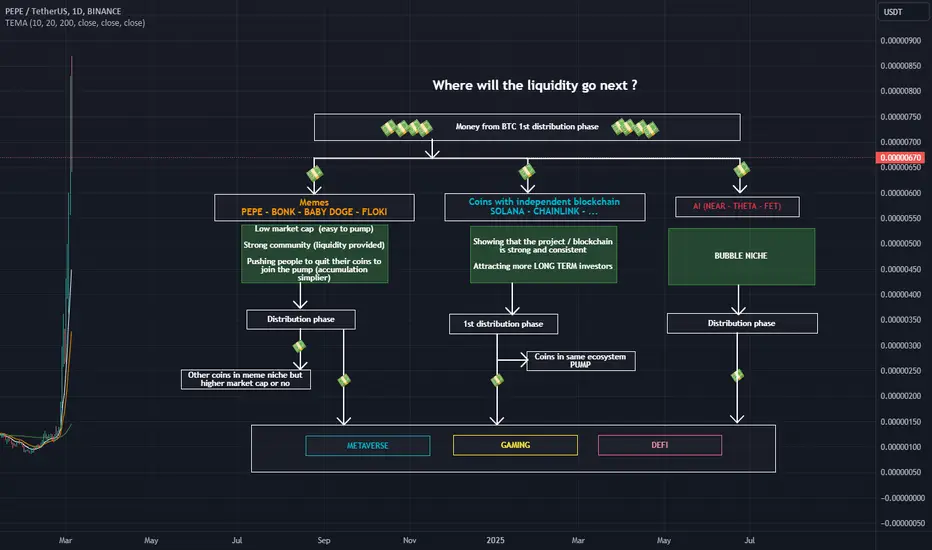
Where will the liquidity go next ?Liquidity is shifting within the market, moving from niche to niche as presented in the accompanying chart. One standout winner in this regard is the meme domain , which has seen significant gains because its market capitalization is small. Another area of focus is the AI niche , which is currently experiencing a surge in investor interest and capturing a considerable portion of the liquidity.
Coins with their own independent ecosystems are also drawing in more investors, thanks to their relative liquidity and robust ecosystems. This trend is expected to continue, albeit with some patience required as the market adjusts.
However, it's essential to recognize that liquidity will also flow into other niches within the cryptocurrency space. It's crucial to approach these opportunities with caution, as not all coins or tokens will attract the same level of attention from investors . Simply being invested in a particular coin, even at a lower price, does not guarantee massive returns. Achieving extraordinary gains, such as a 10x increase in value, can be challenging in many domains and niches within the cryptocurrency market.
Additionally, as larger institutional investors enter the cryptocurrency market, the potential gains may become more limited for individual investors. While a 10% profit may be significant for an investor with a capital of $1 million, it may not hold the same weight for someone with only $10,000 to invest.
Happy selling !
Why Central Banks Buying Gold & Institutions Hedging the Yields?While many of us celebrate the stock markets reaching new highs, central banks worldwide are actively purchasing gold, and institutions are hedging into treasuries and yields.
Interest rates are determined by the central banks whereas Yields are determined by the investors.
If you choose to lend or borrow money over a longer period, such as 10 or 30 years, you would typically expect to earn or pay more interest for this extended duration loan contract. However, currently, we are witnessing an inversion of this relationship, known as the inverted yield curve, where borrowers are required to pay higher interest on their short-term loans, such as the 2-year yield we're observing, compared to their longer-term borrowing.
2 Year Yield Futures
Ticker: 2YY
Minimum fluctuation:
0.001 Index points (1/10th basis point per annum) = $1.00
Disclaimer:
• What presented here is not a recommendation, please consult your licensed broker.
• Our mission is to create lateral thinking skills for every investor and trader, knowing when to take a calculated risk with market uncertainty and a bolder risk when opportunity arises.

Gaps and How Markets Move In Contraction and ExpansionThere are several ways to trade gaps but first, there should be a solid understanding of what Gaps are and how they show up. Markets aren't that hard to read if we have some simple ways to see them that adhere to the principles of movement.
All markets move in contraction and expansion. A Gap is the sudden supply/demand imbalance that comes out of the contraction and shows up as the expansion. These expansions can even be used to measure how far the next expansion will go.
Start with a simple bar chart and erase everything else off the chart. Look and simply see the dense areas of contraction (Range). Then see the expansion (Gap), followed by another contraction.
Look for same-size contractions and expansion and you will start to see how organized price flow can be. It's no different than swings in that minor contractions and expansions make up the major contractions and expansions.
Shane

Three Simple Intraday StrategiesThree Simple Intraday Strategies
Intraday trading is a technique that commands your attention, rewarding those who can swiftly analyse market data and act decisively. Armed with the right strategies, traders can make the most of market fluctuations within a single trading day. This article explores three successful intraday trading strategies: Breakout + 50% Retracement, RSI Trend Following, and HMA Crossover with VWAP. Read on to enhance your intraday trading toolkit.
Understanding Intraday Trading
Intraday trading entails buying and selling a given asset within a single trading day. The focus is on capitalising on short-term price movements. Unlike other trading styles, intraday trading techniques require quick decision-making, as positions are not held overnight. Two key factors are liquidity, allowing for easy entry and exit, and volatility, offering price movement opportunities. While the potential for quick gains is high, risks are equally elevated, emphasising the importance of sound strategies.
In the sections below, we’ll cover three intraday trading strategies. For the best understanding, consider using FXOpen’s free TickTrader platform to follow along in real time.
Breakout + 50% Retracement
The Breakout + 50% Retracement strategy combines the power of a price breakout with a midpoint entry, generally utilised in the context of an established trend. When a convincing breakout occurs, traders often look for entry points at the midpoint of the initial trading range. A convincing breakout is one that closes above or below the range's high or low, ideally with a large candle.
Entry
Traders typically watch for a breakout to occur from a trading range.
Entries are generally taken at the 50% retracement level of the trading range in the direction of the breakout.
Stop Loss
Stop losses are commonly positioned beyond the high or low of the initial trading range.
Take Profit
Profit-taking usually happens at identifiable support or resistance levels, aligning with the trend direction.
This strategy capitalises on the momentum generated by a breakout. By entering at the midpoint of the trading range, traders can position themselves during the pullback while maintaining a decent risk/reward ratio. The use of stop losses beyond the trading range's high or low helps in mitigating risks and taking profits at support or resistance levels helps traders to maximise their returns before price potential reverses.
RSI Trend Following
The RSI Trend Following strategy fine-tunes the Relative Strength Index (RSI) to be more sensitive by using a 7-period setting instead of the traditional 14. In the context of a well-established trend, this strategy suggests waiting for a pullback and then entering a position as the RSI swings back into its normal range.
In the chart above, we’ve used Apple (AAPL), one of the best stocks for intraday trading due to its high liquidity. However, this strategy will work across all types of assets.
Entry
Traders usually look for an established trend, marked by higher highs and higher lows for an uptrend or lower highs and lower lows for a downtrend.
During a pullback, the RSI often crosses into overbought (above 70) or oversold (below 30) territory.
Entries are typically made when the RSI crosses back into the normal range, confirming the trend's continuation.
Stop Loss
Stop losses are generally set above the most recent high in a downtrend or below the most recent low in an uptrend.
Take Profit
Profits are often taken at pre-identified support or resistance levels in line with the ongoing trend.
The strategy aims to capitalise on the continuation of existing trends by making the RSI more sensitive. A 7-period RSI allows traders to react more quickly to short-term price changes. By setting stop losses around the most recent highs or lows and targeting support or resistance levels for profit-taking, traders aim to balance potential rewards with manageable risk.
HMA Crossover With VWAP
The HMA Crossover With VWAP strategy integrates the Volume Weighted Average Price (VWAP) with the Hull Moving Average (HMA) set at 21 (orange) and 50 (yellow) periods. It's grounded in the principles of mean reversion, using the VWAP as a reference point for buy or sell decisions.
It’s worth noting that the VWAP is one of the best indicators for intraday trading. It effectively balances price and volume throughout the day and gives intraday traders a clearer view of potential market direction.
Entry
Traders generally observe the VWAP to determine the market bias; if the price is above the VWAP, the bias is to sell, and if it is below, to buy.
An entry signal is typically considered when the 21-period HMA crosses over the 50-period HMA in the direction of the VWAP bias.
Stop Loss
Stop losses are usually placed above or below the nearest swing high or swing low.
Take Profit
Profits are commonly taken when the price either touches the VWAP or when a reverse HMA crossover occurs.
This strategy leverages the mean-reverting nature of financial markets. By aligning the shorter-term 21-period HMA with the longer-term 50-period HMA and using the VWAP as a directional filter, traders aim for more precise entries. The HMA is a highly responsive moving average, making it ideal for intraday trading.
The Bottom Line
In summary, these three intraday trading strategies can provide traders with distinct approaches to capitalise on market volatility. Each has its own unique advantages and can be implemented using our robust TickTrader platform. However, it’s worth remembering they should be modified in accordance with your trading approach. To practise these strategies and more, consider opening an FXOpen account for a comprehensive trading experience tailored for traders with any level of experience.
This article represents the opinion of the Companies operating under the FXOpen brand only. It is not to be construed as an offer, solicitation, or recommendation with respect to products and services provided by the Companies operating under the FXOpen brand, nor is it to be considered financial advice.
Beware of Crypto scams- Rug PullsWith the crypto market on a strong run since October of last year and with many dreamers hoping for 100x or even 1000x returns, we must be extremely cautious of scammers.
In this article, I will explain one of the most common types of scams: Rug Pulls.
The term "rug pull" in the cryptocurrency industry refers to the moment when the founding team abruptly abandons the project and sells or removes all liquidity. The term originates from the phrase "pulling the rug out from under someone," meaning the unexpected withdrawal of support.
In 2021 alone, during the previous bull market, rug pulls were responsible for losses of approximately $2.8 billion, a figure close to historical highs and an 81% increase compared to 2020, according to a report by Chainalysis.
The cryptocurrency market is susceptible to such scams due to the lack of regulations from central authorities. Unlike traditional companies subject to strict government control, the decentralized nature of the crypto space allows for complete control by private entities. This makes it vulnerable to exploitation by these entities.
Types of rug pulls:
Liquidity Theft:
Liquidity theft is the most common type of rug pull. It involves a developer listing an altcoin on a decentralized exchange (DEX) where it can be traded with a top currency like Ethereum (ETH). To enable trading, the developer must create a liquidity pool.
The team generates hype around the new project and attracts investors. As more investors join the project, the coin's price rises, attracting others who believe the project is a viable opportunity. As the coin increases in value, the developer withdraws all ETH from the liquidity pool at some point, leaving investors in the pool with no way to exchange their now-worthless tokens.
Technical Manipulation:
Some developers intentionally design tokens with the aim of deceiving investors. Therefore, they will include specific lines of code to limit the ability of retail investors to sell, thereby controlling both demand and supply. Of course, they are the only ones capable of selling, and when the price has appreciated sufficiently, they will sell all the tokens they hold.
Dumping:
This means that developers or promoters who hold a large percentage of the total coins sell off their entire holdings. As new entities invest in the new cryptocurrency, they exchange their valuable cryptocurrencies such as BTC or ETH for the new cryptocurrency. As a result, when the price increases significantly, developers sell off all their tokens, causing the price of the cryptocurrency to plummet.
How to Protect Your Investments from Potential Rug Pulls?
Lack of a Website:
Not all projects start with a website, but many that intend to exist for a long time do. If the developers of the token you want to invest in don't have a personalized domain for their project, this is a clear warning to stay away. There are also fraudulent projects that have websites claiming to be under construction or launching soon.
Check the White Paper:
This is an excellent way to learn about the plans of the project you want to invest in. Check for the existence of such a document, as well as any discrepancies between the white paper and the website. ALSO, VERIFY IF THE TEAM IS AVAILABLE TO PROVIDE INFORMATION ON PLATFORMS SUCH AS REDDIT OR TELEGRAM. If a developer cannot answer basic questions about their project, this raises major red flags.
Anonymous Developers:
While the identity of Satoshi Nakamoto, the developer of Bitcoin, is not known for certain, the fact that a project you want to invest in has anonymous developers should raise concerns. If the developers of a cryptocurrency or DeFi project choose not to associate their names with it and remain in the shadows, they may have reasons for doing so, and it's best to avoid such a project.
Low Liquidity:
Low liquidity of a cryptocurrency means that it is difficult to convert it into fiat currency; therefore, the lower the liquidity, the easier it is for developers to manipulate the price. The best way to check the liquidity of a cryptocurrency is to analyze its trading volume over the past 24 hours. A general rule used by experienced investors is that the trading volume should be more than 10% of the coin's market capitalization.
Locked Liquidity:
To provide trust and enhance the public perception of their legitimacy, developers of serious projects will relinquish control over the liquidity pool by locking it in the blockchain often with a trusted third party. This process is called locked liquidity and prevents developers from trading with tokens from the pool, thereby making it impossible for them to steal or dramatically reduce liquidity. If liquidity is not locked, then nothing prevents developers from withdrawing their funds.
Low Total Locked Value (TLV):
TLV is another reliable measure to verify the legitimacy of a project. This term refers to the total amount invested in a particular project. Serious projects have a TLV of hundreds of millions or even billions of dollars, while newly emerging projects with only tens or hundreds of thousands of dollars in TLV should definitely be avoided.
Token Distribution:
Checking the token distribution of a project on Etherscan or Binance Smart Chain explorer will show who holds the largest amount of tokens and how they are distributed. If a single wallet or two hold more than 5% of the total available, there is a risk that the price may be manipulated.
The Project lacks an Audit Report: The most notable projects will have independent audit reports in the fields of security and financial transparency, guaranteeing their authenticity. A project without an audit report is not necessarily fraudulent, but it means that you should research the project in detail before investing in it.
Losing investments through a rug pull is a common phenomenon; therefore, before investing in a project, it is wise to analyze the project, developers, liquidity, and also the developers' activity on social media platforms.
Additionally, you can opt to use online tools that can detect a potential rug pull. One of these tools is Token Sniffer. This site lists all the latest hacks and scam coins. Rug Doctor is another useful tool for detecting rug pulls. The site analyzes the code of crypto projects, attempting to identify the most common rug pull strategies.
Stay safe and good luck!
Mihai Iacob
Our Strategy For "The Leap"Hey guys! Today, we explore 'The Leap', and our strategy for the competition.
It's easy to register if you haven't done so already.
In this video, we cover;
1.) DIRECTIONAL BIAS
2.) WHERE TO TRADE
3.) WHERE TO RISK
4.) POSITION MANAGEMENT
for the strategy we'll be using. It's a simple breakout strategy we're going to bring to a lower timeframe, so we can get enough trades in before the competition expires.
Good luck to all, we look forward to competing with you!
Want more high-quality trade ideas? Follow us below. ⬇️⬇️

What Is Bitcoin Halving? Here's All You Need to KnowWhat Is Bitcoin Halving? Here's All You Need to Know.
Halving is the event of slashing Bitcoin's mining rewards every 210,000 blocks, or roughly every four years. Read all about it here.
Table of Contents
Overview
What Is Bitcoin Halving?
When Is the Next Bitcoin Halving?
Deep Dive into Blockchain
How Are Miners Rewarded?
Why Halving Matters?
The Big Picture
What About Bitcoin’s Price?
Halving and the Way Forward
Overview
Bitcoin’s halving is a milestone event for the crypto space. Essentially, halving pushes back the moment we see all 21 million BTC tokens pulled out of their cryptographic hash puzzles.
Satoshi Nakamoto, the individual or group who created Bitcoin , programmed it to a fixed amount of 21 million coins. In other words, the total amount of Bitcoin can never exceed 21 million. Presently, miners have picked up just over 19 million through a process called Bitcoin mining.
This amount is over 90% of the total supply with mining having started with the creation of Bitcoin 15 years ago. That leaves just about 2 million tokens to be unearthed before the final Bitcoin enters our dimension. How long should we wait until this mammoth of a milestone happens? More than a century, or around the year 2140 , according to forecasting wizards.
The logic behind this peculiar mechanism lies in the so-called halving and this guide will help you understand all about it.
What Is Bitcoin Halving?
Halving, in its simplest form, is the process of gradually reducing the rewards of Bitcoin mining. As we mentioned, Satoshi Nakamoto originally hard-coded Bitcoin to a fixed supply of 21 million. All of them will come to life at an increasingly slower rate. More precisely, the pace at which Bitcoin is created is “halved” every 210,000 blocks.
The current block reward is 6.25 Bitcoin as the last halving occurred on May 11th, 2020.
When's the Next Bitcoin Halving?
In April 2024, miners will add the next batch of 210,000 blocks. And that only means one thing - they will have their revenue immediately slashed in half to 3.125 Bitcoin.
All halvings are evenly spread out approximately every four years, consistent with Bitcoin’s hard-coded design. This way, supply will keep increasing, just at a slower clip. The reason is simple - the Bitcoin halving rewards will continue to reduce.
Deep Dive into Blockchain
In order for new Bitcoin to come into circulation, miners need to create blocks in a chain, hence the term ‘blockchain’.
Network operators—the hardworking miners—uncover blocks through computer-powered mining operations. These crypto diggers compute hashes as quickly as possible. What they do is search for the successful fixed-length output that they add to the block.
The more hashes per second (hashrate), the more chances for hacking out new blocks and adding them to the blockchain.
How Are Miners Rewarded?
Generally, miners have two ways to reward themselves for the effort. The first one is to earn revenue from transaction fees of users who send and receive Bitcoin. That’s when they act as decentralized network operators and validate transactions without a central authority.
At their height during the crypto boom in April 2021, the Bitcoin network fees reached as much as $60 per transaction and took hours to complete. After all, the network can only handle 4-7 transactions per second. To compare, payment giant Visa can validate 24,000 transactions per second.
Average transaction fee of Bitcoin, USD
Timeframe: April, 2021
Source: bitinfocharts.com
The other way to reward Bitcoin miners is to let them pocket the newly-minted Bitcoin contained in the block. Halving is basically a reward system for miners.
But more broadly, halving is part of the proof-of-work model associated with high levels of energy consumption. Millions of mining rigs soak up that energy and crank out new Bitcoin.
Why Halving Matters?
Halving the block reward for mining Bitcoin is a way to protect its integrity. This immutable feature of the OG crypto makes it stand out as a unique asset class. In this light, it is also an alternative to inflation-prone national currencies, also known as fiat money.
With that in mind, in a world that craves disruptive innovation, a technology that’s rewiring the global financial system has progressively moved into the limelight. The growing role of Bitcoin as a new investment vehicle is apparent, factoring in the elevated investor appetite .
Bitcoin transacts tens of billions of dollars of daily volumes, with a peak of more than $126 billion on May 19, 2021. The figure is sufficient to prove it has piqued the interest of enough crowds to form a market around it.
Before we revisit Bitcoin as an investable asset, let’s take a breather and trace the original crypto back to its origins where halving was introduced.
The Big Picture
Just over 15 years ago, the mysterious Satoshi Nakamoto mined the initial “genesis” block . For the effort, the clandestine developer(s) earned a hefty reward of 50 Bitcoin. And also bothered to leave a message hooked to the chunk of transactions. The message read: " The Times 03/Jan/2009 Chancellor on brink of second bailout for banks. "
Since then, the Bitcoin network has witnessed three halving events:
On November 28, 2012, Bitcoin’s block reward was cut from 50 BTC to 25 BTC.
On July 9, 2016, Bitcoin’s block reward was slashed from 25 per block to 12.5 BTC.
The last one occurred on May 11, 2020, when the reward was axed to 6.25 BTC.
The next Bitcoin halving event is on deck for April 19, 2024. Rewards will fall to 3.125 BTC.
The Bitcoin halving dates may vary and we're yet to get a confirmation over the next one. Estimations indicate that every 10 minutes or so all network operators add a new block to the Bitcoin blockchain. With the current reward of 6.25 Bitcoin per block, miners dig out around 900 new Bitcoin a day.
At today’s prices , this is equal to around $50 million worth of Bitcoin extracted daily. This is where the halving becomes interesting not just to the geeks among us.
Halving events play a key part in shaping up supply and demand and weigh on the price of Bitcoin. Speaking of price movement, how does the rate at which new Bitcoin is churned out affect valuations?
What About Bitcoin's Price?
Bitcoin, as the world’s first cryptocurrency in a sea of many, is the quintessence of scarcity premium. Investment professionals are quick to say that Bitcoin carries a unique glamor as the only large tradeable asset with a predictable emission leading to a hard cap.
In that light, analysts consider Bitcoin to be the newest entrant in the store-of-value category. An investment product that holds its purchasing power over time. Ideally coming with consistent price increases.
This is possible thanks to halving - the brilliant mechanism hard-wired into the Bitcoin protocol. The minds behind the original digital currency conceived it as deflationary. A concept alien to the present financial system, flooded with central-bank cash and government stimulus.
The reason is that, contrary to fiat currencies that inflate over time, Bitcoin should not be debased by inflation. Satoshi Nakamoto explained this inflation-rate flaw in an online forum around the time of Bitcoin’s inception.
"The root problem with conventional currency is all the trust that’s required to make it work. The central bank must be trusted not to debase the currency, but the history of fiat currencies is full of breaches of that trust.”
Halving and the Way Forward
If there’s a need to draw broad conclusions, here are some of the more salient points to make a compelling argument.
Bitcoin’s purchasing power is likely to avoid debasement thanks to the halving mechanism. With less than 10% of Bitcoin still to come to the surface, it will take more than 100 years for the last unmined Bitcoin to pop out.
Once all the 21 million Bitcoin spring to life, miners will no longer stake their livelihood on uncovering new tokens. Instead, they will earn revenue from network fees for their work on validating transactions. But that’s only if the network sticks to the plan.
FAQ
❔ "What is the purpose of halving?"
► Halving maintains a decreasing pace of block rewards, which emphasizes on the idea of scarcity in Bitcoin.
❔ "When is the next Bitcoin halving?"
► The next Bitcoin halving event is scheduled to occur on April 19, 2024. This date is approximate, and the actual date may be different, depending on the time it takes to complete one full batch of 210,000 blocks.
❔ "Is halving related to price increase?"
► Technically, when the supply of new Bitcoin is cut in half, and demand remains the same, prices may go up. But the price discovery of Bitcoin does not obey archetype models of economics.
❔ "When will the last Bitcoin be mined?"
► Estimates point that the last available Bitcoin will be mined in the year 2140.

Understanding Momentum to filter out the Best SetupsIn the video I discuss how I analyse momentum using MACDs and the 5min and 1min charts when daytrading.
Knowing these key concepts helps me filter out the best setups to get on the right side of the market and in the right trading zones.
The basic concepts discussed are :
- Momentum
- Price Action
- Candle Analysis
- Multi-timeframe Analysis
** If you like the content then take a look at the profile to get more ideas and learning material **
** Any Comments and likes are greatly appreciated **

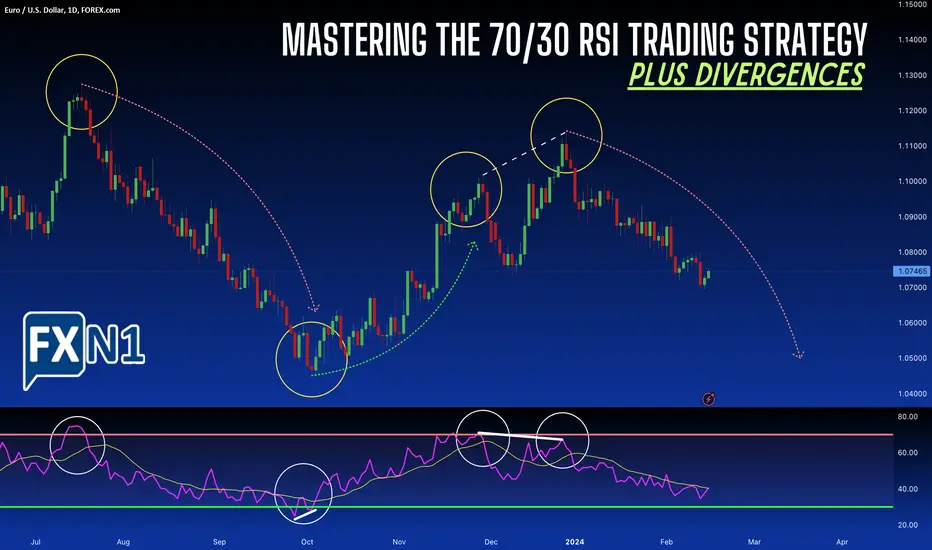
Mastering the 70/30 RSI Trading Strategy - Plus Divergences!Mastering the 70/30 RSI Trading Strategy: A Comprehensive Guide
The 70/30 RSI technique stands out as a popular and effective method for making informed decisions in the financial markets. Leveraging the Relative Strength Index (RSI) indicator, this strategy empowers traders to navigate the complexities of buying and selling various financial instruments, from stocks to currencies. In this article, we delve into the intricacies of the 70/30 RSI trading strategy, exploring its fundamentals and practical application in forex trading.
Understanding the 70/30 RSI Trading Strategy:
Developed by renowned technical analyst J. Welles Wilder, the RSI indicator serves as a powerful tool for evaluating market strength and identifying overbought and oversold conditions. With a range from 0 to 100, the RSI provides traders with crucial insights into market dynamics, enabling them to make timely trading decisions.
At the heart of the 70/30 RSI strategy lies the establishment of two key threshold levels on the RSI indicator: 70 for overbought conditions and 30 for oversold conditions. These thresholds serve as crucial markers for generating buy or sell signals, offering traders valuable guidance in navigating market trends.
⭐️ Adding and Setting Up the RSI Indicator on Your Chart:
The RSI (Relative Strength Index) Indicator is a freely available tool accessible within your TradingView Platform, irrespective of your subscription plan. Whether you're using a Free membership or one of the Premium plans, you can easily find and add this indicator to your charts. Below, I'll guide you through the process of adding and customizing the RSI indicator on your platform with the help of the following images.
To begin adding the RSI indicator to your chart:👇
You can also customize the colors to your preference, just like I did by selecting your favorite ones.👇
Now, let's delve into what the RSI indicator is and how to interpret it.
Interpreting RSI Signals:
In essence, an RSI reading of 30 or lower signals an oversold market, suggesting that the prevailing downtrend may be ripe for reversal, presenting an opportunity to buy. Conversely, a reading of 70 or higher indicates overbought conditions, implying that the ongoing uptrend may be nearing exhaustion, presenting an opportunity to sell.
The Relative Strength Index (RSI) Explained:
As a momentum indicator, the RSI measures the speed and magnitude of recent price changes, providing traders with insights into whether a security is overvalued or undervalued. Displayed as an oscillator on a scale of zero to 100, the RSI not only identifies overbought and oversold conditions but also highlights potential trend reversals or corrective pullbacks in a security's price.
Practical Application of the RSI Strategy:
Traders employing the 70/30 RSI strategy must exercise caution, as sudden and sharp price movements can lead to false signals. While RSI readings of 70 or above indicate overbought conditions and readings of 30 or less indicate oversold conditions, traders must consider additional factors and use other technical indicators to validate signals and avoid premature trades.
Let's examine a few examples.
Example No. 1: EUR/USD Daily Timeframe
On the EUR/USD daily timeframe, we observed an overbought condition indicated by the RSI rising above the 70 level. This signaled a potential reversal in price direction. Subsequently, the price indeed reversed, confirming the overbought scenario.
It's crucial to emphasize that while scenarios above the 70 RSI level or below the 30 RSI level suggest potential reversals in price, it's essential to complement your analysis with additional filters. These may include consideration of the economic environment, effective risk management strategies, and identification of triggers or patterns before initiating a trade. Below, I'll illustrate a potential trigger that aligns with the RSI 70/30 strategy: the crossover of the RSI line with the RSI-based moving average (MA).
Example No. 2:
In this example, the RSI strategy proved effective as we observed the price falling below the 30 level, indicating potential oversold conditions and a forthcoming reversal from the market's potential bottom. Additionally, in the image below, you'll notice the introduction of white lines, known as "divergences." I'll provide a clearer explanation of divergences in the next example.
Example No. 3:
In this example, denoted as circle N.3, we encounter another instance of the RSI reaching the 70 level, indicating an overbought condition. Once again, the strategy proves effective, but this time, we notice a shallower reversal compared to the previous two examples.
Following this reversal, the price experiences growth, presenting a new opportunity for traders with a subsequent higher high. However, unlike before, this high does not breach the 70 RSI level, resulting in a deeper reversal.
This scenario exemplifies a "divergence."
But what exactly is divergence trading?
Divergence trading revolves around the concept of higher highs and lower lows.
When the price achieves higher highs, you would expect the oscillator (in this case, the RSI) to also record higher highs. Conversely, if the price makes lower lows, you anticipate the oscillator to follow suit, registering lower lows as well.
When they fail to synchronize, with the price and the oscillator moving in opposite directions, divergence occurs, hence the term "divergence trading."
I'm confident that the previous three examples were well explained to help you understand the 70/30 RSI strategy, along with the MA moving average trigger and the relative divergence strategy. Please share your thoughts in the comment section below.
Key Considerations and Limitations:
While the 70/30 RSI strategy offers valuable insights into market dynamics, traders must remain mindful of its limitations. True reversal signals can be rare and challenging to identify, necessitating a comprehensive approach that incorporates other technical indicators and aligns with the long-term trend.
In Conclusion:
The 70/30 RSI trading strategy represents a powerful framework for navigating the complexities of the financial markets. By leveraging the insights provided by the RSI indicator, traders can make well-informed decisions, identify lucrative trading opportunities, and optimize their trading strategies for success in various market conditions.
How-To: Use the TradingView Paper Trading featureTradingView's Paper Trading isn't just for practice; it's a detailed educational platform that closely simulates the real trading environment, all without the risk of losing money. This feature is carefully crafted to mimic actual market scenarios, offering users a realistic preview of how their trading plans might fare.📖🧾
The video is packed with valuable tips 💡 on making the most of the Paper Trading feature. From initiating your paper trading account to executing trades, tracking your positions, and evaluating your trading approach, this guide is essential for anyone looking to refine their trading skills on TradingView.
Engaging in paper trading means more than just trial runs; it integrates you into a community of well-informed traders. It encourages the prudent, yet proactive mindset advocated by TradingView. Such a strategy distinguishes the most successful traders. 📈
In summary, the Paper Trading feature reflects TradingView's dedication to providing its users with the necessary knowledge 📚 and tools ⚒️ for trading success. It champions the "look first, then leap" approach, ensuring that your venture into trading is informed, confident, and well-prepared. Immerse yourself in the video 🎥, delve into the Paper Trading feature, and start your path to becoming a knowledgeable and prosperous trader. 💹
❓Have you tried our Paper Trading feature yet? How did you find it? Love it 🥰, hate it 👎🏽, we want to know especially with our upcoming competition where you could win up to $10,000 paper trading right here on TradingView.
More on that later ⏰ ;)
Happy trading, and always remember – look first, then leap! 👀🦘
ℹ️ More info on the TradingView Paper Trading feature can be found here:
tradingview.sweetlogin.com
Don't want to miss out on more tips and tricks? Give us a follow!

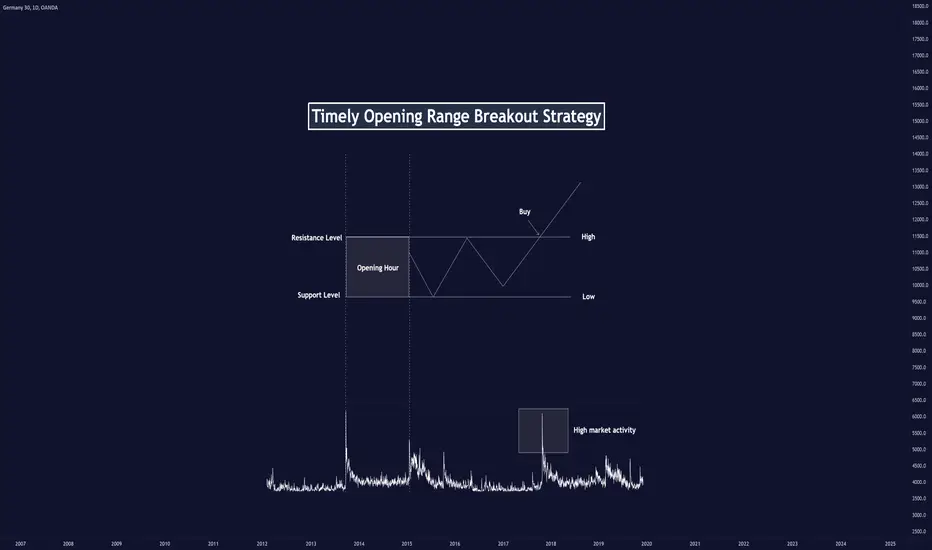
Timely Opening Range Breakout Strategy (TORB)Today, I’ll tell you about an amazing research study back from 2019 by a team of Taiwanese researchers, “Assessing the Profitability of Timely Opening Range Breakout on Index Futures Markets.”
Takeaway: The study's results are compelling. Implementing the TORB strategy yielded over 8% annual returns across the tested markets. Remarkably, the TAIEX index showcased a staggering 20.28% annual return. These numbers underline the potential of TORB in maximizing trading gains.
█ What is Open Range Breakout?
Open Range Breakout (ORB) is one of the simplest and safest strategies day traders use in a relatively low-volatility market. Opening Range means exactly just that. You check an asset's highest and lowest price in a certain time frame (usually 15 to 60 minutes) from the market's opening time.
These levels become your resistance and support that guide your trading plan for that day. Say if your chosen stock price goes higher than the highest level after the opening range; it indicates a bullish run for the day. Conversely, it indicates a bearish run if the price loses support in a downward trend.
█ Timely Opening Range Breakout Strategy
ORB has a certain set of challenges, especially for volatile markets. The Timely Open Range Breakout (TORB) strategy has been proposed in response to these challenges.
TORB leverages high-frequency intraday data and aligns trading strategies with the active hours of the underlying stock markets.
By analyzing one-minute intraday data from 2003 to 2013 across various markets, including DJIA, S&P 500, NASDAQ, HSI, and TAIEX, the study by Yi-Cheng Tsai et al. demonstrates the effectiveness of this strategy.
The key lies in identifying the 'active hours' of the market, aligning with the opening range of the underlying index.
█ 1. PMMV and PMVR:
The research paper introduces two critical variables for the TORB strategy: Per-Minute Mean Volume (PMMV) and Per-Minute Variance of Return (PMVR). These metrics are essential in identifying the most active hours for futures market trading.
PMMV provides a snapshot of the market's activity level at each minute of the trading day. PMVR is crucial for understanding the volatility or the degree of fluctuation in the market at each minute.
PMMV (Per-Minute Mean Volume) is calculated by averaging the trading volume in a one-minute interval over a specified number of trading days.
The graph shows that the German 40 is most active during the London opening and 30 minutes into the New York opening.
PMVR (Per-Minute Variance of Return) measures the variance of the one-minute returns, calculated as the logarithmic difference between the closing prices of one-minute intervals.
Using PMVR, the German 40 is most active during the London opening session and approximately one hour into the New York session.
█ 2. TORB Trading Rules:
Basic ORB trading rules are applied here.
Buying pressure dominates if the price moves above the resistance level, suggesting potential upward price movement. Conversely, selling pressure prevails if the price falls below the support level, indicating a possible downward trend.
These rules are applied within the active trading hours, defined by the PMMV and PMVR metrics.
Buy Signal
Sell Signal
The strategy also defines three key time points: the beginning of the observed period, the end of the observed period (probe time), and the time of closing the position. The prices at these specific times determine the conditions for buying and selling.
█ 3. Data Sets:
The study utilized two main datasets for its experiments:
Intraday Data of Five Futures Markets: This dataset includes one-minute intraday data of the E-mini futures of the DJIA, S&P 500, NASDAQ 100, HSI (Hong Kong), and TAIEX (Taiwan). The period covered ranges from 2001/2003 to 2013, providing a comprehensive overview of these markets over a decade.
Transaction Data for TAIEX Index Futures: This dataset contains detailed transaction data for the TAIEX index futures, covering the period from 2006 to 2013. It analyzes the relationship between TORB signals and trader behavior in the Taiwanese market.
Interestingly, the research even considers the global financial crisis of 2007-2008, presenting test results for two sub-periods: before and after 2007. This approach ensures a thorough understanding of the strategy's performance across different market conditions.
█ Results and Analysis
1. TORB Profitability Test:
The TORB profitability test involved back-testing the strategy for the five futures markets.
DJIA, S&P, and NASDAQ results revealed that strategies with probe times in the early stages yielded significantly higher annual returns.
DJIA: The results showed that TORB transactions decreased as the probe time moved away from the beginning of active hours. This implies that the strategy was most effective when applied close to market opening times.
S&P and NASDAQ: Similar to the DJIA, these markets also showed that strategies with early-stage probe times earned higher annual returns.
Additionally, the TAIEX results demonstrated that TORB strategies earned significantly higher returns with probe times of less than 200 minutes.
2. Impressive Returns:
The study's results are compelling. Implementing the TORB strategy yielded over 8% annual returns across the tested markets. Remarkably, the TAIEX index showcased a staggering 20.28% annual return. These numbers underline the potential of TORB in maximizing trading gains.
It also found that the best probing times were shorter in the U.S. markets and longer in Asian markets.
The research demonstrated that TORB strategies yielded consistently higher returns than traditional TRB (Trading Range Breakout) strategies, with no significant results in profitability tests for all TRB strategies across the five futures markets.
To provide a clear picture, here's a summary of the daily returns for each market analyzed:
E-mini DJIA: See Table 1 from the research paper
E-mini S&P: See Table 2 from the research paper
E-mini NASDAQ and HSI: See Tables 3 and 4 from the research paper
TAIEX: See Table 5 from the research paper
The active hours, identified by peaks in PMMV and PMVR, played a crucial role in the strategy's success.
For instance, the E-mini DJIA showed peaks around 8:30 AM and 3:15 PM, coinciding with the opening and closing times of the underlying market. Similarly, peaks were observed for HSI around the opening, closing, and lunch break times.
█ Relationship Between TORB Signals and Trader Behavior
The study also examined the relationship between TORB signals and trader behavior, particularly in the TAIEX futures market.
It was observed that the daily volume for individual traders was about twice that for institutional traders. The returns of the TORB strategies were positively related to the net buy positions of institutional traders both before and after the breakout.
This suggests that by following the TORB signals, one could trade in the same direction as institutional traders and obtain positive returns.
Specifically, the returns of the TORB strategies were significantly and positively related to foreign investment institutions, both before and after the breakout, indicating that TORB signals align with the trading direction of the most informed traders in the Taiwan market.
█ Reference
Y.-C. Tsai, M.-E. Wu, J.-H. Syu, C.-L. Lei, C.-S. Wu, J.-M. Ho, and C.-J. Wang, "Assessing the Profitability of Timely Opening Range Breakout on Index Futures Markets," IEEE Access, vol. 7, pp. 32061- 32071 Mar. 2019.
-----------------
Disclaimer
*Our results are approximate. We encourage you to test the assumption yourself. We do not guarantee that you will get the same results. This is an educational study for entertainment purposes only.
The information in my Scripts/Indicators/Ideas/Algos/Systems does not constitute financial advice or a solicitation to buy or sell securities. I will not accept liability for any loss or damage, including without limitation any loss of profit, which may arise directly or indirectly from the use of or reliance on such information.
All investments involve risk, and the past performance of a security, industry, sector, market, financial product, trading strategy, backtest, or individual's trading does not guarantee future results or returns. Investors are fully responsible for any investment decisions they make. Such decisions should be based solely on evaluating their financial circumstances, investment objectives, risk tolerance, and liquidity needs.
My Scripts/Indicators/Ideas/Algos/Systems are only for educational purposes!
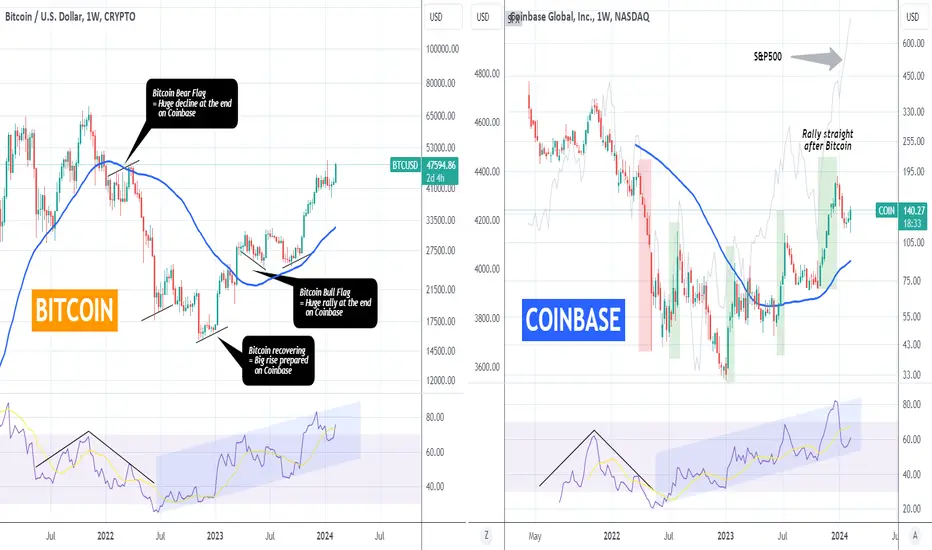
Navigating Sympathy Plays: A Guide to Trading BITCOIN & COINBASE** Introduction **
Sympathy trading, a strategic approach rooted in both technical and fundamental analysis, capitalizes on correlated movements between assets to uncover profitable opportunities. In this article, we delve into the nuanced realm of sympathy trading using Bitcoin (BTCUSD) and Coinbase Global Inc. (COIN) as case studies, exploring how a blend of technical and fundamental analysis can enhance trading strategies.
** Understanding Sympathy Trading **
Sympathy trading hinges on discerning and exploiting the symbiotic relationship between correlated assets. It involves analyzing both technical indicators and fundamental factors to identify potential entry and exit points, as well as underlying drivers influencing price movements.
** BTCUSD and COIN: A Sympathetic Relationship **
BTCUSD and COIN exemplify a compelling case study in sympathy trading within the cryptocurrency domain. Bitcoin's price dynamics often exert a significant influence on Coinbase's stock value, reflecting the exchange's dependency on Bitcoin's performance and trading volumes.
Technical Analysis Insights:
Technical analysis provides crucial insights into price trends, momentum, and support/resistance levels. Key technical indicators for trading BTCUSD and COIN include:
1.Moving Averages: Analyzing moving average crossovers and trends helps identify potential entry or exit points. Golden crosses (short-term moving average crossing above long-term moving average) or death crosses (opposite) can signal trend reversals.
2.Volume Analysis: Monitoring trading volumes in both BTCUSD and COIN can confirm price movements and signal changes in market sentiment. An increase in volume accompanying price movements suggests stronger market conviction.
3.Chart Patterns: Identifying chart patterns such as triangles, flags, and head and shoulders formations can provide insights into potential price reversals or continuation patterns, guiding trading decisions.
Fundamental Analysis Insights:
Fundamental analysis delves into underlying factors driving asset valuations and market sentiment. Key fundamental factors influencing BTCUSD and COIN include:
1.Regulatory Developments: Changes in regulatory frameworks governing cryptocurrencies can impact investor sentiment and trading activity. Positive regulatory developments may boost confidence in BTCUSD and COIN, while regulatory uncertainties could lead to volatility.
2.User Adoption and Trading Volumes: Monitoring user adoption rates and trading volumes on Coinbase's platform can provide insights into the exchange's revenue prospects and growth trajectory. Increased user activity often correlates with higher revenues for the exchange.
3.Market Sentiment and News Catalysts: Market sentiment surrounding Bitcoin, such as institutional adoption, macroeconomic factors, or geopolitical events, can influence both BTCUSD and COIN prices. News catalysts, such as product launches, partnerships, or earnings reports from Coinbase, can drive short-term price movements.
** Crafting Sympathy Strategies: **
Sympathy trading strategies integrating technical and fundamental analysis may involve:
1.Confirmation of Technical Signals: Confirming technical signals with fundamental catalysts can strengthen trading convictions. For example, if a bullish technical pattern emerges in BTCUSD, traders may look for positive fundamental catalysts supporting the uptrend in COIN.
2.Event-Based Trading: Leveraging fundamental analysis to anticipate market-moving events, traders may position themselves ahead of key announcements or developments. For instance, if positive regulatory news is expected for cryptocurrencies, traders may preemptively buy COIN in anticipation of increased trading activity.
** Risk Management Considerations: **
Effective risk management is paramount in sympathy trading to mitigate potential losses:
1.Position Sizing: Determine appropriate position sizes based on risk tolerance, account capital, and trade conviction. Avoid overexposure to a single trade and diversify across multiple assets to spread risk.
2.Stop-Loss Orders: Implement stop-loss orders to limit potential losses and protect capital. Place stop-loss levels based on technical levels, volatility considerations, or predetermined risk-reward ratios.
** Case study in action **
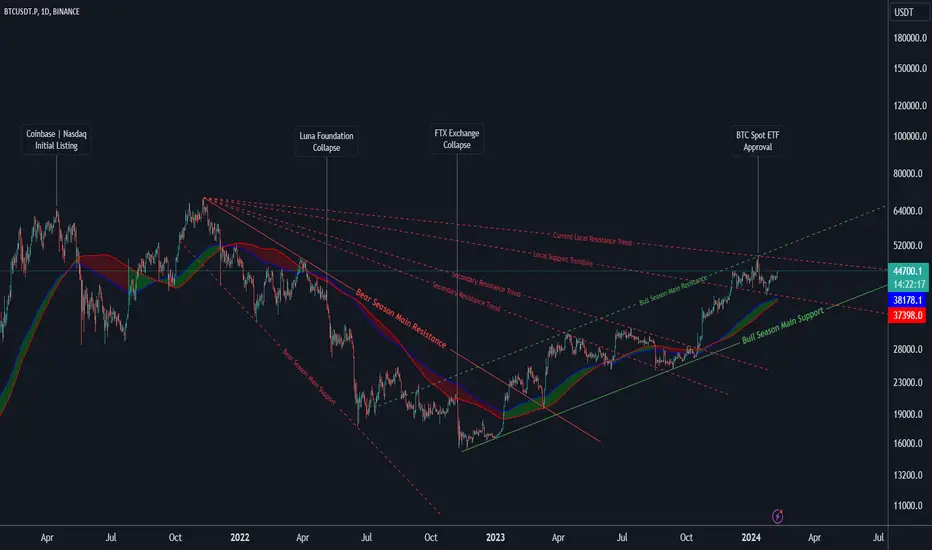
Let's look at the charts, both on the 1W time-frame in order to catch and get an understanding of the bigger trends and see if the theory is applied on the price action.
Bitcoin has provided 5 excellent Sympathy Play signals for Coinbase in the last 2 years. Starting with a Bear Flag that was rejected on its 1W MA50 (blue trend-line), Bitcoin initiated a huge decline on Coinbase (red shape), proportionally much stronger that its own. Then as its was attempting to find a market bottom, it provided 2 recovery signals that gave a proportionally bigger rise on Coinbase. Then a BTC Bull Flag again turned into a proportionally bigger rise on Coinbase with the last signal coming on October 2023.
As you can see during this significantly sample, Bitcoin tends to provide strong early buy/ sell signals on Coinbase. It is worth noting that even though Coinbase is a stock, it follows Bitcoin's price movements more closely than the S&P500 stock index, which we have illustrated on the right chart by the grey trend-line. As you can see there have been numerous occasions where Coinbase failed to follow a big stock market rally and instead was tied to BTC with the most notable examples being recently in January 2024, March 2023 and October 2022.
** A few things to consider that distinguish Bitcoin from Coinbase: **
Market Factors: Bitcoin's price is influenced by various market factors such as supply and demand dynamics, investor sentiment, macroeconomic trends, regulatory developments, and technological advancements. Coinbase's stock price, on the other hand, is influenced by factors specific to the company, including financial performance, earnings reports, regulatory compliance, competition, and market sentiment towards the cryptocurrency industry.
Liquidity and Trading Volume: Bitcoin, being the largest and most well-known cryptocurrency, typically exhibits higher liquidity and trading volume compared to Coinbase's stock. As a result, Bitcoin may experience more significant price movements and volatility compared to COIN, which could impact their respective charts differently.
Correlation vs. Causation: While Bitcoin's price movements may influence sentiment towards Coinbase and vice versa, correlation does not necessarily imply causation. While there may be periods where BTC and COIN prices move in tandem due to shared market sentiment or external factors, they are ultimately distinct assets with their own fundamental drivers.
Market Participants: Bitcoin is traded on cryptocurrency exchanges by a diverse range of market participants, including retail investors, institutional investors, miners, and traders. Coinbase's stock, on the other hand, is traded on traditional stock exchanges and may attract a different set of investors, including institutional investors, hedge funds, and retail traders.
** Conclusion: **
Sympathy trading using BTCUSD and COIN as case studies demonstrates the synergy between technical and fundamental analysis in identifying trading opportunities and managing risk. By integrating insights from both disciplines, traders can enhance their trading strategies, navigate market dynamics with confidence, and strive for consistent profitability in the dynamic cryptocurrency market.
-------------------------------------------------------------------------------
** Please LIKE 👍, FOLLOW ✅, SHARE 🙌 and COMMENT ✍ if you enjoy this idea! Also share your ideas and charts in the comments section below! This is best way to keep it relevant, support us, keep the content here free and allow the idea to reach as many people as possible. **
-------------------------------------------------------------------------------
💸💸💸💸💸💸
👇 👇 👇 👇 👇 👇
What Is Stage Analysis in Trading?Stage analysis is a powerful technique in trading that segments market trends into distinct phases, each offering unique opportunities and challenges. Developed by Stan Weinstein, this method helps traders understand and anticipate market movements. This article delves into the four stages of this analysis, offering insights into how traders apply these concepts, particularly in the context of stock trading.
Understanding Stage Analysis
Stan Weinstein’s stage analysis, a concept introduced in his seminal work "Secrets for Profiting in Bull and Bear Markets," offers a structured approach to evaluating market phases. Stage analysis in stocks divides the market cycle into four distinct phases. Each represents a specific phase in a stock's lifecycle, characterised by unique price movements and investor behaviour.
Weinstein's methodology is rooted in the identification of these stages through technical analysis, focusing on price action and volume. By discerning the current phase of a stock, traders gain insights into its probable future trajectory. This analytical framework assists traders in making more informed decisions about entry and exit points, aligning their strategies with the market's natural rhythm. Notably, it can be used in both intraday trading and long-term investing.
Below, we’ll walk through the four stages of Weinstein’s methodology. To better understand the topic, consider following along in FXOpen’s free TickTrader platform.
Stage 1: The Basing Area
In Weinstein stage analysis, the basing stage, or stage 1, marks the beginning of a stock's life cycle. This period is characterised by a period of consolidation after a previous downtrend. Prices typically fluctuate within a narrow range, indicating a lack of clear direction as the market sentiment shifts from negative to neutral. This transition is often overlooked in stage analysis trading, as it doesn't present immediate opportunities for significant gains.
During the basing stage, trading volumes generally diminish, reflecting a reduction in selling pressure. As buying volume increases, accumulation-distribution tools like on-balance volume (OBV) tend to bottom out and move higher, typically in tandem with price. OBV helps in tracking volume flow, offering insights into whether the volume is flowing in or out of an asset.
Additionally, investors watch for a gradual flattening of the price’s moving averages, a sign that the downward momentum is waning. It's a period of accumulation for savvy investors who recognise the potential for future upside. However, traders are cautious as stocks can linger in this phase for an extended period, and premature entry can lead to capital being tied up in inactive investments.
Traders employing Weinstein's method use this phase to prepare for potential entry points, keeping a close watch on stocks that show signs of breaking out of their base. The successful identification of a market transitioning from Stage 1 to Stage 2 – the Advancing Stage – may position traders to capitalise on the early beginnings of a new uptrend.
Stage 2: Advancing
In stock stage analysis, stage 2, known as the advancing stage, is where investors may see the potential gains. This phase begins when a stock breaks out from the basing stage (stage 1) with notable volume. It signifies a transition from a neutral to bullish market sentiment as more investors start acknowledging the market’s potential.
A key characteristic of Stage 2 is the sustained upward movement in the stock's price, often accompanied by increasing trading volumes. This rise in interest confirms the growing interest and commitment from investors, reinforcing the trend's strength. During this phase, the price typically moves above its key moving averages, such as the 30-period moving average, which acts as a dynamic support.
OBV is also useful in this period. An increasing OBV alongside rising prices is a positive sign, indicating that the upward price movements are supported by strong volume, thus validating the trend.
Traders focus on stocks that maintain their price above key moving averages and show a consistent increase in OBV in this phase. Such alignment of price and volume dynamics provides a more robust confirmation for continuing the trade in the advancing direction.
Stage 3: Top Area
Stage 3, known as the top area, marks a significant shift in the stock's cycle. This phase signifies the transition from an uptrend to a potential downtrend, characterised by a levelling off of the stock’s price movement after its advance in Stage 2. It's a period of distribution where early investors start to take potential returns, and new investors may enter based on the stock's past performance, not its future potential.
During this phase, price movements become less definitive, often moving sideways and creating a resistance level that the stock struggles to exceed. Price begins to hover around its key moving averages, such as the 30-period moving average, without a clear direction. This indecisiveness in price action is a crucial indicator of the weakening momentum.
Volume analysis during Stage 3 is vital. A divergence between price and volume starts to emerge; while prices might still be high, interest often shows a noticeable decrease. This reduced volume hints at a lack of conviction among investors, assuming that the stock may not sustain its previous upward trajectory.
Traders monitoring stocks in Stage 3 should be cautious. It’s a time to closely watch for signs of a breakdown or a continuation of the trend, as the stock may either revert to Stage 1 or unexpectedly surge into a renewed Stage 2.
Stage 4: The Declining Phase
Stage 4 marks the declining phase, where a stock transitions from a period of distribution to a clear downtrend. This period is characterised by a sustained drop in the stock’s price, often initiated by a decisive break below key support levels and moving averages, like the 30-period moving average.
The declining phase is typically accompanied by increasing trading volumes, reflecting a growing consensus among investors that the stock’s peak performance is behind it. This phase can be accelerated by negative news or poor earnings reports, further driving down the price.
The on-balance volume (OBV) is again a critical tool in this phase. A declining OBV indicates that selling pressure is increasing, reinforcing the downtrend. This downtrend is marked by lower highs and lower lows in both price and volume, signalling weakening investor confidence and diminishing interest in the stock.
For traders, stage 4 is a period of high caution. It's often considered a signal to exit positions to avoid further losses. Short-selling strategies may be employed by more experienced traders who seek to capitalise on the market’s downward trajectory. However, it's essential to approach this phase with a clear risk management strategy, as the volatility can lead to rapid changes in price.
The Bottom Line
Mastering stage analysis may equip traders with a structured approach to navigate the stock market's ebb and flow. By understanding and applying the principles of each stage, traders can potentially make more informed decisions, aligning their strategies with market trends. For those ready to apply these insights in real-world trading, opening an FXOpen account offers a platform to implement stage analysis techniques effectively in a dynamic trading environment.
This article represents the opinion of the Companies operating under the FXOpen brand only. It is not to be construed as an offer, solicitation, or recommendation with respect to products and services provided by the Companies operating under the FXOpen brand, nor is it to be considered financial advice.
Understanding LIQUIDITYIn this video I try to explain liquidity as it pertains to training in a simple manner.
Liquidity are basically orders in the marketplace. Since trading is a zero-sum game, without liquidity, there is no trading. Simply put, If you wanted to BUY, then you would need someone to SELL to you, and vice versa.
Smart Money has deep pockets and needs a large amount of liquidity to facilitate their positions. They want to be able to get in and our of their trades, as well as to be able to trade with capital that would be worth the reward.
The largest pools of liquidity usually reside above swing highs and lows, and equal highs and lows (double/triple tops and bottoms). Support and Resistance ideologies dominate the market, and besides that, psychologically it makes sense to put stoplosses at such areas rather than at some random area within a range. There are also breakout traders who see price breaking out of an area as a sign of strength (or weakness if bearish) and they set their entries above/below these levels. This is how liquidity is "engineered" in the market and sentiment manipulated. These pools of liquidity can be seen as a magnet, drawing price to these levels, either to grab liquidity before reversing or continuing in its current direction.
- R2F

Mastering Trendlines: Navigating Bitcoin's VolatilityMastering Trendlines: Navigating Bitcoin's Volatility
In the ever-evolving world of cryptocurrency, Bitcoin stands as the pioneer, leading the charge in digital finance. However, its notorious price volatility can be a double-edged sword for traders and investors alike. To navigate these turbulent waters, one of the most effective tools at your disposal is the trendline. This simple, yet powerful technique in technical analysis can be your compass in the vast ocean of digital currency trading. Let's dive into the essence of trendlines and how you can use them to your advantage with Bitcoin.
Understanding Trendlines
At their core, trendlines are straight lines drawn on price charts to connect a series of prices. By identifying the direction and slope of these lines, traders can discern potential market trends, be they upward, downward, or sideways. The magic of trendlines lies in their simplicity and the profound insights they offer into market psychology and momentum.
Types of Trendlines
Uptrend Line : This bullish line connects a series of higher lows, indicating a growing demand for Bitcoin as traders are willing to buy at increasingly higher prices.
Downtrend Line : In contrast, this bearish line connects a series of lower highs, signaling a selling pressure on Bitcoin as traders are inclined to sell off their holdings at progressively lower prices.
Example of Uptrend
The Power of Support and Resistance
Trendlines can also highlight critical levels of support and resistance:
Support Trendlines suggest areas where prices find a floor, bouncing off these levels rather than breaking through them. For Bitcoin, a strong support trendline can indicate a good buying opportunity.
Resistance Trendlines point to ceilings where prices tend to peak and reverse. For traders, a resistance trendline nearing breach could signal a potential sell or a strategic point to go short.
Applying Trendlines to Bitcoin Trading
Bitcoin's price movements, marked by sharp rallies and corrections, make it a prime candidate for trendline analysis. Here's how to effectively apply this technique to Bitcoin trading:
Drawing Trendlines
Identify the Trend: Begin by observing Bitcoin's chart to determine the overall trend direction. Is it moving upwards, downwards, or sideways?
Select Key Points: For an uptrend, select the lowest lows; for a downtrend, pick the highest highs. These points will be the anchors of your trendline.
Draw the Line: Connect at least two key points with a straight line. The more points a trendline touches without breaking, the stronger it is considered.
Trading Strategies
Buying on Support: When Bitcoin's price approaches an uptrend line without breaking below it, consider this a potential buying opportunity. It suggests that the price is likely to bounce off the support and continue its ascent.
Example of buying at support
Selling on Resistance: Conversely, if Bitcoin's price nears a downtrend line but fails to break above, it might be time to sell or short, anticipating a price reversal.
Breakouts and Breakdowns: A price break through a trendline can signal a significant shift in market sentiment. A breakout above a downtrend line might indicate a bullish reversal, while a breakdown below an uptrend line could hint at bearish developments.
Advanced Tips
Volume Confirmation: Always look for volume confirmation when a trendline is broken. A breakout with high volume is more likely to signify a genuine shift in trend.
Combine with Other Indicators: For more robust analysis, use trendlines in conjunction with other technical indicators, such as moving averages or the Relative Strength Index (RSI).
Conclusion
Trendlines are a testament to the principle that simplicity often prevails in the complex world of trading. For Bitcoin enthusiasts, mastering this tool can enhance your ability to predict price movements and make informed decisions in the face of volatility. Remember, while trendlines provide valuable insights, they're most effective when used as part of a comprehensive trading strategy, combining technical analysis, fundamental analysis, and sound risk management practices. Embrace the power of trendlines, and let them guide you through the dynamic landscape of Bitcoin trading.
TYPES OF ORDER BLOCKThis educational post is great for beginners who are just starting to grasp the concept of SMC. We've already talked about what an order block is. This time we'll talk about other types of blocks in trading.
✴️ Mitigation Block
Mitigation Block is a sell or buy zone, which is formed when the market structure (BOS) continues. In other words, it is a broken order block and tested, but from the other side.
We all know that when the price is moving along a trend, it is better to open trades in the direction of this trend. The most optimal points for buying and selling are the price pullback. By this logic a mitigation block is formed.
Mitigation Block Sell Scheme
Mitigation Block Buy Scheme
Those who trade classical technical patterns will notice that it is anything but: a support zone becomes a resistance zone, and a resistance zone becomes a support zone. Institutional level traders understand the skills and knowledge of classical technical analysis traders, so they manipulate the price to generate and collect additional liquidity.
In this zone we have our block, an ordinary block, which becomes a mitigated block after an impulse breakout.
Schematically, the Mitigation Block in sell looks like this:
Schematically, Mitigation Block in buy looks like this:
✴️ Breaker Block Smart Money
Breaker Block is a sell or buy zone that is formed when the market structure (BOS) continues. In other words, it is a broken order block and tested, but from the other side. An important difference from a broken Block is that there is a change in market character (CHoCH).
As you have understood, the essence of sell zones and blocks remains the same as in Mitigation Block, but first there is a liquidity grab, and then there is a change in market character (change in market structure). It looks schematically as follows:
Breaker Block Sell Scheme
Breaker Block Buy Scheme
✴️ Rejection Block Smart Money
A Rejection Block is a selling or buying zone that appears on the chart as long candlestick tails at a market high or low.
As in all other cases, the block is formed only after liquidity is grabbed from the previous high/minimum or equal highs/minimums. This is classically referred to as a false breakout or sweep.
Bullish and Bearish Rejection Block
The logic of building and searching for a Rejection Block is very simple:
Bearish Rejection Block: Swing High, find the highest candle whose high and close are higher than the high and close of the neighbouring candles respectively. The tail (wick) of the candle will be the bearish order block.
Bullish Rejection Block: Swing Low, we find the lowest candle, the minimum and close of which are lower than the minimum and close of the neighbouring candles respectively. The tail (wick) of the candle will be a bullish order block. It does not matter what colour the candle is. At the maximum it can be not only bullish but also bearish, and at the minimum it can be not only bearish but also bullish. This is worth paying attention to. Look for the highest candle, with the highest open or close and with the highest wick (same in the opposite direction).
✴️ Vacuum Block Smart Money
A block stands out as a regular gap - from the high of the first candle to the low of the second candle in an up gap and vice versa, from the low of the first candle to the high of the second candle in a down gap.
We can expect 2 variants of price movement: in continuation, return to the gap zone to fill it partially or completely. This is based on the presence and size of the block order.
Complete gap filling
Complete gap filling of the price void can be expected if there is an order block that is above or below the Vacuum Block. The price can bounce from the beginning of Vacuum Block, but in order to reduce the risk it is better to wait until the block is fully closed and touched.
Partial filling of the gap
A partial filling of the price void can be expected if the order block is below or above the Vacuum Block, but they overlap. The price can rebound from the beginning of the Vacuum Block, as well as overlap it completely. This is shown schematically in the figure above.
✴️ Conclusion
You should realize that you don't need to click the "buy" or "sell" buttons where you see one of the block options. An order block is simply a price range where you can consider buying or selling, depending on your preliminary analysis and determining the context of the price movement. You will trade from every block a capital loss is guaranteed. Price moves for liquidity. This is the main analysis, and only then we look for the place (blocks) where we can jump from a less risky place.

Trading Options: Setups and Rules In a previous video, I explained my share trading strategy, specifically for choppy markets (available here):
But many of you have asked about when I decide to take options over shares and what setups do I look for.
This video covers my own option rules and setup guidelines.
Key points from the video:
Always wait for re-tests of support and resistance. Second is good, third is best!
Always draw out intra-day trends via trendlines. This alerts you to changes in market condition.
Confirm breakouts by marking re-test highs and re-test lows (explained in more detail in the video)
Thanks for watching and as always, safe trades!

A simple guide to creating a solid portfolio.Hello,
Creating a solid portfolio can be a tough task for most investors. Understanding easy ways of beginning that journey can greatly improve your performance as an investor & greatly amplify your results.
The times of just buying the S&P and waiting for your money to keep growing is long gone & active investing can widen the gap between yourself and the normal investor. Below we will be guiding on how you can future proof your stock picks using the NAS100 as an example & point of beginning.
1: Understand the index
Understanding the index you want to begin with is the 1st point to look at. This will help you choose the correct index for your journey. In our case The Nasdaq 100 is an index of the hundred largest non-financial stocks listed on the NASDAQ stock exchange. The companies included in this index are often technology or biotechnology firms.
2: Do an analysis of where the index is trading at
A simple analysis of where the index is trading at guides you on where most of its components would be trading at. In our case the index is correcting giving as hope that we will easily find companies that are in great points for future buys. The health of the companies will be key in our choices.
The chart below shows that we are in correction
3: Know the components of your index
All the components of the NAS 100 can be easily found on the tradingview.sweetlogin.com website via link tradingview.sweetlogin.com A simple google search will also list all this companies for you. The NAS 100 has 100 components meaning that you have 100 companies to look at. For the purpose of this educational post we will be looking at the biggest 3 companies in the index.
We shall evaluate the 3 companies using both fundamental analysis & technical analysis. From fundamental analysis we shall look at key metrics in the balance sheet (does the company have debt), From the income statement (Are revenues steadily increasing over time) & Cashflow statement (Does the company have positive free cashflow). Please note that you can always get deeper with understanding the companies more. Companies that you can access their products are even better for retail investors.
Next, we shall evaluate the 3 companies from a technical view using wave analysis. We shall then make calls on whether we are looking for buys or sells or wait recommendations.
The 3 companies we shall evaluate are Microsoft, Apple & Alphabet.
Company 1: Microsoft
Microsoft Corp engages in the development and support of software, services, devices, and solutions. It operates through the following business segments: Productivity and Business Processes; Intelligent Cloud; and More Personal Computing.
Key metrics
1: Does the company have debt: (Yes) 2023: Total debt 79.44 billion : Total Debt represents all the interest-bearing obligations of the company, regardless of when these obligations are due for payments.
2:Are revenues steadily increasing over time? Yes ( 2021: USD 168 billion, 2022: USD 198.27 billion, 2023: USD 211.92 billion)
3: Does the company have positive free cashflow
Yes (2023: USD 59.48)
Technical analysis
Company 2: Apple
Apple, Inc engages in the design, manufacture, and sale of smartphones, personal computers, tablets, wearables and accessories, and other variety of related services.
Key metrics
1: Does the company have debt: Total debt: Total debt USD 123.93 billion : Total Debt represents all the interest-bearing obligations of the company, regardless of when these obligations are due for payments.
2:Are revenues steadily increasing over time? YES
2021: USD 365.82 B 2022: USD 394.33 B 2023: USD 383.29 B
3: Does the company have positive free cashflow: YES; USD 99.58 billion
Technical analysis
We have an alert for buy from USD 170.8 areas
Company 3: Alphabet
Alphabet, Inc is a holding company. It operates through the Google segment which includes its main Internet products such as ads, Android, Chrome, hardware, Google Cloud, Google Maps, Google Play, Search, and YouTube.
Key Metrics
1: Does the company have debt: YES USD 29.87 B
2: Are revenues steadily increasing over time? YES. 2022: USD 280.88 B, 2023: USD 307.16B
3: Does the company have positive free cashflow: YES. USD 69.50 Billion
Technical analysis
Buying at current place not good. Look for sell if price breaks trendline aggressively.
Below are our recommendations for the 3 stocks.
Microsoft: No trade setup
Apple: Look for buy from USD 170.8 areas
Alphabet: Buying at current place not good. Look for sell if price breaks trendline aggressively.
We will then look at all the other stocks that make the components of the index using the above metrics & choose the best stocks to invest in.
Good luck in your journey. We shall be sharing more educational content.
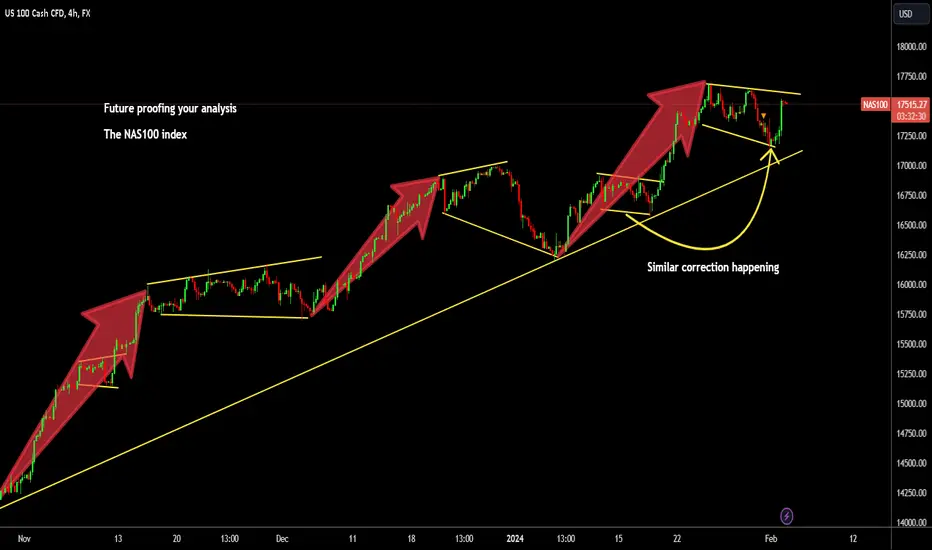
Bitcoin REALISM I am definitely not going to win any popularity competitions with my comments and thoughts. But that's not the point when it comes to making money.
The main issue for me still in Crypto Land is the lack of realism. The image on the front cover was from a google search of "realism" I guess the confused face made my day. This is exactly how you need to be looking when you read these points below.
I have explained the logic of every major move over the last couple of years and this guys - is no different.
So let's start by exploring the reality of market cap for one. When you buy a stock you have a number of stocks in circulation times that by the price and you can get a market cap. Of course, unlike most companies on the exchange Bitcoin CANNOT just issue new stock. We have to remember some Bitcoin are gone and lost forever so this number will likely end up around 20million and not the full 21m.
The current Market cap is roughly 19,806,000 x $42,897.
Let's call it a little over 820 Billion.
At the ATH of $69,000 we saw $1.302 Trillion.
Lets look at what is needed and an angle of attack if Bitcoin was to hit $500k by Jan 25, 26, 27, 28 or 2029.
This is only one aspect of the story.
Prior to the ETF launch people were saying silly things like "Trillions coming in, $100k imminent"
Blackrock's largest ETF is roughly $354 Billion. This is the SP500 fund founded back in 2001. So 23 years old roughly now.
Here's the actual chart.
What does this mean?
Well, let's say Blackrock decided to close their biggest ETF and throw it all into Bitcoin. That level would still not take us back to the current ATH.
Bullish, Bullish, Bullish - we are still $25,000+ under the current ATH.
So what about other ETF's? Obviously the market is bigger than just Blackrock. Let's look at this aspect too.
Look at the end of 2021 as the ETF market collectively was at it's high. We are talking about $10Trillion in 8,552 ETF's.
I've posted several times about the current COT landscape.
Clearly social media Bitcoin is buzzing and everyone is about to become rich, it's different this time and so on. Well, COT says otherwise.
Back at the top when everyone was calling for $135,000 I said the reason for the drop would be liquidity.
So why is this different?
I said there were two likely scenario's on the table as we moved down. The first was we were in an early stage accumulation, we needed to go up to 32k and back down to the low 20's. This would allow us to travel much higher and sustain such a large move.
The second option was bearish.
Well, I guess the second move played out.
The momentum is still clearly not with us - we are still FWB:25K + under the current ATH - not what one would or should expect after 12 Bitcoin specific ETF's obtaining approval & launching.
Look at the momentum
People seem to fall into the echo chamber and all logic leaves the building. I have been at this game a long, long time. Seen it all before and I am sure I will see it again.
This does not mean I am Bearish or anti Bitcoin - not for one second. I am one of the lucky ones in at the right time, sold a lot on the way up and happy with the current holdings.
All I am trying to emphasis here - is don't get sucked into the void which is not supported by ANY sound logic.
I recently watched a couple of video's with Warren Buffet, another with Jim Rickards.
They both explained something very interesting in a very clear way. Although Anti Bitcoin - what they said made a lot of sense. The same lesson kinda applies to things like gold.
When you buy an asset, the asset can produce for you. So assume you buy a house - you get rental income each month and with the price of the property going up over time you make gains there. Buy a business same thing - Buffet explained this using a farm as the example. Sell grains, cows or whatever you farm. Over time you still hold the asset.
This isn't true for the likes of diamonds, gold or Bitcoin.
Hence it fits into the greater fool theory.
If I sell you my last bitcoin I picked up for less than $200.
You buy it all today at $42,850. You have to find someone else willing to pay you more than the $42,850 in the future. For me, this is the main reason I don't personally care up or down or sideways here. But many in the echo chamber do.
The average price across the breakeven addresses are around $37k - this is Breakeven not profit. So imagine majority of the retail crowd with an average entry after DCA'in at $37k.
These are all things to keep in mind when your playing shorter term moves. ETF's are structured in such a way long term growth can be expected, volatility get's somewhat reduced. You noticed what's happened on the weekends since the launch?
So whilst I expect it to go up in the long run. We need a healthy pullback as to be expected. This gives more time for real accumulation to happen - but this will also put some stress on that average (BE) level of $37k.
Just keep this in mind and one more thing if you want to comment on "oh your wrong - up only" give some logic to support it or I won't bother responding. This move will take time. For me, nothing has changed since 2022. We are not ready for new highs - YET...
Anyway enjoyed or not I thought it was worth another educational post.
Stay safe!
Disclaimer
This idea does not constitute as financial advice. It is for educational purposes only, our principle trader has over 20 years’ experience in stocks, ETF’s, and Forex. Hence each trade setup might have different hold times, entry or exit conditions, and will vary from the post/idea shared here. You can use the information from this post to make your own trading plan for the instrument discussed. Trading carries a risk; a high percentage of retail traders lose money. Please keep this in mind when entering any trade. Stay safe.
Ultra-Fast Scalping Strategies in ForexUltra-Fast Scalping Strategies in Forex
Scalping is a high-speed trading strategy that targets quick profits from small price movements. It's a method that appeals to those who want a hands-on, immediate trading experience. This article delves into three of the best 1-minute scalping strategies: Heikin-Ashi Pullback, RSI Extremes, and Stochastic Oscillator Quick Signal, explaining their nuances and applications in a trading environment.
What Is Scalping?
Scalping is a trading strategy focused on capturing small price movements in financial markets. Traders employing this tactic aim to gain several pips – tiny increments in price – from each trade, often executing dozens or even hundreds of trades in a single day. Due to the high frequency of trades, transaction costs and speed are significant considerations.
This strategy requires a deep understanding of market trends, real-time data analysis, and a disciplined approach to risk management. While scalping is commonly used in forex markets, it's applicable to stocks, commodities, and other financial instruments.
To see how these ultra-fast scalping strategies work in practice, consider using FXOpen’s free TickTrader platform. There, you’ll find all of the tools discussed in this article waiting for you.
Heikin-Ashi Pullback
The Heikin-Ashi Pullback strategy focuses on identifying pullbacks within established trends using Heikin-Ashi candlestick charts. By pinpointing moments when the trend briefly reverses, this strategy offers traders an opportunity to enter the market with the anticipation that the dominant trend will resume.
Entry
Traders may observe a clear trend with consecutive Heikin-Ashi candles in one colour.
During a bearish trend with red candles, many traders wait for the candles to turn green, signalling a pullback. Entry is typically considered when a red Heikin-Ashi candle appears after one or more green pullback candles.
Conversely, during a bullish trend with green candles, traders often wait for the candles to turn red, indicating a pullback. Entry is generally initiated when a green Heikin-Ashi candle appears after one or more red pullback candles.
Stop Loss
A stop-loss is commonly placed at the high or low of the entry candle.
Alternatively, traders may set it above or below a nearby swing point for additional safety.
Take Profit
The position is usually closed when a single opposite-coloured candle appears.
Some traders opt to exit when the trend reaches a predetermined resistance or support level.
The Heikin-Ashi Pullback strategy capitalises on the market's natural ebb and flow. By entering during a pullback, traders aim to benefit from the market's tendency to resume its prevailing trend. This ultra-fast scalping strategy provides a structured approach to identify high-probability entry and exit points, making it a favoured choice among scalpers.
RSI Extremes
The RSI Extremes strategy is often highlighted as one of the best scalping strategies, especially when used as a 1-minute forex scalping strategy. It uses the Relative Strength Index (RSI) with a period setting of 7 to identify potential reversals at extreme overbought or oversold levels.
Entry
Traders typically use a 7-period RSI applied to a 1-minute chart.
An entry may be considered when the RSI crosses above 80 and subsequently moves back below, indicating a potential short position.
Similarly, an entry point can be seen when the RSI dips below 20 and then moves back above, suggesting a long position.
Stop Loss
A common approach is to place a stop-loss a few pips above or below the entry candle.
Alternatively, traders may opt for a stop-loss above or below a nearby swing high or low for additional risk management.
Take Profit
Take-profit levels are generally set near a key support or resistance level.
Another option is to exit the trade when RSI approaches the 50-level, signalling diminishing momentum.
The RSI Extremes strategy leverages the RSI's effectiveness in identifying market extremes. Traders capitalise on brief price reversals, providing a structured way to enter and exit trades in line with market momentum.
Stochastic Oscillator Quick Signal
The Stochastic Oscillator Quick Signal serves as an easy forex scalping strategy designed to capture short-term price movements. Using the Stochastic Oscillator, traders can identify overbought and oversold conditions to make timely entries and exits.
Entry
Many traders apply a Stochastic Oscillator with settings (14, 3, 3) to a 1-minute chart.
Entry points are often considered when the %K line (blue) crosses above the %D line (orange) and both are below 20, suggesting a long position.
Conversely, traders may look for an entry when the %K line crosses below the %D line and both are above 80, indicating a potential short position.
Stop Loss
A stop-loss is usually placed a few pips away from the entry point.
Alternatively, it can be set above or below a nearby swing high or low as an additional safety measure.
Take Profit
Many traders set the take-profit level when the Stochastic Oscillator reaches the opposite extreme.
Another approach is to close the position when a divergence occurs between the price and the oscillator.
This strategy employs the Stochastic indicator, an ideal 1-minute scalping strategy indicator, for detecting quick reversals in market momentum. By employing this indicator, traders aim to take advantage of brief oversold or overbought conditions to make rapid gains.
The Bottom Line
Navigating the fast-paced world of scalping can be challenging, but with the right strategies and tools, it's possible to find success. Each of the strategies discussed offers a unique way to approach the market and seek out profit opportunities. Still, it’s worth noting that they should be modified in accordance with a trader’s unique trading approach.
For traders eager to put these strategies into practice, consider opening an FXOpen account. You’ll gain access to hundreds of markets, competitive trading costs, and lightning-fast execution speeds – all crucial aspects for scalping trading success. Good luck!
This article represents the opinion of the Companies operating under the FXOpen brand only. It is not to be construed as an offer, solicitation, or recommendation with respect to products and services provided by the Companies operating under the FXOpen brand, nor is it to be considered financial advice.
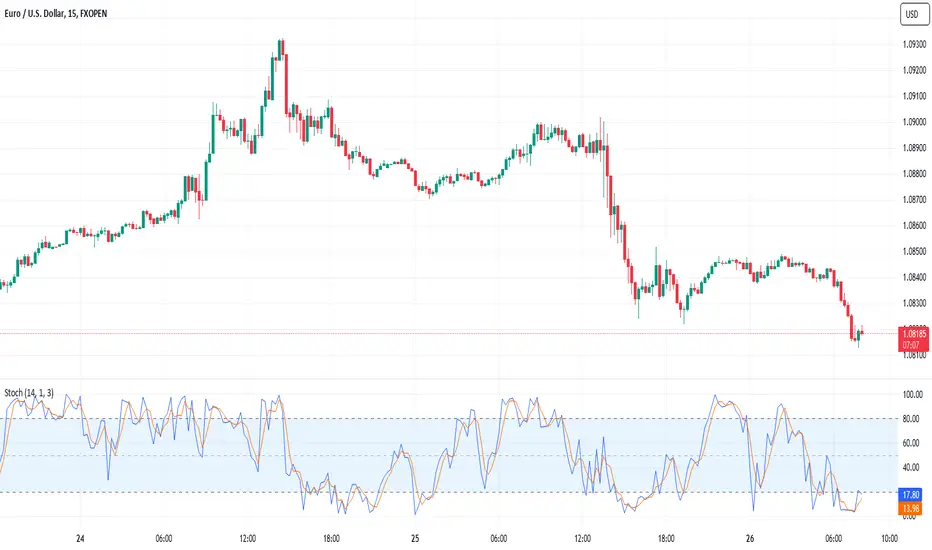
Trading Converging Chart PatternsWe discussed identification and classification of different chart patterns and chart pattern extensions in our previous posts.
Algorithmic Identification of Chart Patterns
Flag and Pennant Chart Patterns
In this installment, we shift our focus towards the practical trading strategies applicable to a select group of these patterns. Acknowledging that a universal trading rule cannot apply to all patterns, we narrow our examination to those of the converging variety.
We will specifically address the following converging patterns:
Rising Wedge (Converging Type)
Falling Wedge (Converging Type)
Converging Triangle
Rising Triangle (Converging Type)
Falling Triangle (Converging Type)
This selection will guide our discussion on how to approach these patterns from a trading perspective.
🎲 Historical Bias and General Perception
Each pattern we've discussed carries a historical sentiment that is widely regarded as a guideline for trading. Before we delve into our specific trading strategies, it's crucial to understand these historical sentiments and the general market interpretations associated with them.
🟡 The Dynamics of Contracting Wedge Patterns
Contracting Wedge patterns are typically indicative of the Elliott Wave Structure's diagonal waves, potentially marking either the beginning or conclusion of these waves. A contracting wedge within a leading diagonal may experience a brief retracement before the trend resumes. Conversely, if found in an ending diagonal, it could signal the termination of wave 5 or C, possibly hinting at a significant trend reversal.
The prevailing view suggests that these patterns usually precede a short-term directional shift: Rising Wedges are seen as bearish signals, while Falling Wedges are interpreted as bullish. It's essential to consider the trend prior to the formation of these patterns, as it significantly aids in determining their context within the Elliott Wave cycles, specifically identifying them as part of waves 1, A, 5, or C.
For an in-depth exploration, refer to our detailed analysis in Decoding Wedge Patterns
🎯 Rising Wedge (Converging Type)
The Rising Wedge pattern, historically viewed with a bearish bias, suggests that a downward trend is more likely upon a breakout below its lower trend line. This perception positions the pattern as a signal for traders to consider bearish positions once the price breaks through this critical support.
🎯 Falling Wedge (Converging Type)
The Falling Wedge pattern is traditionally seen through a bullish lens, indicating potential upward momentum when the price surpasses its upper trend line. This established viewpoint suggests initiating long positions as a strategic response to such a breakout, aligning with the pattern's optimistic forecast.
🟡 Contracting Triangle Patterns
Contracting Triangles, encompassing Converging, Ascending, and Descending Triangles, are particularly noteworthy when they appear as part of the Elliott Wave's B or 2 waves. These patterns typically signal a continuation of the pre-existing trend that preceded the triangle's formation. This principle also underpins the Pennant Pattern, which emerges following an impulse wave, indicating a pause before the trend's resumption.
🎲 Alternate Way of Looking into Converging Patterns
Main issue with historical perception are:
There is no clear back testing data to prove whether the general perception is correct or more profitable.
Elliott Waves concepts are very much subjective and can be often difficult for beginners and misleading even for experts.
So, the alternative way is to treat all the converging patterns equally and devise a method to trade using a universal way. This allows us to back test our thesis and be definitive about the profitability of these patterns.
Here are our simple steps to devise and test a converging pattern based strategy.
Consider all converging patterns as bidirectional. Meaning, they can be traded on either side. Thus chose to trade based on the breakout. If the price beaks up, then trade long and if the price breaks down, then trade short.
For each direction, define criteria for entry, stop, target prices and also an invalidation price at which the trade is ignored even without entry.
Backtest and Forward test the strategy and collect data with respect to win ratio, risk reward and profit factor to understand the profitability of patterns and the methodology.
Now, let's break it further down.
🟡 Defining The Pattern Trade Conditions
Measure the ending distance between the trend line pairs and set breakout points above and beyond the convergence zone.
🎯 Entry Points - These can be formed on either side of the convergence zone. Adding a small buffer on top of the convergence zone is ideal for setting the entry points of converging patterns.
Formula for Entry can be:
Long Entry Price = Top + (Top - Bottom) X Entry Ratio
Short Entry Price = Bottom - (Top-Bottom) X Entry Ratio
Whereas Top refers to the upper side of the convergence zone and bottom refers to the lower side of the convergence zone. Entry Ratio is the buffer ratio to apply on top of the convergence zone to get entry points.
🎯 Stop Price - Long entry can act as stop for short orders and the short entry can act as stop price for long orders. However, this is not mandatory and different logic for stops can be applied for both sides.
Formula for Stop Can be
Long Stop Price = Bottom - (Top - Bottom) X Stop Ratio
Short Stop Price = Top + (Top - Bottom) X Stop Ratio
🎯 Target Price - It is always good to set targets based on desired risk reward ratio. That means, the target should always depend on the distance between entry and stop price.
The general formula for Target can be:
Target Price = Entry + (Entry-Stop) X Risk Reward
🎯 Invalidation Price - Invalidation price is a level where the trade direction for a particular pattern needs to be ignored or invalidated. This price need to be beyond stop price. In general, trade is closed when a pattern hits invalidation price.
Formula for Invalidation price is the same as that of Stop Price, but Invalidation Ratio is more than that of Stop Ratio
Long Invalidation Price = Bottom - (Top - Bottom) X Invalidation Ratio
Short Invalidation Price = Top + (Top - Bottom) X Invalidation Ratio
🟡 Back Test and Forward Test and Measure the Profit Factor
It is important to perform sufficient testing to understand the profitability of the strategy before using them on the live trades. Use multiple timeframes and symbols to perform a series of back tests and forward tests, and collect as much data as possible on the historical outcomes of the strategy.
Profit Factor of the strategy can be calculated by using a simple formula
Profit Factor = (Wins/Losses) X Risk Reward
🟡 Use Filters and Different Combinations
Filters will help us in filtering out noise and trade only the selective patterns. The filters can include a simple logic such as trade long only if price is above 200 SMA and trade short only if price is below 200 SMA. Or it can be as complex as looking into the divergence signals or other complex variables.