Decoding Forex Mysteries: USDCHF & EURGBP Reaction to Rate HikesWelcome to the intriguing world of Forex, where currencies act at their own rhythm, sometimes defying expectations and confounding even the most experienced traders. In this article, we are going to unravel the “mysteries” surrounding the reactions of USDCHF and EURGBP to recent interest rate hikes. We will dive into the realms of market anticipation, monetary policy statements, and the significance of staying ahead in this dynamic landscape.
1. The Resilience of USDCHF
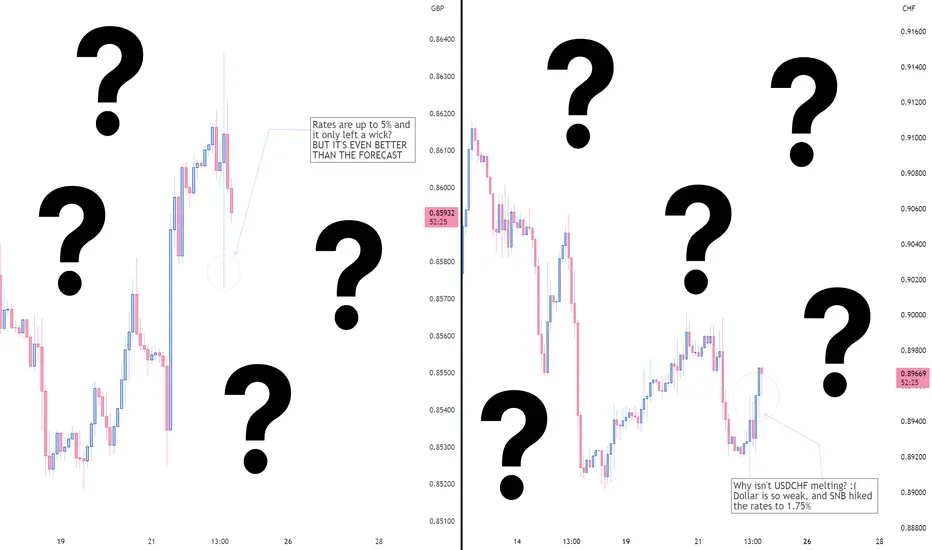
As the Swiss National Bank (SNB) raises interest rates from 1.5% to 1.75%, market observers brace for the anticipated downward movement of the USDCHF. However, contrary to expectations, the currency pair displays remarkable resilience. Let's explore the underlying factors:
a) Priced-in Expectations: The forex market is renowned for its ability to assimilate information in advance. It is likely that market participants had already factored in the interest rate hike, blunting the immediate impact on USDCHF. Such anticipatory behavior highlights the importance of staying attuned to prevailing sentiment and analyzing market positioning.
b) Comparative Interest Rates: Understanding the relative interest rates of different currencies is paramount. If the rate hike in Switzerland was aligned with or lower than market expectations, and other major currencies offered more attractive rates, investors might have favored those currencies, mitigating the downward pressure on USDCHF.
c) Monetary Policy Statement Outlook: Monetary policy statements accompanying interest rate decisions provide crucial insights into central banks' future intentions (you can usually watch them live on YouTube 30 minutes after the data release or on Bloomberg type of channels). Since the SNB's statement revealed a cautious and neutral stance, it has tempered the impact of the rate hike on USDCHF. Market participants pay close attention to forward guidance, as it shapes expectations regarding future policy actions and influences currency movements.
2. The Curious Behavior of EURGBP
Let us now turn our attention to EURGBP, which failed to sustain a short sentiment following the Bank of England's interest rate hike from 4.5% to 5.00% (versus the expected 4.75%) and left a nasty week. To understand this curious behavior, we delve into the following factors:
a) Market Expectations: The forex market is often driven by expectations and anticipatory positioning. If traders had already priced in the interest rate hike, the actual announcement might not have triggered a significant market reaction. Therefore, the lack of sustained short sentiment in EURGBP could be attributed to market participants adjusting their positions in advance. The GBP was up already by 4% within the last month against major currencies, so a big chunk of market was already longing EG for the expected short term recovery (guilty, but we also made a 2.9% profit closure on this).
b) Monetary Policy Outlook: Beyond interest rate changes, central banks' monetary policy outlooks play a vital role in shaping currency dynamics. The accompanying statement from the Bank of England, which shed light on their future plans, indicated a more gradual approach to tightening or expressed concerns about economic conditions. Such cues influence market sentiment and limit the downward pressure on EURGBP. In case of UK, this is already not a good look with their inflation rates :/
Now, you may ask: “Investroy, what do we do if fundamentals don’t exhibit the expected economical impact?” Don’t worry, we got you!
A Prerequisite for Success In the ever-evolving forex market, staying ahead of the curve is crucial. To navigate the intricacies and maximize opportunities, traders must adopt a proactive approach:
a) Monitor Central Bank Communications: Understanding central banks' intentions requires careful analysis of their policy statements, speeches, and press conferences. These sources provide valuable clues about future policy decisions and can guide trading strategies.
b) Assess Economic Indicators: Keep a keen eye on economic indicators that impact currency valuations, such as GDP, inflation, and employment data. These indicators provide a foundation for understanding a country's economic health and can influence currency movements.
c) Stay Informed of Geopolitical Developments: Geopolitical events, such as trade disputes or political instability, can significantly impact forex markets. Being aware of these developments and their potential consequences on currency movements is crucial for staying ahead.
d) Analyze Market Sentiment: Sentiment analysis, gauging the collective psychology of market participants, can offer valuable insights. Monitoring market sentiment through various indicators, such as positioning data and sentiment surveys, helps identify potential shifts and align trading strategies accordingly.
e) Embrace Technological Tools: Utilize advanced trading platforms and tools that provide real-time data, customizable charts, and algorithmic trading capabilities. These resources empower traders to analyze market trends, spot patterns, and execute trades swiftly.
Bonus) this one is a little subjective, but markets are very cyclic, if something is oversold, but everybody is expecting further bearish move, be sure there is a retracement coming before that happens 😊
Stay safe and enjoy your day!
Community ideas
Understanding Market Corrections:Definition & Key ConsiderationsInvesting in the stock market has the potential to generate substantial wealth over the long term, although it comes with inherent risks. One notable obstacle that investors frequently encounter involves safeguarding their capital during periods of declining stock prices. When the market undergoes a downturn, the inclination to panic and sell off investments to evade additional losses can be strong. However, this reactive approach often results in even greater financial setbacks and hinders the ability to capitalize on future market rebounds. In this comprehensive article, we will delve into the concept of a market correction and delve into various strategies that can assist investors in preserving their capital amidst market downturns, enabling them to emerge stronger when the market inevitably recovers.
Market Correction: A Comprehensive Explanation
In the realm of financial markets, a market correction is a notable event characterized by a substantial decline in the value of a financial instrument. This decline typically ranges between 10% to 20% and can encompass individual stocks of a specific company or even extend to encompass entire market indices comprising a vast array of companies. The duration of a correction can vary significantly, ranging from as short as a single day to as long as a year, with the average duration spanning approximately four months.
Market corrections can be triggered by a myriad of factors, each with its own unique catalyst. These factors can range from a company's disappointing financial performance and weak earnings report to more extensive global geopolitical conflicts. In some instances, corrections may occur seemingly without any discernible external cause.
It is worth noting that market corrections are not exclusive to stocks alone. They can manifest in various other financial instruments such as commodities like oil, platinum, and grain, as well as currencies, funds, specific industry sectors, or even the entire market as a whole. This exemplifies the widespread impact that a correction can have across diverse segments of the financial landscape.
To illustrate the significance of a market correction, let's consider an example from recent history. In the year 2018, the prices of over 500 companies experienced a decline of 10% or more. This widespread correction exemplifies how fluctuations in market conditions can influence a substantial number of companies simultaneously, affecting their valuation and investor sentiment.
In conclusion, a market correction denotes a notable decline in the value of financial instruments, with the range typically falling between 10% to 20%. The causes behind these corrections can be diverse and encompass factors ranging from company-specific issues to broader global conflicts. Moreover, corrections can impact various financial instruments and market segments, underscoring their potential for wide-reaching consequences within the financial landscape.
Example : AMZN stocks Daily chart showing a correction in 2018 - 2020
Market corrections are not uncommon events within the realm of financial markets. On average, a decline of 10-20% in the stock market transpires approximately once a year. These corrections, characterized by a significant decrease in stock prices, serve as reminders of the inherent volatility and fluctuations present in the market.
While corrections of 10-20% occur relatively frequently, more profound market declines exceeding 20% are less frequent, transpiring approximately once every six years. These substantial corrections are often referred to as market collapses, signifying a more severe and prolonged downturn.
One illustrative example of a market collapse occurred in response to the global pandemic outbreak in March 2020. The COVID-19 pandemic triggered a swift and severe decline in stock markets worldwide, leading to a precipitous drop of approximately 38% within a matter of days. This extreme correction exemplifies the impact of unforeseen events and external factors on market stability and investor sentiment.
It is important to recognize that market corrections and collapses are not solely confined to a particular asset class or geographic region. They can have a broad-ranging effect, transcending national boundaries and impacting various financial instruments, indices, and markets worldwide.
In summary, market corrections, defined by significant declines in stock prices, are regular occurrences, transpiring approximately once a year with a magnitude of 10-20%. Market collapses, on the other hand, encompass more profound declines exceeding 20% and typically transpire once every six years. These events serve as reminders of the dynamic nature of financial markets and their vulnerability to various factors, such as the recent pandemic-induced collapse in 2020, which had a profound impact on global markets.
Example : SPX500 / US500 stocks Daily chart showing a correction in 2020
Investors who adopt a long-term investment strategy tend to navigate corrections with relative ease, primarily due to their extended investment horizon. By committing their funds for a substantial period, typically ranging from 5 to 10 years, these investors are less likely to be perturbed by temporary price declines. On the other hand, individuals who rely on leverage or engage in short-term trading bear the brunt of corrections, experiencing greater challenges and losses.
The impact of a correction can be readily observed by examining the chart depicting the historical performance of any given company. By selecting the annual or five-year chart display, one can identify specific time periods when the asset's value experienced temporary declines. Additionally, it is crucial to consider the decrease in stock price subsequent to the ex-dividend date, commonly referred to as the dividend gap. It is essential to note that the dividend gap phenomenon is distinct from a correction and should be treated as such.
What Causes A Correction?
A correction in the stock market can be triggered by a multitude of factors and events that impact stock prices. These events can range from speeches given by company executives, investor reports, pandemics, regulatory changes, economic sanctions, natural disasters like hurricanes and floods, man-made disasters, to high-level meetings of world leaders. Even the most stable companies can experience declines in their stock prices due to these events.
It is important to recognize that human behavior also plays a significant role in causing market corrections. The stock market is inherently driven by human participation and investor sentiment, which can sometimes lead to corrective actions. For instance, if a popular figure like Elon Musk garners significant attention and support, investors may pour money into his company beyond its actual earnings. Eventually, the overvaluation of such a "hyped" company may result in a decline in its stock price.
Furthermore, investors often attempt to follow trends in the market. When a particular stock shows an upward trajectory, more people tend to invest in it, thus increasing its demand and subsequently driving up its price. However, as the price reaches a certain peak, some investors choose to sell their holdings to realize profits. This selling pressure can initiate a correction, causing those who entered the market later to incur losses. Therefore, blindly chasing market trends without careful analysis may prove detrimental.
Additionally, corrections can exhibit seasonal patterns. For example, during the summer months, prior to holidays or extended weekends, investor participation in trading may decrease. This reduced trading activity leads to lower liquidity in stocks, creating an opportunity for speculators to exploit the situation. Such periods often witness sharp price fluctuations, potentially resulting in stock prices declining by 10-20%.
It is crucial to understand that corrections are a natural part of the market cycle, and it is neither productive nor feasible to fear them indefinitely. The market cannot sustain perpetual growth, and corrections serve as necessary adjustments. By acknowledging their inevitability, investors can adopt strategies that are mindful of market dynamics and position themselves accordingly.
How Long Do Corrections Last?
Between the years 1980 and 2018, the US markets experienced a total of 37 corrections, characterized by an average drawdown of 15.7%. These corrections typically lasted for approximately four months before the market began to recover. Consider the following scenario: an investor commits $15,000 in January, experiences a loss of $2,355 during the correction, and by May, witnesses their portfolio rebounding to $15,999, based on statistical data. However, it is important to note that outcomes may deviate from this pattern.
It is worth noting that the magnitude of a stock's decline directly impacts the duration of its recovery. As an illustration, during the financial crisis of 2008, US stocks tumbled by approximately 50%. The subsequent recovery of the stock market extended over a period of 17 months, primarily attributed to the active support provided by the US government and the Federal Reserve. This underscores the notion that severe market downturns necessitate more prolonged periods for recuperation, even with significant intervention from regulatory bodies.
Dow Jones Industrial Average index drop in 2008
The timing of a market correction is often challenging for financiers and experts to predict with certainty. In retrospect, it becomes clear when a correction started, but identifying the precise moment beforehand is a complex task. Taking the aforementioned example of the market collapse in October 2007, it was not officially acknowledged until June 2008. This highlights the inherent difficulty in pinpointing the onset of a correction in real-time.
Following a correction, the market's recovery period can vary significantly. In some instances, the market may swiftly regain stability and resume an upward trajectory. However, in other cases, it may take several years for the market to fully recover from a correction. The duration of the recovery depends on a multitude of factors, including the severity of the correction, underlying economic conditions, government interventions, and investor sentiment.
Hence, it is crucial to recognize that financiers and market participants can only definitively determine the start and extent of a correction in hindsight. The future behavior of the market after a correction remains uncertain, and it is possible for the market to swiftly recover or take a considerable amount of time to regain stability.
How To Predict A Correction
Predicting the precise timing, duration, and magnitude of a market correction is inherently unreliable and challenging. There is no foolproof method to accurately forecast when a correction will occur, when it will conclude, or the extent to which asset prices will change.
Some economists and analysts attempt to predict market trends by employing various theories. For instance, Ralph Elliott formulated the Elliott Wave Theory, which posits that markets move in repetitive waves. By determining the current phase of the market—whether it is in an upward or downward wave—one could potentially profit. However, if such theories consistently yielded accurate predictions, financial losses during corrections would be virtually nonexistent.
It is crucial to acknowledge that market corrections are an inherent and inevitable part of market cycles. While attempting to predict corrections may be enticing, it is important to remember that they will inevitably occur, regardless of how long it has been since the previous one. Relying solely on the absence of a correction for an extended period as a basis for investment decisions warrants careful consideration and analysis rather than being treated as a definitive indicator.
Advantages And Disadvantages Of Market Correction
Advantages and disadvantages of market corrections can be summarized as follows:
Advantages of a market correction:
1) Buying opportunities: Market corrections often present favorable buying opportunities for investors. Lower stock prices allow investors to acquire shares at discounted prices, potentially leading to long-term gains when the market recovers.
2) Rebalancing opportunities: Corrections can prompt investors to rebalance their portfolios. Selling overvalued assets and reinvesting in undervalued ones can help optimize investment returns and maintain a diversified portfolio.
3) Expectation adjustment: Market corrections can serve as a reality check, helping investors reassess their expectations and risk tolerance. This can lead to more informed investment goals and strategies.
Disadvantages of a market correction:
1) Financial losses: Market corrections can result in substantial losses, particularly for investors who panic and sell their investments at lower prices. Reacting emotionally to market downturns may amplify the negative impact on portfolios.
2) Economic implications: Market corrections can have broader economic repercussions. They may lead to job losses, reduced consumer spending, and slower economic growth, potentially affecting industries and sectors beyond the financial markets.
3) Psychological impact: Market corrections can trigger fear, uncertainty, and anxiety among investors. These emotions may drive impulsive decision-making, such as selling investments hastily or hesitating to re-enter the market when conditions improve.
It is important for investors to carefully evaluate the potential advantages and disadvantages of market corrections and consider their own risk tolerance, investment goals, and long-term strategies when navigating such market events.
What Should You Do During A Correction?
Correction can make an investor richer or poorer or have no effect at all. The impact of a market correction on an investor's wealth depends on their actions and decisions during that period. It is impossible to predict with certainty the duration or direction of asset value changes during a correction.
However, there are general tips that can help investors navigate through a correction and potentially safeguard their finances:
1) Maintain a calm and rational mindset: During a correction, it is crucial to approach investment decisions with a cool head. Instead of making impulsive moves, take the time to understand the underlying causes of the correction and consider expert opinions and news.
2) Avoid excessive borrowing: It is advisable not to use borrowed money for investments, especially during a correction. This reduces the risk of incurring debts and potential losses. For beginners, it is often recommended to limit investments to the funds available in their brokerage accounts, particularly during a correction.
3) Assess company fundamentals: Evaluate the fundamental strength of a company by analyzing key metrics and ratios. Comparing a company's value with others in the same industry can provide insights. If a company is not overvalued, it may indicate that there is no fundamental reason for a correction, and its value may likely recover in due course.
4) View the correction as a buying opportunity: Prominent investors like Warren Buffett and Nathan Rothschild have emphasized that corrections present excellent opportunities for investment. If a stock's price has fallen, consider purchasing it based on the company's performance rather than solely focusing on the size of the discount. Maintaining some savings in cash allows for timely investments in undervalued assets.
5) Acknowledge the normalcy of corrections: It is important to recognize that corrections are a regular part of market cycles and serve as tests of an investor's composure. Following an investment strategy that includes provisions for investing during periods of 10-20% lower stock prices can help protect savings and optimize long-term returns.
By adhering to these general tips and maintaining a disciplined investment strategy, investors can better navigate market corrections and potentially preserve and enhance their financial well-being.
Conclusion
In summary, market corrections are an intrinsic aspect of the stock market's ebb and flow, and it is essential for investors to anticipate and navigate them effectively. During such periods, the inclination to succumb to panic and hastily sell investments can be strong. However, maintaining composure and adhering to prudent strategies that safeguard capital are crucial for weathering corrections and emerging stronger when the market inevitably rebounds. While corrections present challenges, they also offer advantageous opportunities, such as the ability to acquire stocks at discounted prices. Conversely, the potential for substantial losses exists, emphasizing the importance of a measured approach. A long-term investment strategy, rooted in sound analysis rather than reactionary emotions, serves as a vital compass for surviving corrections. By focusing on the broader picture and resisting the temptation of short-term market fluctuations, investors can position themselves for long-term success amidst the natural ebb and flow of the market.
How to Use the Accumulation/Distribution IndicatorLearning how to identify accumulation and distribution in an asset is an important skill to have for any trader. Luckily, there’s a handy tool we can use: the aptly-named Accumulation/Distribution indicator.
In this article, we’ll show you how this accumulation/distribution indicator works, where it’s best applied, and how you can combine it with other tools to boost your odds of success.
What Is the Accumulation/Distribution Indicator?
The accumulation/distribution indicator, also called the accumulation/distribution index, accumulation/distribution line, and abbreviated to A/D, is a cumulative indicator that uses price and volume data to measure the strength of an asset’s trend. It helps traders identify buying and selling pressure in the market and can show whether an asset is likely to continue trending or is due for a reversal. It was created by renowned trader Marc Chaikin, who also developed the famous Chaikin Money Flow indicator.
Accumulation vs Distribution
Accumulation occurs when buying pressure outweighs selling pressure, resulting in price appreciation. Conversely, distribution is where sellers have the upper hand over buyers, creating downward momentum. In practice, the plotted A/D line will move up when accumulation is present and down when distribution occurs.
Accumulation/Distribution Oscillator Formula and Components
The ADI seeks to quantify an asset's buying and selling pressure by considering its trading range and trading volume.
First, it calculates the Money Flow Multiplier (MFM) using the following formula:
MFM= ((Close−Low)−(High−Close)) / High−Low
This results in a reading between -1 and 1. When the price closes in the upper half of its high-low range, the MFM will be positive. If it closes in the lower half, then MFM will be negative. In other words, if buying pressure is strong, the MFM will rise, and vice versa.
Second, it generates the Money Flow Volume (MFV) with the following:
Money Flow Volume = MFM × Volume
For the first candle in a given chart, the MFV is the first A/D value. Since the indicator is cumulative, the MFV is added to the previous A/D value. In essence:
First Calculation = (ADI = MFV)
Subsequent Calculations = (ADI + MFV)
This then creates the A/D line. While it may seem unnecessary to know the formula, it can provide us with significant insight into how an accumulation/distribution rating is given. For example, a strong bullish trend may cause an asset to close high in its trading range, producing an MFM reading close to 1. If this is backed up by high volume, the A/D line will surge upward. However, if the volume is lacking, then the A/D may only increase slightly.
Thankfully, we don’t need to perform this calculation ourselves. With the free TickTrader platform we offer at FXOpen, you’ll find the accumulation/distribution indicator and dozens of other tools ready to help you navigate the markets.
How to Use the Accumulation Distribution Indicator
There are three popular ways to use the A/D indicator: identifying reversals, trend confirmation, and trading breakouts.
Identifying Reversals
One of the most effective uses of A/D is to spot potential reversals using divergences between the price and the A/D line.
A bullish divergence occurs when the price falls, making lower lows, while the A/D line trends upward, creating higher lows. Conversely, a bearish divergence can be seen when an asset makes new highs, but the A/D puts in lower highs.
It essentially shows us that while the price is moving in a specific direction, the underlying pressure supporting the move is waning. The example above demonstrates that fewer sellers are participating as the trend progresses lower; eventually, buyers take over and push the price much higher.
Trend Confirmation
A/D line can also be used to confirm the direction of a trend. In this context, traders monitor the alignment of the line with the price action.
In an uptrend, both the price and A/D should be rising. If the A/D moves in the same direction as the price, it confirms the strength of the uptrend and suggests that the buying pressure is likely to continue. As in the chart, traders could have used the A/D and price alignment to position themselves in the direction of the bull trend.
Similarly, during a downtrend, the price and the A/D should be falling. If the A/D is falling alongside the price, it indicates that the selling pressure is strong, and the downtrend is likely to persist.
Trading Breakouts
Lastly, A/D can help traders confirm breakouts beyond support/resistance levels. If there’s a critical level that a trader is watching to jump in on the breakout, a breakout beyond a similar level in the A/D indicator can signal the start of a new trend.
In the example, we see a strong resistance level, both in price and the accumulation distribution chart. As the move is confirmed by A/D, breaking out above both dashed lines, traders have confidence that the price is ready to move higher.
Integrating the Accumulation and Distribution Indicator with Other Tools
While the A/D indicator is a valuable tool on its own, it’s best to use it in combination with other indicators to help filter out false signals and improve the accuracy of your predictions. Let’s take a look at two indicators to integrate with A/D: moving averages and the Relative Strength Index (RSI).
Moving Averages
Moving averages are a popular tool used by many traders to determine the direction of a trend, especially when two moving averages cross over. As mentioned, the trajectory of the A/D line can show traders that a trend is supported by volume; similarly, a price sitting above or below a moving average can indicate a trend’s direction. Using the two together can provide an at-a-glance reading of a trend, which can be extremely useful for trend-following traders.
In this example, we’ve used the Exponential Moving Average (EMA) cross indicator in TickTrader, with two 20-period and 50-period EMAs. The fast EMA crosses above the slow EMA, showing that a potential bullish trend is forming. The price continues to stay well above the 50-period EMA as time progresses, demonstrating that there’s a strong bull trend.
We also have confirmation from the A/D line that the bullish momentum is backed up by supporting volume. Seeing this, traders can be confident that the trend will continue. When the EMAs cross over bearishly, as seen on the right-hand side, traders may start looking for the A/D line to confirm that a bearish trend has started and exit their position.
RSI
Similar to the A/D indicator, RSI can be used to both spot divergences and confirm trends. The divergences are the same as A/D; a lower low in a price with a higher low in the RSI indicates a potential bullish reversal, while a price making a higher high and a lower low in RSI is regarded as bearish. Meanwhile, an RSI reading above 50 is typically seen as bullish, while below is bearish.
Using the two indicators together can offer traders extra confluence that the market is headed in a particular direction. In the chart shown, we can see that the price is making a lower low. However, the Apple stock’s accumulation/distribution line shows a bullish divergence, as does the RSI.
Traders could have marked the most recent area of resistance (dashed line), and then waited for the price to break out above it before looking for an entry. This move was confirmed by the RSI moving above 50, showing that bullish momentum is truly entering the market and offering multiple factors of confluence.
What to Do Next
You now have a comprehensive understanding of the accumulation/distribution indicator, including its formulation, its three main uses, and how to combine it with other indicators for extra confirmation. Ready to put your newfound knowledge to the test? You can open an FXOpen account to apply what you’ve learned and hone your trading skills across a diverse range of markets, from forex and commodities to stocks and indices.
This article represents the opinion of the Companies operating under the FXOpen brand only. It is not to be construed as an offer, solicitation, or recommendation with respect to products and services provided by the Companies operating under the FXOpen brand, nor is it to be considered financial advice.
Trading Mindfully: Letting Go of Revenge for Financial Success
Sometimes the market can really wear us down mentally and emotionally. Imagine this scenario: you enter a trade feeling confident, having carefully considered and calculated everything. You're in a fantastic mood, already envisioning the profits. And then, unexpectedly, everything goes wrong.
In moments like these, even if you have a solid system and strategy in place, anger and resentment can take over. You might feel the need to seek revenge on the market for what you perceive as an injustice, and impulsively open positions with the intention of punishing it. However, the outcome of such revenge trading is almost always regrettable, resulting in significant financial losses.
Let's take a closer look at what revenge trading entails and why it is so dangerous.
Revenge trading occurs when we believe that the market has taken "too much" from us or treated us unfairly. Instead of stepping back and regaining composure, traders act contrary to every rule and guideline, driven by anger and a desire to prove themselves.
Fueled by a mixture of frustration and determination, traders tend to fall into one of two scenarios: they either open large positions that further amplify their losses, or they manage to recoup some of their losses if luck is on their side. However, the best course of action in such situations is actually to take a break and reflect on the situation at hand.
Attempting to take revenge on a market that is infinitely more powerful than any individual trader is inherently irrational. Moreover, this type of trading has several other negative consequences.
When you trade out of revenge, you are driven by emotion rather than logic and strategy. This approach is destined to fail and can result in even greater losses over time.
At this point, you lose touch with reality, forgetting everything you know and have learned about the market. Your well-thought-out strategies and trading algorithms that used to bring you profits are abandoned.
Effective money management and risk compliance become distant thoughts. You throw all your resources into the blazing fire of revenge.
As a result, you find yourself trading based on intuition, which is no longer a disciplined approach but akin to gambling.
How to Overcome the Urge for Market Revenge
There is a simple yet crucial mechanism that can help traders overcome the desire to seek revenge on the market. The most challenging part, however, is remembering to apply it in practice. Here are some steps to follow:
1: Take a Step Back: When the desire for revenge arises, it's important to slow down your emotions and actions. Step away from the computer and engage in activities that involve fine motor skills, such as solving puzzles or engaging in a hobby. It's detrimental to continuously look at the screen that displays recent losses, as it only amplifies your emotional state. By diverting your attention to non-trading activities, you allow the frontal cortex of your brain, responsible for rational decision-making, to activate. Going for a walk or connecting with a friend can also be effective ways to shift your focus and regain composure.
2: Analyze the Situation: To regain a conscious state and process your emotions, conduct a written analysis of the situation. It's beneficial to do this manually on a plain sheet of paper, utilizing your fine motor skills once again. Describe the entire incident in detail, including your thoughts, emotions, and actions. By gaining a comprehensive understanding of what threw you off balance emotionally, you'll be better equipped to recognize and control those triggers in the future.
3: Evaluate Your Trading Strategy: Every trader relies on a specific algorithm or trading system to make decisions. Take the time to thoroughly examine your trading system and ask yourself some important questions:
- Does your trading system genuinely work?
- If you had followed your system entirely (which you didn't do when seeking revenge), would it have helped minimize losses?
- Are the losses that angered you a result of system losses or a breach of the system's rules?
In addition to studying your trading system, it's crucial to assess your money management rules and ensure you are effectively managing risks. Proper risk management acts as insurance, protecting you from substantial losses. Regardless of market fluctuations, you can confidently close trades when necessary. Effective risk management is what distinguishes profitable traders from those who suffer losses.
Final Thoughts:
To overcome the desire for revenge, it is essential to understand what triggers it and address the underlying reasons. When we view the market as a reflection of our self-image and attribute personal meaning to our trades, it often leads to an emotional storm. In such a state, we may disregard trading systems and risk management principles, making foolish mistakes that can devastate our trading accounts. It's important to remember that the market provides only factual information for analysis, and behind the price quotes lies nothing more than information.

Live stream - Corporate Life Cycle with Professor Aswath DamodarCompanies age, just as individuals do, and they don’t often do so gracefully, again like individuals. In this presentation, the speaker plans to start with a description of what he sees as the corporate life cycle.

Ninja Talks EP 10: Snollygoster Definition;
"A rude and unscrupulous person".
Many-o-moons ago I used to believe trading was a team sport (I know, how naive of me) but that's because I joined some supply and demand community where we all traded the same strategy.
These days I'm more of a Snollygoster.
I can't help it.
When I see other traders, I see them as competition - even those I teach!
You see the thing is, it helps my trading when I understand that when I win, someone else loses.
Why?
Because it's true.
There's always "someone" on the other side of our trades wether we like to think about it or not.
We've been conditioned to think the market has a "mind of its own", but it really doesn't - it's just a sum of its participants, which for the most part are individuals.
Indivuals who are all looking to out smart and win against other traders.
It's not a game.
Bruce Lee on fighting;
"Fighting should be like a small play, but played seriously."
Same goes for trading.
Keep your emotions, mind, analysis etc light and playful, but always understand that this is serious.
When you look at the market as another human you'll understand how to "outsmart " it (for lack of a better word).
Imagine you're up against yourself, how would you analyze the charts?
Find YOUR stop losses and key levels - then see how you can take advantage.
This is 5D chess trading at its finest and the quickest most lucrative way to become a gigachad trader in 2023 and beyond.
Understand?
Follow for the next episode of Ninja Talks.
Nick

The Struggle of Consistency: Navigating DCA in Crypto InvestingHello dear @TradingView community! Today let’s focus on what is Dollar Cost Averaging ?
Determining the optimal moment to buy cryptocurrency is often a challenging task due to the high volatility of crypto assets. Prices can fluctuate unpredictably at any given time, leading traders to experience the fear of missing out (FOMO).
This fear is commonly felt when the price of a cryptocurrency, such as Bitcoin (BTC), suddenly surges or plunges. During price drops, individuals tend to panic and sell their holdings in a frantic attempt to avoid further losses. Conversely, when prices rise, panic ensues as people worry they don't possess enough coins to sell.
As evident, making decisions to buy or sell cryptocurrencies is no easy feat. However, if you seek long-term financial gains from cryptocurrencies without succumbing to the anxiety caused by every price spike, it would be wise to consider the Dollar Cost Averaging (DCA) strategy. Let's delve deeper into what DCA entails and how it functions in the realm of cryptocurrencies.
What is Dollar Cost Averaging?
Dollar cost averaging is an investment strategy where fixed amounts are regularly invested at consistent intervals, in contrast to a one-time lump sum investment. This approach involves executing transactions regardless of the asset's current price or market fluctuations. It is highly favored by investors and management funds seeking long-term profits from various assets like ETFs, commodities, cryptocurrencies, stocks, and more.
How does DCA work? To employ the DCA strategy, you first determine the amount of cryptocurrency you wish to invest. In conventional investing, one would typically invest the entire designated sum in a specific asset. However, with DCA, you invest fixed amounts of USD into Bitcoin or any other asset over a designated period. For instance, you may choose to purchase $100 worth of BTC every month for a 10 year period.
When utilizing DCA, the selection of the cryptocurrency becomes crucial. With around 22,904 cryptocurrencies available today, you must pick a coin you believe will appreciate in value and yield profitable returns. You can even choose an ETF which follows the trend (up or down) for any specific asset or basket of assets.
To comprehend how DCA operates, consider the following example:
Let's assume it is June of 2014, and Katie decides to allocate $10,000 in BTC. In June of 2014, the price of Bitcoin stood at approximately $560 per coin. Instead of investing the entire sum at once, Katie opts for dollar cost averaging throughout the 9 years.
From June 2014 to May 2022, Katie spent $100 each month on BTC, disregarding market price fluctuations. After 8 years, she spends almost $9,600 and her earnings reflect the following:
The green line in the chart represents Katie’s total investment amount, while the orange line depicts the fluctuation of portfolio size value over the 9-year period. When Katie initiated his investments, both the cost of BTC and his investments were approximately $100. However, as time progressed, the price of Bitcoin underwent changes.
By May of 2022, Katie's $9,600 investment had grown to $287,518 worth of BTC, showcasing a growth rate of 2,895%. With maximum gain of $631,540 at bitcoin ATH.
Online DCA tools are also available to estimate the earnings from purchasing bitcoins over several months. For example, platforms like dcaBTC enable users to customize their DCA strategy according to their preferences, specifying the amount to purchase, investment frequency, and duration.
To successfully implement dollar-cost averaging (DCA) in Bitcoin investing, several key steps need to be followed. These steps involve setting a budget, choosing a reputable cryptocurrency exchange, establishing recurring purchases or utilizing recurring purchases and automated investment platforms (such as Binance, Coinbase, Kraken, Crypto.com or even at Vestinda), and monitoring and adjusting the strategy as necessary.
Pros and Cons of Dollar Cost Averaging
Let's commence with the pros of dollar cost averaging. By making regular and consistent purchases over time, you mitigate the risk associated with poorly timed lump sum investments. Additionally, since you make regular purchases, you alleviate the fear of missing out and impulsive decision-making prompted by price fluctuations.
Cryptocurrency exchanges and platforms charge transaction fees for every trade. While one might assume that DCA would result in higher commission fees, it is essential to remember that this is a long-term strategy. The commission costs are negligible compared to the potential profits that can be realized over several years.
Moreover, DCA does not necessitate substantial investments. This strategy involves smaller and consistent purchases, eliminating the need to determine how best to deploy a large sum in one go. Furthermore, if prices suddenly drop at the time of purchase, you can acquire the cryptocurrency at a lower price.
However, it is important to note that if the cryptocurrency's price is bullish, you may end up buying at a higher price. This is particularly relevant when dealing with BTC or any chosen cryptocurrency. Many crypto enthusiasts and investors prefer to purchase a significant amount at once, fearing a subsequent price surge in the hours, days, weeks, or months to come.
As previously mentioned, with the DCA strategy, you purchase small amounts at regular intervals, regardless of market stability.
Should you utilize the DCA Strategy?
DCA facilitates maximizing profits with relatively low risk. Although this approach is not devoid of drawbacks, it offers numerous advantages that can be leveraged to your benefit.
Hence, is DCA worth your time and money? As always, we recommend thoroughly studying all available information before making any decisions. Save this article to your browser bookmarks for easy reference in the future.
Happy trading!

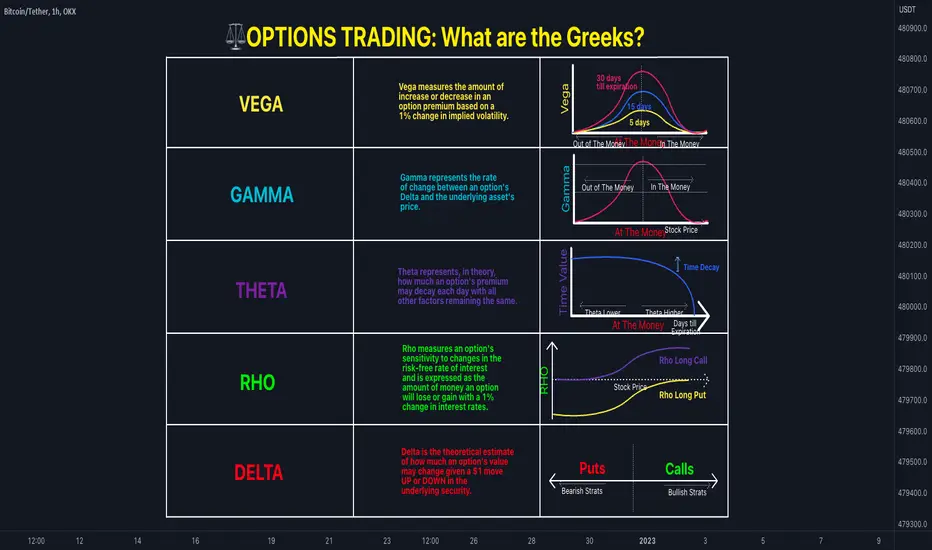
⚖️OPTIONS TRADING: What are the Greeks?The Greeks are a set of mathematical measures used in options trading to assess and quantify various factors that influence the price and behavior of options.
📌 VEGA :
Vega is a measure of how much an option's premium will change in response to a 1% change in implied volatility. Implied volatility represents the market's expectation of the underlying security's future movement. When implied volatility is high, options tend to be more expensive, and when it is low, options are cheaper. Vega is particularly influential for options with longer expiration dates, as volatility has a greater impact on their prices. As an option approaches expiration, Vega decreases, while it increases as the underlying security moves closer to the strike price. Essentially, Vega is highest when the option is at-the-money and decreases as it goes out-of-the-money or in-the-money.
📌GAMMA
Gamma, represents the rate of change between an option's Delta and the price of the underlying asset. Higher Gamma values indicate that even small price changes in the underlying stock or fund can cause significant changes in the option's Delta. At-the-money options have the highest Gamma because their Deltas are most sensitive to underlying price movements. For instance, if XYZ is priced at $100.00 and a XYZ $100.00 call option is considered at-the-money, any price movement in either direction will push the option into either in-the-money or out-of-the-money territory. This high sensitivity to stock movement is reflected in the option's Gamma, making Gamma higher for at-the-money options.
📌THETA
Theta represents the theoretical daily decay of an option's premium, assuming all other factors remain constant. As time passes, options gradually lose value, and this loss is known as time value decay. The decay of time value is more significant as the expiration date approaches, particularly for near-the-money options. Theta does not behave linearly; instead, it accelerates as expiration nears. A higher Theta indicates that the option's value will decay more rapidly over time. Short-dated options, especially those near-the-money, tend to have higher Theta because there is greater urgency for the underlying asset to move in a favorable direction before expiration. Theta is negative for long (purchased) positions and positive for short (sold) positions, regardless of whether the option is a call or a put.
📌RHO
Rho measures an option's sensitivity to changes in the risk-free interest rate and is expressed as the amount of money the option will gain or lose with a 1% change in interest rates. Changes in interest rates can affect an option's value because they impact the cost of carrying the position over time. This effect is more significant for longer-term options compared to near-term options. Higher stock prices and longer time until expiration generally lead to greater sensitivity to interest rate changes, resulting in higher absolute Rho values. Rho is positive for long calls (the right to buy) and increases with the stock price. It is negative for long puts (the right to sell) and approaches zero as the stock price increases. Rho is positive for short puts (the obligation to buy) and negative for short calls (the obligation to sell).
📌DELTA
Delta is a measure that estimates how much an option's value may change with a $1 increase or decrease in the price of the underlying security. Delta values range from -1 to +1, where 0 indicates minimal movement of the option premium relative to changes in the underlying stock price. Delta is positive for long stocks, long calls, and short puts, which are considered bullish strategies. Conversely, Delta is negative for short stocks, short calls, and long puts, which are bearish strategies. A Delta of +1 is assigned to long stock shares, while a Delta of -1 is assigned to short stock shares. An option's Delta can range from -1 to +1, and the closer it is to +1 or -1, the more sensitive the option premium is to changes in the underlying security.
👤 @QuantVue
📅 Daily Ideas about market update, psychology & indicators
❤️ If you appreciate our work, please like, comment and follow ❤️
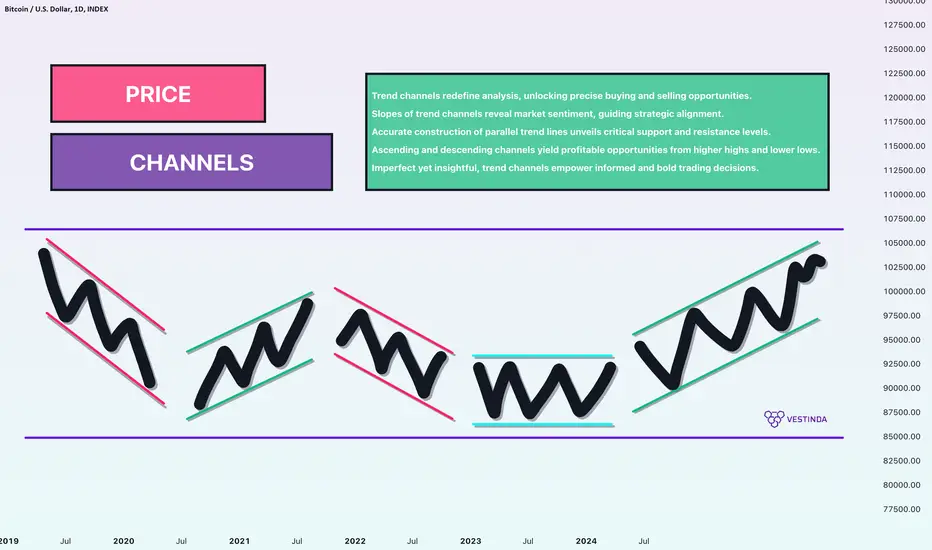
Price Channels — Quick and Easy Guide.Greetings, @TradingView community!
When it comes to analyzing market trends, there's a technique that takes trend theory to the next level: price channels.
This is @Vestinda, bringing you a helpful article on the topic of the price channels, also known as trend channels, offer an exciting way to identify optimal buying and selling opportunities in the market.
Price channels serve as a valuable tool in technical analysis, helping traders determine favorable entry and exit points. By drawing parallel lines that align with the angle of an uptrend or downtrend, we create a channel. The upper trend line acts as resistance, while the lower trend line represents support. These lines highlight potential areas where the market could experience reversals or continue its current trend.
Understanding the sentiment of a price channel is crucial. Channels with a positive slope (upward) are considered bullish, indicating an upward trend, while those with a negative slope (downward) are bearish, pointing to a downward trend. Recognizing the slope of a price channel allows traders to gauge the prevailing market conditions and make informed trading decisions.
Price channels can be categorized into three main types:
Ascending channels
Descending channels
Horizontal channels
Ascending channels display higher highs and higher lows, signaling a bullish sentiment. To create an ascending channel, draw a parallel line touching the most recent peak, aligning it with the angle of the uptrend line.
Conversely, descending channels exhibit lower highs and lower lows, suggesting a bearish sentiment. To create a descending channel, draw a parallel line touching the most recent valley, aligning it with the angle of the downtrend line
Horizontal channels , also known as ranging channels, indicate a consolidation phase with no clear trend direction.
These channels provide insights into potential buying zones when prices hit the lower trend line and selling zones when prices approach the upper trend line. Understanding these channel types empowers traders to adapt their strategies to different market scenarios.
Constructing a price channel requires parallelism between the trend lines. The lower trend line is typically considered a "buy zone," while the upper trend line serves as a "sell zone." It's crucial not to force price action into the drawn channels. When the channel boundaries slope at different angles, the pattern is no longer a price channel but a triangle pattern, requiring a distinct analytical approach.
Remember that price channels don't have to be flawlessly parallel. In reality, it's rare to find price action that perfectly aligns within two trend lines.
As traders, it's important not to solely rely on textbook price patterns but also consider broader market context and other essential cues from price action. Effective price channel analysis involves embracing imperfections and making informed decisions based on the available information.
In conclusion, price channels provide traders with a powerful technique to uncover profitable opportunities in the market. By drawing parallel trend lines and identifying support and resistance levels, traders can gain valuable insights into market sentiment and enhance their trading decisions.
However, it's essential to remember that perfection isn't the goal. Instead, focus on understanding market dynamics and adapting your strategy accordingly.
💜 So there you have it - a quick and easy guide to understanding price channels in trading! 💜
It's a numbers gameI see this more and more, especially in the crypto space. There are some wild stories out there from turning $8k to a billion through to a Pizza for 10,000 Bitcoin.
Here are some home truths. Although most of you won't want to hear this.
You see, as a professional trader - there is 1 key factor, almost a scale balancing between too much and just enough. Everyone pushes for more returns, we are only human after all. We have had stories of Wall Street Titans and Vegas big wins, but there is some simple logic to this.
You might have entered the market after Covid hit the world and wanted an extra income, might have seen a way to make millions from the money the government sent you? The issue is this is no different that rolling a dice in Vegas but without the fun! You possibly saw some influencer selling you the dream - they fail to tell you, they trade on demo accounts and make their income from affiliate links and social media watch time!
When you think of investors like Warren Buffet, you have to understand - he didn't watch an influencer video and say to himself "I want to be like that guy" - investing is often a long term thing and not a get rich quick scheme.
Here's a few examples to hit home.
This is boring, not worth it - so instead you seek higher returns, that opens up the possibility of falling into scams, listening to the wrong crowd and having dreams. To be honest, it's probably more enjoyable spending a day at the races.
With a smaller account, you can grow it a little, add to it on the next pay day and of course compound the investments.
As you move up the scale.
This is probably where most "semi serious" market goers start. It's often a flurry into the market cash in hand. The assumption often the same; you have done well to amass a lumpy investment, your clearly good at the field you have been in to earn your pot. Why wouldn't you be a good trader? After all, these kid influencers are making millions on their demo accounts.
Jump to the next level...
Your either a captain of industry, you have had your own business or you have a kind daddy.
How you got here is not important, staying here is.
When you trade with a medium sized account you start to think a little different. Instead of looking for 900x returns, you start thinking about investments that are a little less risky. This is the scales I mentioned earlier. You are now in the space of a good return might be good enough. Too high of a risk, means you are thinking of safe guarding your cash.
Here's where the Professionals play the game differently. Trying to make 1-5% is a lot more sustainable than trying to land a 900x return.
You have to remember 90% of traders lose 90% of their accounts in 90 days...
This can easily be attributed to things like;
Buying signals
Following influencers
Over trading
Trading too small a timeframe
Trying to find a silver bullet
As a professional - you can seek smaller returns, spend less time in front of the charts and let your money work for you, instead of you doing all the chasing!
As the amount of capital rises, so does your desire for risk. You might still have the appetite for returns but not at the cost of risk.
As a professional trader, you can afford the luxury of trading a bias and scaling into a trade - you will find fund managers who have what's known as secondary investment capital (in essence to add to winning positions).
So although this is not going to be what you want to hear, it's what you need to know.
There's always chasing the dream, but why not wake up and make it a reality?
Enjoy the weekend all!
Disclaimer
This idea does not constitute as financial advice. It is for educational purposes only, our principle trader has over 20 years’ experience in stocks, ETF’s, and Forex. Hence each trade setup might have different hold times, entry or exit conditions, and will vary from the post/idea shared here. You can use the information from this post to make your own trading plan for the instrument discussed. Trading carries a risk; a high percentage of retail traders lose money. Please keep this in mind when entering any trade. Stay safe.

Trend Trading: What it is & How to do itWhat is trend trading?
Trend trading or trend following is a trading strategy that involves identifying the direction of a prevailing trend in the financial markets and then buying or selling assets following that trend.
Trend traders tend to use technical analysis tools, such as moving averages (MA), trend lines, and momentum indicators, to determine trends in the market. They will look for patterns in price movements and analyse charts to establish areas of support and resistance.
Once they identify a trend, trend traders usually enter a trade in the direction of that trend, and the goal is to ride the trend for as long as possible. As a trend trader, you may enter a long position when the price moves upward or a short position when the price is trending downward.
Different types of trends
Trend followers may want to be aware of several types of trends:
Secular trends: Secular trends are long-term trends that last for years or even decades. Structural changes in the economy or changes in demographic are some of the factors that influence these trends.
Primary trends: Primary trends are shorter-term trends that last for months or a few years. Changes in the business cycle or political or economic events usually cause them.
Secondary trends: Secondary trends are shorter-term trends that last for weeks or a few months. Changes in investor sentiment or technical factors typically cause them.
Intermediate trends: Intermediate trends are shorter-term trends that last for days or a few weeks. Changes in the supply and demand for a particular asset or changes in the level of volatility in the market usually cause them.
Minor trends: Minor trends are very short-term trends that last only a few days and are the bread and butter of day traders and swing traders. News events or changes in the level of trading activity in the market usually cause them.
How to use a trend-trading strategy
Traders may use a combination of trend-trading strategies, depending on their style and risk tolerance.
Moving averages
This strategy uses the moving average (MA) indicator, which measures an asset’s average price over a specified period.
A trader may look for a “golden cross” signal; this occurs when a short-term moving average (e.g. 50 days) crosses above a long-term moving average (e.g. 200 days). This signal could indicate that a bullish trend is shifting upwards.
Trend lines
Trend lines connect the highs and lows of an asset’s price movements. They are straight lines that connect two or more price points on a chart, representing the direction and slope of a trend.
Trend lines can pinpoint the direction of a trend. Traders can also use them with other technical indicators and candlestick patterns to spot potential trading scenarios. For example, a trader may look for a bullish chart pattern, such as a double bottom, to form near an uptrend line, which may indicate a bullish momentum.
Trend momentum
Momentum indicators measure the strength of a trend. They can help traders identify potential entry and exit points.
The indicators used are:
Relative Strength Index (RSI): This measures the speed and change of price movements. It oscillates between 0 and 100 and is typically used to identify overbought and oversold conditions. A reading above 70 indicates an overbought condition, while a reading below 30 indicates an oversold condition.
Moving Average Convergence Divergence (MACD): The MACD is a trend-following momentum indicator that consists of two lines: the MACD line and the signal line. When the
MACD line crosses above the signal line, it indicates a bullish trend. In contrast, a cross below the signal line shows a bearish trend.
Stochastic Oscillator: The indicator compares an asset’s closing price to its trading range over a specified period. It oscillates between 0 and 100 and is typically used similarly to RSI - to identify overbought and oversold conditions.
Trend-trading example
The chart above highlights activity over a few weeks and shows the 9-day moving average and 21-day moving average, trendlines and the RSI indicator below.
When the RSI falls below 30, indicating that the asset is oversold and a trend reversal is likely, we see a cross of the 9 and 21-day moving averages, which also signals a potential bullish trend reversal. A trend trader may have decided to buy the asset since two indicators confirm the reversal and follow the trend until RSI shoots above 70, suggesting that the asset is overbought.
Why choose trend trading?
Suitable for various markets: Trend trading can be applied to multiple financial markets, including stocks, currencies, commodities, and indices, making it a versatile strategy.
Capitalise on market momentum: The basic idea behind trend trading is to identify the market’s direction and then take positions that align with the direction of the trend.
Adaptable for various time frames: Trend trading can be used for multiple timeframes. Therefore, it may suit many strategies, from day trading to swing trading.
Risks of trend trading
False signals: One of the downsides of trend trading is that it can generate false signals, leading to losses. Trends can be short-lived, and price movements can be volatile, making it challenging to accurately identify the trend’s direction.
Lagging indicators: Trend trading often uses lagging indicators, such as moving averages, which may not accurately represent the current market situation. When a trend is identified, it may have already been in place for some time, and the price may have moved significantly.
Risk of trend reversals: Trends can reverse at any time, and traders who have taken long or short positions based on the trend may suffer significant losses if the trend reverses.
How to start trend trading
The key steps involved in trend trading include:
Identifying trends: The first step in trend trading is to find out the direction of the trend. This can be done by analysing price charts and looking for higher highs and higher lows in an uptrend or lower lows and lower highs in a downtrend. Traders can also use technical indicators such as moving averages and trend lines to highlight trends.
Selecting entry and exit points: Once a trader identifies the direction of the trend, the next step is to choose entry and exit points. Entry points can be determined using technical indicators such as momentum oscillators and chart patterns.
Managing risk: Risk management is essential to trend trading. Traders can use appropriate position sizing and risk management techniques. For example, stop-loss orders can be used to limit potential losses. Traders should note that ordinary stop-losses do not protect from slippage, while guaranteed stop losses do; however, they usually incur a fee.
Backtesting and demo trading
Backtesting involves testing a trading strategy on historical data to see how it would have performed in the past. This allows traders to evaluate the strategy’s effectiveness and make necessary adjustments before risking real money in the markets.
Backtesting helps traders identify the strengths and weaknesses of their strategy and refine their entry and exit points, risk management, and position sizing.
Demo trading, on the other hand, involves using a simulated trading account to practise executing trades based on a trading strategy. This allows traders to gain real-world experience without risking real money. In addition, demo trading helps traders to develop confidence in their approach, practise managing risk, and to become familiar with the trading platform they plan to use.
Summary
In summary, trend trading is a widely employed and adaptable trading strategy focusing on capitalising on market momentum by identifying and pursuing prevailing trends.
Traders can ascertain trends and evaluate their potential potency using technical analysis tools, such as moving averages, trend lines, and momentum indicators. Furthermore, by recognising the distinct types of trends – secular, primary, secondary, intermediate, and minor – traders can adapt their strategies for varying market conditions and timeframes.
Trend-following strategies may use moving averages, trend lines, and momentum indicators to establish entry and exit points while assessing a trend’s strength. The versatility of trend trading allows its application across diverse financial markets, including stocks, currencies, commodities, and indices.

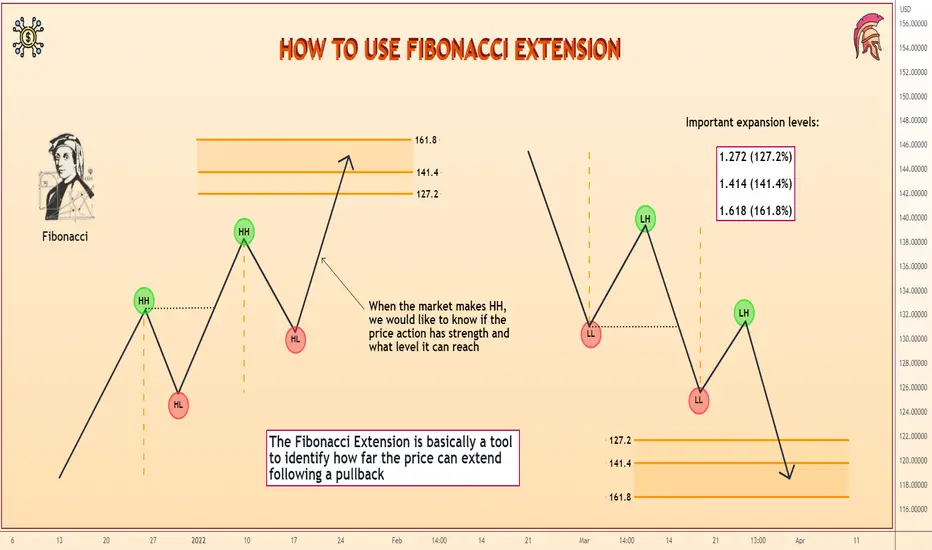
HOW TO USE FIBONACCI EXTENSIONFibonacci is a technical tool, essentially an automatic tool for building support and resistance levels. They need to be supplemented by:
Standard support and resistance lines
Trend lines
Japanese candlesticks
and additional indicators
Then they will be a good assistant in your trading. This is how a trading strategy is created, based on the combined instruments and the study of their features in different market conditions.
The three most important Fibonacci retracement levels are:
0.382 (38.2%)
0.5 (50.0%)
0.618 (61.8%)
All other levels, say 0.236 or 0.764 are secondary.
And these are important expansion levels:
1.272 (127.2%)
1.414 (141.4%)
1.618 (161.8%)
It's not difficult to use Fibonacci. Swings (upper and lower), as the maximum and minimum price values, are taken. From them, a fibo is drawn, and its lines are used as hints for support and resistance levels. It is up to you to decide whether to use Fibonacci in your trading. As we know from self-fulfilling prophecy, the more traders use a certain tool, the more important it become to the markets. Also, Fibonacci is a very popular tool, which often pops up on the charts of professional currency traders as well. So, it's a prophecy that comes true quite often.
Now let's expand our Fibonacci tool by examining the uptrend. We see that the 1.272 and 1.414 levels work as resistance, and after a couple of unsuccessful breakout attempts, as we can see many pinbars, the price might just go down and make another pullback.
Now let's do the same thing with the downtrend. Let's pull the fibo extension tool.
And here's what's happened:
Price ran into support, then broke through it. It was the level that was held up before the price went down. Price action made a new low. Fibo extension level 1.414 lines up with psychological level 1.59000. From these examples we can see that Fibonacci extension level is logical and often (though not always) form temporary support and resistance levels.
Remember, there is no guaranteed way to tell when a Fibonacci level will work as resistance or support. However, by applying all of the technical analysis techniques you've learned so far, you'll significantly increase your ability to identify these situations.
Therefore, you should consider Fibonacci expansion and retracement levels as an auxiliary tool that may be useful in some cases. But don't expect the price to bounce off right away. Fibonacci levels are your area of interest. If any candlestick combinations are formed near these levels, if oscillators or other instruments show anything curious, it is time to be alert.
22 trading rulesThe market rewards discipline and requires you to fulfill your specific role. For instance, as a tattoo artist, your responsibility is to provide quality tattoo, while as a trader, your task is to exercise discipline in decision-making. If you remain disciplined, any reasonable strategy can yield profits in the long term. However, even the most flawless strategy will fail to generate income if you lack self-control.
Here are some guidelines to follow:
1.Maintain discipline consistently. Trading demands unwavering discipline at all times. Save extreme emotions, excitement, and other non-work-related feelings for your personal hours. While working, stay focused and determined, adhering to your plan and experience.
2.Always reduce the risk of failed trades. If you experience a series of unprofitable transactions, decrease the volume or percentage of risk from your deposit, rather than increasing it. Some individuals mistakenly believe that if they have had three consecutive losses, the fourth trade is bound to be profitable and will make up for the previous losses. However, the chances of profit or loss in the fourth trade remain the same. Relying on luck is unnecessary.
3.Avoid turning profitable trades into losing ones. Close positions promptly when you recognize the risk of holding them further. If there are signs of market weakness and continuing to hold the position jeopardizes your profit, either take your existing profit or exit with a small loss. In most cases, you will have the opportunity to find another entry point that is equally good or even better.
4.Ensure that your highest loss does not exceed your highest profit. Keep a record of your trades to determine the mathematical ratio of profit to loss and the ratio of profitable to losing trades. If your losses surpass your profits, you need to optimize your system; otherwise, it may become unprofitable in the long run.
5.Develop a trading system and stick to it. Avoid constantly switching from one system to another. If you decide to become a trader, select a specific approach and commit to it. Over time, you will gain a deep understanding of the system and develop your own market perspective.
6.Be true to yourself; don't try to imitate others. If you find that scalping is not suitable for you, consider intraday or swing trading instead. Just because someone excels at intraday trading while you excel at swing trading doesn't mean you should abandon your preferred style. Each individual has their own trading style, and there is a style that matches every personality. Some traders earn substantial profits by only opening ten trades per year, while others achieve the same level of success by opening ten trades per day. Moreover, someone may be comfortable opening a trade with a large lot size, while you prefer a maximum of one lot. This doesn't imply that you are a poor trader; it simply indicates that everyone has their own comfort zone. Discomfort in trading can only be detrimental. Stay true to yourself and find your own style.
7.Remember that there will always be another day to trade, so don't risk too much. Some beginners risk 20-50% or even more of their deposit, only to find themselves with nothing when a profitable entry point arises. Such risks often shatter one's psychology, and it can be difficult to recover. However, if you make a few mistakes with standard and small risks, you will always have the next day to learn from and correct your errors.
8.Earn the privilege to trade in high volumes. Even if you have tens or hundreds of thousands of dollars in your account, it doesn't mean you should immediately start trading, for example, 10 lots. Begin by trading with the minimum volume allocated for your deposit. Only when you close ten consecutive sessions in profit should you consider increasing the volume.
9.The first conscious loss you encounter is the most valuable. It is during this moment that you understand the significance of stop-loss orders as part of your system. A stop-loss serves as a mechanism to exit a position when the trade is no longer favorable. By recognizing this and reacting appropriately, you are able to protect your account from significant losses. Understand that a stop-loss order is a benefit. See point 15.
10.Avoid relying on hope or prayer. If you catch yourself hoping for a positive outcome in a trade, it likely means that the trade is no longer profitable. Avoid concealing this fact from yourself as a trader. This psychological inclination to hope shields us from emotional distress and difficult decisions. However, as a trader, you must objectively assess the situation. If you realize that you are starting to rely on hope, reevaluate the facts and conduct a thorough analysis of your trade. It may no longer be as favorable as you initially thought.
11.Don't overly concern yourself with news. While trading the news is a separate strategy that may work for some traders, most try to avoid it. If the news is already known in advance, the market will react to it beforehand. However, if the information becomes clear only during the news release, it becomes challenging to trade based on such inputs. News that is widely broadcasted on TV or the internet tends to be outdated information when it comes to the market.
12.Choose a trading style that suits your circumstances. If you have a small account and can only afford short stop-loss levels, you may need to start with scalping or intraday trading. If you possess patience and adequate capital, swing trading could be an option. Long-term trading generally requires significant capital.
13.Embrace your losses. It doesn't mean you have to enjoy losing money. However, during your trading journey, you will inevitably experience losses. If you have a negative mindset towards losses, it will hinder your overall performance. Recognize that by exiting trades promptly and accepting short-term losses, you safeguard your account from larger losses in the long run. Learn to appreciate the importance of managing losses effectively.
14.Avoid setting excessively large stop-loss levels. Doing so will erode your profits from small trades. Consequently, instead of achieving a small profit, you may end up at breakeven or a slight loss, even if your trade initially showed promise.
15.Take consistent actions each day or week. Set a goal to capture a certain number of pips or points daily if you are a scalper or weekly if you trade intraday (the specific numbers provided here are for illustrative purposes and should not be taken as objectively evaluated results). By accumulating small gains over time, you can earn a significant amount by the end of the year.
16.Don't rely on a single trade for salvation. Some traders mistakenly believe that a single trade has the potential to generate substantial profits, recover previous losses, or significantly impact their overall performance. However, trading revolves around a series of transactions. No single trade can dictate your success. Instead, your behavior across ten or twenty trades holds tremendous importance in surviving and thriving in the market.
17.Consistency breeds confidence and control. Starting each morning with the knowledge that following your rules will result in profitable trades instills a sense of assurance. Similar to other traders, begin your day by reviewing the charts you trade and gathering the necessary information—perform top-down analysis, assess points of interest, liquidity, order flow, and more. Maintain this ritual consistently, as repeated actions are essential for earning profits in trading.
18.Master the art of position management. If you find yourself in a trade that is progressing favorably, consider partially closing your position to protect your profits in case the price suddenly reverses. Being flexible in managing your positions can lead to increased profitability and emotional balance in the market.
19.Execute the same trades repeatedly. Focus on specific trade setups that have proven successful for you. Avoid trying to trade multiple patterns simultaneously. Instead, identify two or three formations that work well for you and trade them consistently. Become an expert in those setups and execute them confidently and precisely. Avoid spreading yourself too thin.
20.Avoid excessive doubt and overanalysis. During the execution of a trade, trust your analysis and decision-making process. Doubts and unnecessary analysis during a trade can lead to detrimental outcomes. Overthinking can consume you and make it challenging to differentiate between the right and wrong decisions. Leave fluctuations and excessive analysis to the market. Conduct trade analysis before or after trades, not during them.
21.In the eyes of the market, all trades are equal. At the start of each trading day, everyone is on an equal footing. You haven't made any profits or losses yet. Your earnings depend solely on your actions. If you adhere to discipline and follow your predetermined rules, you will generate profits.
22.The market is an impartial judge of your trades. The market doesn't play favorites; it remains indifferent to your presence. Respect the market's authority and refrain from attempting to defy it. Engaging in a battle against the market is akin to fighting your reflection in a mirror. Instead, focus on understanding and following the market's rules.
• Look at my ideas about interesting altcoins in the related section down below ↓
• For more ideas please hit "Like" and "Follow"!

Informational: SPARKS, meticulously crafted watchlistTradingView provides a wide array of features, and it can sometimes feel overwhelming to grasp them all. However, one particularly valuable but often overlooked feature on the platform is SPARKS. These specialized watchlists, curated by TradingView, offer an effortless way to monitor and follow specific industries within the market.
It is important to note that while SPARKS can serve as a useful starting point for research, they should not be regarded as comprehensive representations of an entire industry. They provide valuable insights, but additional analysis is recommended for a complete understanding.
Now, let's delve into the process of accessing and utilizing SPARKS effectively.
1: Load the TradingView website and look towards the top you will see "Market" Hover your cursor over the markets tab and then hover over "SPARKS" You will now see a list of preliminary categories
Lets select "Work" for testing purposes
2: You are now presented with a list of additional categories showing anything having to do with work and employment. You can also see the performance of each portfolio listed below the portfolio
Currently A.I is a major topic of discussion. Lets go ahead and look at the A.I portfolio named : " A.I Stocks: RISE of the machines"
3: You are now presented with a overview of the portfolio and a option to save the watchlist which will add it to your watchlist tab to the right. :
If you continue down you will now see information regarding the performance of the portfolio and as you can see for this portfolio year to date performance is up by 30%
Tradingview also shows you the distribution of the sectors used in the portfolio:
Below that you will now see a list of all the individual symbols and you can filter by type and sector
You can also select specific symbols to compare their performance, below I have selected Nvidia, Microsoft and good to see their 1 year performance in the portfolio. This feature will also filter the news by only showing you news evens directly related to the symbols in the portfolio. :
And finally you can create your own custom watchlist and click on the button shown below the see the performance of that portfolio just the same.
The SPARKS feature on the platform is an incredibly valuable resource that often goes unnoticed by many users. It is highly recommended that you take the time to thoroughly explore the numerous SPARKS portfolios that are readily available. By doing so, you can unlock a wealth of useful insights and enhance your trading experience.
Trading With the Three Drives PatternHarmonic patterns are known for their ability to provide effective trade setups. The Three Drives pattern is no different, and in this FXOpen article, we’ll delve into what this pattern is, how to identify it, and explore some of the best strategies for trading it.
Introduction to the Three Drives
The Three Drives pattern, sometimes referred to as the 3 Drives pattern, is a technical analysis tool used to identify potential reversal points in price movements. Traders look for three consecutive, symmetrical bullish or bearish legs, known as drives, with the third point marking the completion of the formation.
The Three Drives is classified as a harmonic pattern and is closely related to the ABCD pattern. However, whereas the ABCD is made up of two legs and one pullback, the Three Drives consists of three legs and two pullbacks.
As a result, it can be slightly trickier to find than the regular ABCD chart formation. Still, many traders consider it to have a higher degree of accuracy when predicting trend reversals, so it’s worth learning how to recognise this pattern.
Identifying the Three Drives
At its most basic, the pattern is identified by a series of higher highs and higher lows (bearish) or lower highs and lower lows (bullish). Specifically, it features three consecutive, symmetrical drives and two retracements. The drives are typically marked 1, 2, and 3, and the retracements are noted as A and B.
Like other harmonic patterns, the Three Drives is confirmed using Fibonacci ratios. Thankfully, its rules are fairly simple. They are:
- A retraces drive 1 by 61.8% or 78.6%
- B retraces drive 2 by 61.8% or 78.6%
- Drive 2 is a 127.2% to 161.8% extension of retracement A
- Drive 3 is a 127.2% to 161.8% extension of retracement B
Additionally, for best results, the pattern calls for the time each drive takes to form to be roughly the same. This also applies to the corrective phases.
As with many harmonics, being flexible with the rules may help you distinguish more opportunities. Often, the Three Drives will work without perfect symmetry or the ratios lining up exactly. That’s not to say you shouldn’t aim for it to meet the rules as precisely as possible, but you can allow a bit of leeway if the overall formation looks correct.
If you want to try your hand at finding the Three Drives, you can use the TickTrader platform. It’s free to use, and you’ll find built-in Three Drives and Fibonacci retracement tools that’ll help you plot the formation, just like we’ve used in the bearish Three Drives forex example above.
Using the Three Drives Pattern for Trading
Once you have identified the pattern, it’s time to put it into action. Note that these steps don’t just apply to forex trading; you can use them with whatever asset you prefer to trade.
Entries
You have two options for making an entry here: with a market order or a limit order. Some traders set a limit order at the 127.2% or 161.8% extension of B, where the third drive is expected to begin reversing. However, while this strategy may result in pinpoint entries, it also makes setting stop losses difficult, as you’re entering before the price has started to reverse.
Waiting for price action confirmation might make setting stops much easier but can result in a worse risk/reward ratio. You could try waiting for signs of reversal with candlestick patterns like shooting stars, hammers, or engulfing candles before entering with a market order.
Stop Loss
If you choose to wait for confirmation, you can just set your stop above the highest point for a bearish Three Drives or beneath the lowest point for a bullish setup.
If you’re using a limit order at 161.8%, you could try setting a stop beyond the 170% or 175% extension of B, which would invalidate the setup. You could do something similar if entering at 127.2%.
Take Profits
Your profit target here is quite flexible. You could choose to exit at a specific risk/reward ratio, like 1:2 or 1:3. Some look to take profit at the 61.8% retracement of the whole pattern, i.e., using the Fibonacci retracement tool from the start of the first drive and the end of the third drive.
Alternatively, you could also use the Fibonacci extension tool to find the 127.2% or 161.8% extensions of the entire formation and set a profit target at either level.
Bullish Example
Here, we can see the roughly symmetrical 3 Drives pattern in the forex market that prompted a significant reversal. Following the massive engulfing candle, a market order would’ve gotten traders into a decent trade.
Bearish Example
In this example, we see a much larger pattern. While the final drive ended up slightly beyond the 161.8% area, the symmetry and almost perfect retracements to the 61.8% levels indicate that the pattern was likely to play out as expected. Traders could’ve entered at the projected 161.8% extension of the second retracement with a stop above the 170% level to secure an excellent risk/reward ratio.
Your Next Steps
By now, you should have an understanding of the Three Drives pattern and how to recognise it. If you’re wondering what to do next, you can try following these steps:
1. Practice identifying the formation on historical charts. You can use TickTrader to help with this.
2. Once you become more familiar with the pattern, start formulating a strategy. You could try backtesting a few setups to see how well your system works.
3. You can open an FXOpen account and test your strategy in live markets to refine your approach.
4. Read up on related topics, like harmonic patterns and Fibonacci retracements, to expand your knowledge.
These four steps may put you in good stead when it comes to trading the Three Drives chart formation for real. Happy trading!
This article represents the opinion of the Companies operating under the FXOpen brand only. It is not to be construed as an offer, solicitation, or recommendation with respect to products and services provided by the Companies operating under the FXOpen brand, nor is it to be considered financial advice.
STOP Impulse Trading at once – 5 Actions to takeOne of the most dangerous traits a trader can adopt is…
Impulse Trading.
This is where they take trades mainly on emotions and gut rather than sound financial analysis.
This means, more risk, more irrational choices and that can lead to steering away from what works.
Your proven trading strategy!
And the end result, you’ll lose in the long term and end up with less confidence for your future endeavours as a trader.
So let’s come up with certain ways for you to STOP the impulse trading.
ACTION #1: Give it an hour
When you feel the urge to make a trade based on emotions, it can be helpful to step back and take a break.
One great way is to wait for an hour before you make any decisions.
Go get something to eat, grab a beer, go walk your crocodile or go do something other than trading.
Close your computer if you feel you’re about to impulse trade.
This break can help you regain a sense of perspective and avoid making impulsive decisions that you may later regret.
ACTION #2: Remember your long term goal
I always say…
Financial trading is a long-term game.
You need to have a clear and specific long-term goal in mind that guides your decisions.
When you feel the urge to make an impulsive trade, take a moment remember your trading record, journal and what works.
Also, remember it’s not about the one trade but the hundreds of trades later…
Ask yourself whether this trade aligns with your overall strategy or whether it’s just a momentary impulse.
This can help you stay focused and disciplined in your trading.
ACTION #3: Revisit your journal
Your journal is pretty much your game-plan.
It foretells of the most probable outcome when you follow it.
And it should include a record of all your trades, your thoughts and feelings at the time of the trade, and the results of the trade.
When you feel the urge to make an impulsive trade, take some time to revisit your journal.
Look at your past trades and the results they produced.
My favourite…
Go look at your drawdowns. Go look at your biggest drawdowns.
Then go see how you came out of the drawdowns and your portfolio headed to NEW all time highs.
There is no better feeling than that. Do this and I doubt you’ll want to take any impulse trades again.
ACTION #4: Read more trading psychology
Mind is everything with trading.
It’s a great way to develop your discipline and avoid impulse trading. Either go read trading books, articles, watch YouTubes or just save this article.
I can almost guarantee… If you read this article, when you feel like taking an impulse trade – You will stop that primitive way of thinking.
You’ll stop that inner conscience from trying to ruin your trading performance.
ACTION #5: Avoid Overtrading
If you find you take MANY trades at a time…
You’ll be more inclined of taking impulse trades, because you feel you need to take more.
Try and have a cap when it comes to the number of trades you hold.
I used to never hold more than 5 trades.
But over time, with adopting into new markets and evolved markets – that number gone up.
Now I make sure I never have more than 12 trades opened at any one time.
Remember to give yourself time to reflect, keep your long-term goals in mind, revisit your journal, and read more about trading psychology.
Let’s bring back the 5 actions to avoid taking any impulse trades.
ACTION #1: Give it an hour
ACTION #2: Remember your long term goal
ACTION #3: Revisit your journal
ACTION #4: Read more trading psychology
ACTION #5: Avoid Overtrading
Let me know if this was useful in the comments.

Algorithmic vs. Manual Trading - Which Strategy Reigns SupremeIntro:
In the dynamic world of financial markets, trading strategies have evolved significantly over the years. With advancements in technology and the rise of artificial intelligence (AI), algorithmic trading, also known as algo trading, has gained immense popularity. Algo trading utilizes complex algorithms and automated systems to execute trades swiftly and efficiently, offering numerous advantages over traditional manual trading approaches.
In this article, we will explore the advantages and disadvantages of algo trading compared to manual trading, providing a comprehensive overview of both approaches. We will delve into the speed, efficiency, emotion-free decision making, consistency, scalability, accuracy, backtesting capabilities, risk management, and diversification offered by algo trading. Additionally, we will discuss the flexibility, adaptability, intuition, experience, emotional intelligence, and creative thinking that manual trading brings to the table.
Advantages of Algo trading:
Speed and Efficiency:
One of the primary advantages of algo trading is its remarkable speed and efficiency. With algorithms executing trades in milliseconds, algo trading eliminates the delays associated with manual trading. This speed advantage enables traders to capitalize on fleeting market opportunities and capture price discrepancies that would otherwise be missed. By swiftly responding to market changes, algo trading ensures that traders can enter and exit positions at optimal prices.
Emotion-Free Decision Making: Humans are prone to emotional biases, which can cloud judgment and lead to irrational investment decisions. Algo trading removes these emotional biases by relying on pre-programmed rules and algorithms. The algorithms make decisions based on logical parameters, objective analysis, and historical data, eliminating the influence of fear, greed, or other human emotions. As a result, algo trading enables more disciplined and objective decision-making, ultimately leading to better trading outcomes.
Consistency: Consistency is a crucial factor in trading success. Algo trading provides the advantage of maintaining a consistent trading approach over time. The algorithms follow a set of predefined rules consistently, ensuring that trades are executed in a standardized manner. This consistency helps traders avoid impulsive decisions or deviations from the original trading strategy, leading to a more disciplined approach to investing.
Enhanced Scalability: Traditional manual trading has limitations when it comes to scalability. As trade volumes increase, it becomes challenging for traders to execute orders efficiently. Algo trading overcomes this hurdle by automating the entire process. Algorithms can handle a high volume of trades across multiple markets simultaneously, ensuring scalability without compromising on execution speed or accuracy. This scalability empowers traders to take advantage of diverse market opportunities without any operational constraints.
Increased Accuracy: Algo trading leverages the power of technology to enhance trading accuracy. The algorithms can analyze vast amounts of market data, identify patterns, and execute trades based on precise parameters. By eliminating human error and subjectivity, algo trading increases the accuracy of trade execution. This improved accuracy can lead to better trade outcomes, maximizing profits and minimizing losses.
Backtesting Capabilities and Optimization: Another significant advantage of algo trading is its ability to backtest trading strategies. Algorithms can analyze historical market data to simulate trading scenarios and evaluate the performance of different strategies. This backtesting process helps traders optimize their strategies by identifying patterns or variables that generate the best results. By fine-tuning strategies before implementing them in live markets, algo traders can increase their chances of success.
Automated Risk Management: Automated Risk Management: Managing risk is a critical aspect of trading. Algo trading offers automated risk management capabilities that can be built into the algorithms. Traders can program specific risk parameters, such as stop-loss orders or position sizing rules, to ensure that losses are limited and positions are appropriately managed. By automating risk management, algo trading reduces the reliance on manual monitoring and helps protect against potential market downturns.
Diversification: Diversification: Algo trading enables traders to diversify their portfolios effectively. With algorithms capable of simultaneously executing trades across multiple markets, asset classes, or strategies, traders can spread their investments and reduce overall risk. Diversification helps mitigate the impact of individual market fluctuations and can potentially enhance long-term returns.
Removal of Emotional Biases: Finally, algo trading eliminates the influence of emotional biases that often hinder trading decisions. Fear, greed, and other emotions can cloud judgment and lead to poor investment choices. Byrelying on algorithms, algo trading removes these emotional biases from the decision-making process. This objective approach helps traders make more rational and data-driven decisions, leading to better overall trading performance.
Disadvantage of Algo Trading
System Vulnerabilities and Risks: One of the primary concerns with algo trading is system vulnerabilities and risks. Since algo trading relies heavily on technology and computer systems, any technical malfunction or system failure can have severe consequences. Power outages, network disruptions, or software glitches can disrupt trading operations and potentially lead to financial losses. It is crucial for traders to have robust risk management measures in place to mitigate these risks effectively.
Technical Challenges and Complexity: Technical Challenges and Complexity: Algo trading involves complex technological infrastructure and sophisticated algorithms. Implementing and maintaining such systems require a high level of technical expertise and resources. Traders must have a thorough understanding of programming languages and algorithms to develop and modify trading strategies. Additionally, monitoring and maintaining the infrastructure can be challenging and time-consuming, requiring continuous updates and adjustments to keep up with evolving market conditions.
Over-Optimization: Another disadvantage of algo trading is the risk of over-optimization. Traders may be tempted to fine-tune their algorithms excessively based on historical data to achieve exceptional past performance. However, over-optimization can lead to a phenomenon called "curve fitting," where the algorithms become too specific to historical data and fail to perform well in real-time market conditions. It is essential to strike a balance between optimizing strategies and ensuring adaptability to changing market dynamic
Over Reliance on Historical Data: Algo trading heavily relies on historical data to generate trading signals and make decisions. While historical data can provide valuable insights, it may not always accurately reflect future market conditions. Market dynamics, trends, and relationships can change over time, rendering historical data less relevant. Traders must be cautious about not relying solely on past performance and continuously monitor and adapt their strategies to current market conditions.
Lack of Adaptability: Another drawback of algo trading is its potential lack of adaptability to unexpected market events or sudden changes in market conditions. Algo trading strategies are typically based on predefined rules and algorithms, which may not account for unforeseen events or extreme market volatility. Traders must be vigilant and ready to intervene or modify their strategies manually when market conditions deviate significantly from the programmed rules.
Advantages of Manual Trading
Flexibility and Adaptability: Manual trading offers the advantage of flexibility and adaptability. Traders can quickly adjust their strategies and react to changing market conditions in real-time. Unlike algorithms, human traders can adapt their decision-making process based on new information, unexpected events, or emerging market trends. This flexibility allows for agile decision-making and the ability to capitalize on evolving market opportunities.
Intuition and Experience: Human traders possess intuition and experience, which can be valuable assets in the trading process. Through years of experience, traders develop a deep understanding of the market dynamics, patterns, and interrelationships between assets. Intuition allows them to make informed judgments based on their accumulated knowledge and instincts. This human element adds a qualitative aspect to trading decisions that algorithms may lack.
Complex Decision-making: Manual trading involves complex decision-making that goes beyond predefined rules. Traders analyze various factors, such as fundamental and technical indicators, economic news, and geopolitical events, to make well-informed decisions. This ability to consider multiple variables and weigh their impact on the market enables traders to make nuanced decisions that algorithms may overlook.
Emotional Intelligence and Market Sentiment: Humans possess emotional intelligence, which can be advantageous in trading. Emotions can provide valuable insights into market sentiment and investor psychology. Human traders can gauge market sentiment by interpreting price movements, news sentiment, and market chatter. Understanding and incorporating market sentiment into decision-making can help traders identify potential market shifts and take advantage of sentiment-driven opportunities.
Contextual Understanding: Manual trading allows traders to have a deep contextual understanding of the markets they operate in. They can analyze broader economic factors, political developments, and industry-specific dynamics to assess the market environment accurately. This contextual understanding provides traders with a comprehensive view of the factors that can influence market movements, allowing for more informed decision-making.
Creative and Opportunistic Thinking: Human traders bring creative and opportunistic thinking to the trading process. They can spot unique opportunities that algorithms may not consider. By employing analytical skills, critical thinking, and out-of-the-box approaches, traders can identify unconventional trading strategies or undervalued assets that algorithms may overlook. This creative thinking allows traders to capitalize on market inefficiencies and generate returns.
Complex Market Conditions: Manual trading thrives in complex market conditions that algorithms may struggle to navigate. In situations where market dynamics are rapidly changing, volatile, or influenced by unpredictable events, human traders can adapt quickly and make decisions based on their judgment and expertise. The ability to think on their feet and adjust strategies accordingly enables traders to navigate challenging market conditions effectively.
Disadvantage of Manual Trading
Emotional Bias: Algo trading lacks human emotions, which can sometimes be a disadvantage. Human traders can analyze market conditions based on intuition and experience, while algorithms solely rely on historical data and predefined rules. Emotional biases, such as fear or greed, may play a role in decision-making, but algorithms cannot factor in these nuanced human aspects.
Time and Effort: Implementing and maintaining algo trading systems require time and effort. Developing effective algorithms and strategies demands significant technical expertise and resources. Traders need to continuously monitor and update their algorithms to ensure they remain relevant in changing market conditions. This ongoing commitment can be time-consuming and may require additional personnel or technical support.
Execution Speed: While algo trading is known for its speed, there can be challenges with execution. In fast-moving markets, delays in order execution can lead to missed opportunities or less favorable trade outcomes. Algo trading systems need to be equipped with high-performance infrastructure and reliable connectivity to execute trades swiftly and efficiently.
Information Overload: In today's digital age, vast amounts of data are available to traders. Algo trading systems can quickly process large volumes of information, but there is a risk of information overload. Filtering through excessive data and identifying relevant signals can be challenging. Traders must carefully design algorithms to focus on essential information and avoid being overwhelmed by irrelevant or noisy data.
The Power of AI in Enhancing Algorithmic Trading:
Data Analysis and Pattern Recognition: AI algorithms excel at processing vast amounts of data and recognizing patterns that may be difficult for human traders to identify. By analyzing historical market data, news, social media sentiment, and other relevant information, AI-powered algorithms can uncover hidden correlations and trends. This enables traders to develop more robust trading strategies based on data-driven insights.
Predictive Analytics and Forecasting: AI algorithms can leverage machine learning techniques to generate predictive models and forecasts. By training on historical market data, these algorithms can identify patterns and relationships that can help predict future price movements. This predictive capability empowers traders to anticipate market trends, identify potential opportunities, and adjust their strategies accordingly.
Real-time Market Monitoring: AI-based systems can continuously monitor real-time market data, news feeds, and social media platforms. This enables traders to stay updated on market developments, breaking news, and sentiment shifts. By incorporating real-time data into their algorithms, traders can make faster and more accurate trading decisions, especially in volatile and rapidly changing market conditions.
Adaptive and Self-Learning Systems: AI algorithms have the ability to adapt and self-learn from market data and trading outcomes. Through reinforcement learning techniques, these algorithms can continuously optimize trading strategies based on real-time performance feedback. This adaptability allows the algorithms to evolve and improve over time, enhancing their ability to generate consistent returns and adapt to changing market dynamics.
Enhanced Decision Support:
AI algorithms can provide decision support tools for traders, presenting them with data-driven insights, risk analysis, and recommended actions. By combining the power of AI with human expertise, traders can make more informed and well-rounded decisions. These decision support tools can assist in portfolio allocation, trade execution, and risk management, enhancing overall trading performance.
How Algorithmic Trading Handles News and Events?
In the fast-paced world of financial markets, news and events play a pivotal role in driving price movements and creating trading opportunities. Algorithmic trading has emerged as a powerful tool to capitalize on these dynamics.
Automated News Monitoring:
Algorithmic trading systems are equipped with the capability to automatically monitor news sources, including financial news websites, press releases, and social media platforms. By utilizing natural language processing (NLP) and sentiment analysis techniques, algorithms can filter through vast amounts of news data, identifying relevant information that may impact the market.
Real-time Data Processing:
Algorithms excel in processing real-time data and swiftly analyzing its potential impact on the market. By integrating news feeds and other event-based data into their models, algorithms can quickly evaluate the relevance and potential market significance of specific news or events. This enables traders to react promptly to emerging opportunities or risks.
Event-driven Trading Strategies:
Algorithmic trading systems can be programmed to execute event-driven trading strategies. These strategies are designed to capitalize on the market movements triggered by specific events, such as economic releases, corporate earnings announcements, or geopolitical developments. Algorithms can automatically scan for relevant events and execute trades based on predefined criteria, such as price thresholds or sentiment analysis outcomes.
Sentiment Analysis:
Sentiment analysis is a crucial component of news and event-based trading. Algorithms can analyze news articles, social media sentiment, and other textual data to assess market sentiment surrounding a specific event or news item. By gauging positive or negative sentiment, algorithms can make informed trading decisions and adjust strategies accordingly.
Backtesting and Optimization:
Algorithmic trading allows for backtesting and optimization of news and event-driven trading strategies. Historical data can be used to test the performance of trading models under various news scenarios. By analyzing the past market reactions to similar events, algorithms can be fine-tuned to improve their accuracy and profitability.
Algorithmic News Trading:
Algorithmic news trading involves the automatic execution of trades based on predefined news triggers. For example, algorithms can be programmed to automatically buy or sell certain assets when specific news is released or when certain conditions are met. This automated approach eliminates the need for manual monitoring and ensures swift execution in response to news events.
Risk Management:
Algorithmic trading systems incorporate risk management measures to mitigate the potential downside of news and event-driven trading. Stop-loss orders, position sizing algorithms, and risk management rules can be integrated to protect against adverse market movements or unexpected news outcomes. This helps to minimize losses and ensure controlled risk exposure.
Flash Crash 2010: A Historic Market Event
On May 6, 2010, the financial markets experienced an unprecedented event known as the "Flash Crash." Within a matter of minutes, stock prices plummeted dramatically, only to recover shortly thereafter. This sudden and extreme market turbulence sent shockwaves through the financial world and highlighted the vulnerabilities of an increasingly interconnected and technology-driven trading landscape.
The Flash Crash Unfolds:
On that fateful day, between 2:32 p.m. and 2:45 p.m. EDT, the U.S. stock market experienced an abrupt and severe decline in prices. Within minutes, the Dow Jones Industrial Average (DJIA) plunged nearly 1,000 points, erasing approximately $1 trillion in market value. Blue-chip stocks, such as Procter & Gamble and Accenture, saw their prices briefly crash to a mere fraction of their pre-crash values. This sudden and dramatic collapse was followed by a swift rebound, with prices largely recovering by the end of the trading session.
The Contributing Factors:
Several factors converged to create the perfect storm for the Flash Crash. One key element was the increasing prevalence of high-frequency trading (HFT), where computer algorithms execute trades at lightning-fast speeds. This automated trading, combined with the interconnectedness of markets, exacerbated the speed and intensity of the crash. Additionally, the widespread use of stop-loss orders, which are triggered when a stock reaches a specified price, amplified the selling pressure as prices rapidly declined. A lack of adequate market safeguards and regulatory mechanisms further exacerbated the situation.
Role of Algorithmic Trading:
Algorithmic trading played a significant role in the Flash Crash. As the markets rapidly declined, certain algorithmic trading strategies failed to function as intended, exacerbating the sell-off. These algorithms, designed to capture small price discrepancies, ended up engaging in a "feedback loop" of selling, pushing prices even lower. The speed and automation of algorithmic trading made it difficult for human intervention to effectively mitigate the situation in real-time.
Market Reforms and Lessons Learned:
The Flash Crash of 2010 prompted significant regulatory and technological reforms aimed at preventing similar events in the future. Measures included the implementation of circuit breakers, which temporarily halt trading during extreme price movements, and revisions to market-wide circuit breaker rules. Market surveillance and coordination between exchanges and regulators were also enhanced to better monitor and respond to unusual trading activity. Additionally, the incident highlighted the need for greater transparency and scrutiny of algorithmic trading practices.
Implications for Market Stability:
The Flash Crash served as a wake-up call to market participants and regulators, underscoring the potential risks associated with high-frequency and algorithmic trading. It highlighted the importance of ensuring that market infrastructure and regulations keep pace with technological advancements. The incident also emphasized the need for market participants to understand the intricacies of the trading systems they employ, and for regulators to continually evaluate and adapt regulatory frameworks to address emerging risks.
The Flash Crash of 2010 stands as a pivotal moment in financial market history, exposing vulnerabilities in the increasingly complex and interconnected world of electronic trading. The event triggered significant reforms and led to a greater focus on market stability, transparency, and risk management. While strides have been made to enhance market safeguards and regulatory oversight, ongoing vigilance and continuous adaptation to technological advancements are necessary to maintain the integrity and stability of modern financial markets.
How Algorithmic Trading Thrives in Changing Markets?
Algorithmic trading (ALGO) can tackle changing market conditions through various techniques and strategies that allow algorithms to adapt and respond effectively. Here are some ways ALGO can address changing market conditions:
Real-Time Data Analysis: Algo systems continuously monitor market data, including price movements, volume, news feeds, and economic indicators, in real-time. By analyzing this data promptly, algorithms can identify changing market conditions and adjust trading strategies accordingly. This enables Algo to capture opportunities and react to market shifts more rapidly than human traders.
Dynamic Order Routing: Algo systems can dynamically route orders to different exchanges or liquidity pools based on prevailing market conditions. By assessing factors such as liquidity, order book depth, and execution costs, algorithms can adapt their order routing strategies to optimize trade execution. This flexibility ensures that algo takes advantage of the most favorable market conditions available at any given moment.
Adaptive Trading Strategies: Algo can utilize adaptive trading strategies that are designed to adjust their parameters or rules based on changing market conditions. These strategies often incorporate machine learning algorithms to continuously learn from historical data and adapt to evolving market dynamics. By dynamically modifying their rules and parameters, algo systems can optimize trading decisions and capture opportunities across different market environments.
Volatility Management: Changing market conditions often come with increased volatility. Algo systems can incorporate volatility management techniques to adjust risk exposure accordingly. For example, algorithms may dynamically adjust position sizes, set tighter stop-loss levels, or modify risk management parameters based on current market volatility. These measures help to control risk and protect capital during periods of heightened uncertainty.
Pattern Recognition and Statistical Analysis: Algo systems can employ advanced pattern recognition and statistical analysis techniques to identify recurring market patterns or anomalies. By recognizing these patterns, algorithms can make informed trading decisions and adjust strategies accordingly. This ability to identify and adapt to patterns helps algocapitalize on recurring market conditions while also remaining adaptable to changes in market behavior.
Backtesting and Simulation: Algo systems can be extensively backtested and simulated using historical market data. By subjecting algorithms to various market scenarios and historical data sets, traders can evaluate their performance and robustness under different market conditions. This process allows for fine-tuning and optimization of algo strategies to better handle changing market dynamics.
In summary, algo tackles changing market conditions through real-time data analysis, dynamic order routing, adaptive trading strategies, volatility management, pattern recognition, statistical analysis, and rigorous backtesting. By leveraging these capabilities, algo can effectively adapt to evolving market conditions and capitalize on opportunities while managing risks more efficiently than traditional trading approaches
The Rise of Algo Traders: Is Technical Analysis Losing Ground?
Although algorithmic trading (algo trading) can automate and optimize certain elements
of technical analysis, it is improbable that it will fully substitute it. Technical analysis is a financial discipline that encompasses the examination of historical price and volume data, chart patterns, indicators, and other market variables to inform trading strategies. There are several reasons why algo traders cannot entirely supplant technical analysis:
Interpretation of Market Psychology: Technical analysis incorporates the understanding of market psychology, which is based on the belief that historical price patterns repeat themselves due to human behavior. It involves analyzing investor sentiment, trends, support and resistance levels, and other factors that can influence market movements. Algo traders may use technical indicators to identify these patterns, but they may not fully capture the nuances of market sentiment and psychological factors.
Subjectivity in Analysis: Technical analysis often involves subjective interpretation by traders, as different individuals may analyze the same chart or indicator differently. Algo traders rely on predefined rules and algorithms that may not encompass all the subjective elements of technical analysis. Human traders can incorporate their experience, intuition, and judgment to make nuanced decisions that may not be easily captured by algorithms.
Market Adaptability: Technical analysis requires the ability to adapt to changing market conditions and adjust strategies accordingly. While algorithms can be programmed to adjust certain parameters based on market data, they may not possess the same adaptability as human traders who can dynamically interpret and respond to evolving market conditions in real-time.
Unpredictable Events: Technical analysis is often challenged by unexpected events, such as geopolitical developments, economic announcements, or corporate news, which can cause significant market disruptions. Human traders may have the ability to interpret and react to these events based on their knowledge and understanding, while algo traders may struggle to respond effectively to unforeseen circumstances.
Fundamental Analysis: Technical analysis primarily focuses on price and volume data, while fundamental analysis considers broader factors such as company financials, macroeconomic indicators, industry trends, and news events. Algo traders may not have the capacity to analyze fundamental factors and incorporate them into their decision-making process, which can limit their ability to fully replace technical analysis.
In conclusion, while algo trading can automate certain elements of technical analysis, it is unlikely to replace it entirely. Technical analysis incorporates subjective interpretation, market psychology, adaptability, and fundamental factors that may be challenging for algorithms to fully replicate. Human traders with expertise in technical analysis and the ability to interpret market dynamics will continue to play a significant role in making informed trading decisions.
The Ultimate Winner - Algo Trading or Manual Trading?
Determining whether algo trading or manual trading is best depends on various factors, including individual preferences, trading goals, and skill sets. Both approaches have their advantages and limitations, and what works best for one person may not be the same for another. Let's compare the two:
Speed and Efficiency: Algo trading excels in speed and efficiency, as computer algorithms can analyze data and execute trades within milliseconds. Manual trading involves human decision-making, which may be subject to cognitive biases and emotional factors, potentially leading to slower execution or missed opportunities.
Emotion and Discipline: Algo trading eliminates emotional biases from trading decisions, as algorithms follow predefined rules without being influenced by fear or greed. Manual trading requires discipline and emotional control to make objective decisions, which can be challenging for some traders.
Adaptability: Algo trading can quickly adapt to changing market conditions and execute trades based on pre-programmed rules. Manual traders can adapt their strategies as well, but it may require more time and effort to monitor and adjust to rapidly evolving market dynamics.
Complexity and Technical Knowledge: Algo trading requires programming skills or the use of algorithmic platforms, which can be challenging for traders without a technical background. Manual trading, on the other hand, relies on an understanding of fundamental and technical analysis, which requires continuous learning and analysis of market trends.
Strategy Development: Algo trading allows for systematic and precise strategy development based on historical data analysis and backtesting. Manual traders can develop their strategies as well, but it may involve more subjective interpretations of charts, patterns, and indicators.
Risk Management: Both algo trading and manual trading require effective risk management. Algo trading can incorporate predetermined risk management parameters into algorithms, whereas manual traders need to actively monitor and manage risk based on their judgment.
Ultimately, the best approach depends on individual circumstances. Some traders may prefer algo trading for its speed, efficiency, and objective decision-making, while others may enjoy the flexibility and adaptability of manual trading. It is worth noting that many traders use a combination of both approaches, utilizing algo trading for certain strategies and manual trading for others.
In conclusion, algorithmic trading offers benefits such as speed, efficiency, and risk management, while manual trading provides adaptability and human intuition. AI enhances algorithmic trading by processing data, recognizing patterns, and providing decision support. Algos excel in automated news monitoring and event-driven strategies. However, the Flash Crash of 2010 exposed vulnerabilities in the interconnected trading landscape, with algorithmic trading exacerbating the market decline. It serves as a reminder to implement appropriate safeguards and risk management measures. Overall, a balanced approach that combines the strengths of both algorithmic and manual trading can lead to more effective and resilient trading strategies.
It’s Not That You’re Not ProfitableI've made this serious mistake when I started out trading.
I skipped from strategy to strategy, methodology to methodology.
I've tried almost everything. Signals, account management, mentorships, PAMM, expert advisors, bots and paid indicators.
Everything seems to be profitable, until I put my hands onto it. Many times, I found some profitability. After depositing a bit more capital, I encountered large losses.
Why?
95% of the traders will not be profitable. Will I be in this statistic? I don't think so. I'm pretty sure I'm better than others!
Realization Of The Issue
The big issue I was facing at the beginning was searching for the holy grail. I don't have a plan. I switched from A to B within a few months of losing money. I was so fixated on getting rich quick through trading. Everything on the marketing material targeted at my desires. Survival, enjoying life, comfort and the perceived status of being rich and successful.
I was invested in the topic of personal development and personal finance at that time. While I was doing my goal settings, I realized that I have been losing close to 5 figures over a course of 2 years. This is bad for me because of 2 key problems.
I wasn't growing my net worth.
I was losing net worth.
At the rate I'm going, I will be working till I'm 65 before I can retire.
I gave myself another chance to do things properly. I read a lot of trading books, joined mentorships and watched a lot of YouTube videos.
I decided to give myself one last chance and one more year.
I started to see changes.
Human Are Emotional
We are all emotional. You are greedy. You fear drawdowns. Did you look at the posts people are posting on social media? Consistent high RR trades that yield them thousands of dollars a day. You aspire to be like them. You want that kind of strategy. You want to learn from them. But have you think about this. If they can produce such consistent high return results, why would they want to teach you how to trade? They can simply trade for big institutional players who will pay them large amount of money. They don't need to pitch to you to buy their courses and mentorship for a mere $99. This doesn't add up.
Trading Plan
If you fail to plan, you plan to fail.
The more I think about this, the more I got attracted to this quote. This is true in life, and even more relatable to traders. If you have a trading plan that gives you 3 RR per trade, stick to it. I know that it feels good to hit a homerun trade. Your trading plan says 3 RR per trade, but you dragged your TP to 10 RR. When the trade ends up in a loss, you scold the market. You could have taken the full profit at 3 RR if you followed your rules.
You deviate from your trading plan. You don't trade based on your backtesting results. You then say that your trading strategy doesn't work. Sounds logical?
Without a plan, you're just going in circles like what I did at the beginning. Circling from strategy to strategy, and methodology to methodology.
Without a plan, you're going to encounter losses after losses. You won't be getting your 6 figure income. You won't get to enjoy life. You won't get to live comfortably. You won't get to be seen as a successful person. What you will get to do is to work for a 9 - 5 until you're 65.
Achieve Consistency
You have to follow your trading plan. But before you even have your trading plan, you have to backtest. You have to have a least 100 trades to say that your trade can give you a certain result. The below tells you what's the win rate needed to be at least break even. If your strategy has a RRR of 1:3, aim for at least 30% win rate. Anything above 30% is a very profitable strategy.
When you follow your plan step by step, you take all the same trades. You leave no room for emotions and irrational behaviors. You wait for the same confirmation and set up every single time.
You don't need to care what other people say. You don't have to care about what people's analysis are. You do you own analysis. Different people view the market differently. You can be trading on the lower timeframe, but they are trading on the higher timeframe. We see different things.
Remember that anything can happen in the market. It take just one big institutional player to take you out, or to swing your trade to your target.
Profitability
Increasing your profitability comes from 2 angles.
1. Increasing your win rate
2. Don't take bad trades
It seems counter-intuitive to say that you can achieve more by doing less. With a trading plan and a trading journal, you are able to see the pattern over large number of trades. Analyze them and see why do some trades go wrong. Are there similar conditions that happened to your losing trades?
You must be thinking. "But I don't want a strategy that gives me 2 RR. That's not enough. I need higher RR strategy.".
Assuming you're risking 1% a trade, with an above breakeven win rate, you will profit 2% for a winning trade. If you're trading a $200,000 account, that is a $4,000 profit. Is that not enough? Not many people earns this much money in a month.
This is what I'm aiming to achieve. If I can scale my accounts even more, I need even lesser profits a month to achieve a $4,000 target per month.
Holy Grail
I gave myself one last chance to trading. You can call it luck, I call it perseverance. It was a really good mentorship. I learnt a lot from someone who has been there done that and is trading for a living.
I had my profitable trading strategy, but it requires me to trade on the 1 minute timeframe. It’s profitable but I haven't got my consistency in the live market. It was a low win rate and higher RR strategy. I traded live account straight away. Attempted prop firm, got a 200k funded account and blew it before I got my first payout. I discarded it.
My mentor was scalping on the seconds chart. Thinking that sitting down in front of the chart for 1 to 2 hours, I can finish my trading day. I found consistency, but I was lazy and got distracted easily. I soon discarded it after trading live for awhile. (What was I thinking. Where did my motivation went to?)
Another member shared a strategy with decent win rate and high RR. I spent a lot of time backtesting, live trading and saw some results. However, my psychology wasn't good enough to handle the drawdown. it’s not a good strategy for prop firm challenges too. So I gave up AGAIN.
Went back and gave myself another try. I used my original trading strategy. I tweaked it such that I will be trading on the higher timeframe to accommodate my lifestyle. I backtest a lot of course. Finally traded live, and found consistency. This led to my first payout with decent looking equity curve.
I took a long route to come back to where I’ve started. I've finally found my holy grail.
Framework
This is the framework of how I trade.
1. Markup your chart. Find the area of liquidity, point of interests, liquidity grab, direction of the market and demand and supply zones. Do your multi-timeframe analysis here. Higher probability trade is to buy at discount levels, and sell at premium levels.
2. Set alert at your point of interests (Where to buy and sell)
3. Write down your analysis on the chart. If the price hits your point of interest, I would expect X to happen. When X happens, I will do Y.
4. When the alert goes off, go back to your chart and see if your analysis in step 3 still holds.
5a. If yes, mark out roughly where your stop loss and profit target will be. See if the RR is decent enough. If yes, then wait for the price to give you a confirmation. If no, either wait for a refined entry on the lower timeframe, or to wait for another confirmation.
5b. If not, repeat step 1.
6. Wait for price to give you a confirmation. Calculate the lot size you need to open based on your risk management and place your order.
7. Once you're in the trade, you can either forget about your trade and let it hit TP or SL, or actively manage your position. This will depend on how you backtested your strategy.
8. Once your trade hits the TP or SL, journal it. Record your entry, take profit and stop loss. Take screenshots. Record your emotions and feelings before, during and after the trade.
This is how a trading plan should look like. A clear plan of action and train of thought. There should be actions taken before, during and after the trade.
Do not follow strictly if your trading strategy is different from me. You need to change it to fit your strategy and lifestyle.
Mentorship
Having someone who has been there done that before is important. A mentor can provide valuable advice that can define and reach your goals faster. A mentor will provide feedback and support you. A mentor will remove all the unnecessary information that you don't need.
A mentor must be able to look at any strategy and tell you what's not working and what you should stop. A mentor should not force you to use his strategy. He must be able share his mistakes. He must be able to show you solid trading results via 3rd party verification. 3rd party verification should be Myfxbook or Fxblue, not screenshots or excel worksheet. He should walk you through development as a person outside of trading.
Stay consistent. Stay safe. Success is just around the corner.
If you enjoy such content, feel free to click the like button and subscribe for more.
Let me know what are your thoughts and learning points in the comments below so others can learn from you too!
Please let me know what kind of topic you would like to read next :)
Happy weekend!
Exploring Bitcoin and Altcoin DominanceIntroduction
The dynamic landscape of cryptocurrency trading is filled with a multitude of variables that traders need to comprehend to navigate the financial waters successfully. One such vital aspect of understanding is the relationship between Bitcoin Dominance (BTC.D) and Other Cryptocurrencies Dominance (OTHERS.D). This article aims to provide an in-depth insight into this relationship and its long-term trends.
Bitcoin Dominance: What is it?
Firstly, to understand the relationship between these two, we must grasp what Bitcoin dominance implies. Essentially, Bitcoin dominance illustrates the ratio of Bitcoin's total market capitalization relative to the aggregate market capitalization of the entire cryptocurrency market. Expressed as a percentage on a scale from 0 to 100, it signifies the proportion of Bitcoin's capitalization compared to the total market capitalization.
Other Cryptocurrencies Dominance (OTHERS.D)
Similarly, Other Cryptocurrencies Dominance (OTHERS.D) represents the total market capitalization of the top 125 altcoins, excluding Bitcoin and some other leading cryptocurrencies. It reflects how the altcoins are faring against the total market cap in the crypto market.
Correlation Between BTC.D and OTHERS.D
Now, the crucial question is, why should we care about these percentages? The significance of this relationship is revealed through the Correlation Coefficient indicator, which quantifies the degree to which these two indices move in relation to each other.
A Correlation Coefficient value of +1 indicates a strong positive correlation, signifying that both instruments tend to rise or fall simultaneously. Conversely, a correlation coefficient of -1 represents an inverse relationship, meaning when one instrument rises, the other falls. A coefficient of 0 suggests no apparent correlation, implying that the two instruments move independently of each other.
Historical data reveals that the correlation between BTC.D and OTHERS.D is often around -0.9. This suggests an inverse relationship where an increase in Bitcoin dominance typically corresponds to a decrease in altcoins dominance, and vice versa. This correlation is significant as it guides traders on whether to shift their focus towards Bitcoin or altcoins.
Long Term Trends
When we delve deeper into the long-term trend analysis of BTC.D and OTHERS.D, a broader picture begins to emerge. This broader view becomes more apparent when we visualize these trends, with Bitcoin dominance (BTC.D) represented in orange and Others.D in red, which allows for a clear discernment of an inverse correlation trend.
Over time, Bitcoin dominance, as depicted by the orange trend, has tended to display a downward trajectory. This indicates that Bitcoin's proportion of the total market cap has been steadily diminishing. In stark contrast, Others.D, represented in red, has shown a long-term upward trend. This indicates that the dominance and capitalization of altcoins are gradually rising relative to the total market cap.
Conclusion
Understanding the symbiosis between Bitcoin Dominance (BTC.D) and Other Cryptocurrencies Dominance (OTHERS.D) is instrumental for navigating the cryptocurrency trading landscape effectively. A clear trend, observable over the long term, shows a steady decrease in Bitcoin dominance juxtaposed with a corresponding increase in altcoin dominance.
This evolution might be attributed to several factors. One of these could be the proliferation of new cryptocurrencies entering the market. Another factor could be the progressive advancement of blockchain technology, which is steadily pushing the envelope of modernization.
It is essential, therefore, to regularly analyze and monitor the BTC.D and OTHERS.D charts. Spotting a distinct trend in either direction could offer valuable insights for your investment strategy. Attempting to follow these trends can potentially provide advantageous trading opportunities.
The beauty of Bitcoin's design lies in its transparency. Nowhere else is the flow of capital as visible as in Bitcoin. This visibility lends a unique perspective, providing traders a strategic edge. By embracing this, you can bolster your understanding of these market dynamics, facilitating more informed and effective trading decisions in the fluctuating world of cryptocurrency.
Thank you for reading this article. I hope it has provided you with a useful insight into the relationship between Bitcoin Dominance and Other Cryptocurrencies Dominance, thereby enhancing your understanding of cryptocurrency trading. Your pursuit of knowledge in this ever-evolving field is commendable. Stay informed, stay ahead!
Best Regards,
Karim Subhieh
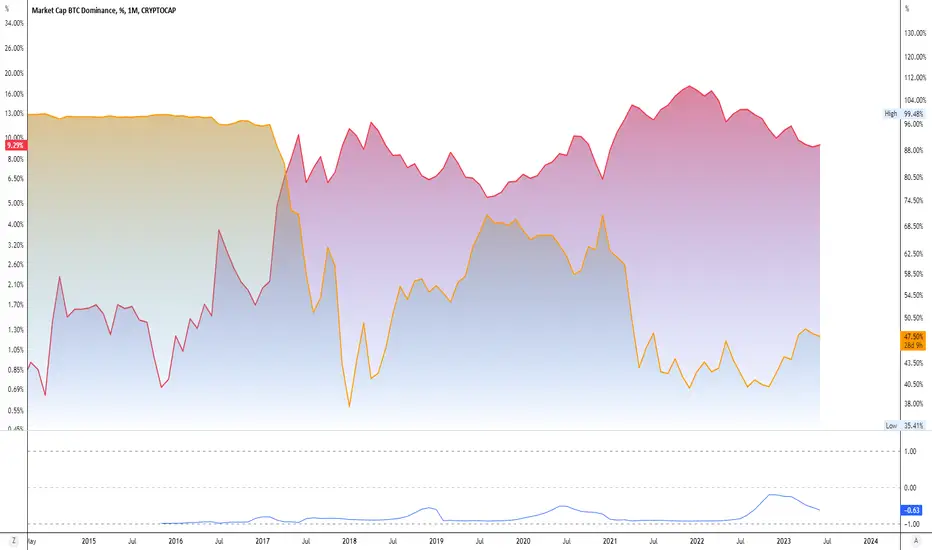
EDUCATION: Hedging vs Stoploss Some rookie traders frequently trade without a stop loss because they think they can avoid being stopped out by market swings or rollover. However, if the market moves against them, this technique could result in severe losses. In this article, we'll cover why trading without a stop loss is a bad idea and how stop losses can be used efficiently or, as an alternative, how to employ hedging techniques.
What is a stop loss?
A stop loss is an order that you place on your trading platform to automatically close your position at a certain price level if the market goes against you. For example, if you buy EUR/USD at 1.2000 and set a stop loss at 1.1950, you are limiting your potential loss to 50 pips if the price drops below that level. A stop loss can help you control your emotions and prevent you from holding on to losing trades for too long, hoping that the market will turn around.
There are several reasons why trading without a stop loss is a bad idea, such as:
🔹 You expose yourself to unlimited risk. Without a stop loss, you have no exit plan and you are relying on your gut feeling or luck to close your trade at the right time. However, the market can be unpredictable and volatile, and sometimes it can move hundreds or thousands of pips in a matter of minutes or hours. If you don't have a stop loss, you can lose more than your initial investment and even end up with a negative balance in your account.
🔹 You increase your stress level. Trading without a stop loss means that you have to constantly monitor your positions and worry about every pip movement. This can be very stressful and exhausting, especially if you have multiple trades open at the same time. You may also experience fear, greed, anxiety, anger, frustration, and other negative emotions that can cloud your judgment and affect your trading performance.
🔹 You reduce your profitability. Trading without a stop loss can also reduce your profitability in the long run. By not cutting your losses short, you are letting them eat into your profits and reduce your win rate. You may also miss out on better trading opportunities because you are too focused on your losing trades or afraid to open new ones. Additionally, you may incur higher trading costs due to wider spreads, commissions, swaps, and slippage.
How to use stop losses effectively?
Effectively utilizing stop losses will help you increase your trading profits and stay away from the risks of trading without one. The following advice will help you use stop losses effectively:
🔹 Determine your stop loss level using technical analysis. You can use a variety of technical tools and indicators, including as support and resistance levels, trend lines, Fibonacci retracements, moving averages, volatility indicators, etc., to pinpoint areas where the market is expected to reverse or rebound. Depending on whether you are going long or short, you should set your stop loss just below or just above these levels.
🔹 Use risk management rules to determine your position size. You should always calculate how much money you are willing to risk on each trade and adjust your position size accordingly. A common rule of thumb is to risk no more than 1% or 2% of your account balance per trade. This way, you can limit your losses and preserve your capital for future trades.
🔹Use trailing stops to lock in profits. A trailing stop is a type of stop loss that moves along with the price as it goes in your favor. For example, if you buy EUR/USD at 1.2000 and set a trailing stop of 20 pips, your stop loss will move up by 20 pips every time the price moves up by 20 pips or more. This way, you can protect your profits and let your winners run.
NB: In related ideas I have attached my publication on trailing stop loss and support and resistance for those who would like to know more on those topics
If a trade is having a hard time using stop losses what they can do as an alternative is hedge there position. Similar to how stock traders will use stock options to hedge their risk in the markets.
What is hedging ?
Hedging is a trading strategy that involves opening a position opposite to an existing one, in order to reduce the risk of loss from unfavorable price movements. For example, if you are long on EUR/USD, you can hedge by opening a short position on the same currency pair. This way, if the price goes down, you can offset some or all of the losses from your long position with the profits from your short position.
Why this and not a stop loss ?
The reasons someone would do this is because a stop loss can be triggered by temporary price fluctuations that do not reflect the true market direction. This can result in premature exits and missed opportunities. Moreover, stop loss can expose you to slippage and gaps, which are situations where the market price jumps over your stop loss level and executes your order at a worse price than expected causing you to loss more that you anticipated. hedging your position protects you from those situations. By hedging, you can keep both positions open until you are confident about the market direction and close the losing one when the price starts trending in your direction again.
Things to note: Though you have positions opened in both directions and in theory you should not lose any additional funds once you've initiated the hedge it is worth noting that you can still have fees both positive and negative from swap fees at rollover depending on the direction and the asset you are trading. I will be doing a post soon on heading as a stop loss as a standalone topic and also swaps and rollover.

WHAT IS THE WYCKOFF METHOD?The Wyckoff Method is a trading strategy developed by Richard D. Wyckoff. It is based on the principles of supply and demand and is used to analyze price movements in financial markets. The Wyckoff method involves identifying support and resistance levels, analyzing volume and volatility, and studying the relative strength of different markets and uses these patterns to identify trading opportunities. The strategy is used by traders to identify trends and determine entry and exit points.
The four cycles defined by Wyckoff's model of market behavior are:
Accumulation
Impulse leg is an upward trending movement
Distribution
Downward movement
Three Wyckoff Principle 📜
The supply and demand law, the cause-and-effect link, and the connection between effort and results are the three rules that make up the Wyckoff trading strategy. The principle of supply and demand. If there is an increase in demand over supply, it leads to an increase in the value of a financial instrument. Prices rise because the quantity of an asset is limited and investors are willing to pay more when there is a shortage of the asset. If the demand for the asset falls relative to the supply, the asset loses in value. When supply and demand are in balance, the price is roughly in the same place, which causes the volatility in the market to decrease to a minimum.
According to Wyckoff, accumulation time correlates with an uptrend, while distribution, in contrast, leads to a downtrend in what is called a supply and demand imbalance. When an asset spends a lot of time in the accumulation or distribution zone, there are often strong impulsive moves to break through the zone. A bullish trend will continue upward if a higher price is accompanied by high volume. However, if prices are rising and volumes are high, the trend will shift downward. According to Wyckoff's method, the market should be viewed from the point of view of the main participants, or market makers.
Accumulation 📊
Market makers accumulate assets. Accumulation is when investors buy a lot of a certain asset over time. This makes their holdings bigger, which can lead to higher returns. Some investors believe a certain asset is undervalued and will go up in value. Also, some investors want to diversify their portfolio by adding a new asset.
Impulse move 📈
Market makers eventually start to trade more assets, which causes the price to rise. Investors are becoming greater in number and demand goes up. The volume rises and a trend quickly ascends to new highs. It is typically characterized by a sharp, sustained move in price. This type of movement is often seen during a bull or bear market, when investors are trying to capitalize on the sudden change in price.
Distribution 📉
Market makers distribute assets they have purchased by offering profitable positions to participants who just recently joined the market. Indicators of the cycle include sideways price movement and rising volumes. The demand is absorbed up until the point of exhaustion. A lot of securities or other financial instruments are sold in a short time. This is usually done by institutional investors, like mutual funds, hedge funds, and pension funds, to raise cash or to reduce their securities holdings.
Sell-off 📉
Supply exceeds demand. The market maker reduces the price to a certain level. As soon as the decline is completed, the market enters the next accumulation cycle. On the gold chart, we can see each of Wyckoff's cycles: accumulation, momentum, distribution and depreciation. The phases of accumulation and distribution may differ.
Conclusion 💡
The Wyckoff technique gives detailed principles and strategies, to assist traders in making reasoned decisions. His work explains the market's logic and psychology, which determine how decisions about buying and selling are made. Numerous oscillators are integrated with cluster analysis in the method.

The US Treasury cash rebuild; volmageddon or a nothing burger
While Congress still needs to pass the debt limit agreement, the debate in the market has shifted to the need for the US Treasury Department (UST) to rapidly rebuild its depleted cash levels.
We have no understanding of the timetable, but already the debate is whether the significant level of Treasury bill issuance will result in a major headwind for global financial markets, while others believe this is pure hype.
Some are contrasting what lies ahead as a massive liquidity withdrawal from financial markets – Quantitative Tightening (QT) on steroids – where we will essentially see USD liquidity sucked out of the system.
The process of raising cash levels
To raise and rebuild its now low cash balances, the US Treasury Department (UST) will look to issue around $1.3t of US T-bills over the following 12 months. Around $700b of this T-bill issuance will be fast-tracked, tapping up the market within a matter of months, with the private sector expected to buy what the Treasury is selling.
US Treasury bills (‘T-bills’) are high-quality debt instruments which have a maturity of less than 12 months.
With the US Treasury replenishing its cash balances it would be able to make ongoing payments and meet its obligations. Plus they will keep its additional capital on the Fed’s balance sheet (under the Treasury General Account or ‘TGA’) for future payments.
The effect on markets
The concern in the market is around the notion of a “liquidity drain” – whereby the UST remove such staggering levels of liquidity out of the system, in a short period, that we see bank funding costs heading markedly higher and USD rates rising to highly concerning levels. Could this dynamic cause renewed concerns in the US regional banks?
Drilling into the theme - the potential stress in markets really comes down to who exactly absorbs the issuance, as this is key in determining the potential impact on system liquidity.
A drawdown in RRP balances
US money market funds (MMF) have historically been the big buyers of T-bill issuance and could again play a key role in supporting the USTs quest to recapitalize. Money funds currently have near-exclusive access to the Fed’s Reverse Repo facility or ‘RRP’ (TradingView code – RRPONTSYD), and have around $2.2t parked there, where they get 5.05% (annualized) risk-free.
If US T-bills are issued to the public at a yield close to the RRP rate (of 5.05%), then there’s a case that we see money funds withdrawing a sizeable level of holdings from the RRP facility and supporting the US T-bill issuance.
It is widely considered that risk assets (e.g. equities) would not be impacted when a large percentage of the USTs issuance is funded by RRP balances. In fact, some are saying this could be a net positive given there has been a scarcity of high-quality T-bills in the system of late.
A drain in bank reserves would be more problematic for markets
Banks are required to hold a level of reserves as a percentage of their deposit base. However, banks/depository institutions often hold reserves in excess of their regulatory requirements - this can be highly advantageous should they have to meet increasing deposit withdrawals.
Instead of keeping these excess reserves (cash equivalent) on their balance sheet, they can be offered to the Fed, where since 2008 they will receive interest paid at 5.15% (annualized) through the Fed’s IORB facility (Interest on Reserve Balances - TV code: WRBWFRBL).
The RRP and IORB spread guides overnight lending rates
With the RRP rate currently at 5.05% and IORB paid at 5.15% this spread represents the corridor by which the fed funds effective rate (EFFR) – the rate at which banks will borrow/lend cash overnight – trades. This is the fundamentals of how the Fed sets monetary policy and to date, it has been very effective.
The concern from some is where money funds have less involvement in supporting UST T-bill issuance - resulting in a comparatively low RRP drawdown – with a large percentage of the issuance supported by a drain of bank reserves.
Some strategists estimate that of this potential $700b in near-term T-bill issuance around $400b to $500b of this will be funded by the liquidation of bank reserves balances. That could the scenario where we could – in theory - see higher market volatility.
It’s really about a scarcity of reserves
There are currently $3.28t of excess bank reserves parked on the Fed’s balance sheet - so if we were to see a $500b drawdown in reserves then this balance would fall quite rapidly to around $2.8t. This is important because many feel the Lowest Comfortable Level of Reserve (LCLoR) that must be in the financial system is between $2.5t and $2.2t.
Interestingly, some feel an aggressive decline in reserves would be a headwind for risk assets – if we look at the regression between reserves and S&P500 futures, we can see an R^2 of 0.79. In effect, 79% of the variance in US equity futures can be explained by reserves – statistically, it’s very meaningful.
So this injects some credence to the idea that reserve drawdown could be a short-term headwind for risk. However, where this becomes interesting, and where we would see true stress in the system is through monitoring the spread between the Fed’s effective rate (TradingView Code: EFFR) and upper bound of the rates channel and Interest paid on Reserve Balances (on TradingView code: IORB).
Currently, this spread sits at -7bp, but if we were to see the fed funds effective rate (EFFR) moving to the top of this corridor and even trading at a premium to IORB, it’s at this point where the market is telling us that we’re moving closer to a scarcity of reserves in the system.
This is where things would be far more prone to breaking, and the Fed will need to act swiftly.
When EFFR trades at a premium to IORB it essentially portrays that the money market channels are breaking and demand for short-term loans is becoming increasingly inelastic – subsequently, those in need of short-term loans will continue to pay ever higher prices.
Of course, this may not play out. We may see reserves falling precipitously and risk assets and the USD show no relationship at all to this dynamic. However, it is a risk, and we need to recognise the triggers and be open to the possibility it does cause a higher volatility regime, especially given it comes at a time when EU banks are having to pay back E500b of TLRO loans to the ECB.
Price is true, but I will be the moves in the KRE ETF (US regional bank ETF), as well as watching the EFFR- IORB spread as this could be far more important for the USD and signs of increased risks in the financial system.
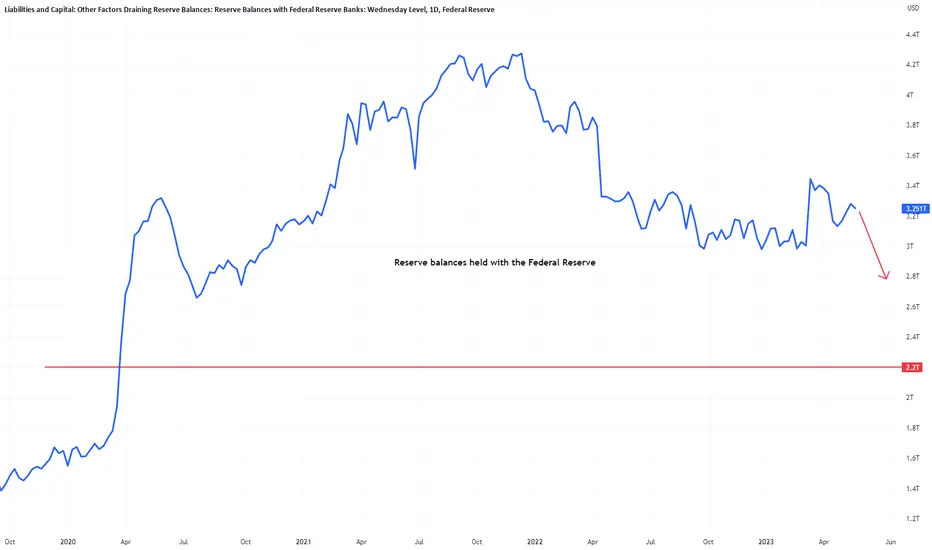
INFORMATIONAL : THE UPSURGE OF PROPRIETARY TRADING FIRMS
There has been a recent upsurge of CFD prop firms appearing. These prop firms offer traders the opportunity to trade with their capital and earn a percentage of the profits. But are these prop firms better than trading with a broker? And what are the risks and benefits of joining them? In this publication, we will explore these questions and more.
🔹What are CFD Prop Firms?
CFD prop firms are different from traditional prop firms in several ways. Traditional prop firms typically employ traders and give them access to proprietary trading tools and tactics as well as training and coaching. Contrarily, CFD prop businesses fund traders once they successfully complete a task or audition rather than hiring them. Typically, the audition entails paying a fee and achieving specific trading goals within a predetermined time span. A profit target, a maximum drawdown limit, a daily loss limit, and other risk management guidelines could be part of the trading objectives.
If a trader passes the audition, they will receive a funded account with a certain amount of capital, ranging from $10,000 to $1 million or more depending on the prop firm. The trader can then trade with the prop firm's capital and keep a percentage of the profits, usually between 50% to 80%. The prop firm will also monitor the trader's performance and enforce the same trading objectives as in the audition. If the trader violates any of the rules or loses too much money, they may lose their funded account or have to start over.
🔹Benefits of Joining a CFD Prop Firm
Joining a CFD prop firm gives traders access to more capital than they would otherwise not have, which is one of the key advantages. As a result, they may be able to trade more instruments, diversify their portfolio, and boost their earning potential. Another advantage is that the trader's downside risk is diminished because they are just putting their audition fee at danger and nothing more, not their own money. Additionally, certain prop companies provide extra advantages like coaching, education, community support, scaling plans, and bonuses.
🔹Drawbacks and Challenges of Joining a CFD Prop Firm
However, joining a CFD prop firm also has some drawbacks and challenges. One of them is that it can be difficult to pass the audition and maintain the funded account, as some of the trading objectives can be very strict and unrealistic. For example, some prop firms require traders to make a 10% profit within 30 days while keeping their drawdown below 5%. This can put a lot of pressure on traders and force them to overtrade or take excessive risks.
Some prop companies may not be transparent or reliable and may not actually supply real money to trade with, which is another disadvantage. Instead, they might run a Ponzi scheme or use the audition fees to distribute the earnings. Therefore, before joining any prop firm, traders should exercise due diligence and investigation. The repute of the prop firm, regulation, fees, profit splits, trading products, leverage, platform, customer support, and withdrawal procedures are a few of the variables to take into account.
Finally, another challenge is that having more capital does not necessarily mean being a better trader. Trading with more money can also increase the psychological pressure and emotional stress that traders face. Therefore, traders need to have a solid trading plan, strategy, discipline, and risk management skills before joining a prop firm. They also need to be realistic about their expectations and goals, and not rely on prop firms as a shortcut to success.
🔹Conclusion
In conclusion, CFD prop firms can be a viable option for traders who want to trade with more capital and earn more profits while limiting their downside risk. However, they also come with some challenges and risks that traders need to be aware of and overcome. Therefore, traders need to weigh the pros and cons of joining a prop firm versus trading with a broker based on their own circumstances and preferences. Trading with a CFD prop firm can be a great opportunity for traders who have a proven track record of profitability and want to leverage their skills to make more money. One of the main issues is that the CFD prop industry is heavily unregulated and lacks transparency and accountability. This means that traders may not have legal protection or recourse in case of disputes or frauds. Moreover, some prop firms may impose strict rules and conditions on their traders, such as high fees, unrealistic targets, or limited withdrawal options.
Therefore, before signing up with a CFD prop firm, traders should always conduct their due diligence and research. They should search for reputable and reliable prop companies that have a good track record, transparent terms and conditions, and equitable profit-sharing plans. Additionally, they should contrast various prop businesses and pick the one that best matches their trading preferences, objectives, and style. Additionally, traders should keep in mind that the best option to guarantee complete control and security over their trading activity remains opening their own trading account with a reputable broker.