How To Find New Stocks To TradeHey Everyone! 👋
Ever get tired of looking at the same tickers? Looking to learn about different sectors of the economy? Want to broaden the number of assets you trade?
Check out our Sparks .
We created Sparks to quickly inspire you to dig deeper, to find new and interesting opportunities in markets. Sparks are curated watchlists built around interesting themes.
Here are a few examples:
AI Stocks : For when you want to bet on the rise of the machines 🤖
Legacy stocks : Companies that have been owned by the same family for generations ⌛
The Death Industry : Someone has to make money on coffins, right? 💀
Space Stocks : For when you want your portfolio to blast off into zero G. 🚀
Check them out and then let us know what your favorite Spark is by sharing a link in the comments below! Three lucky people will win some special prizes including 1 year of Premium, 1 year of Pro+, and 1 year of Pro. Bonus points (a chance to win a TradingView mug) if you add a quick summary of why that spark is your favorite.
Drawing ends at Noon EST, this Wednesday. Good luck to all! 😎
-Team TradingView
Community ideas
NYSE Comp: Broadening Top Potential Macro WarningThe NYSE composite has spent the last year building a classic broadening top pattern. The pattern develops as strong hands distribute to weak hands, and when it occurs, often marks a transition from bull to bear.
1. Broadening formations are relatively rare and because the pattern itself is difficult to trade systematically (as the boundaries are continually moving farther apart) aren't given a lot of attention in literature.
a. Edwards and Magee in their seminal "Technical Analysis of Stock Trends" suggest that the broadening top, as a rule, only appears near the end or in the final phases of long bull markets.
b. Shabacker in his classic "Technical Analysis and Stock Market Profits" also remarks that the pattern is rare, but extremely important, often marking an important transition from bull to bear.
2. In my experience both Shabacker and Edwards and Magee are correct. They are rare and generally very hard to trade (so I don't bother) but they do offer an important warning of a potential phase transition.
3. Note that the pattern isn't always well defined, with overthrows and underthrows of the pattern boundaries occuring regularly. This is what makes it hard to trade or design a trading strategy around.
a. The pattern is extremely compelling when it appears in individual equity charts.
As I see it, these are the important chart elements.
1. The composite broke the trendline from the March 2020 low. This changed the weekly trend from up to neutral.
2. After breaking the trendline, the Comp spent most of the next year moving laterally and tracing out a clear broadening formation, warning of a potential phase transition.
3. Over the last few weeks the Comp violated the rising trend line (marked on the chart) along the last three internal trend line lows, and accelerated to the lower boundary of the pattern.
4. I have included the 10 and 40 week moving averages. The two averages are roughly equivalent to the 50 and 200 day averages. Note that the 10 has rolled over and is moving to meet the flattened out 50. Often a narrowing between two moving averages marks an important market decision point. Its interesting that it is occuring at the very moment when the broadening formation appears to be nearing a conclusion.
5. If the market does begin to breakdown there are several initial move targets that can be constructed. I like to look for confluences of move targets and chart supports. The more the merrier.
a. I like to overlay the .382, .500 and .618% retracement targets first.
b. Next I locate chart supports. In this case, the area around the 14183 high from early 2020 can be expected to generate at least some buying interest.
c. There is also a measured move target that can be generated using the width of the broadening top, it projects to roughly 14400.
d. 14089 is the .382% Fibonacci retracement.
6. The support confluence provided by the pivot, the Fibo and the measured move suggest an initial support zone between 14089 and 14400. I would clearly watch this roughly 2% wide zone for reversal behaviors to either reduce shorts or perhaps, if the right behaviors develop, consider new longs.
But again, the MAIN point is not so much generating trading targets as recognizing the pattern as potentially a harbinger of an important trend change. This is particularly important against the context presented in the macro overview posts of the last few weeks.
Good Trading:
Stewart Taylor, CMT
Chartered Market Technician
Shared content and posted charts are intended to be used for informational and educational purposes only. The CMT Association does not offer, and this information shall not be understood or construed as, financial advice or investment recommendations. The information provided is not a substitute for advice from an investment professional. The CMT Association does not accept liability for any financial loss or damage our audience may incur.

How To Succeed In Your TradingFocus on one single trading strategy
One thing that many people try and do is switch between strategies constantly. This is setting you up for failure, and if the concept of probabilities is truly understood, you will comprehend the reasons why a single strategy will work.
Any strategy is not going to have a 100% win rate, so first you should attempt at getting 50% of your trades right. After that mastering a 2:1 Reward to risk ratio is what will make you profitable. Trying to juggle many strategies will have you working tirelessly, but not moving forward in any particular one.
Less trading, more education
Many people have the conception that spending countless hours in front of the screen looking for potential set ups is how it should be, however that is completely wrong in my eyes. I spend minimal time now looking at charts and set ups, I highlight key levels I want to look at, along with alerts, and simply wait for the market to head there. Time spent looking at charts should be simply for education and mastering your strategy through back testing or simply understanding previous data.
Approach the market from a neutral position
Anyone that knows me knows how big I am on trading psychology and how I believe it is the most important aspect of trading.
Emotions in trading can be one of your greatest enemies as it can lead you to failure even after your success. There are scenarios where you can take trades and be in positive which will lead you to feel over confident, happy, and those will ultimately will lead to irrational decisions if you let them. Those emotions will make you believe you are better than the markets, or that you can outsmart them, ultimately leading your successful trade to turn into a failure. The same can happen when you feel the opposite and lack confidence to enter another trade due to a loss, or think have feelings of doubt.
This is why the market needs to be approached by a completely neutral position. Once you understand that for every person on one side of a trade, there is someone on the opposite side, you will begin to understand that the market itself is just a whole bunch of neutral information moving in nobody’s favour.
Write your goals
Affirmations are great and something that has helped me in every aspect of my life and not just trading. It is very important to write down your goals in order to manifest them into reality. All ideas first begin in the mind, and then come into the physical. Your goals need to be solidified, definite, and written down in order for your mind and yourself to know exactly what you are going after.
Every single day, you need to read your goals aloud, envision them in your mind with every bit of detail possible in order to bring them into the physical. In order to achieve a goal you need to arrive at the destination first in your mind.
Relax
There is no need to rush a single thing in your trading journey, and believe me take it from my experience, every time I tried to, I failed. People attend university for years before going out into a career which then takes many years before mastering it, yet people want to master trading in a year.
Patience is required in all aspects of trading, whether it’s on the charts themselves, or with your strategy, or with your learning curve. It all requires patience. If you are going after trading as a serious life career which you aim to remain in, then relaxing and taking your time is the first step. Nothing great comes from rushing it, especially the markets.
Know how to handle your trades
Based on your strategy and the concept of probability there are a number of things needed in order to appropriately handle your trades.
Firstly, don’t touch your stop loss. I cant say this enough, but stop losses are determined as the final barrier before the trade is invalid, and they are determine before entering the trade. If you find yourself moving your stop, ask yourself why. You will find out mostly its out of fear of losing your money, which is one of the 4 fears of trading. Accept your loss and let the trade stop out, you had it there for a reason.
Also, don’t leave trades behind out of fear. If you have a strategy that you have confidently developed, you should understand that the overall should be a greater number of winners than losers, and you should not leave trades behind out of fear, because they can be the ones that perform the best and make up for the losers.
Another thing to have in place is an appropriate strategy for exiting your trades. Many people have trades that are in profit, however due to the lack of knowledge on how to exit their trades, they still end up not profitable. You need to have a system on how to exit your trades appropriately and at what levels. Always remember, the profit running on a trade is not yours until its closed.
Risk management
Yes, I know you have heard it and read it a thousand times already, but you have no idea how important risk management is until the day you master it and recognise it was the single greatest thing holding you back from success.
People can have amazing strategies, the best reward to risk ratios, but with the inappropriate risk management trust me it means absolutely nothing. I have seen people overleverage on a trade simply because it “looked too good” compared to other trades, only for it to be the worst of the bunch.
I have seen people lose tremendous amounts of money and one thing I can promise you is not a single one of these people lost 100 trades in a row at 1% a trade. Every single one of them lost their entire accounts due to ONE trade that they married.
Risk management should be one of your main areas of focus, because believe me if you have mastered it, even with an average strategy you are doing much better than someone with an exceptional strategy with no adequate risk management.
Keep track of your performance
The only way to improve in any aspect of life is to first recognise what needs change and then work on it. It is very important to actually understand your positives and negatives and have them all tracked. A journal is one of the first steps in order to look in the mirror. Being completely honest is the only way a journal will work, and lying is only lying to yourself. If you are after serious improvement you need to appropriately identify all your flaws in order to better them.
You should never feel down or behind, remember trading the markets is one of the biggest psychological challenges one can face, and that is exactly why not everyone is suited for them. Instead see it as a challenge to better yourself and achieve the perfection and discipline you have always desired on and off the charts. Trading the markets will teach you lessons that you will carry with you throughout your entire life and not just on the trading floor.
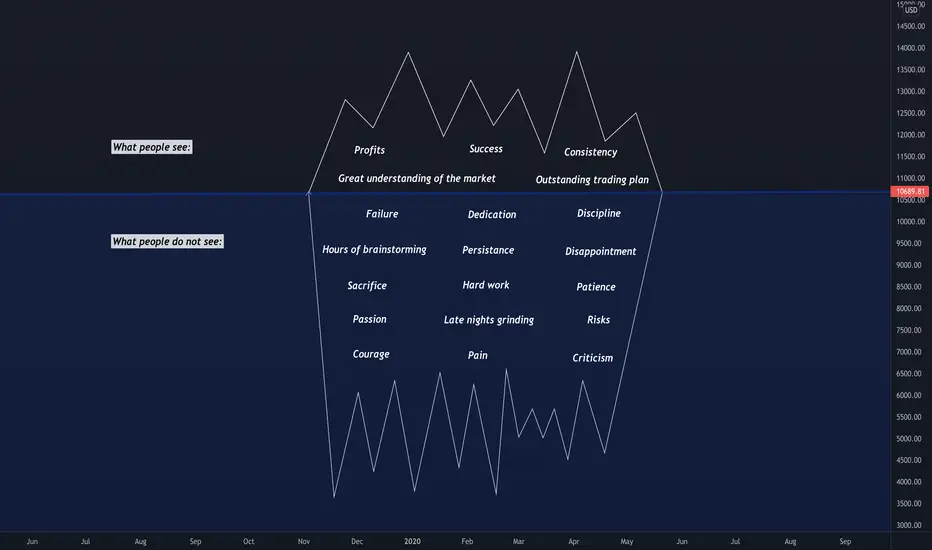
Success is a one big IcebergJust like real life, trading life is full of ups and downs. You know those days when you wake up with an absolutely awful mood and you can't figure out possible reasons? Well, there could be several factors influencing it: negative energy of the outside world, bad weather, personal problems and so forth. It is very similar to checking the markets and noticing that everything is so choppy that there is nothing to trade. Several determinants here as well, such as heavy economic news, holidays, or just a bay day with no opportunities (after all, not every day is a trading day). One thing that gets us through these challenges faced is patience, because, after all, time heals all pain wounds and fixes most of our problems. I quote Shakespeare: “The evil that men do lives after them; The good is oft interred with their bones". To reverse-engineer and interpret it into the trading language: "People only see the end goal, the glory, the monumental win. They don’t see the dedication, hard work, persistence, discipline, disappointment, sacrifices, and many failures it takes to reach success". In more simple terms, people only see the tip of the Iceberg (success, amazing profits, consistency), and not the bottom of it (sleepless nights, hard work, dedication, failure, pain).
Not a single skill is learnt over the course of a night. Just like it takes several years of practice, hard work and expertise to become a successful lawyer, a famous actor, and an exceptional doctor, it takes years of hard work, passion, and dedication to become a consistently profitable trader/investor.
IWM: The most interesting chart in the world: As of Friday (Jan 21) IWM has fallen out of a long range of distribution, produced both daily and weekly closes outside the trading range, and importantly has the potential to produce a large move. In this piece we discuss the trading range, mostly from a Wyckoff perspective, show multiple ways to start thinking about how far the move might progress, and finally take a look at IWM in terms of its strength relative to the higher quality SPX.
Again, there is not a trading recommendation attached to these observations. The CMT course offers an excellent way to learn more about the concepts discussed below.
1) The most important chart feature is the trading range. Long trading ranges represent zones where supply and demand move into balance.
a. Ranges are zones where strong hands / smart money accumulate new shares if they are bullish, or distribute existing shares if they are bearish.
b. In early November price attempted to break out of the top of the range, but failed. In Wyckoff terms this is known as a terminal upthrust. The failure is bearish and confirmed the view that the range represented distribution.
c. The upthrust was followed by a high volume decline back to the lower bound. The volume expansion and solid thrust strongly suggested that price was likely to break out of the trading range.
d. There was some buying as the market tested the bottom of the range for the last time (note the very low volume bounce). My interpretation is that traders who had repeatedly bought the trading range lows, tried to buy again. They failed to recognize the significance of the upthrust and of the development of high volume in the days just prior. Now they are trapped.
2) On Friday, price fell through the range lows, trapping longs and accelerating lower on high volume.
3) Was the volume high enough to exhaust the immediately available supply? I would think not. Modern selling climaxes often take multiple days to unfold, and are not likely to occur this soon after falling out of a long zone of distribution. Remember, the long range attracted many weak handed buyers who are now being forced to liquidate.
Targets:
1) There are several ways to think about move objectives. The simplest is to run a Fibonacci retracement of the March 2020 low to the November 2021 high. I keep it simple. I look at .382, .500 and .618.
2) Note that the 50% retracement of the entire move is very close to the January 2020 high pivot. The two form a support confluence in the 169 zone. Given the amount of distribution that occurred in the trading range, I think its more likely that the .618% retracement @ 152 is the most likely one.
3) When a correction develops you will be able to use the TradingView trend based Fib extension tool to project additional targets. Its likely that those targets, combined with the retracement tool and more traditional chart analysis will provide support confluences to work with.
Point and Figure charts also provide insight. They don't get nearly the respect of Fib points, but they deserve it. I tend to use the Fibo points as my references, but sometimes, a solid PF range count can add insight.
Wyckoff and others taught that the length of time spent in the consolidation is related directly to the distance of the subsequent move. Trading ranges are areas of the chart where large amounts of shares change hands, often from strong hands to weak hands. This is why there is a relationship between the length of the range and the size of the move.
1. Granted, there is no end to the debate as to what points should be used to define the counts. Since I'm a simple guy, I keep it simple.
2. In this case the width of the range is notable. A conservative target falls in the 145 area while a more aggressive accounting measures as deep as 121.
So I have targets, what do I do now?
1. I think its enough to know that the targets are all much lower. As the trade progresses the chart will produce more support and resistance zones, target and objectives that will help to narrow the range of outcomes.
2. The final point is that, particularly in the case of point and figure charts, objectives are more guides than they are precise points. When available P&F counts are extremely useful in determining risk/reward in a trade.
In the shorter run, the market broke out of its trading range on Friday with a solid daily/weekly thrust lower. But now, in the shortest perspectives it is deeply oversold. If the market does rally, the character of the rally is likely be corrective. I like to look for bear flags or pennants or a rally back to the underside of the broken trading range before the market rolls over again.
Final Point: I was always taught to buy the strongest names/groups in uptrends and to sell the weakest names/groups in downtrends. IWM has clearly been weaker than SPX for a number of months. The top panel is IWM, the middle panel is the SPX and the bottom panel is the ratio between the two. If the market is setting up a major correction IWM probably will be far weaker than SPX.
Good Trading:
Stewart Taylor, CMT
Chartered Market Technician
Shared content and posted charts are intended to be used for informational and educational purposes only. The CMT Association does not offer, and this information shall not be understood or construed as, financial advice or investment recommendations. The information provided is not a substitute for advice from an investment professional. The CMT Association does not accept liability for any financial loss or damage our audience may incur.

WTI Crude Daily Chart: Thoughts on trading and a setup...WTI Crude Daily Chart: Thoughts on trading and a trade set up illustration:
This post was written on January 18-19th but in order to avoid anyone viewing it as a trade recommendation I have withheld publication until today (1-21). It is only meant to illustrate how I think about trades and setups. The placing of entry and stop orders is complex. You need to develop your own plan, consistent with your risk management.
Most price change is noise. As an analyst your job is to identify those junctures where signal content is greater than noise content. Once those points are identified, you need a plan. TA is easy. Trading is way harder, particularly if you haven't systemized your plan.
Importantly, to be successful you need to do your own work. You need to understand how supply and demand shapes a market pattern and then find and isolate trading setups based on that knowledge. You do this by looking at, and more importantly thinking about, thousands of charts. Simple right? The point I'm trying to make is that you shouldn't expect to be successful by mimicking trades offered by some internet jackass like me. You have to do work. Hard work. Put in your time. Become a chart dog. Otherwise it’s a hobby, not a career. Hopefully these commentaries help you find a starting place.
WTI may be setting up one of my favorite technical trading setups, the failed breakout. I thought it might offer a good opportunity to walk through how I think about my trades. After all, what is the point of doing chart analysis if you don't have a plan to trade the analysis.
1. Today (1-19-2022) crude oil (CL) set a modest new high above $85.41 bb pivot that first appeared as resistance in October 2021.
2. Analysts making the fundamental case for $100.00bbl oil seem to be everywhere in the media today.
3. They may be right, sometimes the fundamental guys can be very good. But even in the cases where they get it right, their timing can be off dramatically.
4. In many cases the analyst or portfolio manager also makes the case for an energy overweight or a position in XLE. I would note that since breaking out above its October pivot, XLE has diverged significantly from the price of oil. XLE is up over 10% from its October high and nearly 30% from its December low. I have to ask myself why is XLE so much stronger than oil and how is this divergence most likely to be solved.
5. As a market moves into the zone around a prior high or low, there are really only two possible outcomes. The market either breaks out or it doesn't.
a. While there are only two possible outcomes, there are many variations in how the outcomes evolve.
b. To my mind, professional trading isn't about guessing the future so much as having a trading plan to take advantage of the setups.
The setup: Support and resistance confluences represent junctures where the signaling content is high.
1. CL is testing an important overhead pivot/resistance, in this case the $85.41 bbl high from late October.
2. Price is pressed against the top of the channel/rising triangle that defined the rally from late December.
3. Price is also pressing against the top of the moving average channel.
4. The triple resistance confluence should be difficult for the market to overcome.
5. The Relative Strength Index (momentum) is overbought. Note that this is the same degree of overbought that produced the June and October 2021 highs and has reliably produced important highs in the past.
6. Volume has been somewhat lighter on this move compared to the initial rally to $85.14 (suggesting less demand).
How do I think about set ups and trading?
1. The setup points above suggest that the market is more likely to fail/correct than to break out. In a case like this I am far more interested in finding a way to be short once a confirmed sign of failure materializes.
2. My favorite pattern in this situation is the upthrust or failed breakout.
a. Price moves above the resistance, triggering stop loss orders and attracting breakout traders.
b. After taking stops and attracting new weak handed longs, the market falls back below the prior pivot, forcing weak handed longs to exit.
c. This pattern is always better if it occurs within a few hours of the breakout (which CL has failed to do so far 01-20-2022).
3. If the market fails I like to have a sell order waiting back inside the range. If that sell order is triggered, I immediately place a stop loss order back above the first physical barrier. Trades should only be taken if the upside risk to the protective stop is reasonable.
a. I usually keep it simple. For instance I will often use a trade back below the low of the hour, day or week (depending upon the perspective I'm trading) leading to the failed breakout. Triggers can be set up using bars, volatility, TL breaks and dozens of other tactics.
b. This is the part where doing your homework and finding a tactic that is consistent with your temperament and risk management context becomes important.
4. Conversely if the market does the unexpected and breaks out, I begin looking for a consolidation pattern, for instance a bull flag or pennant pattern above which I can add a buy stop.
I believe that successful trading entails waiting for the high percentage and then having a trading plan to take advantage of it. A platform like TradingView makes it possible to look through hundreds or even thousands of charts to find precisely the trading setups you like the most.
Good Trading:
Stewart Taylor, CMT
Chartered Market Technician
Shared content and posted charts are intended to be used for informational and educational purposes only. The CMT Association does not offer, and this information shall not be understood or construed as, financial advice or investment recommendations. The information provided is not a substitute for advice from an investment professional. The CMT Association does not accept liability for any financial loss or damage our audience may incur.

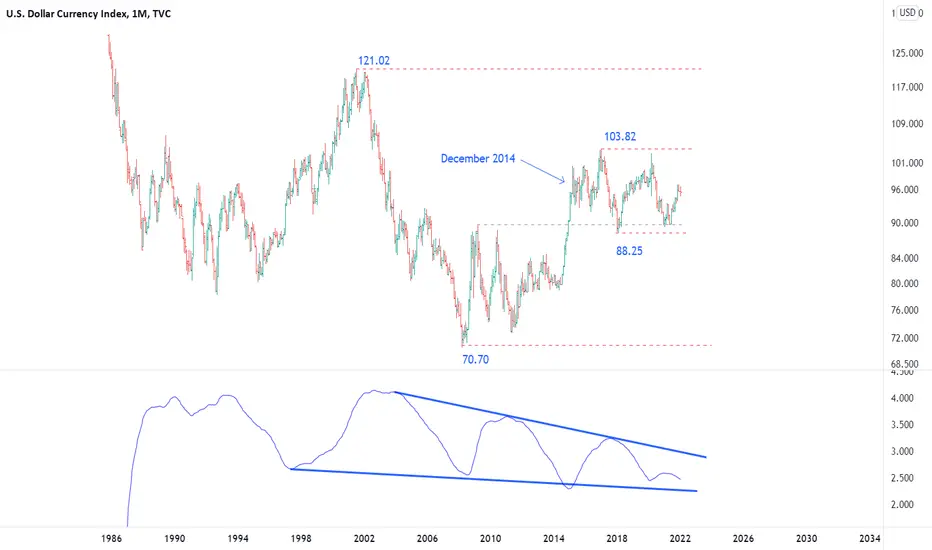
Macro Overview: Part 4: Dollar Index:I begin each year reviewing the long term technical positions of the "Big Four." 10 Year rates, SPX, Commodities, and the US Dollar. This is the fourth of the series. The fifth and final will attempt to tie the first four together into a organized macro view. Granted, macro doesn’t typically impact shorter term (swing, daily and weekly) trading, but developing a broad framework for understanding market context and to help recognize change in the investment environment is important.
It seems that for most of my 40 year career there have been two core calls among many strategists. 1) Interest rates must go up and 2) The Dollar must go down. Neither trade/opinion has worked out.
1) Despite 40 years of policy and global payments angst, the Dollar Index remains range bound.
a. The wide macro range, 70.70 - 121.02 has contained price action over most of my trading career.
i. The market is roughly in the center of this range.
b. The more immediate range, 85.25 - 103.82 has defined trading since late 2014.
2) The 88.25 - 103.82 range is by far the most important chart feature.
a. Prices are squarely in the center of this range.
b. Moves inside the bounds of the range are noise, and while they may represent trading opportunities they mean little in macro terms.
c. Be very careful when commentators suggest that the Dollar is trending. I hear this all the time and at least in terms of macro, these adjustments mean little.
3) A monthly close outside the range would strongly suggest a major change in the fundamental backdrop.
4) I believe that volatility is more cyclical than price. Periods of low vol. set up conditions that often lead to explosive moves.
a. Note that volatility has continually made lower highs as vol. has been gradually crushed out of the market over the last 30 years.
b. A breakout of this pattern combined with a range break would suggest a disruption in the long term equilibrium and move DX from trendless to trending.
5) Dollar correlations to other assets (rates, equities and so forth) are mixed. Its been several years since I did the correlation work, but I really don't recall teasing out consistent long term tradable factors other than a weak correlation to commodities/gold. But, as a caveat, it has been years since I spent significant time and I was looking over longer periods.
Impetus for a range break could be provided by the Federal Reserve increasing rates significantly faster/slower than current expectations or faster/slower than other central banks. Externally, a flight to safety resulting from disruption in emerging markets, armed conflict in Europe, or significant new domestic fiscal stimulus are all possibilities. When thinking about the Dollar its worth remembering that currency is a relative game. It's not only the domestic economy and monetary/fiscal policy, but those factors relative to the same factors inside our largest trading partners.
Dollar Bottom Line: It’s a range trade until it ain't no more.
Good Trading:
Stewart Taylor, CMT
Chartered Market Technician
Shared content and posted charts are intended to be used for informational and educational purposes only. The CMT Association does not offer, and this information shall not be understood or construed as, financial advice or investment recommendations. The information provided is not a substitute for advice from an investment professional. The CMT Association does not accept liability for any financial loss or damage our audience may incur.
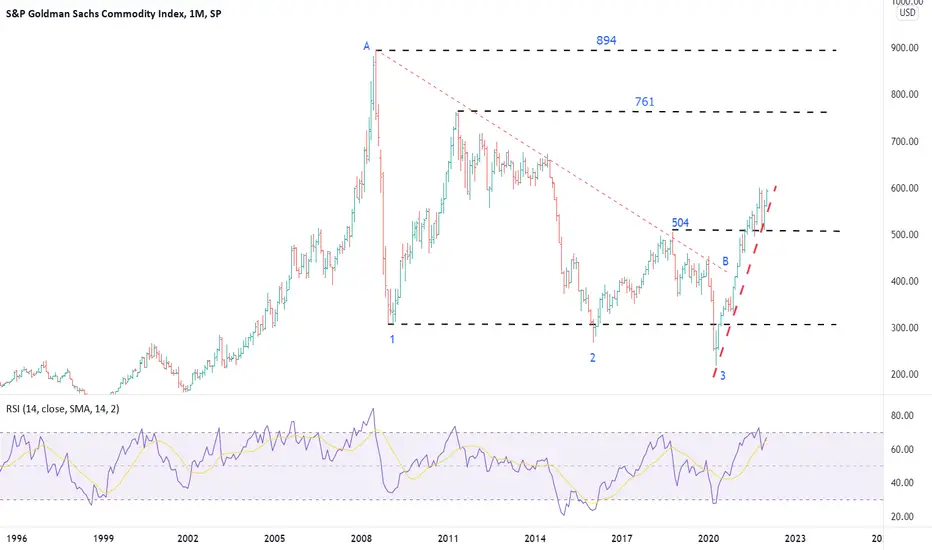
Big Four Macro Overview Part 3: Commodities: I begin each year reviewing the long term technical positions of the "Big Four." 10 Year rates, SPX, Commodities, and the US Dollar. This is the third of the series. Granted, macro doesn’t typically impact shorter term (swing, daily and weekly) trading, but developing a broad framework to build understanding of market context and to help recognize change in the environment is important.
I think of commodities, particularly industrial commodities, as an economic lens. Granted, economic demand isn't the only driver of the commodity cycle, but its an important one. Since the collapse of the commodities super cycle in 2008, the Goldman Sachs Commodities index has traded in a broad range, bounded essentially by the low set during the financial crisis and the resultant 2011 high. It is also worth considering that the pandemic may be somewhat distorting normal interpretation in that at least a portion of the strength may be due to logistic constraints.
1. Price is currently in the (approximate) center of a 14 year range.
2. Lows at points 1, 2 and 3 were created by the great financial crisis in 2008, The oil glut in 2016, and the pandemic in 2020. Clearly this zone, while wide, provides a substantive support floor.
3. The most notable/useful current chart feature is the clear uptrend from the 2020 pandemic low. Until that uptrend is broken, the most immediate trend is to higher prices. In general higher commodities suggest continued economic growth.
4. A break of the uptrend would strongly suggest that economic demand was weakening or that supply constraints were loosening. I think economic demand is the stronger story.
5. It is notable that the MACD momentum oscillator is close to rolling over.
a. I divide MACD into four trend states/quadrants (which I promise to will cover in future posts). MACD for this index is currently in the upper right quadrant. This is the quadrant where bullish momentum is weakening.
6. The combination of the uptrend and the lateral support from the October 2018 high and the December 2021 low (504) should act as support. A violation of the support confluence would strongly suggest that, at least for now, the uptrend was complete. Particularly if MACD moved onto a pure sell signal.
7. There is also a break of the trend-line labeled as A-B. We will cover the proper drawing and use in future posts but often, trend lines and what they mean are as much art as science. In this case, while interesting, I don't view it as particularly important.
8. Commodities deserve to be broken down into industrial and energy verses agriculture and softs. The GSCI is 54% energy, 13% Industrial metals, and 28% agricultural. I tend to watch energy and industrial commodities for economic insight.
9. I have also included a chart of JJM. This is a Total Return ETN of industrial metals. I have highlighted the buying climax that occurred in October. The climax behavior offers a strong clue that the uptrend is likely over, at least for now. In future posts I will cover ending action/climax action in depth.
Commodities Bottom Line: The uptrend from the pandemic lows represents the economic recovery. But, while the trend higher is intact, it appears to be weakening. My sense of the economy is that the best growth has already occurred as the result of historically supportive fiscal and monetary. Now, both paths are turning restrictive (see the second part of this series for a more in depth discussion) and markets will likely reflect that reality. One of the expressions of that restriction will likely manifest in the form of weaker, particularly industrial, commodities.
Good Trading:
Stewart Taylor, CMT
Chartered Market Technician
Shared content and posted charts are intended to be used for informational and educational purposes only. The CMT Association does not offer, and this information shall not be understood or construed as, financial advice or investment recommendations. The information provided is not a substitute for advice from an investment professional. The CMT Association does not accept liability for any financial loss or damage our audience may incur.
Inflation made simple: More money More problmesOn March/April 2020 we hit irrational market conditions due to the abrupt halt in the economy. We can blame the pandemic as the trigger, however there were indicators that were already flashing a slow down in the economy. Then "Magically" the so called "V Recovery". Sharp, strong, "back to normal", unemployment spiked to unprecedented levels and went back to a fast recovery.
A while ago I published an article about the disconnection between the economy and the stock market. Several articles pointed out the inflation issue, at the time it looked like something that was neglected and even ignored. The Fed called it a "transitory" inflation. The Fed is responsible for watching over inflation and employment. This Fed has disregarded the inflation issue.
Magic doesn't simply occur. After the economy stalled due to the virus lock down, the oil tumbled, the stock market wiped off the gains and took it back to 2016 levels, the unemployment spiked, and there were two emergency calls, one to put interest rates to Zero, and the second to increase the debt ceiling to unprecedented levels. We have two main factors to eye, the near Zero interest rates, plus the M1 metric (Money supply) spiking like never before. This means TONS and TONS of bill notes were freshly printed and put out in the market. It is not new to know that the ships at the California ports and the supply chain disruption contributed to inflationary pressures, but they were not the root reason for the 7% inflation we're seeing now, those were more the excuses to divert the attention from the root problem, we have an excessive amount of free money in the market, a Piñata was broken and everybody have cheap mortgages, cheap credit, cheap margin, cheap everything. Supply/Demand in action, a lot of easy money plus a lot of buyers => increase of prices.
A lot of bills in the market dilute their value, so now we need more bills to buy the same stuff this equals to inflation, and after these levels shown in the M1 + Interest rates charts, it means a lot of it. Now the FED has changed the tone and it doesn't call it "transitory". They say they will increase the interest rates in 2022, but so far the things are just exactly the same, nothing has changed. The market doesn't understand intentions, it understands numbers.
SPX : The index has made fresh all time highs and it's in an uptrend, weakening momentum, but I wouldn't be too worried about it. The market needs a correction to buy cheaper, so this is normal to be expected at some point. As long as things are kept the same I would expect to see the 21st century version of the "Roaring 20's"
US30Y : It made a rally from July 2020 to April 2021, then it started to make LL-LH. Something that has to be paid attention to.
VIX : The fear indicator is around 17, which signals a bull market. A couple of spikes which showed up during the weeks when the market was testing the trend and the market continued to "buy the dip".
DXY : The Dollar index went down after the flood of dollars put out in the market, it tested its lowest at 90 and it went back up to 95.
GOLD: Gold is a hedge for inflation. In 2016 it found a support level a little above 1000. Since then it started a rally that took it to 2000. The market was already forecasting some troubles in the economy and when the pandemic hit harder it was when gold took its last rally to 2000. Once the dust was settled it just started to consolidate between 1700 ad 1800. This market is in a wait and see pattern. Cryptos are being eyed as the virtual Gold but still they are in a roller coaster with high volatility, not for the faint at heart.
OIL. This is a fundamental economy indicator. The pandemic made the future market participant pay up to 40 to get rid of the contracts, unprecedented. After that historic milestone oil started a recovery rally that followed the "V Shaped" recovery, and it went from a closing 17 level to the 80's level we see today. The pace at which it's been growing has decelerated lately, so basically it is in an uptrend with lower momentum. The economy is reaching an equilibrium where the demand for energy is not the same as the amount needed to jump start the economy. Oil is still making HH-HL, until that changes it's still in an uptrend.
Conclusion: Nobody wants the party to be over, so we keep on adding more to it. However this has taken us to the irrational exuberance where the economic indicators already show signs of high levels of stress. A problem has been created, and apparently it will be left alone until it explodes, just like it has happened in the past.
There are two ways to deleverage the economy the easy way and the hard way, the longer it takes the Fed to start increasing interest rates, the bigger the problem will become. The housing market is very hot, the used car market, the credits, the spending in general accelerated too much. We risk to see another 2008 when the interest rates will start to go higher and will catch the general public with a lot of debt ... and higher prices.
A very good economy educational video that's one of my favorites is from Ray Dalio, and it explains in a very simple and understandable language the economic cycles. I strongly recommend you to watch it.
How The Economic Machine Works by Ray Dalio

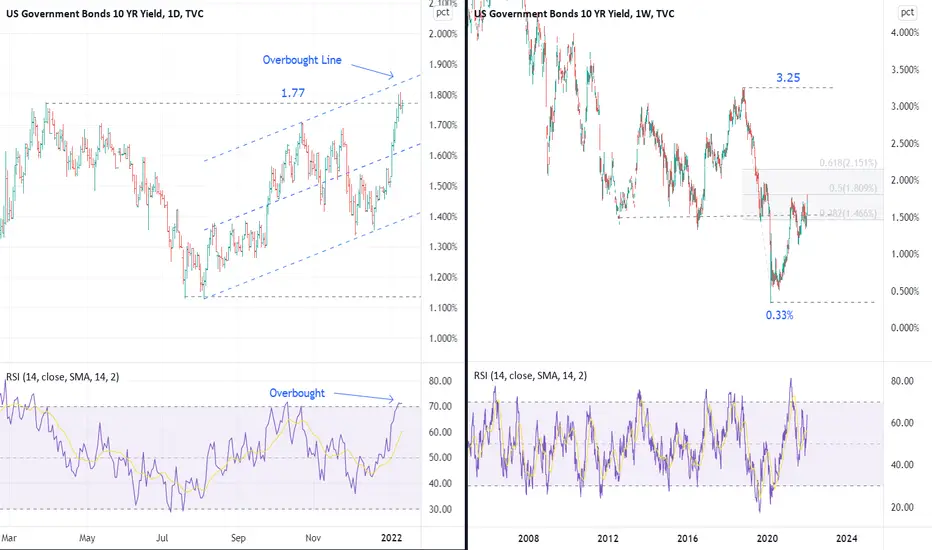
10 Year Rates: Daily and Weekly Perspective: Important JunctureA reminder that falling bond yields are synonymous with higher bond prices while rising bond yields are synonymous with lower bond prices. In other words, a yield downtrend is the same thing as a bull market in bonds.
Last week we published macro overviews of rates and equities that should be referred to for context.
1) A weekly close above the 1.77% would represent the first time since the February 2020 - 0.33% low print that rates will have managed to set higher highs. This would represent a significant change in the markets behavior.
2) The market is currently testing the confluence of resistance generated by the pivot high (1.77%), the top of the channel from the August 2021 low, and the roughly 50% retracement of the 3.25% to 0.33% decline. The confluence should provide signficant resistance.
3) Combined with the oversold condition of the RSI oscillator (remember that rising yields = lower prices, so a high oscillator reading is oversold) it is reasonable to monitor the daily and hourly charts for tradable reversal behaviors. We will cover some of these behaviors and patterns in future posts.
4) At the very least the resistance confluence should create a period of consolidation.
5) The caveat is that longs would not be in harmony with either the weekly and monthly charts, which appear to be setting up for an extended period of rising rates.
6) With both weekly and monthly charts appearing to be in the midst of a signficant change of trend, a break out wouldn't be particularly surprising.
7) At important junctures like this, I typically adapt an, "If this happens, then I do this" trading approach. After all, the market can only do one of a very few behaviors.
a. It can breakout and run. In which case finding a trade with solid risk reward becomes impossible. Move to a different market and find a trade.
b. It can breakout, move higher and then make a clear consolidation pattern (for instance a flag or a pennant). You can buy breakout with risk stops below the pattern.
c. It can upthrust the range (make a false breakout) and fail. This is by far my favorite trading pattern. We will cover it extensively in future posts.
What fundamental could produce a produce a reversal? Equity weakness that produces a flight to safety is the most likely candidate. But note that SPX saw a strong reversal yesterday and this mornings dip attracted buyers. But, again, refer to part two of the macro overview for context.
Good Trading:
Stewart Taylor, CMT
Chartered Market Technician
Shared content and posted charts are intended to be used for informational and educational purposes only. The CMT Association does not offer, and this information shall not be understood or construed as, financial advice or investment recommendations. The information provided is not a substitute for advice from an investment professional. The CMT Association does not accept liability for any financial loss or damage our audience may incur.
Left Brain Versus Right Brain 🧠 (Find out which one is you) 📚Left Brain Versus Right Brain-Thinking vs Feeling
Hello all. I put this educational content to help you realize how these two very important psychological concepts play part in almost every traders life. I wanted to bring to you this unusual educational content which I personally learned from a book called, “Trading from Your Gut” by Curtis Faith. This knowledge came to serve me a long way and I hope it helps you too.
First let me briefly highlight the differences between Right and Left hemispheres.
Right Brain hemisphere : (It is definitely time to buy now):
It is a cliché and you probably know it, “listen to your gut”. Right brain traders use gut instinct as the basis for powerful and rapid decision making. Unfortunately, too much reliance on an untrained gut can be disastrous for the inexperienced trader. This is because the right brain is quick and intuits instead of reasoning. Thus, it can be a powerful tool in the hands of an experienced trader who not only relies on intuition, but also reasoning and logic.
Left Brain hemisphere : (I will only buy if):
Left brain traders know exactly why they enter certain trades, following specific set of criteria that must be met before initiating a trade. Instead of relying merely on intuition and feelings, left brain traders analyze, use linear thinking, categorize, theorize, and only then put on certain trades. It is only after when left brain trader will trust his/her gut to execute the trade.
So which is better ? (Integration of both hemispheres):
Using intuition to decide when to make trades is not a bad thing when used in combination with logical reasoning using analysis, data and tools. In other words, to become a better trader, one should incorporate both left and right hemispheres and have a balance between brain’s two primary types. It is not about “thinking versus feeling” per se, but rather combining thinking and feeling to be able to intuitively make better trading decisions.
No intuition is good without knowledge and without receiving training. Thus, you should never solely rely on trading from your gut.
Bonus for you :
•If you are a short-term trader or a scalper, you are likely using your right brain due to not enough time to perform analysis.
•if you are a long-term trader or a swing trader, then you are using your right brain given plenty of time for analysis.
•Remember, left brain analyzes, and the right brain notices. Use your whole brain to trade this year.
Thanks for reading, and I hope you can use this for your advantage in this new era of volatility.
Enjoy, and happy 2022 everyone.

How To: Use the RSI to find Oversold Stocks now RecoveringWith the rotation away from some of the hotter growth stocks especially in the technology space I thought I would show you one way to perhaps find stocks where they have been in a reasonably steady uptrend, but then for whatever reason sold off significantly and are now recovering.
This video shows you:
1. How to add and configure a 20 period moving average.
2. How to add and configure the Relative Strength Indicator (RSI)
3. How to setup your own columns and filters in the TradingView Screener
4. How to set up and add files to a TradingView watch list.
5. How to add and modify trade alerts.
Hope the video was useful and you might have learnt something about the TradingView functionality you can add to your own set ups and trading.
Like if you liked something :)

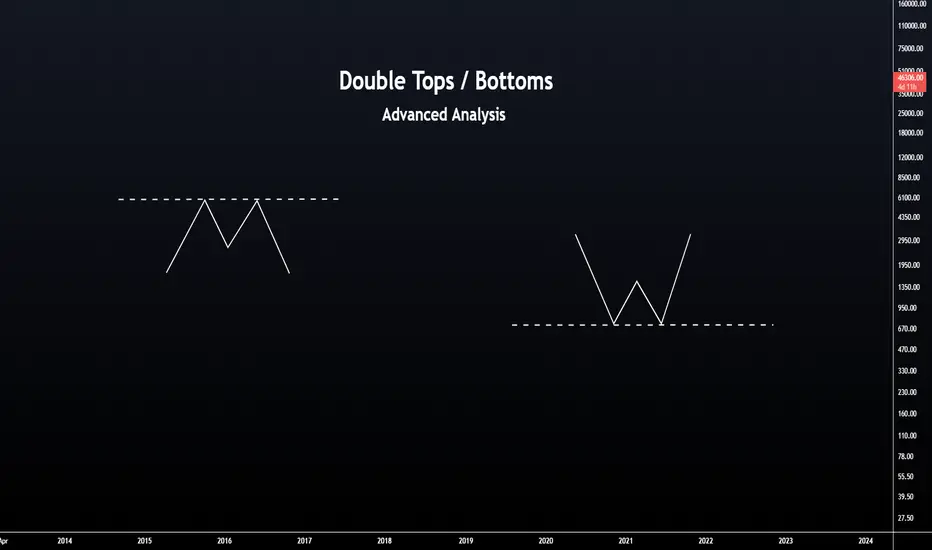
Double Tops & Bottoms - Advanced AnalysisDouble tops/bottoms are relatively frequent and easy formations to identify and use. In this post, we provide a description of each pattern, implications, respective measure rule, as well as the variations described by Bulkowski.
We also review the literature on these patterns in order to find various observations as well as a theoretical explanation of their occurrence.
1. Double Tops
Double tops are a bearish pattern commonly found in uptrends and characterized by two consecutive peaks located at a similar level, separated by a trough. Bulkowski suggests that the absolute relative distance between the two peaks should be within 6%.
The first peak is followed by a 10/20% decline. The location of the trough in the formation forms the "confirmation" level. The price breaking this level signifies the completion of the pattern, and a short position should be opened. In order to avoid fake breakouts, Bulkowski suggests a 5% decline below the confirmation level.
Volume is generally declining during the formation of a double top.
The time separating two peaks is an important factor when it comes to determining the validity of a potential double top. This separation should be in accordance with the duration of the uptrend before the peaks. Peaks that are too close to each other are not indicative of a double top, while an excessive time separation might indicate that the prior uptrend is outdated.
Double top on OIA daily.
2. Double Bottoms
Double bottoms are a bullish pattern commonly found in downtrends and characterized by two consecutive troughs located at a similar level, separated by a peak. Bulkowski suggests that the absolute relative distance between the two troughs should be within 6%.
The first trough is followed by a 10/20% rise. The location of the peak in the formation forms the "confirmation" level, the price breaking this level signifies the completion of the pattern, and a long position should be opened. In order to avoid fake breakouts, Bulkowski suggests a 5% decline above the confirmation level.
Volume is generally declining during the formation of a double bottom.
Like with double tops, the time separation between two troughs should be in accordance with the duration of the downtrend prior to the troughs. The observations on the matter previously described for double tops also apply to double bottoms.
Double bottom on CFFN daily.
3. Measure Rule
The measure rule allows for the determination of the amplitude for the expected price move after a breakout of the confirmation line. This also allows for the trader to decide the location of take-profits/stop-losses when trading double top/double bottom patterns.
For double tops, the take profit is determined from the height given by subtracting the formation highest peak with the trough. The height is then subtracted from the formation trough.
For double bottoms, the take profit is determined from the height given by subtracting the formation peak with the lowest trough. The height is then added to the formation peak.
Another rule suggests an expected price movement after breakout equal to 73% of the distance between the formation highest peak and the formation lowest low.
4. Eve/Adam Variations
Bulkowski classifies double tops and double bottoms into four distinct types:
- Adam & Adam
- Adam & Eve
- Eve & Adam
- Eve & Eve
The term Adam and Eve is given to peaks/troughs depending on their width, with the term Adam given to narrow (V-shaped) peaks/troughs and the term Eve given to wider (U-shaped) peaks/troughs.
There aren't large scale studies quantifying the accuracy of each of these variations, Bulkowski ranks each one of them as follows (lower is better) (1):
For double tops:
- Adam & Adam: 19 out of 36
- Adam & Eve: 10 out of 36
- Eve & Adam: 16 out of 36
- Eve & Eve: 12 out of 36
For double bottoms:
- Adam & Adam: 26 out of 39
- Adam & Eve: 17 out of 39
- Eve & Adam: 20 out of 39
- Eve & Eve: 5 out of 39
Note that such classification is not always used by traders.
Example of Adam & Eve double top on LEO daily.
5. Observations
The big M and big W patterned described by Bulkowski are variations of the double top/bottoms.
The analysis conducted by Caginalp and Balevonich shows that double formations can be the consequence of identical equilibrium prices with slightly differing undervaluation (2).
6. References
(1) Bulkowski, T. N. (2021). Encyclopedia of chart patterns. John Wiley & Sons.
(2) Caginalp, G., & Balevonich, D. (2003). A Theoretical Foundation for Technical Analysis. Capital Markets: Market Microstructure eJournal.
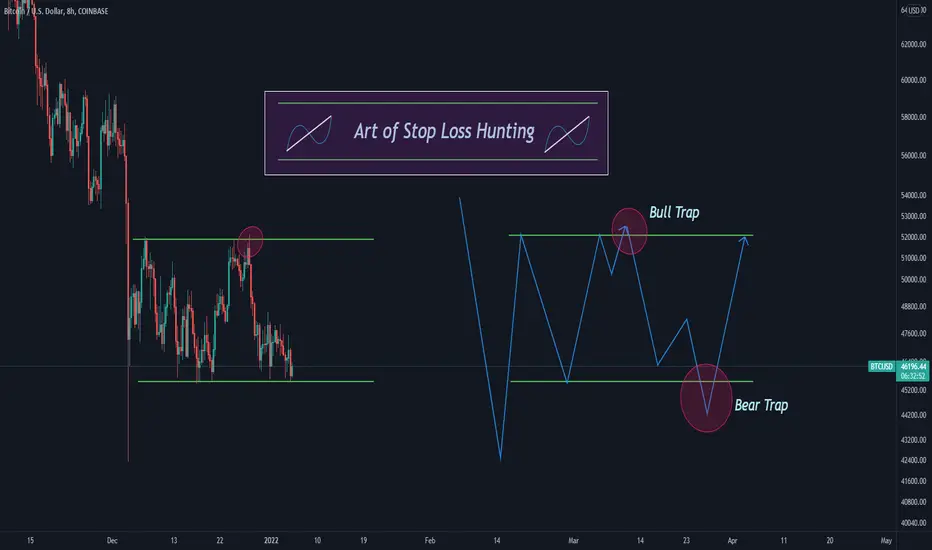
Simple Explanation of Stop Loss Hunting Stop Loss Hunting, a manipulative tool, that is used by Market Makers and Whales to manipulate market every day and to take away money from Retailers.
This is a basic yet advance topic to discuss. For simplicity sake, Let's break down this discussion in five parts :-
1) What is Stop Loss Hunting ?
2) How does it work ?
3) Why does it work ?
4) Why they do it ?
5) How to avoid It ?
---------------- 1) What is Stop Loss Hunting ? ----------------
Stop Loss Hunting is a process in which "A KEY LEVEL" is broken on either side in order to trap Retailers and to take Stop losses of either bears or bulls and trap them in that Trade.
----------------- 2) How does it work ? -------------------------
It works only when we have a level that is SO OBVIOUS to everyone that majority of RETAILERS put there Stop Loss underneath that level.
Stop Loss Orders are clearly observable in ORDER Book and ESPECIALLY to Market makers.
However, Key Levels in Range Trading become so obvious to Market makers or some Support levels that Whales/ Institutions or Market Makers can clearly observe where most Stop Losses of Majority of Retailers will be.
Thus they can overwhelm that range or level with Demand or Supply to take out Bears or Bulls Respectively.
----------------- 3) Why does it work ? -------------------------
We all are HUMANS and are bounded by our Emotions. We are EMOTIONAL BEINGS at the end of the day and we are not machines.
Inherently, We share an emotional domain and there are two key emotions in that domain :- Fear, Greed.
These emotions are involved and determine out actions most of the times in any Financial Market.
Therefore, These emotions are used as trigger points for Buying and selling and thus, Market Makers manipulate the Market by Controlling the masses by using these as Trigger points.
In Bear Trap , thus, when an obvious support level is broken then Retailers sell and Whales/Institutions buy and Bears are trapped. Then market makers Push the price up and that is how BEAR TRAP Works.
On the other side, In Bull Trap when Resistance level is broken then Break out traders buy at Breakout and then Bears Stop Loss is mostly taken out then Many Bulls are trapped. Therefore, Price takes a dump on failure of a breakout.
----------------- 4) Why they do it ? -------------------------
Answer is pretty simple for this :- To make more Money and Get better ORDER FILLING PRICE for their BIG ORDER Trade.
Whales/ Instituions do get have a BIG ORDER SIZE and Especially when they have INSIDER News or Information before it becomes available to public.
They always seek to get their BIG ORDER SIZE FILLING in Blocks at better Price.
For that reason, they do overwhelm a Support level with Supply to take out Retailers out of that trade and fill their BIG ORDER SIZE in Blocks.
Also, sometimes, when Market Makers see good Opportunity to take out Retailers out of trade they do same as well by Breaking Key Level on Either side.
---------------- 5) How to avoid It ? ----------------------
This can be done in TWO WAYS. By having Either your Stop Loss Wide Enough OR Look out for a key Level is so obvious to everyone and thus Expect Stop Loss Hunting at that level.
What i do sometimes is that when a key Level is broken and it is coming back to support then you can trade from that level where AN OBVIOUS KEY LEVEL is broken and most Retailers are taken out of the trade.
Let us use an example for this :-
You can clearly see how an OBVIOUS level of 30K majority was watching and it was taken out and many Retailers would def had been Liquidated or their SL must had been taken out.
I really hope that my Stop LOSS Hunting Explanation would be good enough and if i made any mistake please do lemme know anout it.
Diagram in the chart is an example only and is not meant to taken for any financial advice.
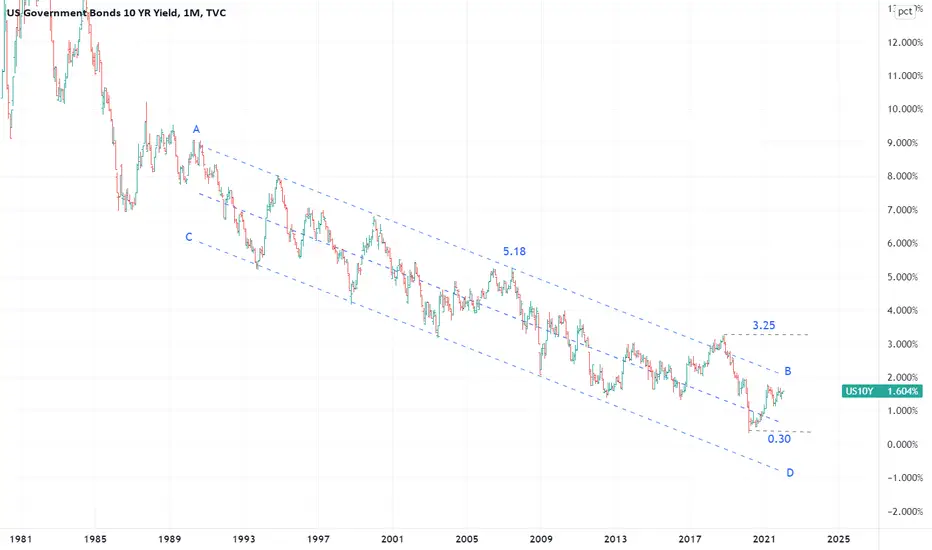
Macro Overview Part One: Interest RatesBig Four Overview: Part 1: Bonds
I begin each year reviewing the long term technical positions of the "Big Four." 10 Year rates, SPX, Commodities, and the US Dollar. Since by profession I am a rates/credit portfolio manager and trader, I always start there. Granted, macro doesn’t typically impact shorter term (swing, daily and weekly) trading, having a framework for markets and for recognizing change is important.
In coming weeks I will look at rest of the big four and at the shorter time frames.
A reminder that falling bond yields are synonymous with higher bond prices. In other words, a downtrend in yield = a bull market in bonds.
1) Over the last four decades bonds have consistently and reliably made lower highs and lower lows. The entire bull market has been defined by a broad declining channel (A-B, C-D).
2) The A-B line represents the "stride of demand" or the zone where buyers have consistently emerged.
a. In October 2018 bonds pushed modestly above the demand line. While not a clean break, it did weaken the TL and suggested that sellers were becoming more aggressive.
3) The C-D line represents the "overbought line" or the zone where supply has consistently emerged and buyers (sellers) have been willing to book gains.
a. In March of 2020 bonds pushed to the area around the center of the channel, but failed to push lower into the overbought line (C-D). The failure is a very visible change of behavior.
4) There is growing evidence of change in the markets character, but the bull trend is intact. Importantly there are NO OVERTLY bearish behaviors visible. To mark a trend of this magnitude as complete would require a clear sign.
5) Note that bottoms are a process. Historically bond market bottoms have taken a decade or more to complete. I currently believe that the pattern since June 2012 is part of this bottoming process.
6) A clear break of the downtrend would change the long trend from bullish to neutral. It would then take a move above the 3.25% pivot to begin defining a long term bear market.
Bottom Line: The market may be on the verge of a trend change, but until overtly bearish behaviors develop, neutral and bullish views continue to deserve the benefit of the doubt.
There are several key fundamental points around rates.
1) The defining macro characteristic of the 40 year bull market has been the continual fall in the inflation rate. If that is changing, the bond trend is likely to also change.
a. If the trend in inflation is changing, the negative correlation between bonds and equity that drives 60/40 allocation and risk parity investing is likely to flip and become positive. In other words, bonds and equity would rise and fall together destroying the diversification benefit. This has been the historical norm.
2) Most substantive bond rallies have been the result of a crisis that created a flight to quality.
3) In an economy that is overly financialized and debt burdened, rising rates often break the weakest link in the economic chain, creating a new crisis and a subsequent flight to quality rally.
Good Trading:
Stewart Taylor, CMT
Chartered Market Technician
Shared content and posted charts are intended to be used for informational and educational purposes only. The CMT Association does not offer, and this information shall not be understood or construed as, financial advice or investment recommendations. The information provided is not a substitute for advice from an investment professional. The CMT Association does not accept liability for any financial loss or damage our audience may incur.
All The New Tools and Features We Built For YouAs the New Year kicks off, let’s take a moment to remember the basics: ✅ never trade or invest blindly, 🧐 always do your research, and patience is king ⌚.
In our last update of the year, we want to share all of the new features we launched over the last 12 months! 🎉🎉 We also want to thank each and every one of you who have helped to make this platform better with your constant awesome feedback. We're always listening and improving our platform so you can perform your best research.
Look first. Then leap.
Now, let's get right to it - here are all of the new features and tools we launched:
Introducing Quick Search 🔍
Quick Search makes finding drawing tools and chart functions a breeze. Type in a keyword and then select the tool you need. For example, try searching “Trend” or “Price” to see all the tools and functions related to these two words - try Quick Search
Desktop 1.0 Has Arrived 🖥️
Our Desktop app has all the functionality of our flagship web product, but also includes added features like tab management, tab linking, and special Tokyo Night colors - get it here
Pine Script’s Epic Year 🌲
We rolled out more improvements to Pine than ever, among them Pine Script v5 , interactive inputs , tables , and the ability to edit your code in a separate window . And finally, our thriving community of script authors has published 10,000+ new, free Community Scripts during the year! - see every Pine update
Mobile App Upgrades 📲
This year, we launched new mobile features for alert management, market news, widgets, watchlists, and tons of performance upgrades - get our free Android and iOS apps.
Spark Your Research 🔥
We continue to improve Watchlists so you’re always informed about your favorite symbols. We launched Sparks , Timelines & Snaps , and the ability to share your Watchlist with friends.
More Brokers, Exchanges, and Data 🏦
We partnered with 10+ new brokerages including Tiger Brokers, Bitstamp, SaxoBank, easyMarkets, Tickmill. We added new data sources spanning DeFi, DEXs, macroeconomics, and more. And we’re celebrating our best partners with our second annual Broker Awards !
What else did we do this year? Here's a full list of new features: ✅☑️
- New chart features - 📈
Add tweets to the chart
VWAP alerts
Customize indicator visibility
Customize object visibility
Emojis on the chart
Multiselect alerts
Custom price labels
Technical Ratings
Change color of multiple tools at once
- Pine Script Features - 🌲
Pine Script v5
Make your own drawing tool
Alerts with dynamic messages
Pine Tables
More color in Pine
New Pine math functions
- TradingView Desktop - 🖥️
TradingView on Linux
M1 Chips
- Watchlist Improvements - 📃
Introducing Sparks
Advanced View Watchlists
Customize Watchlist column width
Improved live streaming tools
Share Watchlists
Timelines & Snaps
- Other Exciting Achievements - 🤌
First Bitcoin chart in space
#1 Finance Site
Rebrand & new logo!
Spotify Playlist
TradingView is now even safer
Advanced privacy settings
The first-ever Broker awards (second one on the way!)
- More Brokers and Broker Integrations - 🏦
Welcome Saxo!
Welcome Exmo!
Welcome Bitstamp!
Welcome Optimus Futures!
Welcome easyMarkets!
Welcome Bingbon!
Welcome CurrencyCom!
Oanda in Europe!
Welcome TimeX
Welcome CapitalCom!
Welcome Chaka!
Welcome Global Prime!
Welcome Tickmill!
Welcome Tiger!
- More Data and Partnerships - 🔢
More historical data for everyone
More DeFi data
FRED data comes to TradingView
New DeFi exchanges
Matba rofex data
Nordic data
DEX data from Sushiswap, Honeyswap, and more
Glassnode data
Thanks for reading! We have more planned in 2022 and we can't wait to show you what else we're working on. See you soon!
- The TradingView Team

PRINCIPLES OF TRADING FIGURES CUP WITH HANDLEOne of the most popular figures of technical analysis among day traders is a cup with a handle.
This figure is so popular due to its fairly clear and specific rules, in addition, the figure gives an excellent risk/profit ratio.
How to identify the model?
The formation of the model is divided into 4 stages:
1. The price has been rising for some time;
2. After the correction begins to about half of the previous growth – this is how the bottom of the cup is formed;
3. Then the price starts to rise to the previous maximum and turns down, failing to break through the resistance – this is the handle;
4. Then the price goes to break the maximum again, after which it goes even higher, approximately to the height of the cup depth.
How long does the model take to form?
A cup with a handle is formed from a few weeks to six months – that is why it is suitable for a long-term trader. It is very important to form a handle, which should be completed within a month, otherwise it may mean that the upward movement is weak and there may not be a breakdown.
Characteristics of the cup and handle
A round cup indicates consolidation, whereas a V-shaped cup indicates a too sharp reversal, which is not good.
The depth of the cup should be equal to one-third to one-half of the previous upward growth.
The handle should not fall more than one-third of the cup gain. In addition, a short and weak drop in the handle signals that a breakout may be very bullish.
How to trade?
Entrance
The best entry point is the handle. At the moment, the price is falling and forming a downtrend, the trader should enter the transaction when the price breaks through this downtrend.
Profit goals
To determine the goal, you need to measure the distance from the bottom of the cup to the beginning of the handle – this distance is above the breakdown of the maximum and will be our goal.
In addition to the main method of determining the goal, you can use Fibonacci lines – the 100 percent line is considered a conservative goal, and the 162 percent is considered an aggressive one.
Stop Loss
No matter how well the figure is formed, do not forget about the risks and the fact that the price can turn against you at any moment.
Set the stop loss is set below the minimum of the handle, then you will protect yourself from large losses.
Conclusions
This figure is not in vain so popular, it is very profitable and has clear rules, which makes it easier to work. Be patient, because the figure is formed for several weeks, or even months. Do not go too early, without waiting for the formation of the cup and handle. Premature entry promises losses.
Who knows how to wait - gets everything!
Good luck!

8 tips to keep you sharp over the weekend!Tomorrow is Christmas eve, the general markets will be closed, of course crypto will still be rocking and rolling, but the CFD markets will be shut. In day trading it is very easy to get rusty, a few days will do the trick, so with a 3 day weekend approaching we wanted to use this time to help you stay on track so you remain "hot" for the last trading week of 2021!
For those of you who will be celebrating Christmas, you will be busy Friday and Saturday, but we're sure you can find a cheeky hour on Sunday to work on yourself, since the weekend is the perfect time to grind, and do things such as reviewing your trades, seeing which assets moved the most and why (so you can take advantage of these situations in the future).
Today's blog topic will be guidance on what you could work on this weekend to keep yourself hot and not get rusty!
"DO OR DO NOT, THERE IS NO TRY." - YODA
1. THINK HOW CAN YOU IMPROVE YOUR PATIENCE – Having patience as a day trader will help in many ways, one of them being better entries, since entries are directly connected to our PnL it is then a vital skill to acquire, think what you could do to become a more patient trader and create a plan for the new week and apply it on your first opportunity!
2. REVIEW THE MAIN MOVERS THIS WEEK/MONTH – Every successful person, whatever industry it may-be practices a lot, the best way we trades get to practice is to review the charts and see what you could have done to profit in the new week by learning what you missed the week before
3. REVIEW YOUR RULES (PROCESS / ENTRY / EXIT / WATCHLIST) – Always helpful to read over and reevaluate your trading rules, it is a very underrate process, and because the majority of traders do not review their rules and processes they generally do not know what they are nor do they apply them!
4. VISUALIZE SUCCESS AND CHALLENGES – Visualize yourself making good/great trades. see yourself going through different scenarios and achieving the profits you seek. From seeing the perfect setup to executing the trade to exiting the trade, every aspect of trading, see it and feel it. Then also review the challenges you face as a trader, I'm sure you can think of dozens of them!
5. THINK HOW CAN YOU MAKE ONE A+ TRADE AT A TIME - Work on your entry process and criteria, know what the BEST TRADES look like, write it up! So when they show up you can execute with a larger size and maybe bank a much bigger profit than normally.
6. TALK TO EXPERIENCED TRADERS – It is very helpful to get ideas and see what these traders are doing, there is always something for you to learn, even when you become a millionaire trader, you'll still have so much to learn!
7. HOW CAN YOU IMPROVE THE RETETION OF PROFITS – If you are up on the day, set a tighter stop loss to keep your profits, that could always be a solid idea right? There are many ways to retain profits, such as lowering your size after a strong winning streak in a day... but its also your job to think about how you could do this better!
8. WORK ON YOUR PREPARATION – Preparation is Key for success! If you fail to prepare, you prepare to fail! We prepare for a solid hour before we start to trade, there is value in this... so this weekend create your "preparation process" and put it to work!
Ok we are done! Thanks for reading, but before we let you go we have a small request! If you come up with any good ideas that work for you, or have them already, please share them with us we'd love to learn from you too!
Merry Christmas and all the best!

The Top 3 Elements Found In All Good Trading PlansHey everyone! 👋
This month, in preparation for the new year, we have been theming our posts around the concept of building a solid trading plan. Our first post asked you to think about the kinds of factors that can predict long term success. Our second post looked at why trading plans are so important. Both of these posts you can find linked at the end 👇
Having talked about the *what* and the *why*, it’s time to talk about the *how*.
Today we will be taking a look at the top 3 elements found in all good trading plans!
1️⃣ Element 1: Every good trading plan knows why it wins.
In trading, there are two variables that matter: Bat Rate, and Win / Loss.
► Bat Rate describes what percentage of the time a trade ends up as a win. A trader with a 90% bat rate wins 9 out of every 10 trades.
► Win / Loss describes how big the average win is, relative to the average loss. A trader with a 0.5 Win / Loss takes losses twice the size of his wins.
If you multiply these numbers together, you will get an “Expected Value”.
For example, a trader with a Bat Rate of 50% (wins half of the time) and a Win / Loss of 1 (Losses the same size as wins) is a perfectly “Breakeven” trader.
In order to make money in the long term, all you need to do is make the multiplication of these values be a positive value. The breakeven trader above only needs to win 51% of trades to begin making money, if his W/L remains constant.
☝🏽To get these numbers into positive “expected value” territory, every good trading plan needs to devise a way to systematically find trading opportunities that it thinks have an edge. The inputs of this system are completely up to the trader, but they are typically rooted in repeating price patterns, fundamental observations, macro trends, or other patterns and cycles. Backtesting can be useful here for getting a general idea of whether or not an idea for a trading strategy has borne out to be true over time.
In short, no matter what it looks like, good trading plans identify their edge before risking capital. Why start a business without a business plan?
2️⃣ Element 2: Every good trading plan takes into account the emotional character of the trader.
This is the hardest element to quantify, but also arguably one of the most important pieces of a good written trading plan - the ability to work around a trader’s individual strengths and weaknesses. This is less important for banks and hedge funds, as decisions are typically made with oversight, but for retail traders, there is no-one around to temper your personal flaws.
You can do whatever you want! - but it’s a double edged sword of responsibility that your trading plan needs to prepare you for.
In short, you can best get an idea of where you are emotionally weakest by looking at your trading history. Nobody can do this for you, so it requires quite a bit of self-awareness. However, the rewards of removing emotional risk from a trading plan make it worth the effort.
😱 All trading is based on fear. You need to understand which fear is stronger - the fear of missing out, or the fear of losing capital. Figure out which is stronger, and plan accordingly.
Just because you understand a certain strategy and other people make money trading it, doesn’t mean that you will be able to. Executing with 100% consistency at 30% efficiency is more important than finding a strategy with 100% efficiency that you can only trade with 10% consistency. Make life easy on yourself!
3️⃣ Element 3: Every good trading plan outlines risk.
Whether you have one thousand dollars or one billion dollars, ignoring risk is a sure way to experience massively increased monetary and emotional volatility, which can have a huge negative impact on long term profitability. Here are a few simple-to-implement mechanisms that Banks, Hedge Funds, and Prop Firms use to reduce risk significantly - good trading plans don’t skip these.
💵 Total Account Stop
Exactly what it sounds like: once you lose a certain percentage of your capital, you stop trading, liquidate your positions, and assess what went wrong. Only once you’re satisfied that you have fixed the issue are you allowed to re-enter the market. In the industry, this number is commonly 10%.
💵 Per Theme Risk
This ensures that you aren’t too concentrated on a single “bet”, even if the bet is spread across multiple instruments. For example, if you own multiple companies in the same sector, their performance will likely be correlated to some degree even if they have different products or services. Adding a hard cap to this type of risk can massively reduce risky or over concentrated allocations.
💵 Per Position Risk
Many successful Professional Traders and Hedge Funds use the concept of “Free Capital” in order to manage risk. “Free Capital” is the amount of money in hard dollars that makes up the buffer between an account’s current equity, and the total account stop number.
For example, If a currency trader at a bank has a 10% total account stop out, and runs a $10,000,000 currency book, then he can really only “lose” $1,000,000 before his bosses pull him aside to have a talk. His “Free Capital” is $1,000,000. He will then size his positions to where he only risks 1-5% of his Free Capital per trade. This way, he has room to be wrong a minimum of 20 times in a row before any negative consequences come his way. Implementing a “free capital” risk limit per position ensures that you have a TON of room for error.
Yes, this typically prevents you from doubling your account overnight, but again, that isn’t the goal. Long term profitability is.
Some people call this per position risk “one R” (one risk unit).
☝🏽Whatever it looks like, including a plan for managing your risk is essential for *actually* managing your risk. If these plans aren’t written out and acted upon, they’re also a lot easier to ignore.
🙏🏽 Thanks for reading; we are looking forward to making 2022 a record setting year with you. 📈
If you got something out of this, make sure to share it with a friend, so they can also go into 2022 a better trader! 🍀
- The TradingView Team ❤️❤️

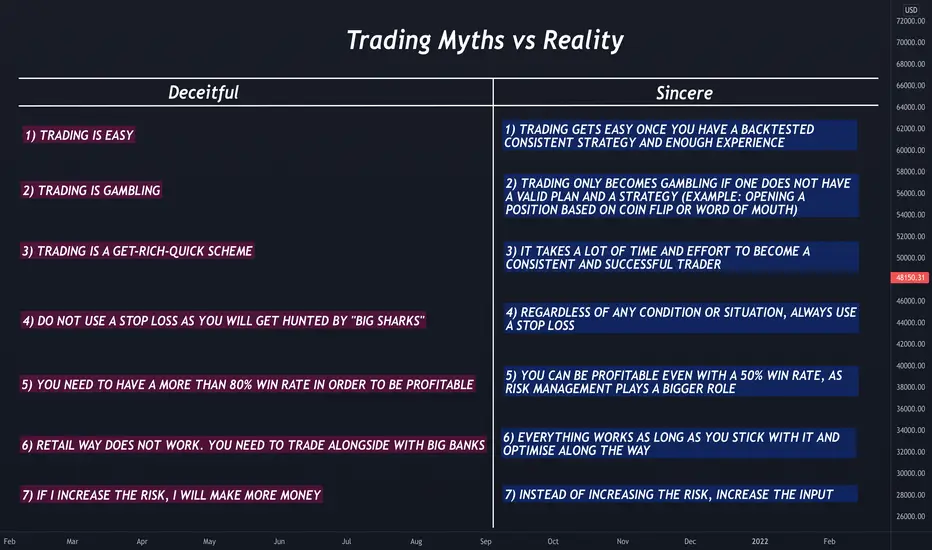
Trading Myths vs Reality. Beginners, this one is for you!Hey, wizards! Happy Thursday and welcome on another Educational Post. The topic is the following: Myths and Reality of Trading.
As you may already know, there are so many false statements that beginners run into before starting their trading journey. Those statements are illustrated on the layout and interpreted below:
1) Most people think that trading is easy and they can quit their job or whatever they do and start making a living off trading straight away. In fact, in order to be profitable, consistent, and be a full-time trader in general, he or she MUST have a backtested strategy and be experienced enough in this sector. Remember that it takes a while to be successful, but it is fully worth it!
2) “Trading is like a casino”- we hear this one quite often. Only two types of people use this expression a lot: those who have never been able to become successful in this industry, and those that have no plan or idea about what they are doing. One should never open a positions based on a coin flip or what others are saying. Ideas and analyses of other can be used as a confluence and inspiration for a trader to open a positions on a specific security.
3) Whether it is trading or any other industry, one can never be rich over the course of a night. It takes 10-14 for someone to become a licensed surgeon, at least 6 years to become a professional lawyer. What makes you think that you will become a professional trader in just a few weeks or months?
4) No matter what the situation is, always use a Stop Loss to avoid deep losses. Whether liquidity hunt exists or it does not, it is always important to stay safe and sound.
5) Risk management is always more important than the win rate. Imagine having a 1:3 Risk-to-Reward ratio on your next 10 trades and the win rate is only 50%. That means you will win 5 and you lose 5. Now, let’s say that we decide to risk 1% of our total capital per trade. If we do quick maths, we will see that with only 50% win rate and 1:3 RR, we will result in making a juicy 10% return from the total of our next 10 trades. Of course, this is not always the case, as there are some factors that should be considered, such as spreads, fees, pip value etc. However, this is a perfect example to help you get the overall idea.
6) There is a big number of traders who do not like the “Retail Way” and would rather trade the “Smart Money” concept, which is apparently the closest thing that we have to the Institutional Trading. The bottom line is this: choose a strategy that suits you the best, and go with it while optimizing along the way. Changing strategies every week/month will not make one consistent. It is crucial that you stick with one trading plan and be loyal to it.
7) Many beginning traders tend to increase their risk in attempts to make more profits. This approach is so risky and totally wrong. If one is willing to make more money trading, it is important that he or she increases the input, and not the risk.
Strike ZoneHi!
I wanted to share this post about similarities between baseball and investing/trading. Gentleman on the left side of the
picture is Ted Williams, the legendary Red Sox left fielder. He batted .406 back in 1941 (since then he has been last player to bat above .400).
I am from Europe and baseball is not popular here but it is a good sport to compare with investing because it is very statistically based game
(among other similar traits).
Gentleman on the right side of the picture is Warren Buffett, legendary investor. He has quite good 'batting' average over his investment career
and it's monetary result can be counted in tens of billions of dollars.
In my opinion these pictures above describe pretty well how investor/trader should approach markets:
1) It is very important to have patience and discipline. These traits are needed to separate real opportunities from fake ones.
2) Investor/trader should know what is his 'Strike Zone'. Nowadays there are so many different asset classes and instruments to trade.
It is quite hard to trade them all efficiently. Finding out what suits you takes time and practice (assets, timeframes, trading styles etc.)
For example I have found out that I like to trade stock market openings with 1-minute chart, but with Crypto markets my preferred timeframe is daily/weekly.
Few times in my trading career I have sold out my portfolio (here I am talking about long-term holdings) and then started to rebuild it again.
At first it was quite stressful because I felt that I was always rushing and did not had enough patience. To help myself I made a little modification
out of that picture presented before (see below):
Financial markets are moving mechanisms that constantly change. Market throws every day different situations and emotions in front of you.
Patience and discipline is needed to filter out 'false promises'. Knowing your 'Strike Zone' increases your changes to 'swing' with higher percentage.
Yes - higher percentage - with trading losses are part of the business (unless you are some High Frequency Trading Firm that has maybe 1 losing day in several years).
Keep in mind: Ted Williams achieved batting over .400 - it means that for every 10 bats, he missed 6 times. He was still a great player.
This picture helped me to visualize markets and develop patience and discipline. Probably your 'Strike Zone' is different than mine as all traders are different in some way.
And of course 'Strike Zone' can change in time. As markets evolve in time, we as traders and humans evolve as well :)
Now that year starts to end it is good time to look back and analyse, how was your 'hitting'? But more importantly - how would you like to 'hit' next year :)
Feel free to get discussion going in comments about your thoughts.
Thank you.
Merry Xmas and & Happy New Year :)
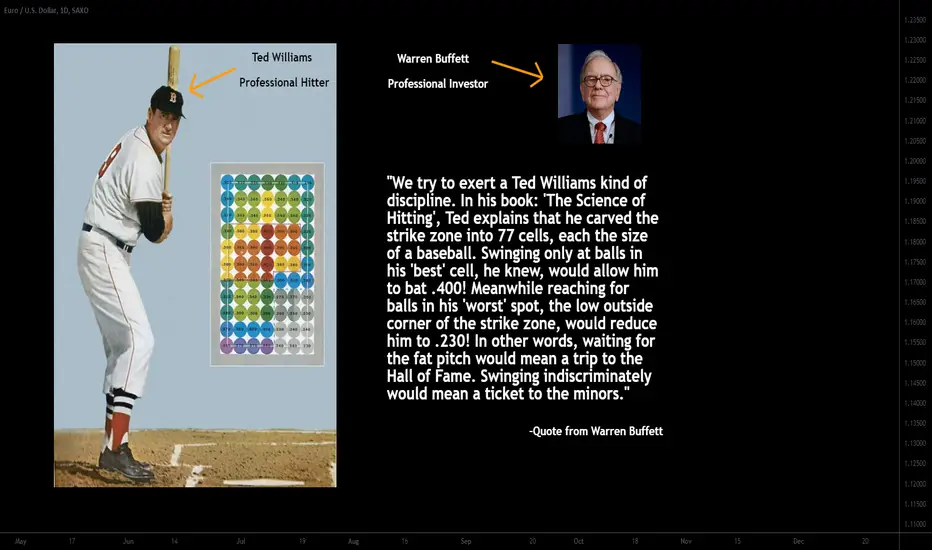
Would You Stake Yourself?Hey everyone! 👋
This month, in preparation for the new year, we will be continuing to theme our posts around the concept of building a solid trading plan.
Last week, we took a look at a hypothetical scenario, where a rich acquaintance of yours needed help deciding between two traders he's thinking about staking. This led to the question: "Who would you stake?".
This post will continue right where that one left off.
-
After getting the contact info, you reach out to interview the two traders.
You speak with Trader #1, and he appears to be quite intelligent, with wide and deep market knowledge. He’s shown you a few market predictions that he’s already gotten correct, and walks you through how he finds opportunities. You’re impressed.
You speak with Trader #2, and he also appears to be quite intelligent, with broad market knowledge, in addition to a history of profitable investment / trade ideas. He walks you through how he finds opportunities, and, similar to Trader #1, you’re quite impressed. In addition, he also presents you with written details about how he plans to manage risk, his maximum drawdown, and a whole litany of other clearly defined rules that keep risk under control and quality trade ideas coming.
Assuming we are still in the position of choosing which trader to stake, most, if not all, individuals in this situation would pick Trader #2 because of his attention to preparation and risk control, in addition to having a ‘business plan’. Trader #1 may be smart and highly capable, but he’s shown no evidence that he has a process to continually generate good trade ideas, while ensuring that he doesn’t lose everything. Trader #2 has “done the work”, and proven that he’s worthy of the capital.
-
Whether they know it or not, anyone who manages their own money is constantly faced with the same decision. If you step outside of yourself, are you more like trader #1 or #2? Is your trading plan worthy of investment? Would you invest in someone else who’s taken the same trades that you have? Does that person have a plan? Have they “done the work”?
Keeping yourself honest about what is working and what isn't is a superpower!
Hopefully this emphasizes the importance of building a trading plan. Next week we will take a look at what factors are typically needed in order to build an effective one.
If you’re not like Trader #2, comment below about the steps you’re taking to become better prepared for what the market throws at you!
2022 approaches. Let's crush it together.
-Team TradingView
If you missed last week’s post, you can catch up here:
