The Power of Compound InterestIntroduction
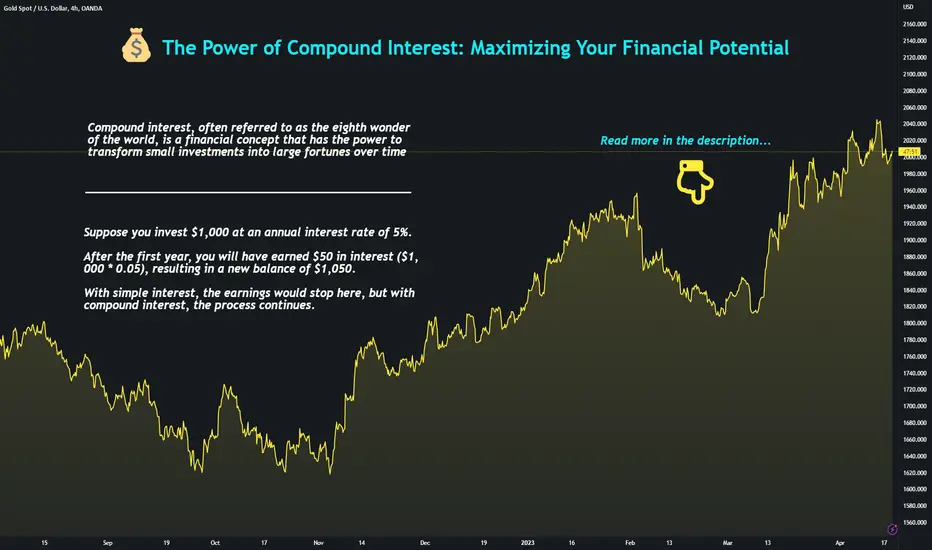
Compound interest, often referred to as the eighth wonder of the world, is a financial concept that has the power to transform small investments into large fortunes over time. It is the key to building wealth, securing financial independence, and ensuring a comfortable retirement. In this essay, we will explore the underlying principles of compound interest, its benefits, and real-life examples. Additionally, we will discuss strategies for maximizing the potential of compound interest and managing its impact on debt.
The Basics of Compound Interest
At its core, compound interest is the interest earned on an initial sum of money (principal) as well as on any interest that has previously been added to the principal. In other words, it is interest on interest. The key factors that determine how much your investment will grow are the principal amount, the interest rate, and the time period. Compound interest allows money to grow exponentially, which means that the longer the investment period, the more significant the growth.
Real-Life Examples of Compound Interest
Let us consider a simple example to illustrate the power of compound interest. Suppose you invest $1.000 at an annual interest rate of 5%. After the first year, you will have earned 50 USD in interest ($1.000 * 0.05), resulting in a new balance of $1.050. With simple interest, the earnings would stop here, but with compound interest, the process continues.
In the second year, you will earn 5% interest on the full $1.050, which means you will earn $52.50 in interest, for a new balance of $1.102,50. This cycle repeats itself, with the balance and interest growing each year. Over the course of 30 years, a $1.000 investment at 5% annual interest compounded annually would grow to $4.321,94. The exponential growth over time demonstrates the incredible power of compound interest.
The frequency of compounding can also significantly impact the growth of an investment. Many investments compound interest daily, monthly, or quarterly. The more frequent the compounding period, the faster the investment will grow. For example, a $1.000 investment at 5% annual interest compounded quarterly over 30 years would grow to $4.486,98, demonstrating the benefits of more frequent compounding.
Maximizing Compound Interest Potential
There are several strategies for maximizing the potential of compound interest. Firstly, start investing as early as possible, as the exponential growth of compound interest accelerates over time. Even small, regular investments can lead to substantial gains over time. For instance, investing $100 per month at a 7% annual interest rate compounded monthly from age 25 to 65 would result in a balance of $262.481, even though the total contributions would only amount to $48.000.
Next, invest consistently and seek out investments with higher interest rates, which can significantly boost the growth of your investments. Finally, opt for more frequent compounding periods to accelerate your investment growth. By adhering to these strategies, you can make the most of compound interest and build substantial wealth over time.
Compound Interest and Debt Management
While compound interest can work wonders for wealth-building, it can also have negative consequences when it comes to debt. Credit cards, loans, and other forms of debt often compound interest, causing debt to grow rapidly if not managed properly. It is crucial to stay vigilant and make regular payments to prevent the negative effects of compound interest on debt.
Conclusion
In conclusion, compound interest is a powerful financial concept that can significantly impact your financial future. By understanding its principles, harnessing its benefits, and applying effective strategies, you can maximize your financial potential and secure a prosperous future. The key to success with compound interest lies in starting early, investing consistently, and being patient. Remember that small, consistent actions today can lead to enormous results in the future. It is crucial to research available investment options, assess your risk tolerance, and choose financial vehicles that align with your goals. By making informed decisions and leveraging the power of compound interest, you can make your money work for you and achieve financial success.
As a final note, it is essential to consider the impact of compound interest on debt management. Proper planning and disciplined payment schedules can help you mitigate the negative effects of compound interest on your financial well-being. By staying diligent and actively managing your finances, you can ensure a healthy balance between your investments and debts, paving the way for a bright and secure financial future.
Whether you are a seasoned investor or just beginning your financial journey, understanding the incredible potential of compound interest is invaluable. Embrace this financial marvel and harness its power to achieve your financial goals and secure a prosperous future for yourself and your loved ones.
Community ideas
The Philosophy of Selling Technical IndicatorsWith a rather odd & convoluted history, the industry of selling access to technical indicators goes back further in time than most traders & investors are aware of.
A rather large majority of investors perceive the act of selling access to technical indicators as being in most relation to selling 'snake-oil'.
While this is true for many vendors who unfortunately market indicators as a 'get rich quick' scheme for trading, it's not true for every vendor.
In this article we are going to do a deep dive exposing what makes a bad vendor, going through the history of indicator vendors, and outlining how vendors can actually have an overall positive impact for the community.
Disclaimer: LuxAlgo is a provider of technical indicators (mostly free, but some paid), however, we will try to be as un-biased as possible in this piece. This article is purely for informational & educational purposes for the greater community.
🔶 WHAT MAKES A GOOD VENDOR?
We could summarize this as a vendor who first & foremost follows TradingView vendor requirements , develops quality products, cares about the community, truly acknowledges that past performance is not necessarily indicative of future results, and has good business practices.
A step by step ruleset to follow of how to be a good vendor could be as follows:
🔹 1. Publish open-source scripts
Aside from the paid scripts, vendors should be easily able to contribute other publications with open-source code for the greater community.
Come on, let the world see that code! There shouldn't be any hesitation to contribute open-source scripts if a vendor is deeming themselves good enough to sell private indicators, right?
Well, there's not many other ways to immediately tell if their products are "quality" if a vendor has no open-source publications to show for themselves as a developer.
If someone is going to sell indicators, we believe in our opinion that they should be able to contribute to the community with open-source work as well in a notable way. This can also be a vendor's way of "giving back" or at least just a way to show they care about the community.
Many vendors completely disregard publishing open source as a means to building a community & also being contributive to the great platform with a userbase they're building a business on top of, while in fact, it does all of this in an extremely productive way.
A possible reason why many vendors do not prioritize publishing open-source scripts could be that they don't know how to do so in any case, so they stick to private script publications mostly (or entirely) to avoid having to be in the public eye of the broader TradingView / Pine Script community.
🔹 2. Don't use misleading marketing practices
Indicators can be marketed as quality, efficient, comprehensive, educational, and supportive tools for traders / investors.
There is a balance a vendor must have when it comes to marketing a technical indicator as a product.
To be clear, of course, it is only logical & common sense to display a product as 'good', and there's nothing wrong with that.
However, if a vendor goes too far, such as saying, "Our indicator has an 89% win rate!" or "How to turn $1k into $100k!" or even "Revealing the game-changing secret weapon that made trader $1M on 1 trade!" - then a vendor is simply using bad practices to acquire customers.
A great analogy can be an advertisement for a food company such as Pizza Hut. Of course, they want to make the pizza look great with excellent visuals, good lighting, & shiny cheese, however, they don't tell you by eating the pizza it will get you a 6-pack rock hard abs.
The same can be applied to marketing technical indicators as products. Of course, a vendor can display their product functioning well in good market conditions primarily, however, by claiming it has any sort of "win-rate" or guaranteed profits, a vendor is being misleading.
The only difference between the Pizza Hut ad & the technical indicator ad being it pertains to the analysis of financial markets, so, in general there should also be proper disclaimers where fit to address consumer expectations using such products.
🔹 3. Don't be misleading in your branding, either.
This goes hand-in-hand with the point made above on marketing.
If a brand itself is in relation to generating profits like "Profit-Bot" or a product / feature is called "10x-Gains-Moving-Average"... the vendor is likely en-route to problems in the long run with the business (bad reviews, business disputes, poor community, etc).
A great business is made on transparency, providing value, caring about customers, and making a difference within an industry for the better.
The more a business does good by customers, the healthier the business will be, & the longer the business will last.
Within the space of technical indicators as products, no matter how transparent the marketing / website is, many customers will still have the impression that they will use these products to help themselves 'make profits'.
While this is of course mostly everyone's goal being involved in financial markets in the first place, it calls for a good balance in the presentation of the indicators as well as setting expectations clear by communicating realistic expectations to customers as best as possible.
One thing vendors can easily do to be transparent, honest, & an overall good actor in the industry is to provide a generous refund policy to ensure consumers who may still have the wrong idea about the intended usage have the opportuntiy to move on with a full refund.
Executing on a good refund policy tends to be the most successful strategy for vendors opposed to free trials even for managing expectations because free trials can attract even less experienced traders who don't want to take the time to learn the product itself no matter how many times they have directed to not follow indicators blindly.
There are many instances of where this is seen as similarly true within digital products in general such as plug-ins, educational programs, etc.
🔹 4. Create unique products
This should be a given, however, it's something we thought we should mention as many vendors tend to impersonate or completely mimic other products already existing in hopes of theirs attaining the same level of attention.
The reality is most technical indicators as products have already seen a high level of adoption from the broader community and it universally is known to them that there are knockoff products existing already.
Joining forces with the knockoffs is not a good bet in any endeavor and we believe that originality can go a long way in this industry as well.
🔶 WHAT MAKES A BAD VENDOR?
Well, this can be easily summed up in 1 image of course.
You know what they say, if something sounds too good to be true... it isn't.
If someone is standing in front of an exotic car, flashing cash, and telling you they got this rad lifestyle by using their trading indicator... it should immediately raise 1,000 red flags for you.
There's no such thing as getting rich quick, especially based on the functionality of a technical indicator. Period.
This type of malicious marketing is extremely harmful to people as it directly gives them false hopes, plays into desperation, and is from a common-sense perspective; a deceptive marketing tactic used by charlatans.
Bad vendors do not publish any open-source contributions and primarily just stick to marketing indicators in misleading ways that overall harm the community.
There are many potential reasons as to why vendors market indicators in misleading ways:
1.) They don't understand indicators & they are actually snake-oil salesmen (image above).
2.) They do understand indicators, maybe have something decent developed, but just don't know how else to market indicators other than promising profits.
3.) They may have tried marketing in non-misleading ways before, found that misleading marketing is producing the most sales for them, so they became fueled with greed & doubled-down on the misleading claims when marketing their product regardless. (Instead of trying to build a reputable business).
🔶 WHY & HOW VENDORS CAN BE GOOD FOR THE COMMUNITY
Vendors have the power to reach more people, since at the end of the day, there is a business established behind them with marketing efforts.
We believe that people will buy indicators no matter what and that this is a real established market as products for traders, regardless of what the majority of investors think of it.
So, as long as there are good actors primarily at the top of the industry, this is what's best for the community overall, and possibly the overall perception of indicator vendors can change eventually.
Good acting vendors with the right practices as listed earlier in this article are able to educate more people through marketing their products, community growth, & open-source contributions that they publish as well.
All in turn, growing the broader interest in the scripting community which helps grow technical analysis further by having a larger number of users provide feedback to each other & further improve the space over time.
In the case of LuxAlgo as a provider for example, it would not have been possible to grow a TradingView following of 200,000+ without the marketing efforts outside of TradingView on platforms like YouTube, Instagram, and even TikTok for all indicators we have created (free & paid).
Which has certainly grown into a large community, which over time has meaningfully contributed to the interest in custom technical indicators & the scripting community overall in general.
In the case of a bad acting vendor, this is the exact opposite & bad for the community overall because they do not make any good contribution to the community and just merely exist to try & sell access to their private indicators.
🔶 DO PAID INDICATORS "WORK" BETTER THAN FREE INDICATORS?
If you are defining the word "work" as "make more profits", then the answer is a hard no in all cases.
If you are defining the word "work" as in "being more useful", then it truly just depends on how comprehensive or unique the indicator is.
We believe that indicators are best used as supportive tools for decision making, so it's important to be asking this question in the right context & with this understanding when considering a product.
In the context of LuxAlgo Premium indicators specifically, we believe the answer is yes due to how the indicators were designed as all-in-one toolkits that include presets, filters, & various customization/optimization methods specifically designed to help traders embrace their trading style.
The position for paid indicators to exist under a subscription model is primarily done since indicators can be frequently updated / improved over time based on the user's feedback.
There are, however, other aspects of paid indicators which could be legitimately more useful than anything you can find for free in some other cases such as unique volume-based tools, extensive market scanner scripts, etc.
Although, it is quite limited when it comes to traditional technical indicators such as moving averages or signal-based indicators to make a strong argument that one is better than another in any meaningful way.
In most cases, you can take one indicator and overfit it to appear "better" or "more accurate" than another indicator by finding more specific market conditions or settings that has an advantage over another.
As a technical analyst, you begin to understand this once you have experimented with vast amounts of technical indicators with different use cases and have thoroughly reflected on its actual benefits to you. It's truly impossible to make an alternative argument in all cases, including debatably all paid technical indicators in existence right now.
🔶 THE REAL VALUE PROPOSITION OF PAID TECHNICAL INDICATORS
Since we can conclude in mostly all scenarios that paid indicators don't "work" better than free indicators in a technical sense when referring to its accuracy or direct visual aid to a trader, it begs to question what the actual value proposition can be for a vendor selling access to indicators.
A large part of the alternative value prop for a vendor may fall under the community & education that it provides under the brand, or additionally, the prospect of a vendor making paid indicators more interoperable with other applications such as large-scale alerts systems or cross-platform functionality.
Many vendors may try to create value propositions for their paid indicators by hosting a signal group where analysts callout trades using their paid indicators, however, this typically will be done in misleading ways over-hyping the usage and is not generally a good practice for vendors or users in our opinion.
With all of this mentioned, it may seem that the entire industry is full of charlatans at times, however, we do not believe the space will remain like this forever.
🔶 SHOULD THIS BE A MORE LEGITIMIZED INDUSTRY?
The history of paid indicators goes all the way back to the 1980's with John Ehlhers & Mark Jurik being two notable figures providing paid tools through websites on various charting platforms.
There was also a rather strange ecosystem of products with generally 'awkward' branding existing on older charting platforms since the early 2,000's. Some of which on these platforms still exist to this day. While interestingly enough, practically none of these brands ever grew past being considered small plug-ins.
Some considerably large educational programs / memberships throughout the 2,000's (& some existing still to this day) have implemented indicators as a part of their offerings, although they typically tend to integrate indicators only to add on to their sales funnel styled websites in hopes to add unique value to their "life changing online course" positioning, so we won't mention any names.
Additionally, while most new traders are likely unaware, TradingView had an app-store marketplace themselves in the 2010's called "marketplace add-ons" where users could purchase indicators from various vendors within their indicators tab alongside the Public Library now called Community Scripts.
Likely as the TradingView platform & Pine Script was mass-adopted on a larger scale, this marketplace was discontinued for various reasons with the adoption of invite-only scripts, where anyone with a premium account can manage access on these types of script publications.
This pivotal shift leveled the playing field for the industry whereas it created a new ecosystem of vendors who all could leverage their ability to manage access to users without appearing as "just another marketplace add-on", but rather, actual brands themselves.
While keeping this piece as un-biased as possible, this is where LuxAlgo was born, & generally speaking, was primarily the inspiration for the hundreds of "Algo" brands popping up all over the internet trying to sell TradingView indicators due to our notoriety in this environment.
In this current landscape, we believe there is an established ecosystem that has potential to mature further into a 'healthy' industry, so to speak... as mentioned earlier, just as long as there are more good actors leading it than bad.
We are also hopeful for platforms to recognize this evolution themselves & directly support the ecosystem to grow more efficiently with stronger operations over time while still allowing these brands their own independence as they have now.
It's very optimistic considering the realization of how popular the ecosystem has become & with the prospect of vendors within it to lead it in positive ways, which overall brings more people to TradingView & grows genuine interest in the Pine Script community from all over the internet very effectively.
🔶 CONCLUSION
We strongly believe indicator vendors will always exist in some capacity considering the 30–40-year history, the rise of digital products on the internet, as well as the growing popularity of indicator vendors in this current landscape. Considering this, it's important to ensure the brands leading the space are good actors so the space itself can mature long-term.
As a prominent figure in this industry, we hope from this article to have provided a lot of transparency for the broader community of traders & investors who may not have been aware of this space in such detail, as well as for any aspiring vendors to hopefully look to us and what we have outlined as a good role model / checklist for the sake of making this industry more legitimized in the future.
Thank you for reading!
- Sean Mack (Founder @LuxAlgo)
Credits
Alex Pierrefeu (TV profile @alexgrover) for being a massive leader in LuxAlgo since the beginning & going deep all the time creating theories w/ me about technical analysis & the industry with genuine fascination.
John Ehlers for being what we call the grandfather of this entire industry dating back to the 1980's with MESA Software.
Mark Jurik as a serious 'wave maker' with Jurik Research and for leading the way in the early 2,000's as a provider of unique tools.
@ChrisMoody for being a real "OG" in the TradingView community & for some cool discussions about the history of the industry early on.
All of the amazing users of LuxAlgo Premium since early 2020 and the entire community who provide us feedback to improve our indicators over time.
Everyone in the Pine Script community who follows us on TradingView & enjoys our contributions.
The @PineCoders team for being extremely helpful moderating the platform & for listening to our feedback / dealing with us throughout the years.
And lastly @TradingView for being the greatest platform for traders / investors and for making all of this possible in the first place.
Reasons and Effects of RecessionHi everyone,
Today, I am here with informative content. Let me start by saying that it will be a bit long, but let's learn what "Recession" means in detail.
🚩Recession can be defined as an economic downturn period. It is generally characterized by a decline in the gross domestic product (GDP) of a country in one or more quarters. Recession is associated with a series of economic indicators, such as rising unemployment rates, a decrease in consumer spending, and a general slowdown in economic activity.
🚩Recessions usually occur as part of the economic cycle and move with periods of economic growth. Some recessions may be shorter and less severe, while others may be longer and more severe. Recessions are generally attempted to be alleviated through economic incentives such as monetary policy, tax cuts, or increases in government spending.
🚩During a period when the economy slows down in general, financial markets are also affected. Recessions affect the prices of assets such as stocks, bonds, and commodities. Below are some examples of how recessions affect money markets:
🏳️Stocks: Stock prices usually decline during recession periods. Since the profitability of businesses decreases, investors tend to sell stocks as they expect a decrease in the company's future earnings potential. Therefore, during recession periods, there are often declines in stock markets.
🏳️Bonds: During recession periods, bonds usually have more demand. This may be due to investors turning to a safer investment. Bond interest rates may decline, and some investors may turn to safer but lower-yielding bonds from higher-risk assets.
🏳️Gold and other commodities: Gold and other commodities usually have demand during recession periods. This may be due to investors looking for a safer haven. Gold is a widely used "safe haven" asset worldwide, and its price usually rises during recession periods.
🏳️Currencies: Exchange rates between currencies can also change during recession periods. For example, currencies of countries with slowing economies usually decline, while currencies of countries with stronger economies usually become more valuable.
🚩The 2008 global financial crisis was triggered by a collapse that began in the US mortgage market. This collapse started when mortgage lenders turned high-risk mortgage loans into high-risk debts by commercializing them. Mortgage debts were then packaged with various debt instruments and sold in financial markets by investment banks. The collapse of debt instruments resulted in unpaid mortgage debts, a decline in house prices, and more homeowners facing financial difficulties. This situation turned into a mortgage crisis that began in 2007 and lasted until the middle of 2008.
🚩FED made several statements in the early 2008 indicating that there was a "mild recession" in the US economy. However, the FED failed to take necessary precautions for the collapse of the mortgage market to turn into a crisis.
One reason why FED could not take necessary precautions for the collapse of the mortgage market to turn into a crisis was due to the loose regulations of financial institutions in the US and permission to finance risky debts with high leverage. Therefore, the statements made by FED in early 2008 could have been made to maintain market confidence.
🚩However, towards the end of 2008, the mortgage crisis deepened and turned into a global financial crisis, which resulted in many financial institutions going bankrupt, unemployment rates rising, and a significant decline in the world economy.
As a result, the statements made by FED in 2008 were based on the assumption that the mortgage crisis would result in a less severe recession. However, this assumption did not come true, and the mortgage crisis turned into a global financial crisis. These events have shown that regulatory institutions need to closely monitor risks in financial markets and complexity in debt instruments.
Similarities and Differences:
🚩We can say the following about the similarities and differences between the 2008 global financial crisis and a potential crisis:
Similarities:
• Both the 2008 crisis and a potential crisis could begin with a collapse in financial markets.
• Both crises can affect many economic sectors and countries.
• Crises usually cause a decline in economic activity and a rise in unemployment rates.
• Both crises may require central banks to intervene through monetary policies by lowering interest rates.
Differences:
• The 2008 crisis began with the collapse of high-risk loans in the mortgage market. The start of a potential crisis may depend on a different cause or event.
• The 2008 crisis resulted in the bankruptcy of many financial institutions. In a potential crisis, the situation of financial institutions or the structure of financial instruments may be different.
• The 2008 crisis turned into a global financial crisis. The magnitude of a potential crisis will depend on how widespread the crisis is, which sectors are affected, and whether the crisis has a global impact.
• In a potential crisis, countries' economic structures and policies before the crisis may have a different impact on the severity and duration of the crisis.
🚩In conclusion, any economic crisis cannot be predicted in advance, and we cannot know its definite results beforehand. However, by looking at the causes and consequences of past crises, we can say that uncertainty and fluctuations in financial markets and economic activity are significant during crisis periods.
Possible Impact on Cryptocurrencies:
🚩Predicting the impact of a potential recession on cryptocurrency assets and Bitcoin is a difficult issue. However, in case of uncertainty in financial markets and investors avoiding risky assets, it is possible for cryptocurrencies to lose value. On the other hand, Bitcoin and other cryptocurrencies may act as a safe haven asset, especially in times of economic turmoil, and may increase in value.
Differences Between Technical Recession and Real Recession
🚩Technical recession is a situation where the economy has a declining growth rate for a certain period (usually a quarter or more). In this case, a country's economy shows a decline for two consecutive quarters. Technical recession is generally considered an indicator of an economic downturn period.
🚩Real recession, on the other hand, is an economic downturn period where economic indicators such as rising unemployment rates and decreasing consumer spending sharply decrease. One of the most important determinants of a real recession is the unemployment rate in an economy. When unemployment rates rise in an economy, the purchasing power of the unemployed people decreases, and as a result, consumer spending declines.
🚩The difference between the two terms is that technical recession only refers to a two-quarter economic downturn period, while real recession refers to more extended, usually more severe, and more serious economic problems such as an increase in unemployment.
Let's Take a Look at the 2001 and 2008 Crises
🚩In the past, the US economy entered a technical recession several times, but also experienced real recessions. For example, in 2001, the US economy shrank for two quarters, and technically, a recession occurred. However, the main reason for this economic downturn was the burst of the high-tech bubble. Therefore, the contraction in the economy was only caused by a temporary factor, and there was no significant change in other economic indicators.
🚩However, after the 2008 financial crisis, the US economy went through a more severe recession. This crisis was caused by subprime mortgages and other risky financial instruments. The crisis led to significant losses in financial markets and the bankruptcy of major banks. As a result, economic growth slowed down, unemployment rates increased, and consumer spending declined. This situation was evaluated as a real recession, and the US economy struggled to recover for a long time.
🚩The Fed has taken various steps to address technical and real recessions in the US economy by regulating interest rates and using monetary policy tools. For example, after the 2008 financial crisis, the Fed reduced interest rates to zero and tried to support financial markets using monetary policy tools. These steps helped the economy to recover, and the US economy started to grow again.
If you've read this far, you probably liked this content. Don't forget to use the like button, and if you feel like it, you can even leave a comment. Moreover, sharing knowledge is powerful, so you can share this content with your friends who you want to strengthen.
Goodbye. 👋🏻👋🏻👋🏻

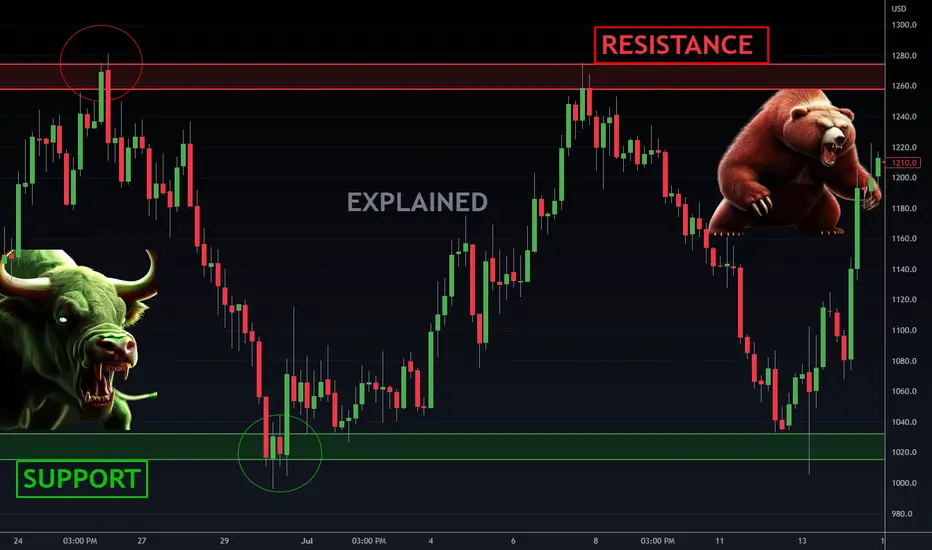
Support and Resistance Explained WHAT IS SUPPORT AND RESISTANCE
Trading support and resistance is like playing a game of tug-of-war between buyers and sellers in the market.
Imagine a group of people trying to pull a rope from opposite sides. If one side is stronger, they will pull the rope in their direction. In trading, the buyers and sellers are like these people pulling on the rope.
Support is like the floor of a room. It's the level at which the buyers come in and start buying a stock, because they believe that the price won't go lower than that level. So, if the stock price drops to the support level, it's like the buyers have put a floor on the price and won't let it go lower.
Resistance is like the ceiling of a room. It's the level at which the sellers start selling a stock, because they believe that the price won't go higher than that level. So, if the stock price goes up to the resistance level, it's like the sellers have put a ceiling on the price and won't let it go higher.
Traders use support and resistance levels to make decisions about when to buy or sell a asset. If the price is approaching a support level, a trader might decide to buy the asset, because they believe that the buyers will come in and push the price back up. On the other hand, if the stock price is approaching a resistance level, a trader might decide to sell the stock, because they believe that the sellers will push the price back down.
Remember, support and resistance levels are not always exact, and the asset price can break through them if there is enough buying or selling pressure. But they can still be useful tools for traders to make informed decisions.
Identifying Support and Resistance
🔷Look for areas where the price has previously turned around: This is one of the most common methods to identify support and resistance levels. You can look at a price chart and identify areas where the price has bounced back from in the past. These areas can become support or resistance levels in the future, depending on the direction of the price movement.
🔷Use trend lines: Trend lines are lines drawn on a price chart that connect the highs or lows of the price movement. A trend line connecting the higher highs can be a resistance line, while a trend line connecting the lower lows can be a support line.
🔷Pivot points: Pivot points are calculated using the previous day's high, low, and close prices. These levels can act as potential support and resistance levels for the current day's trading. You can find pivot point using Tradingview built in "More Technicals tools"
🔷Moving averages: Moving averages are used to smooth out the price action and identify the overall trend. They can also act as support or resistance levels, depending on where the price is in relation to the moving average.
🔷Fibonacci retracements: This method uses Fibonacci ratios to identify potential support and resistance levels. The levels are calculated by dividing the vertical distance between two significant price points by the key Fibonacci ratios (38.2%, 50%, and 61.8%).
It's important to note that support and resistance levels are not exact and can sometimes be broken. So, it's essential to use other indicators and confirm the levels before making any trading decisions.
Here are some other key facts about support and resistance that you may find useful:
🔸Support and resistance levels can switch roles: When a support level is broken, it can turn into a resistance level, and vice versa. For example, if a stock price breaks through a resistance level, that level can become a support level for future price movements.
🔸Multiple support and resistance levels can exist: A price chart can have multiple support and resistance levels at the same time, depending on the time frame and the volatility of the market. Traders can use different levels to make informed decisions about buying or selling a stock.
🔸Volume can confirm support and resistance levels: High trading volume at a support or resistance level can confirm its validity. For example, if a stock price bounces off a support level with high trading volume, it's a sign that there is buying pressure at that level.
🔸Support and resistance levels are not exact: As I mentioned earlier, support and resistance levels are not exact and can be broken. Traders should use other indicators, such as trend lines, moving averages, and candlestick patterns, to confirm the levels before making any trading decisions.
🔸Support and resistance levels can be influenced by external factors: Economic events, news releases, and market sentiment can also influence support and resistance levels. For example, a positive earnings report can break through a resistance level, while negative news can break through a support level. Traders should keep an eye on these external factors to adjust their trading strategies accordingly.
Important to Understand About Leverage and Your Own EquityHi Everyone! This is simply a brief summary of WHY it's important to understand how to use leverage. We should always start (begin) with how much of our own equity we should allow to be at risk of liquidation. I personally allow myself to use up to 3 percent of my TOTAL equity in a position; while also allowing the price action to move up to 15 percent against my SWING position. This tutorial is referring to SWING trading and NOT scalping.
I'm not going to take the time to write down everything here in the description. The content in the video should be sufficient to help one understand how to determine your position size. Your position size must rely on the following:
How much of my TOTAL equity should I risk in a leverage position?
What percent will I allow price action to move AGAINST my position before liquidating my position?
Knowing those two (2) things (above) helps you determine the proper size of your position and how much leverage you should use in that position to avoid losing more than I intended.
IMPORTANT: MAKE SURE YOU ARE USING ISOLATED LEVERAGE RATHER THAN CROSS LEVERAGE. Why? To avoid losing more of your total equity. Especially, if you did not setup a stop loss. It's best to simply use "isolated" leverage where at all possible.
Remember... This is NOT a detailed tutorial on margin (leverage) trading. The main purpose of this tutorial was simply to point out how to manage the amount of your TOTAL equity you are willing to risk in any given trade... Why? Because doing this also helps you determine what should be the proper size of your position. However, you cannot know the proper size of that position if you do not also factor in how much of a move you will allow AGAINST your position before being liquidated.
I'm not sure if this is confusing or not. It may be quite confusing to many and not so confusing to others. This is why it's best for you to watch the video.
Thank you for your valuable time!
Happy Trading and Stay Aweosme!
David

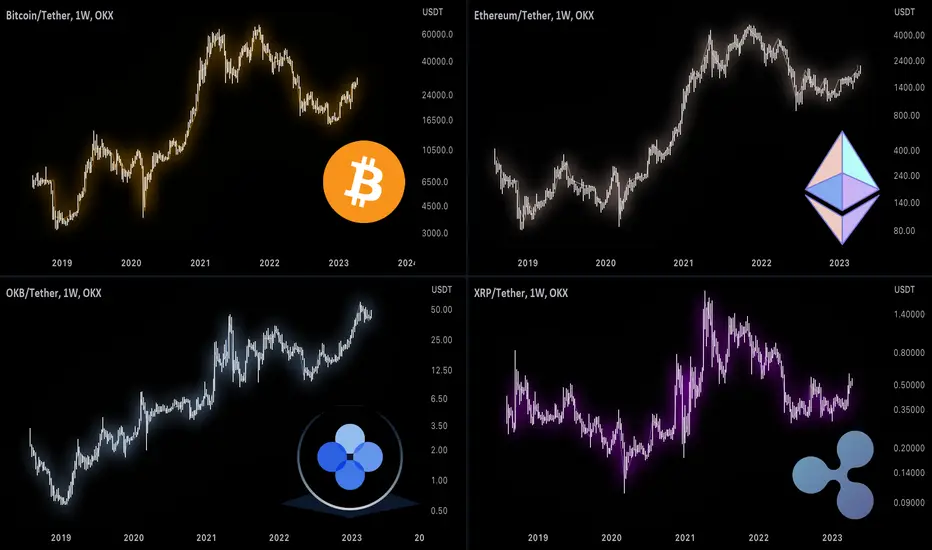
Investing in CryptoThere are approximately 22,932 cryptocurrencies in existence.
The image above shows the hundreds of cryptocurrencies on TradingView's crypto coins heat map. Click here to interact with the heat map
With so many cryptocurrencies, how does one determine which, if any, are worth investing in?
In this post, I'll explain how I sorted through thousands of cryptocurrencies to identify a small handful that met my investing criteria. This is post is meant to be educational, but is not meant to be financial advice.
I began by using TradingView's crypto screener , shown below. I filtered out cryptocurrencies with a market cap of less than $100 million. In my opinion, cryptocurrencies with a market cap smaller than $100 million are too volatile and illiquid to safely invest or trade. Assets with a such small market cap can also be prone to price manipulation. The low volume and illiquid conditions also tend to result in poor-quality charting data.
I analyzed the charts of over 200 cryptocurrencies with a market cap of over $100 million. To account for the possibility that a cryptocurrency under the $100 million market cap was growing fast enough to eventually become a candidate, I re-screened all the cryptocurrencies by market cap at a second point in time (6 months later). I also performed both screenings during the current crypto bear market when fewer new cryptocurrencies were coming into existence. I observed that most cryptocurrencies decayed in value relative to the U.S. dollar.
When an asset decays in value relative to the U.S. dollar this generally means that the market believes the asset is becoming worthless. Since the majority of the most highly capitalized cryptocurrencies were decaying in price over time, I assumed that lesser capitalized cryptocurrencies were also decaying in price relative to the U.S. dollar. Therefore, I concluded that most cryptocurrencies are becoming worthless over time.
To objectively determine whether or not an asset is decaying relative to the U.S. dollar one can apply a regression channel to the entire price history of the asset. If the channel is downsloping, then the asset is decaying in value as time passes.
The chart above shows an example of a cryptocurrency that has decayed in value relative to the U.S. dollar. Most cryptocurrencies decay in value relative to the U.S. dollar. (Note: Although the denominator is Tether the chart has been adjusted to USD.)
Although most cryptocurrencies decay in value over time, dozens of cryptocurrencies move up in value relative to the U.S. dollar over time (and have an upsloping regression channel). For these high-performing cryptocurrencies, I then used relative strength analysis to determine the best investing candidates.
For each cryptocurrency that had a market cap of over $100 million and that had an upsloping regression channel relative to the U.S. dollar over its entire existence, I analyzed the cryptocurrency relative to Bitcoin to see if it outperformed. If the cryptocurrency decayed over time relative to Bitcoin (downsloping regression channel), I removed it from my list because I concluded that it would be better to just invest in Bitcoin. Although I excluded crypto that underperformed Bitcoin, I could not reach the conclusion that crypto that outperformed Bitcoin was worth investing in until I first validated the conclusion that Bitcoin itself was worth investing in.
While a quick glance at the price history of Bitcoin, as shown below, may convince many people that Bitcoin is worth investing in, I needed an objective, evidence-based, and mathematical method to determine whether Bitcoin is a wealth-building asset or merely a speculative bubble. Fortunately, chart analysis can help us infer if an asset is a speculative bubble or actually wealth-building over the long term.
In a prior post, I explained that from a conceptual standpoint, a wealth-building asset is one that expands the investor's purchasing power over time. In order to do this, a wealth-building asset generally must move up in price over time faster than the rate at which the money supply expands. In general, only assets that are perpetually scarce or that are increasingly productive can overcome this difficult hurdle to be classified as a wealth-building asset. To learn more about why an asset must outperform the growth rate of the money supply in order to be wealth-building, you can check out my post below.
Therefore, in order to test whether or not Bitcoin is a wealth-building asset over the long term (years and decades), I compared Bitcoin against the money supply. What I found was surprising.
The above chart compares the market cap of Bitcoin to the U.S. money supply (M1).
I found that the market cap of Bitcoin was forming an apparent bull flag to the U.S. money supply (M1) on the yearly chart. Not only is a bull flag apparently forming, but the bull flag structure is apparently a perfect golden ratio.
To learn more about golden ratio bull flag structures and why they can be quite significant, you can check out my post below about advanced bull flag concepts.
I decided to delve deeper. This time I measured Bitcoin against the money supply on a lower timeframe and using a longer lookback period. I found that the total market cap of Bitcoin as a ratio to the money supply was moving in an apparent logistic growth curve . Although it is generally well-known that Bitcoin moves in a logistic growth curve to the U.S. dollar, it is not generally well-known that Bitcoin's market cap is also moving in the same logistic growth pattern relative to the money supply.
The chart above shows the total market cap of Bitcoin moving in an apparent logistic growth curve relative to the money supply. The pink line at the top is the value 1, and it represents a horizontal asymptote (the highest possible value that can be reached). Bitcoin's market cap can only go as high as the total supply of money. As Bitcoin's market cap approaches the total supply of money, further growth becomes increasingly inhibited because there is a decreasing amount of money left that can be converted into Bitcoin so as to push its price up further.
It is thus not possible for the total market cap of Bitcoin to exceed the total supply of money. In other words, when measured in U.S. dollars, the total value of 21 million Bitcoin can only ever be as high as the total global supply of U.S. dollars. Although the money supply tends to increase over time, the total market cap of Bitcoin as a ratio to the money supply can only ever reach 1.
Since the inhibiting factor of the growth of Bitcoin's market cap is the money supply then what this means on a conceptual level is that Bitcoin's logistic growth is actually a mathematical indication that Bitcoin is replacing the money supply. In essence, by forming a logistic growth curve to the U.S. money supply, we can infer that Bitcoin is displacing, if not outright replacing, the U.S. dollar. If you would like more scientific evidence that Bitcoin conforms to a logistic growth function, you can check out this research article .
It is not unusual that Bitcoin's price action appears as a logistic growth curve. Logistic growth curves characterize many types of replacement processes in nature. For example, each time a new variant of COVID-19 emerged, it replaced the previous variant through logistic growth, which can be shown in a chart of the relative prevalence of COVID-19 variants over time.
The chart above shows the "S-curve" or sigmoid pattern that characterizes logistic growth. Variants of COVID-19 vying for hosts to infect is reflected as a logistic growth race among circulating and emerging variants. In many ways, this competition among virus variants is analogous to the competition of cryptocurrencies: Each cryptocurrency competes with existing and emerging cryptocurrencies to form a logistic growth curve relative to the U.S. dollar, thereby challenging its market dominance. A small subset of cryptocurrencies are so competitive that they also form a logistic growth curve relative to Bitcoin, which reflects their attempt to replace even Bitcoin's market dominance.
The final step I took in analyzing cryptocurrency for investing potential was to detect which, if any, cryptocurrencies were moving in logistic growth not only to the U.S. dollar but also to Bitcoin. If one can detect an asset that will move in a logistic growth curve to Bitcoin early on, the extent of wealth that can be built is extraordinary.
Below are a couple of examples of the relative strength analyses I performed.
Bitcoin vs. Bitcoin Cash
The above chart shows a downsloping regression channel, indicating that Bitcoin Cash decays in value relative to Bitcoin over time. Therefore, Bitcoin is a better long-term investment than Bitcoin Cash.
Bitcoin vs. Ethereum
In the chart above, one can see that when compared to Bitcoin, Ethereum produces an upsloping regression channel. Since the Pearson correlation coefficient is quite low and since Ethereum was unable to reach a higher high relative to Bitcoin in the current halving cycle, the relative strength of Ethereum and Bitcoin are indeterminate. In light of this, I decided that investing in both Bitcoin and Ethereum could allow me to diversify and lower the risk of investing in only one of the two.
Aside from Bitcoin and Ethereum, in a follow-up post, I'll reveal which other 3 cryptocurrencies I currently invest in. One of them may be a surprise to many. Feel free to leave a comment below indicating which cryptocurrencies you think should be in the top 5 long-term investing candidates.
In conclusion, the analysis above shows that, to a reasonably high degree of certainty, cryptocurrency (Bitcoin specifically) is challenging the current monetary system in ways that it has not been challenged before. It is my belief that cryptocurrency is the next step in the evolution of human financial markets. It builds the infrastructure for a monetary system that equips humans with more efficient transactions within digital spaces. While the Bitcoin blockchain is far from perfect and is heavily reliant on non-renewable energy consumption, it solves many of the inefficiencies that financial systems have been unable to solve for millennia.
If you enjoyed this post, I would greatly appreciate it if you leave a boost! If you have any questions or would like to share your thoughts, feel free to leave them in the comments below. In a future post, I plan to explain why cryptocurrency's displacement of existing monetary systems is becoming increasingly inevitable due to the proliferation of DeFi protocols.
Important Disclaimer
Nothing in this post should be considered financial advice. Trading and investing always involve risks and one should carefully review all such risks before making a trade or investment decision. Do not buy or sell any security based on anything in this post. Past results do not guarantee future returns. Cryptocurrencies are highly volatile. Never borrow money or use margin to invest in cryptocurrency. Cryptocurrency is not backed or insured by any authority and is therefore a high-risk asset class. You can lose all or some of your money in cryptocurrency. Please consult with a financial advisor before making any financial decisions. This post is for educational purposes only.
Buffett's Strategy for Modern MarketsWarren Buffett's Investment Model: Adapting the Oracle of Omaha's Strategies to Today's Markets
As someone deeply inspired by Warren Buffett's investment principles, I've always been fascinated by how his strategies can be adapted to the ever-changing financial landscape. In exploring this subject, my goal is to share valuable insights that fellow investors can apply in today's dynamic markets while still drawing from the wisdom of the Oracle of Omaha.
Warren Buffett has long been hailed as one of the greatest investors of all time. His value-based investment strategy has proven to be wildly successful for decades. However, as the financial landscape evolves, it's essential to examine the continuing effectiveness of his approach in today's markets. This article will explore key aspects of Buffett's investment model and assess which elements remain relevant and which may have lost their edge.
Section 1: The Core Principles of Warren Buffett's Investment Model
1.1 Long-term value investing
a. Patience and discipline: Buffett's approach requires investors to patiently wait for opportunities to buy undervalued stocks and hold them for the long term, often ignoring short-term market fluctuations.
b. Margin of safety: Buffett emphasizes purchasing stocks at a discount to their intrinsic value, providing a margin of safety and reducing the downside risk.
c. Dividends and reinvestment: Buffett's model often focuses on companies that pay stable and growing dividends, which can be reinvested to compound returns over time.
1.2 Moats and competitive advantage
a. Pricing power: Companies with strong pricing power can increase prices without significantly affecting demand, providing a competitive edge.
b. Brand recognition: A strong brand can create customer loyalty, making it difficult for competitors to gain market share.
c. Cost advantage: Companies with a cost advantage can offer products or services at lower prices or enjoy higher profit margins, increasing their competitiveness.
1.3 Focus on quality businesses
a. Financial health: Buffett seeks companies with low debt levels and strong cash flow generation, indicating financial stability.
b. Management quality: A capable management team is crucial to a company's success, with Buffett prioritizing companies led by experienced and shareholder-oriented leaders.
c. Consistent earnings growth: Companies with a history of consistent earnings growth are more likely to deliver strong returns over time.
Section 2: The Changing Landscape: Points of Buffett's Strategy Losing Effectiveness
2.1 Ignoring technology and growth stocks
a. Missed opportunities: Buffett's aversion to technology stocks has caused him to miss out on significant investment opportunities in companies like Amazon, Google, and Apple.
b. The rise of disruptive technologies: The rapid pace of technological innovation has led to disruptive companies reshaping entire industries, with early investors in these companies often reaping substantial rewards.
c. The importance of adaptability: Investors should be willing to adapt their strategies to recognize the changing landscape and embrace new investment opportunities.
2.2 Relying on financial statement analysis
a. The limitations of traditional metrics: Metrics like price-to-earnings (P/E) and price-to-book (P/B) ratios may not accurately capture the value of companies with significant intangible assets.
b. The role of intangibles: Intangible assets, such as intellectual property, customer relationships, and brand value, are increasingly important drivers of business success.
c. Alternative valuation methods: Investors should consider incorporating alternative valuation methods, such as discounted cash flow (DCF) analysis and relative valuation techniques, to better assess a company's true worth.
Section 3: Adapting Buffett's Investment Model to Today's Markets
3.1 Embracing technological innovation
a. Identifying future industry leaders: Investors should seek out companies with innovative technologies that have the potential to become industry leaders in their respective sectors.
b. Focusing on long-term growth potential: While some technology and growth stocks may appear overvalued by traditional metrics, their long-term growth potential may justify a higher valuation.
c. Balancing risk and reward: Investing in technology and growth stocks may carry higher risks, but also the potential for greater rewards, which can be balanced through careful portfolio diversification.
3.2 Diversification across industries and geographies
a. Expanding investment horizons: By investing in a variety of industries and regions, investors can capitalize on global growth opportunities and reduce dependence on specific sectors or markets.
b. Mitigating regional risks: Diversification across geographies helps to mitigate risks associated with regional economic downturns or political instability.
c. Harnessing the potential of emerging markets: Investors can seek opportunities in emerging markets with strong growth potential and favorable demographic trends, further diversifying their portfolios.
3.3 Incorporating ESG factors
a. Long-term sustainability: Companies with strong ESG performance are more likely to be sustainable in the long term, aligning with Buffett's long-term value investing approach.
b. Improved risk management: Incorporating ESG factors into the investment decision-making process can help identify potential risks and opportunities that may not be apparent through traditional financial analysis.
c. Growing investor demand: As ESG investing gains traction, companies with strong ESG performance may attract increased investor interest, potentially driving higher valuations and returns.
Warren Buffett's investment model has been highly successful for decades, but it's essential to adapt his principles to the ever-changing financial landscape. By embracing technological innovation, diversifying investments, and incorporating ESG factors, investors can continue to benefit from the wisdom of the Oracle of Omaha while navigating the complexities of today's markets.
10 Rules for Successful Trading1. Study.
Learn how financial markets work. Years ago I took Khan Academy's free courses on the financial markets. It really helped reinforce what I already knew, taught me new stuff and solidified my confidence in understanding how the financial markets work. Here's the link: www.khanacademy.org
Learn the basics of Technical Analysis. For this part I read "Technical Analysis of the Financial Markets" by John Murphy. I read the whole book not once, but twice, and I constantly refer to it to refresh my memory. You can also get the supplemental workbook to do exercises and test your proficiency. Link: www.amazon.com
Learn the basics of Macroeconomics and Microeconomics. Khan Academy also provides excellent free courses in this subject area with quizzes and tests to confirm your proficiency. This part is important for understanding the big picture. Link: www.khanacademy.org
2. Develop a trading plan.
Write out your trading plan step-by-step and follow it every time. If you don't do this, you won't be consistently profitable in the long term. Never trade on a whim, even if you fear missing out on a big move. I would rather miss out on a big move up because I took the time to develop a plan than jump in without a plan and experience a big move down. Here's a good resource for how to develop a trading plan: www.ig.com
3. Find a trading mentor.
Find someone who is more experienced than you and learn from them. I was able to connect with a very experienced trader here on Trading View with whom I share watchlists and get trade ideas from. We chat regularly and confirm or critique each other's ideas. Having a trading mentor has been invaluable to my trading. It's important to find someone who is trustworthy and competent, and willing to critique your trading ideas. Often we as traders only see what we want to see in the chart and miss or ignore obvious clues that go against our theory. For example, what one person sees as a triple bottom (bullish) another person may see as a bear flag (bearish).
Another way to learn from other traders is to subscribe to traders who post high-quality content on Youtube. I subscribe to a few great trading Youtubers who give me all kinds of insights. My trading has definitely improved because of learning from other traders. With this said, don't go overboard. Find just a couple of good people to follow. You don't want to follow dozens and dozens of traders as you will suffer from information overload.
4. Manage risk.
Preserving your capital is necessary to stay in the game, so you need to manage risk. No matter how good your charting may be, some of your trades will go against you and will need to get out. That's why I always use stop losses and get out of a trade at a certain predetermined level. Stop losses always limit loss, but do not necessary limit profit. This in turn allows you to only be right half of the time (or in some cases even less) and still be profitable. The topic of stop losses actually warrants it own discussion. In the future, I will be writing a post on how to place your stop losses.
Other risk management strategies include: limiting the amount of margin you use, only risking a certain percentage of your portfolio on any given trade, and diversifying your portfolio. A key difference between trading and investing is that investing does not (typically) employ stop losses. Long-term investors typically manage risk by using diversification.
5. Be humble.
Check your ego at the door. It does not matter if you're right. The only thing that matters is your money. Never stay in a trade because you don't want to admit that you were wrong. I've seen plenty of charts that looked amazing and then a black swan event happens. Perhaps one of the best ways to think about it is to consider this paraphrased statement from the legendary trader Larry Williams: "Regardless of past performance, never forget that every new trade you make only has a 50% chance of success." I have seen some Trading View users who are completely consumed by pride and post their win rates and super high-profit percentages. I steer clear of these traders because they fail one major rule of good trading: staying humble. Past performance is not a guarantee of future performance.
6. Keep a journal.
This one is very important. Whenever I learn something new about trading, I write it down in a trading notebook. Whenever I make a mistake, I write down what went wrong and what I learned from the mistake. My trading notebook contains my strategies both for bear markets and bull markets, contains the steps for my daily routine, contains my screener criteria, and contains a listing of all the important things I've picked up over the years of trading.
7. Track your assets.
Employ some kind of a method for tracking your performance. Even though it's time-consuming, I use a spreadsheet.
8. Avoid speculation.
Never trade based on speculation or emotion. Never buy or sell an asset because of fear (whether fear of a market crash or fear of missing out on a huge rally). Never enter into a position simply because you like the company, and similarly do not avoid selling your position because you love the company too much. The most successful traders are rigorously unemotional and unattached. In my opinion, I define anything that does not involve an analysis of data as speculation.
I have also come to learn that by the time everyone is talking about something, it is usually at peak mania and will not go up further. For example, when your co-worker or close friend is talking about how much they made from Bitcoin, it's probably time to sell. Similarly, if you see everyone on social media posting photos of how much it costs to fill up their car with gas, it probably means we're at the peak of gas prices.
9. Learn how to use your charting platform.
One of the best things I ever did to master my charting was to spend a few weeks doing nothing but just learning all the features on Trading View. When I first signed up for Trading View I was overwhelmed by all the tools, indicators, strategies, and ideas on here. So I knew I had to take a timeout from trading and just learn the tools first. For several weeks rather than focus on trading, I focused on learning Trading View. I favorited indicators that work best for my strategy, I created layouts and explored every nook and cranny on the platform. Trading View is incredibly powerful because it provides access to so much data. Having access to data is power. By taking the time to learn how to use all of its tools, I was able master the financial markets to a degree that I can now make predictions just good as those high-paid Wall Street analysts. Your subscription will pay for itself through the profits you make.
10. "Look first. Then leap."
Always chart out your entry point, stop loss, and profit target before entering a trade. Ask yourself: How much risk am I willing to take for how much profit?
Here's a great resource from Investopedia that inspired this post: www.investopedia.com
This list of good trading rules is nowhere near comprehensive, so please leave a comment below to share your rules and tips for successful trading!

Price / Earnings: Interpretation #1In one of my first posts , I talked about the main idea of my investment strategy: buy great “things” during the sales season . This rule can be applied to any object of the material world: real estate, cars, clothes, food and, of course, shares of public companies.
However, a seemingly simple idea requires the ability to understand both the quality of “things” and their value. Suppose we have solved the issue with quality (*).
(*) A very bold assumption, I realize that. However, the following posts will cover this topic in more detail. Be a little patient.
So, we know the signs of a high-quality thing and are able to define it skilfully enough. But what about its cost?
"Easy-peasy!" you will say, "For example, I know that the Mercedes-Benz plant produces high-quality cars, so I should just find out the prices for a certain model in different car dealerships and choose the cheapest one."
"Great plan!" I will say. But what about shares of public companies? Even if you find a fundamentally strong company, how do you know if it is expensive or cheap?
Let's imagine that the company is also a machine. A machine that makes profit. It needs to be fed with resources, things are happening in there, some cogs are turning, and as a result we get earnings. This is its main goal and purpose.
Each machine has its own name, such as Apple or McDonald's. It has its own resources and mechanisms, but it produces one product – earnings.
Now let’s suppose that the capitalization of the company is the value of such a machine. Let's see how much Apple and McDonald's cost today:
Apple - $2.538 trillion
McDonald's - $202.552 billion
We see that Apple is more than 10 times more expensive than McDonald's. But is it really so from an investor's point of view?
The paradox is that we can't say for sure that Apple is 10 times more expensive than McDonald's until we divide each company's value by its earnings. Why exactly? Let's count and it will become clear:
Apple's diluted net income - $99.803 billion a year
McDonald's diluted net income - $6.177 billion a year
Now read this phrase slowly, and if necessary, several times: “The value is what we pay now. Earnings are what we get all the time” .
To understand how many dollars we need to pay now for the production of 1 dollar of profit a year, we need to divide the value of the company (its capitalization) by its annual profit. We get:
Apple - $25.43
McDonald’s - $32.79
It turns out that in order to get $ 1 earnings a year, for Apple we need to pay $25.43, and for McDonald's - $32.79. Wow!
Currently, I believe that Apple appears cheaper than McDonald's.
To remember this information better, imagine two machines that produce one-dollar bills at the same rate (once a year). In the case of an Apple machine, you pay $25.43 to issue this bill, and in the case of a McDonald’s machine, you pay $32.70. Which one will you choose?
So, if we remove the $ symbol from these numbers, we get the world's most famous financial ratio Price/Earnings or P/E . It shows how much we, as investors, need to pay for the production of 1 unit of annual profit. And pay only once.
There are two formulas for calculating this financial ratio:
1. P/E = Price of 1 share / Diluted EPS
2. P/E = Capitalization / Diluted Net Income
Whatever formula you use, the result will be the same. By the way, I mainly use the Diluted Net Income instead of the regular one in my calculations. So do not be confused if you see a formula with a Net Income – you can calculate it this way as well.
So, in the current publication, I have analyzed one of the interpretations of this financial ratio. But, in fact, there is another interpretation that I really like. It will help you realize which P/E level to choose for yourself. But more on that in the next post. See you!

Price Action: How to Trade ReversalsTrading on key levels is one of the basic principles of Price Action trading in the financial markets. There are two main ways to trade on levels: on the breakout and on the reversal. How to distinguish a correct signal to enter the market from a false one, how to set stop-losses and take-profits and what other nuances should be considered when trading in this style?
🔷 Specifics of trading from levels
Key price levels are present in any financial market, including Forex. Often, these horizontal lines act as either support or resistance to further price movement, which is why traders are so interested in them. These key lines are formed due to the large accumulation of buy and sell orders. When the price reaches such a congestion, the current strength of the trend, as a rule, is not enough to close all these orders and move the price further.
Therefore, if the movement does not get support, the price will turn in the opposite direction. If there are new volumes that are able to break through a great accumulation of orders, it is likely to happen that the trend strength is enough for the further movement, i.e. a strong breakout level will occur. Of course, events do not always develop only according to these scenarios, but these are the two most likely variants. There are big players at the market whose orders influence the price due to big volumes. Because of this, experienced traders only need to correctly identify such levels and signals that the price is most likely to reverse. The classic level is an area based on the opening or closing candlestick prices (not the high/low), which the chart has already touched before. That is, if the chart, having risen to a certain level, rolled back and then approached that level again, the price value at the extreme point will be that level.
🔷 Entering the market
The main condition for entering the trade at the reversal from the level, it is necessary to make sure that it is exactly the reversal. If the price is just approaching the key level, it is too early to open a trade. The trader must form a reversal pattern of Price Action in order to be sure that the position opening is correct.
It may be the following patterns:
1. A Pinbar (a candlestick with a long shadow, level breakout and a small body);
2. Engulfing (the next candlestick is directed in the opposite direction, its body and shadows are bigger than those of the previous candlestick);
3. Tweezer top/bottom pattern (alternation of bullish and bearish candlesticks with the same lows and highs);
Once the pattern is formed, a trade can be opened.
For example, the screenshot above shows a pin bar with a large upper shadow breaking through the resistance level, then rolls back down and the candle closes in bearish status. At the opening of the next candle you can enter the sell trade.
🔷 Setting Stop Losses and Take Profits
Stop Loss should be set in such a way that a random movement against the direction of the trade, such as a level retest with a false breakout, does not knock the trader out of the market. It is impossible to set a specific value (e.g. 10 pips) for this trading style, the stop should be set based on the chart and "tails" of the candles in the visible proximity.
As for take profit, there are no strict rules for its setting. You can use the standard technique, multiplying the value of the stop-loss by 3 or 4 and set a TP on the resulting distance. This is correct from the money management point of view. However, in each situation there may be conditions for greater profits than the standard stop-loss. For example, you can focus on the next key level in the direction of the trade. However, unlike a stop, a TP should be set so that the price is guaranteed to hit it when approaching the key level.
🔷 Important points
1. It is worth paying attention to the strength of the level and the likelihood that it will break or hold. There is a common misconception that the more price reversals from a level, the more likely it is that the level will remain intact. In fact, if the price keeps testing a certain level over and over again without going into the opposite trend, it means that it is likely to be broken. In practice this means that it is better to skip the third and the next attempts of a level bounce, trading on the second one only.
2. One should not draw a distinction between a classic reversal from a level and a retest of the level after it has been broken, when, for example, support becomes resistance. Such a retest is an even stronger signal than a simple reversal. The probability of a successful trade is even higher if we obtain a clear signal for reversal after an unsuccessful attempt to break through the level in the opposite direction.
3. The probability of a reversal or breakout of the level can be assessed based upon the movement towards the key level. If the previous candlesticks were small and differently directed, but the price has still reached the level, a breakout is quite probable. If the trend was strong and confident and the level was reached in just a few candles, but was not broken through, most likely, it won't be broken through. This phenomenon can be explained by the fact that market makers are trying to mislead small traders, playing on visual triggers. Seeing a strong movement, the trader unconsciously waits for a breakout and as a result suffers losses giving his money to the market maker.
According to this logic, the conclusion can be made that if a big candle has reached a level, stopped in it, and closed without breaking through it, a breakout will probably never happen. But if a powerful candle has broken through the level, passed some more points (or tens of points), and closed on the other side, the breakout can be considered to have taken place.
4. When opening a trade, attention should be paid to the extrems of the nearest candlesticks. If the maximums (when testing the resistance) are approximately equal, or differ by 1-2 points, this supports the signal for the reversal and the pullback. The same is true for candlestick minimums when testing support.
🔵 Conclusion
All other things being equal, a reversal of the level is more probable than its breakthrough. Such statistics gives a trader the reason to count on more signals and following the strategy rules will ensure profitable trading. However, one should keep in mind that trading from levels is a tactic that requires a trader's experience to be able to make decisions according to the situation. Despite the presence of rules, there is no clear algorithm that would regulate the actions in any situation.
And due to this, a trader who uses the analysis of levels in his trading system, can count on the success of his trade. Most trading systems, allowing to open trades on an automatic basis, very quickly lose their validity, as well as trading robots based on these algorithms. The market is constantly changing, and only the ability to adjust to these changes and make decisions depending on the situation provides professional traders with a stable and high income.

Trade Mindfully:How Meditation Can Help You Thrive in the MarketMeditation is an incredible tool that can help a trader in many ways, both emotionally and mentally. It can bring calmness to the chaos of the stock market and provide a sense of clarity that is often difficult to achieve.
When you meditate, you foster mindfulness that can carry forward to your next task. This helps you to keep a clear focus on what you need to do next, whether it is to hit the trading floor or simply take a shower. By being present in the moment, you can better focus on what you need to be in your best frame of mind for trade.
Meditation can help you to control your state of mind, so you can filter out unnecessary information. You then can better concentrate on what is important, and your ability to understand the situation can be heightened. It enhances your patience and enables you to think outside the box.
Most importantly, meditation puts you in a better shape to deal with the volatility of the stock market. By focusing on positivity and reducing unhealthy thoughts, meditation helps you to stay calm and collected, even in the most stressful situations. This, in turn, keeps you from having a mental breakdown after a difficult day of trading.
Some days, even meditation cannot completely take away the blues, and that's perfectly okay. What matters most is that you set aside time to focus on your mental wellbeing. Meditation is a powerful tool that can help you to achieve greater emotional and mental balance, enabling you to perform your best as a trader.
Now, Take a deep breath and meditate on this for a moment....

THE TYPICAL WEEK OF A TRADER 🗓
In this educational article, I will teach you how to properly plan your trading week.
Sunday.
While the markets are closed, it is the best moment to prepare the charts for next week.
First of all, charts should be cleaned after the previous trading week: multiple setups and patterns become invalid or simply lose their significance and their stay on the charts will only distract.
Secondly, key levels: support and resistance, supply and demand zones and trend lines should be updated. Similarly to patterns, some key levels become invalid after a previous week, for that reason, structures should be reviewed.
Monday.
Analyze the market opening, go through your watch list and check the reaction of the markets.
Flag / mark the trading instruments that you should pay a close attention to. Set alerts and look for trading setups.
Tuesday. Wednesday. Thursday.
If you opened a trading position, keep managing that.
Pay attention to your active trades, go through your watch list and monitor new trading setups.
Friday.
Assess the entire trading week. Check the end result, journal your winning and losing trades. Work on mistakes.
Decide whether to keep holding the active position over the weekend or look for a way to exit the market before it closes.
Saturday.
Stay away from the charts. Meditate, relax and chill while the markets are closed.
Trading for more than 9-years, I found that such a plan is the optimal for successful full-time / part-time trading. Try to follow this schedule and let me know if it is convenient for you
❤️Please, support my work with like, thank you!❤️

MOVING AVERAGES MADE SIMPLE Moving averages are commonly used to analyze and forecast trends in financial data. There are several types of moving averages, including:
Simple Moving Average (SMA): This is the most basic type of moving average. It calculates the average price of a security over a specified number of periods.
Weighted Moving Average (WMA): This type of moving average assigns a weight to each period's price, with more recent prices given greater importance.
Exponential Moving Average (EMA): This type of moving average puts greater weight on more recent prices and adjusts the weighting based on the volatility of the prices.
Smoothed Moving Average (SMMA): This type of moving average is similar to the EMA but uses a different formula to calculate the weighting.
Hull Moving Average (HMA): This type of moving average uses weighted averages to reduce lag and improve responsiveness to price changes.
The choice of moving average type depends on the specific application and the trader's preference.
EXPLANATION ON HOW EACH WORKS.
Simple Moving Average (SMA): Imagine you have a toy car that you play with every day for a week. At the end of each day, you write down how far the car traveled. The simple moving average is like adding up all the distances the car traveled and dividing by the number of days you played with it. This gives you an average distance the car traveled each day.
Weighted Moving Average (WMA): Now, imagine you have another toy car that you play with every day, but you like to give more importance to the distance it traveled on the most recent day. The weighted moving average is like giving more weight, or importance, to the distance the car traveled on the most recent day when calculating the average.
Exponential Moving Average (EMA): The exponential moving average is like the weighted moving average, but it puts even more importance on the most recent day's distance. This means that the average changes more quickly when there are big changes in the price.
Smoothed Moving Average (SMMA): The smoothed moving average is like the exponential moving average, but it uses a slightly different formula to calculate the average. It's a way of smoothing out the bumps in the price and making it easier to see the trend.
Hull Moving Average (HMA): The Hull moving average is like the smoothed moving average, but it tries to reduce the time lag between the price changes and the moving average. It's like having a toy car that responds more quickly to your movements when you're controlling it with a remote.
So those are the different types of moving averages! They all have different ways of calculating the average price over time, and they can be useful for different things depending on what you're trying to analyze.
CROSSING OF MOVING AVERAGES
The crossing of moving averages is a popular technical analysis tool used to identify potential changes in the direction of a trend.
A moving average is calculated by taking the average price of a security over a certain period of time. Traders often use two moving averages, one short-term and one long-term, to look for potential changes in the trend. When the short-term moving average crosses above the long-term moving average, it is called a "golden cross," which is a bullish signal that suggests the price may be moving higher. Conversely, when the short-term moving average crosses below the long-term moving average, it is called a "death cross," which is a bearish signal that suggests the price may be moving lower.
Here's an example to help explain: Let's say we have a 50-day moving average and a 200-day moving average. If the 50-day moving average crosses above the 200-day moving average, it's a golden cross, indicating that the short-term trend is turning bullish, and it could signal a potential upward price movement. Conversely, if the 50-day moving average crosses below the 200-day moving average, it's a death cross, indicating that the short-term trend is turning bearish, and it could signal a potential downward price movement.
The crossing of moving averages can be used in conjunction with other technical indicators and analysis to help traders make more informed decisions when buying or selling a security. It's important to note that no indicator is foolproof, and traders should always consider other factors such as market conditions, fundamental analysis, and risk management before making any trading decisions.
INFLICTION POINT VS CROSSOVER
An inflection point is a point on a graph where the curvature, or shape, of the line changes. It is a point of transition between a curve that is bending upwards and one that is bending downwards, or vice versa. In other words, it's a point where the rate of change of a function changes from positive to negative or vice versa.
On the other hand, the crossing of moving averages is a technical analysis tool used to identify potential changes in the direction of a trend, which is based on the relationship between two or more moving averages.
While the crossing of moving averages may sometimes coincide with an inflection point, they are two distinct concepts.
HOW YOU SHOULD USE MOVING AVERAGES
🔸Trend identification: Moving averages can help traders identify the direction of the trend. For example, if the price of a security is consistently trading above a moving average, it can indicate an uptrend, while trading below the moving average can indicate a downtrend. This information can be useful in determining entry and exit points for trades.
🔸Support and resistance levels: Moving averages can also help identify potential support and resistance levels. In an uptrend, the moving average can act as a support level, while in a downtrend, it can act as a resistance level. Traders can use these levels to help determine their risk and reward when placing trades.
🔸Momentum indicators: Moving averages can be used as momentum indicators to help identify the strength of the trend. A short-term moving average crossing above a long-term moving average can indicate bullish momentum, while a short-term moving average crossing below a long-term moving average can indicate bearish momentum.
🔸Trading signals: Traders can use crossovers of moving averages to generate buy and sell signals. For example, a bullish signal is generated when a short-term moving average crosses above a long-term moving average (golden cross), while a bearish signal is generated when a short-term moving average crosses below a long-term moving average (death cross).
🔸Moving averages can be used to clearly see trend waves by smoothing out price data over a specified period of time. This can help traders identify the direction of the trend and the strength of the momentum in the market.
When using moving averages, it's important to consider other factors such as market conditions, fundamental analysis, and risk management. Traders should also experiment with different types of moving averages and time periods to find what works best for their trading strategy.

⚠️ Risk:Reward & Win-Rate CheatsheetThe reward to risk ratio (RRR, or reward risk ratio) is maybe the most important metric in trading and a trader who understands the RRR can improve his chances of becoming profitable. Basically, the reward risk ratio measures the distance from your entry to your stop loss and your take profit order and then compares the two distances. Traders who understand this connection can quickly see that you neither need an extremely high winrate nor a large reward:risk ratio to make money as a trader. As long as your reward:risk ratio and your historical winrate match, your trading will provide a positive expectancy.
🔷 Calculating the RRR
Let’s say the distance between your entry and stop loss is 50 points and the distance between the entry and your take profit is 100 points .
Then the reward risk ratio is 2:1 because 100/50 = 2.
Reward Risk Ratio Formula
RRR = (Take Profit – Entry ) / (Entry – Stop loss)
🔷 Minimum Winrate
When you know the reward:risk ratio for your trade, you can easily calculate the minimum required winrate (see formula below).
Why is this important? Because if you take trades that have a small RRR you will lose money over the long term, even if you think you find good trades.
Minimum Winrate Formula
Minimum Winrate = 1 / (1 + Reward:Risk)
👤 @AlgoBuddy
📅 Daily Ideas about market update, psychology & indicators
❤️ If you appreciate our work, please like, comment and follow ❤️

Top Technical Indicators PairingsWhile there is no single definitive answer to which specific combinations of technical indicators is the most profitable, I can try to provide some popular combinations and their application in trading strategies.
The success of these strategies depends on various factors such as the trader's skill, market conditions, and risk management techniques.
1. Moving Averages and MACD (Moving Average Convergence Divergence):
Moving averages smooth out price data to help traders identify trends. Two commonly used types are the Simple Moving Average (SMA) and the Exponential Moving Average (EMA). A popular strategy is to use two moving averages with different timeframes, such as the 50-day and 200-day SMAs. When the shorter timeframe moving average (e.g., 50-day SMA) crosses above the longer timeframe moving average (e.g., 200-day SMA), it generates a bullish signal. Conversely, when the shorter timeframe moving average crosses below the longer one, it generates a bearish signal.
The MACD is a trend-following momentum indicator that calculates the difference between two EMAs of the price and then smooths it with another EMA. A common configuration is the 12-day EMA, the 26-day EMA, and the 9-day signal EMA. When the MACD line crosses above the signal line, it generates a bullish signal, while a bearish signal occurs when the MACD line crosses below the signal line. Combining moving averages with MACD can provide stronger signals, as the moving averages identify trends and the MACD helps confirm them.
2. RSI (Relative Strength Index) and Bollinger Bands:
The RSI is a momentum oscillator that measures the speed and change of price movements. The RSI ranges from 0 to 100 and is typically used to identify overbought or oversold conditions. An RSI above 70 is considered overbought, suggesting that the asset may be overvalued and due for a pullback. An RSI below 30 indicates oversold conditions, suggesting that the asset may be undervalued and due for a rebound.
Bollinger Bands consist of a moving average (usually the 20-day SMA) and two standard deviations above and below it. The bands expand and contract based on an asset's volatility. When the price touches the upper Bollinger Band, it could be a sign of overextension and an impending reversal to the downside. Conversely, when the price touches the lower Bollinger Band, it could indicate that the asset is oversold and due for a rebound.
By combining the RSI and Bollinger Bands, traders can identify potential reversal points with greater confidence. For instance, if the RSI indicates an overbought condition and the price touches the upper Bollinger Band, it could provide a stronger signal to exit long positions or enter short positions.
3. Stochastic Oscillator and ADX (Average Directional Index):
The Stochastic Oscillator is a momentum indicator that compares an asset's closing price to its price range over a specific period. The indicator consists of two lines: %K and %D. When %K crosses above %D, it generates a bullish signal, while a bearish signal occurs when %K crosses below %D. Traders often look for overbought or oversold conditions, similar to the RSI.
The ADX is a non-directional indicator that measures the strength of a trend. A rising ADX indicates a strengthening trend, while a falling ADX suggests a weakening trend. The ADX does not provide information on the direction of the trend; it merely indicates the trend's strength.
By combining the Stochastic Oscillator and ADX, traders can identify potential entry and exit points with greater confidence. For instance, if the Stochastic Oscillator signals a bullish crossover and the ADX is rising, it could indicate that the uptrend is strong, and a long position may be warranted. Conversely, if the Stochastic Oscillator signals a bearish crossover and the ADX is rising, it could suggest that the downtrend is strong, and a short position may be appropriate.
4. Support and Resistance with Volume Indicators:
Support and resistance levels are critical price points where buying or selling pressure tends to push the price back in the opposite direction. Support is a price level where buying pressure is strong enough to prevent the price from falling further, while resistance is a level where selling pressure is strong enough to stop the price from rising further.
Volume indicators, such as OBV (On-Balance Volume) or VPVR (Volume Profile Visible Range), can provide insights into the strength of price movements. The OBV is a cumulative indicator that adds volume on up days and subtracts volume on down days, reflecting buying and selling pressure. The VPVR displays the volume traded at different price levels, helping traders identify areas of high buying or selling interest.
By combining support and resistance levels with volume indicators, traders can better identify potential entry and exit points. For example, if the price is approaching a support level and the OBV is rising, it could suggest that buying pressure is increasing, and the price may bounce off the support level. Similarly, if the price is nearing a resistance level and the OBV is falling, it could indicate that selling pressure is increasing, and the price may reverse at the resistance level.
5. Fibonacci Retracements and Moving Averages:
Fibonacci Retracements are a popular tool used to identify potential support and resistance levels based on the Fibonacci sequence. By measuring the distance between a significant high and low in a price trend, traders can identify key retracement levels, typically at 23.6%, 38.2%, 50%, 61.8%, and 78.6%. These levels often act as support or resistance, where price reversals might occur.
Combining Fibonacci Retracements with moving averages can offer additional confirmation for potential reversal points. For instance, if a 50-day moving average aligns with a 61.8% Fibonacci retracement level, it could strengthen the case for a potential reversal at that price point.
6. Ichimoku Cloud and RSI:
The Ichimoku Cloud is a comprehensive technical analysis tool that provides information on trend direction, momentum, and support and resistance levels. It consists of five lines: Tenkan-sen, Kijun-sen, Senkou Span A, Senkou Span B, and Chikou Span. A bullish signal is generated when the price moves above the cloud, while a bearish signal occurs when the price moves below the cloud.
By combining the Ichimoku Cloud with the RSI, traders can obtain more robust signals for potential trend reversals or continuations. For example, if the price breaks above the Ichimoku Cloud and the RSI moves above 50, it could indicate a strong bullish momentum, suggesting a long position. Conversely, if the price falls below the Ichimoku Cloud and the RSI drops below 50, it could signal a strong bearish momentum, suggesting a short position.
While these combinations of technical indicators have been popular and potentially profitable for predicting the performance of SPY up to September 2021, it's crucial to remember that no strategy is foolproof. The success of a trading strategy depends on various factors, such as the trader's skill, market conditions, and risk management techniques.
7. Chart Patterns and Volume Indicators:
Chart patterns are visual representations of market psychology and can help traders identify potential trend reversals or continuations. Some common chart patterns include Head and Shoulders, Double Tops and Bottoms, Triangles, and Flags. These patterns often suggest impending price movements based on historical performance.
By combining chart patterns with volume indicators like OBV (On-Balance Volume) or VPVR (Volume Profile Visible Range), traders can gain insights into the strength of price movements and validate potential breakouts or reversals. For example, a bullish breakout from a chart pattern accompanied by increasing OBV could indicate strong buying pressure, supporting the likelihood of a sustained upward move. Conversely, a bearish breakdown from a chart pattern accompanied by decreasing OBV could suggest strong selling pressure, supporting the likelihood of a continued downward move.
8. Candlestick Patterns and Moving Averages:
Candlestick patterns are another form of visual analysis that can provide insights into market sentiment and potential price direction. Common candlestick patterns include the Hammer, Shooting Star, Engulfing Pattern, and Doji. These patterns can offer short-term signals for potential reversals or trend continuations.
Combining candlestick patterns with moving averages can help traders confirm potential trend changes or continuations. For example, a bullish candlestick pattern occurring near a rising moving average could suggest that the uptrend is likely to continue. Similarly, a bearish candlestick pattern near a falling moving average could indicate that the downtrend may persist.
9. Multi-timeframe Analysis:
Using multiple timeframes in technical analysis allows traders to gain a more comprehensive understanding of market trends and price action. By examining different timeframes, such as daily, weekly, and monthly charts, traders can identify the primary trend, intermediate trend, and short-term fluctuations.
By applying technical indicators and chart patterns across various timeframes, traders can obtain more robust trading signals and improve their decision-making process. For example, a moving average crossover on a daily chart may provide a more significant signal if it aligns with a key support or resistance level on a weekly chart.
10. Divergence Analysis with Oscillators:
Divergence analysis involves comparing the price action of an asset with an oscillator, such as the MACD, RSI, or Stochastic Oscillator. A divergence occurs when the price makes a new high or low, but the oscillator fails to follow suit, suggesting a potential reversal or weakening of the current trend.
For instance, if an asset's price reaches a new high but the RSI fails to make a new high, it could signal a bearish divergence, indicating that the uptrend may be losing momentum. Conversely, if the price makes a new low and the RSI fails to make a new low, it could signal a bullish divergence, suggesting that the downtrend may be losing steam.
By incorporating divergence analysis with other technical indicators or chart patterns, traders can enhance their decision-making process and identify potential trend reversals with greater confidence.
In conclusion, while various combinations of technical indicators, chart patterns, and analytical techniques have been popular and potentially profitable for predicting the performance, the success of a trading strategy depends on various factors, such as the trader's skill, market conditions, and risk management techniques.
Traders must continuously evaluate and adjust their strategies based on changing market conditions and consider other factors such as fundamentals, economic news, and global events. It's also essential to practice proper risk management techniques, such as setting stop-loss orders and position sizing, to minimize potential losses and enhance the overall success of a trading strategy.
A Great Trading Strategy For New/Unprofitable TradersHey gang! Thanks for watching.
Reminder -The most important bits of a strategy are:
- directional bias
- where to trade
- where to risk
- how to manage
There's one final piece that we didn't mention in the video - capital management. AKA - how much to spend, of all of your capital, on the risk in a given trade.
A great rule of thumb is that no trade should risk more than 3% of your capital at any one time. Breakout trading has a mixed win rate, and sometimes you can have lots of losses in a row. You need to control for this.
Thanks again and let us know how and where you think this strategy could be further improved.
Cheers!
(Again, none of this is investment advice, simply educational material about good trading practices - all our content is subject to our terms of service.)

📊Liquidity GrabSmall and big players tend to acquire larger positions in the market than they can afford, in an attempt to benefit from the leverage. This is where the concept of liquidity grab comes into play. Large trades and institutional investors need to locate liquidity areas in the market to complete their trades. Stops and stop-loss orders are critical for survival in a leveraged market. Stop hunting is a common practice in Forex trading, where traders are forced to leave their positions by triggering their stop-loss orders. This can create unique opportunities for some investors, which is called a liquidity grab. Stop hunting is a trading action where the price and volume action threatens to trigger stops on either side of support and resistance. When a large number of stops are triggered, the price experiences higher volatility on more orders hitting the market. Such volatility in price generates opportunities for participants to enter a trade in a favourable environment or protect their position. The fact that too many stop losses triggered at once result in sharp moves in the price action is the reason behind the practice of liquidity grab.
📍 What is liquidity sweep?
In trading, a liquidity sweep is the process of filling an order by taking advantage of all available liquidity at multiple price levels. Traders use this method to ensure their orders are filled at the best possible price by breaking up their order into smaller sub-orders and spreading them across multiple price levels. Institutional traders and high-frequency trading firms commonly use liquidity sweeps for efficient and quick execution of large trade volumes.
📍 Liquidity Zones
Big players in trading aim for the best prices but face challenges finding sufficient counter-forces to fill their large orders. Entering the market at low liquidity areas creates more volatile markets, negatively impacting the average price. Conversely, entering at high liquidity areas results in less volatile markets, ensuring a better average price for the position. These liquidity zones are where stop-loss orders are placed, and the concept of "liquidity grab" comes from the need for big players to enter the market in these zones to take large positions. Traders use swing lows and swing highs to create these liquidity zones and place stops as reference points, resulting in either a reversal to the mean or a breakout of the level.
👤 @AlgoBuddy
📅 Daily Ideas about market update, psychology & indicators
❤️ If you appreciate our work, please like, comment and follow ❤️

Fibonacci Levels and How They Can Be Used in TradingGreetings, @TradingView community! This is @Vestinda, bringing you a helpful article on the topic of Fibonacci Retracements and how to effectively utilize them in your trading strategies.
Fibonacci retracement levels are helpful for traders and investors in financial markets. They're horizontal lines on price charts that can show where price may reverse direction.
These levels are based on the Fibonacci sequence, which is a series of numbers that occur in math and finance.
Use case:
The first thing to understand about the Fibonacci tool is that it is most effective when the market is trending.
In an upward trending market, traders commonly use the Fibonacci retracement tool to identify potential buying opportunities on retracements to key support levels. Conversely, in a downward trending market, traders may look for opportunities to short sell when the price retraces to a Fibonacci resistance level.
Fibonacci retracement levels are regarded as a predictive technical indicator because they attempt to forecast where the price will be in the future.
Based on the theory, when trend direction is established, the price tends to partially return or retrace to a previous price level before continuing to move in the direction of the trend.
How to Find Fibonacci Retracement Levels:
Fibonacci retracement levels can be found by identifying the key Swing High and Swing Low points of an asset's price movement. Once these points are established, you can use the Fibonacci retracement tool, which calculates the potential levels of support and resistance based on the ratios between the key points.
To apply the Fibonacci retracement tool, click and drag from the Swing Low to the Swing High in a downtrend, or from the Swing High to the Swing Low in an uptrend. This generates a set of horizontal lines at predetermined Fibonacci ratios, including 23.6%, 38.2%, 50%, 61.8%, and 78.6%.
Are you keeping up with me? ;)
Now, let's explore some examples of how Fibonacci retracement levels can be applied in cryptocurrency trading
The Uptrend:
In this instance, the Fibonacci retracement levels were plotted by selecting the Swing Low and Swing High points, which were observed on January 8th, 2021 at a price of $41,904.
The Fibonacci retracement levels were $33,521 (23.6%), $29,197 (38.2%), $26,114 (50.0%*), $23,356 (61.8%), and $19,925 (76.4%), as shown in the chart.
Traders anticipating that if BTC/USD retraces from its recent high and it will likely find support at a Fibonacci retracement level. This is due to the tendency of traders to place buy orders at these levels as the price drops, creating a potential influx of buying pressure that can drive up prices.
While the 50.0% ratio is not officially recognized as a Fibonacci ratio, it has nonetheless become widely used and has persisted over time.
Now, let’s look at what happened after the Swing High occurred.
Price bounced through the 23.6% level and continued to fall over the next few weeks.
Two times tested 38.2% but was unable to fall below it.
Subsequently, around January 28th, 2021, the market continued its upward trend and surpassed the previous swing high.
Entering a long position at the 38.2% Fibonacci level would have likely resulted in a profitable trade over the long run.
The Downtrend
Next, we will explore the application of the Fibonacci retracement tool in a downtrend scenario. Here is a 4-hour chart depicting the price action of ETH/USD.
As you can see, we found our Swing High at $289 on 14 February 2020 and our Swing Low at $209 later on 27 February 2020
The retracement levels are $225 (23.6%), $236 (38.2%), $245 (50.0%), $255 (61.8%) and $269 (76.4%).
In a downtrend, a retracement from a low could face resistance at a Fibonacci level due to selling pressure from traders who want to sell at better prices. Technical traders often use Fibonacci levels to identify areas of potential price resistance and adjust their trading strategies accordingly.
Let’s take a look at what happened next.
The market did make an attempt to rise, but it briefly halted below the 38.2% level before reaching the 50.0% barrier.
The placement of orders at the 38.2% or 50.0% levels would have resulted in a profitable trade outcome.
In these two instances, we can observe that price positioned itself at a Fibonacci retracement level to find some temporary support or resistance.
These levels develop into self-fulfilling support and resistance levels as a result of all the people who utilize the Fibonacci tool.
All those pending orders could affect the market price if enough market participants anticipate a retracement to take place close to a Fibonacci retracement level and are prepared to enter a position when the price hits that level.
In conclusion:
It's important to note that pricing doesn't always follow an upward trajectory from Fibonacci retracement levels. Instead, these levels should be approached as potential areas for further research and analysis.
If trading were as simple as placing orders at Fibonacci retracement levels, markets wouldn't be so volatile.
However, as we all know, trading is a complex and dynamic process that requires a combination of knowledge, skill, and experience to succeed.
We are truly grateful for your attention and time in reading this post. If you found it insightful and beneficial, we would be thrilled if you could show your support by clicking the <> button and subscribing to our page.
We are excited to share that our upcoming post will showcase what occurs when Fibonacci retracement levels do not perform as expected. Stay tuned for an informative and professional read.

Special Report: Celebrating 40 Years of Crude Oil FuturesNYMEX: WTI Crude Oil ( NYMEX:CL1! )
On March 30, 1983, New York Mercantile Exchange (NYMEX) launched futures contract on WTI crude oil. This marked the beginning of an era of energy futures.
WTI is now the most liquid commodity futures contract in the world. It’s 1.7 million daily volume is equivalent to 1.7 billion barrels of crude oil and $125 billion in notional value. For comparison, global oil production was 89.9 million barrels per day in 2021.
Looking back at 1983, exactly 40 years ago:
• NYMEX was primarily a marketplace for agricultural commodities, with Maine Potato Futures being its biggest contract;
• NYMEX was a small Exchange with 816 members, mainly local traders and brokers;
• Known as Black Gold, crude oil was a strategic commodity regulated by governments and monopolized by the Big Oil, the so-called “Seven Sisters”;
• Pricing of crude oil was not a function of free market but controlled by the Organization of Petroleum Export Countries (OPEC), an oil cartel.
The birth of crude oil futures contract was a remarkable story of financial innovation and great vision. Facing a “Mission Impossible”, NYMEX successfully pulled it off. At the helm of the century-old Exchange was Michel Marks, its 33-year-old Chairman, and John E. Treat, the 37-year-old NYMEX President.
The “Accidental Chairman”
Michel Marks came from a long-time NYMEX member family. His father, Francis Q. Marks, was a trading pit icon and influential member. Since high school, the younger Marks worked as a runner on the trading pit for his family business. After receiving an Economics degree from Princeton University, Michel Marks returned to NYMEX as a full-time member, trading platinum and potatoes.
In 1977, the entire NYMEX board of directors resigned, taking responsibility for the Potato Futures default from the prior year. Michel Marks was elected Vice Chairman of the new Board. He was 27 years old.
One year later, the Chairman at the time suffered a stroke. Michel Marks replaced him as the new NYMEX Chairman. At 28, he’s the youngest leader of any Exchange in the 175-year history of modern futures industry.
White House Energy Advisor
John E. Treat served in the US Navy in the Middle East and later worked as an international affairs consultant in the region. He received an Economics degree in Princeton and a master’s degree in international relations from John Hopkins.
During the Carter Administration (1977-1981), Treat worked at the US Department of Energy. He served as Deputy Assistant Secretary for International Affairs and sat on the National Security Council and the Federal Energy Administration. In his capacity, Treat was at the center of the formation of US energy policy.
After President Carter lost his reelection bid, Treat left Washington in 1981. At the time, NYMEX was exploring new contracts outside of agricultural commodities. One possible direction was the energy sector, where NYMEX previously listed a Heating Oil contract with little traction in the market. With his strong background, Treat was recruited by NYMEX as a senior vice president.
A year later, after then President Richard Leone resigned, Treat was nominated by Chairman Marks to become NYMEX President. He was 36 years old.
The Birth of WTI Crude Oil Futures
In 1979, the Islamic Revolution in Iran overthrew the Pahlavi dynasty and established the Islamic Republic of Iran, led by Shiite spiritual leader Ayatollah Khomeini.
Shortly after, the Iran-Iraq War broke out. Daily production of crude oil fell sharply, and the price of crude oil rose from $14 to $35 per barrel. This event was known as the second oil crisis. It triggered a global economic recession, with U.S. GDP falling by 3 percent.
After President Reagan took office in 1981, he introduced a series of new policies, known as Reaganomics, to boost the U.S. economy. The four pillars that represent Reaganomics were reducing the growth of government spending, reducing federal income taxes and capital gains taxes, reducing government regulation, and tightening the money supply to reduce inflation.
In terms of energy policy, the Reagan administration relaxed government regulations on domestic oil and gas exploration and relaxed the price of natural gas.
NYMEX President John Treat sensed that the time was ripe for energy futures. He formed an Advisory Committee to conduct a feasibility study on the listing of crude oil futures. His strategic initiative received the backing of Chairman Michel Marks, who in turn gathered the support of the full NYMEX membership.
Arnold Safir, an economist on the advisory board, led the contract design of WTI crude oil futures. The underlying commodity is West Texas Intermediate produced in Cushing, Oklahoma. The delivery location was chosen for the convenience of domestic oil refineries. WTI oil contains fewer impurities, which results in lower processing costs. US refineries prefer to use WTI over the heavier Gulf oil.
WTI trading code is CL, the abbreviation of Crude Light. Contract size is 1,000 barrels of crude oil. At $73/barrel, each contract is worth $73,000. Due to the profound impact of crude oil on world economy, NYMEX lists contracts covering a nine-year period.
On March 29, 1983, the CFTC approved NYMEX's application. The next day, WTI crude oil futures traded on the NYMEX floor for the first time.
Competing for the Pricing Power
Now that crude oil futures were listed. Initially, only NYMEX members and speculators were trading the contracts. All the oil industry giants sat on the sidelines.
John Treat knew that without their participation, the futures market could not have meaningful impact on the oil market, not to mention a pricing power over crude oil.
In early 1980s, the global oil market was monopolized by seven Western oil companies, known as the "Seven Sisters". Together, they control nearly one-third of global oil and gas production and more than one-third of oil and gas reserves.
1) Standard Oil of New Jersey, later became Exxon;
2) Standard Oil of New York, later became Mobil Oil Company; It merged with Exxon in 1998 to form ExxonMobil;
3) Standard Oil of California, later became Chevron; It took over Texaco in 2001, and the combined company is still named Chevron;
4) Texaco, collapsed in 2001 and was taken over by Chevron;
5) Gulf Oil, which was acquired by Chevron in 1984;
6) British Persian Oil Company, operating in Iran, withdrew after the Iranian Revolution and then fully operated the North Sea oil fields, later British Petroleum ("BP");
7) Shell, an Anglo-Dutch joint venture.
Treat's background as President Carter's energy adviser played a key role. After nearly a year of hard work, the first Big Oil entered the NYMEX crude oil trading floor. However, it was not until five years later that all Seven Sisters became NYMEX members.
OPEC producers tried to boycott the crude oil futures market. However, as trading volume grew, they eventually gave in, first by Venezuela and then the oil producers in the Middle East.
Interestingly, the Middle Eastern oil producers started out by trading COMEX gold futures, probably as a hedge against oil prices. Gold has been a significant part in the Middle Eastern culture for long. As the main buyers of gold, the Arabs buy more gold when their pockets are filled with rising oil prices, and conversely, they sell gold when oil revenues fall and their ability to buy gold decreases.
With the participation of Big Oil and OPEC, coupled with an active crude oil options market, crude oil pricing power has shifted from the Middle East to NYMEX's trading floor by the end of the 1980s. WTI has also become a globally recognized benchmark for crude oil prices.
Happy Trading.
Disclaimers
*Trade ideas cited above are for illustration only, as an integral part of a case study to demonstrate the fundamental concepts in risk management under the market scenarios being discussed. They shall not be construed as investment recommendations or advice. Nor are they used to promote any specific products, or services.
CME Real-time Market Data help identify trading set-ups and express my market views. If you have futures in your trading portfolio, you can check out on CME Group data plans available that suit your trading needs tradingview.sweetlogin.com
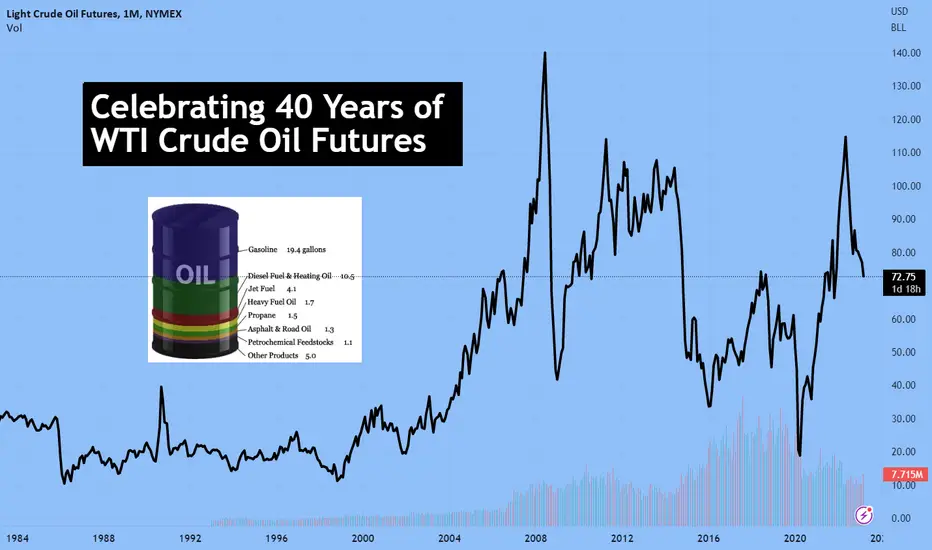
How To Trade the Triangle Consolidation Pattern!Hey Traders today I wanted to take a step back and show new traders the proper way of entering the market when it's consolidating in a triangle. Triangles are very common in trading and know how to identify them on your charts is a great tool to add to your trading arnsenal. Triangles can lead to explosive moves in financial markets so lets dive in and break it down to a science of how to trade it.
Enjoy
Trade Well,
Clifford

Why we should review price action to see if History will RepeatStudying price action and reviewing should be a key part to everyones trading and will improve overall results. Many Stocks, Currency pairs, Commodities or Indexes have differing nuances and characteristics with regards to Price Action so it is worth doing the homework before entering a trade. Even though they all trade around a similar Price Action Framework, quickly looking for small repeating patterns can greatly improve the probability and conviction and help your trades in the long run.
This short video looks EQR.asx which is a share listed on the ASX. By reviewing the previous price action, we can see that the current setup is so far following the same path as a previous big winner....I will be watching to see if history does repeat!!
Hope you enjoy

Using Chat GPT to build pinescriptThis is a lot different to our normal video but I really wanted to show the @TradingView community how you can use AI to build indicators in @PineCoders
I thought it would be easier to do as a video idea than a stream.
So I hope you enjoy & don't forget to shout out to me when you try it for yourself, I am keen to see what you build!
All the best
Mayfair!

The Ten Fundamental Objectives of the Federal ReserveIntroduction
The Federal Reserve System, often referred to as "the Fed," was established in 1913 in response to a series of banking panics. As the central banking institution of the United States, it plays a crucial role in maintaining the stability and integrity of the nation's monetary and financial systems. This essay explores the ten fundamental objectives of the Federal Reserve, which include maintaining price stability, promoting full employment, and ensuring a stable financial system, among others.
1. Price Stability
The primary objective of the Federal Reserve is to maintain price stability, which refers to a low and stable rate of inflation. By managing inflation, the Fed helps to preserve the purchasing power of money, ensuring that consumers and businesses can make informed decisions regarding spending, saving, and investment.
2. Maximum Sustainable Employment
Another key objective of the Federal Reserve is to promote maximum sustainable employment, also known as full employment. This means providing enough job opportunities for all individuals who are willing and able to work, while minimizing the rate of unemployment. By promoting full employment, the Fed contributes to overall economic growth and well-being.
3. Moderate Long-Term Interest Rates
The Federal Reserve aims to maintain moderate long-term interest rates, which are essential for economic growth and stability. By controlling short-term interest rates, the Fed can indirectly influence long-term rates, thereby encouraging borrowing, investment, and consumption.
4. Financial System Stability
One of the most critical objectives of the Federal Reserve is ensuring the stability of the financial system, which involves monitoring and regulating financial institutions, as well as identifying and addressing potential risks. By maintaining a stable financial system, the Fed helps to prevent crises and protect the economy from shocks.
5. Efficient Payment and Settlement System
The Federal Reserve is responsible for managing the nation's payment and settlement systems, which include check clearing, electronic funds transfers, and automated clearinghouse operations. By providing these services efficiently and securely, the Fed ensures that financial transactions occur smoothly, promoting confidence in the banking system.
6. Consumer Protection
Another important objective of the Federal Reserve is to protect consumers by enforcing federal consumer protection laws and regulations. This includes monitoring financial institutions for compliance, addressing consumer complaints, and providing education and resources to help consumers make informed financial decisions.
7. Supervision and Regulation
The Federal Reserve plays a vital role in supervising and regulating financial institutions to ensure their safety, soundness, and compliance with laws and regulations. This oversight helps to maintain a stable and resilient financial system, while also protecting consumers and investors.
8. Community Development
The Federal Reserve is committed to promoting community development by supporting initiatives that address issues such as affordable housing, small business development, and workforce development. This objective aims to foster economic growth and improve the quality of life in communities across the country.
9. Economic Research and Analysis
The Federal Reserve conducts extensive research and analysis to better understand the U.S. economy, as well as the global economy. This research informs the Fed's monetary policy decisions and helps it to fulfill its other objectives, such as promoting maximum employment and maintaining stable prices.
10. International Financial Cooperation
Finally, the Federal Reserve cooperates with other central banks and international financial institutions to promote global economic stability and financial system resilience. This collaboration allows the Fed to share information, resources, and expertise, ultimately benefiting the U.S. economy.
Conclusion
The Federal Reserve plays a pivotal role in the U.S. economy by pursuing ten fundamental objectives, which range from maintaining price stability to promoting international financial cooperation. By fulfilling these objectives, the Fed ensures the stability and growth of the U.S. economy, while also fostering a resilient and efficient global financial system.
Trade with care.
If you like our content, please feel free to support our page with a like, comment & subscribe for future educational ideas and trading setups.
