The 6-Candle RuleThe 6-Candle Rule can be applied to any time frame chart of the traders choosing. 60 minute chart means that we have 6 hours for this trade to start moving. If the short is entered in that area and price doesn't begin to move down, we'd then make the adjustment. If the level is identified on a 15 minute chart, then we’d manage the trade after 90 minutes (6 15-minute candles).
One of the biggest questions that I hear often from traders are questions about finding the perfect entry, and a close second is how to place stops and targets once that order has been entered. While entries, stops, and targets are of the utmost importance, something that I’m typically missing is how to manage the trade once I’m in and before it hits either the stop or the target. Ultimately, this comes back to understanding the power of time.
Any trader who's ever gotten into a position that has “stalled” after entry knows what I’m about to describe. The feeling of dread that creeps in, leaving only a sliver of hope because everything in their gut tells them it’s all about to go against them. This is the point where many traders stay in, having a rule that says to stay in no matter how long it takes to hit the stop or target. This then causes emotional stress that’s only compounded when the stop is hit and the trader feels like they should have gotten out earlier. Over time it may cause a trader to jump out because they feel like they’ve gotten burned, only to see price just before it makes the move you thought it was going to make anyway.
If this sounds like you, don’t feel alone! I’ve seen this in more people that I can count, but there’s a rule to help fix it. The rule is called the 6-Candle Rule. The 6-Candle Rule is pretty simple and consists of 3 parts:
1. Upon entry of the trade, if 6 candles on the entry timeframe have passed without price starting to move in the direction of the target, we have to make an adjustment.
2. If the trade is currently profitable, this is the time to move the stop to breakeven and leave the trade open. This gives the trade time to work, but removes the risk of the position.
3. If the trade is currently in the negative but has not yet hit the stop, close the position and move on.
The 6-Candle Rule can completely transform your trading . The rules will take some discipline to implement, but it can be a total game changer to your trade management. The rules are not set in stone set for you to follow but the idea is if you implement a framework for trade management of current open positions, the impact will be a positive one! This will be different for every individual trader/TF/Risk tolerance etc etc etc
FX:EURUSD
👍
Multiple Time Frame Analysis
How to Accurately Read My Schiff PitchforkAnother link to the Schiff Pitchfork idea is also below in "Related Ideas" :
I realized that sharing my Schiff Pitchfork idea may not have been sufficient enough to allow others to be able to use it efficiently and accurately. I wanted to make a video that shows people how I use the Schiff Pitchfork to trade and analyze; Along with some extra tips.
The video is 20 minutes, but well worth it and shows my analysis for BTC since I have came back to charting this January 13th.
In related links, you can also find the idea "BTC End above 41,700 potential". That idea shows some of the analysis on the movements during those times.
Thank you for watching the video. I hope you enjoyed it. Stay Healthy and Stay Safe.

How To Use Higher Time Frames To Swing TradeIf you struggle with what timeframes to analyze longer movements before entering trades, this video is for you.
I personally struggled with multiple timeframe analysis. I thought I had to use every timeframe to enter a trade. It wasn't until I got clear on the type of trader I was and stuck to two timeframes at a time is when the market began to become more clear to me. If you can relate this video is for you.

All too familiar crossroad/trade-offLet's be honest: who doesn't want a magical computer program that runs on your computer and tells you the future price of your favourite ticker, be it EURUSD, GBPJPY, BTCUSD, XAUUSD. More so a automated trading strategy that runs in the background 24-7 and will trade away.
Let's also be realistic : if someone has the code that can do this, they most likely won't share it, at least not for free. Somehow, in the past few months, I had this thought that I could just, you know, use Google to find such kind of code.
Surprisingly though, I learned a lot during this doomed-to-fail process. Not that I am currently making easy money in the market. Rather, now I understand why some common tutorials you'd find online may appear to work but will NOT work and what it might actually take to build a balanced profitable trading system.
When we talk about the secret behind becoming consistently profitable, there's actually no secret. A technical indicator may pop up in your mind that they may have secrets that make them consistently profitable. But no, the professionals are just like you, we are all human subject to the same stimulus in the market, fear and greediness.
///
The sole reason or one of the main reasons that I have taken it upon myself to start writing and posting ideas is to share my most up-to-date understanding with those of you who are also interested in computer assisted trading and to also lay out the many other inter-linked subjects trading related in the hope that someone can benefit from these ideas in some way/shape or form.💡
I myself personally have reached a crossroad/trade-off where I am not able to automate a strategy as I have no coding skills but that didn't stop me from compiling and using indicators, making them talk to each other, creating chart templates that fit a certain style/way of trading whether it be trend following/reversion you name it and in general having more of a methodical rules based approach to entries/exits.
///
After all these hustles, I decided to take a step back and revisit an initial assumption: there is some underlying correlation between future prices and past prices that can be learned by a machine. The school of technical traders would probably agree with this and it is likely for short amount of time, the price action is indeed momentum driven.
Nevertheless, once the news on companies or macro economy kicks in, things can go very wild. Unfortunately, price dataset's do not directly contain such information per se, but the future price will certainly depend on when certain news becoming known. Many often get blinded by the short-term, just one day the market rises/drops 1%, the whole crowds become fearful. Bad news and good news are always in the market, when people are fearful, they will look to the bad news, while the opposite for the hopeful times, they will look to the good news.
So here is the trade-off. It is more likely that you can use machine learning to capture the momentum of price actions on a short time scale. But you need to have high accuracy and make trades frequently to make meaningful money. Alternatively, if you build a model that accounts for news mentions and provide an okay prediction, say a few days into the future, you can also be rich pretty soon. Both are hard problems to solve. As you might have expected from the very beginning, making money is hard .
OANDA:EURUSD
👍
How to Determine Market Direction Using Multi timeframe AnalysisSo in this video I explain once more how to determine market direction using top down analysis. I think this is the third time someone has requested and its going to be my final time explaining with a video. Hopefully you can learn something from it. Thank you and trade safe

5 KEY points to control FOMOHi Traders,
FOMO is a VERY real thing and in this post, I wanted to share with you 5 key points that has helped me control my psychology around this throughout my trading journey.
1. Accept the market can go in any direction; Neutralize your mindset:
The market changes very quick on any given basis and just when you think you have a perfect set up, it could take a turn and make profits turn into losses in matter of seconds. As you analyze the market, you need to have a neutral mind set understanding that price can go either way and as structures develope, you may need to change your bias and take a step back to look at the price action in a different view. If you approach the market in a neutral mind set, you are not "marrying" your set up and this helps reduce your emotions and builds your psychology.
2. Risk Management:
Risk Management is the holy grail in trading. If you cannot control how much you risk, you are simply gambling. Losses are inevidable in trading and you need to understand you will always endure them, but keeping the risk at minimal (1%) will sustain your capital to be able to continue trading. Keeping the same risk on each and every trade and maximizing your reward ratio will help you compound your profits and eventually your losses will be outweighed by your rewards.
3. If you missed the first entry, there will ALWAYS be another one:
Often traders will try and chase a massive drop HOPING that price will push down further when in fact could catch you with your pants down. Understand that there will ALWAYS be another entry that may fit your trading plan. If you missed the first one and start chasing volatility rather then sitting on your hands waiting for another confrmation, your judgement gets clouded which will the create revenge trading, greed, FOMO and capital loss.
4. Take what the market gives you; leave your EGO at the door:
Any experienced trader will tell you to check your EGO. Just because you THINK the price will go to your target, it doesn't mean that it will. Price does not need to reach your target for you to be profitable, taking your profits as the market gives you will make you profitable. As the market moves and creates structures, at times it may not be ready to continue to rise or drop and that is why you need to manage your trades accordingly and adjust your mindset to acheive this in order to avoid uncessary losses.
5. Have a Trading Plan & Follow your Trading Plan:
Having a Trading Plan is key in order to know when to get in or out of the market. If you are unable to identify your profit targets/stop levels, entries, exits etc. you are doomed to fail. Following a plan will help with consistency along with many other areas towards the road of success. Implementing a plan is just one area which will help gain confidence in this business, its what that plan entales which will help you succeed in this business.
Every trader that has they're own trading style, plan, management and mind set and there is NO right or wrong in trading as long as you are following your plan and your decision meets your criteria.
I encourage every trader to review your plan and make necessary changes as your journey continues to achieve greater results.
Leave a comment and and share your thoughts around this topic :)
Click the like button if this has helped you! Support more of these to help our community!
Enjoy your weekend!

The Simple Thing That Tells You Not To Trend TradeI am a firm believer that when I’m stopped out of a trade it’s for 2 reasons.
Reason 1: a deeper pullback has occurred. This does not mean the trend has changed. Price just pulled back a bit more than expected.
Reason 2: a reversal has occurred. At this point I’m stopped out of the trade and the direction I was once trading in reverses.
In this GBPJPY 1 hour timeframe a reversal. I’ve been the buyer up tip this point. Now that a 1 hour
Lower low has been formed I’ll stop being the buyer. A lower low represents the sellers pushing price past the last higher price buyers(Japan) were willing to buy the base currency which in this case was the Pound.
As a trend trader my goal is to trade with the trend per the timeframe I’m analyzing. So, the buy is invalidate Ted until price begins to trend again. So, I wait for a pullback and evidence price can stay below the higher high and fall again. If it can I begin selling.
If price passes the higher high the lower low will have been a false breakout and I am the buyer again.
Just a simple understanding of when it’s time to not trend trade. Any questions?

Trading Strategy? Strategies?In finance, a trading strategy is a fixed plan that is designed to achieve a profitable return by going long or short in markets.
The main reasons that a properly researched trading strategy helps are its verifiability, quantifiability, consistency, and objectivity.
For every trading strategy one needs to define assets to trade, entry/exit points and money management rules. Bad money management can make a potentially profitable strategy unprofitable.
The term trading strategy can in brief be used by any fixed plan of trading a financial instrument, but the general use of the term is within computer assisted trading, where a trading strategy is implemented as computer program for automated trading.
The trading strategy is developed by the following methods:
Trading Plan Creation; by creating a detailed and defined set of rules that guide the trader into and through the trading process with entry and exit techniques clearly outlined and risk/reward parameters established from the outset.
Automated trading; by programming or by visual development.
A trading strategy can be executed by a trader (Discretionary Trading) or automated (Automated Trading). Discretionary Trading requires a great deal of skill and discipline. It is tempting for the trader to deviate from the strategy, which usually reduces its performance.
An automated trading strategy wraps trading formulas into automated order and execution systems. Advanced computer modeling techniques, combined with electronic access to world market data and information, enable traders using a trading strategy to have a unique market vantage point.
A trading strategy can automate all or part of your investment portfolio. Trading models can be adjusted for either conservative or aggressive trading styles.
///
According to the No Free Lunch Theorem that states that any two optimization algorithms perform equally well when their performance is averaged across all possible problems.
Because of the close relationship between optimization, search, and machine learning, it also implies that there is no single best machine learning algorithm for predictive modeling problems such as Classification and Regression.
Mathematical optimization or mathematical programming is the selection of a best element, with regard to some criterion, from some set of available alternatives.
In the simplest case, an optimization problem consists of maximizing or minimizing a real function by choosing input values from within an allowed set.
Adding more than one objective to an optimization problem adds complexity. When two objectives conflict, a trade-off is created.
There may be one lightest design, one stiffest design, and an infinite number of designs that fall somewhere in-between.
A design is judged to be optimal or efficient if it is not dominated by any other design.
The different solutions to determine the "favourite solution" is delegated to the decision maker.
In other words, defining the problem as multi-objective optimization signals that some information is missing: desirable objectives are given but combinations of them are not rated relative or necessarily related to each other*
///
Bias-Variance trade-off
The bias-variance trade-off is a central problem. Ideally one wants to choose a model that both accurately captures the regularities in the data, but also generalizes well to unseen data.
Unfortunately, it is typically impossible to do both simultaneously.
Overall, while the idea that the signal can logically be a function of relevant factors, the market being highly complicated, always changing, and not entirely efficient, a function derived from past data cannot reliably be used to predict future data for an extended period of time.
Due to the ever-changing dynamics of markets, what works one week/month is not guaranteed to work the next week/month. The significance of features is expected to change regularly and the common indicators often used by the majority of traders result in such predictions not giving much of an edge.
///
Algorithms are typically programmed with clear rules and are best at pursuing a single mathematical objective whilst humans often want multiple incompatible things.
When you start to deal with multiple, often competing, objectives a satisfactory mathematical solution doesn't always exist.
I believe that a trading edge exists when combining rule based algorithms and the ability of human decision-making to be some-what dynamic and adaptable to markets as a strict rules based hands off automated trading system is going to have ups and downs, the same way a discretionary trader will, however having the ability to turn on/off a trading system for example when fundamental mid/high impact data/news are released can gain/save you that extra couple of % in losses/profits.
Being dynamic in the markets and having the ability to switch on/off/between trading strategies at any given point can be an edge in itself imho.
I believe it boils down to understanding market environments and understanding that 'strategy A' will perform better than 'strategy B' under certain environments, can help you define R:R ratios, whether your looking at a potential intraday setup or a swing trade and how your going to manage your trade after it has moved in your desired direction.
OANDA:EURUSD
👍
Learning from the Feynman TechniqueRichard Feynman(1918-1988), an author, graphic novel hero, intellectual, philosopher, physicist, and No Ordinary Genius is considered to be one of the most important physicists of all time.
He pioneered an entire field: quantum electrodynamics (QED)
In the 1940s, his invention of the Feynman Diagram helped bring much-needed visual clarification to the enigmatic behaviour of subatomic particles
His work has directly influenced the fields of nanotechnology, quantum computing, and particle physics
In addition to his ground-breaking research, Feynman was brilliant, eloquent, and an exquisitely passionate thinker.
Bill Gates was so inspired by his pedagogy that he called Feynman, "the greatest teacher I never had."
Feynman's lectures, many of which were delivered during his time at California Institute of Technology, were aimed at students who had no previous knowledge of particle physics or deep science. Taking the mystery out of complex scientific principles was Feynman's forte. His lectures were underscored by a conviction and passion for science.
The unpredictable movements of atomic particles later defined his life's work. When he wasn't in the throes of researching particle physics, he spent time dabbling in the arts, sketching and playing the bongo!
///
The Feynman Technique
The Feynman Technique is a method of learning that unleashes your potential and forces you to develop a deep understanding.
Have you ever had a co-worker or teacher explain something with language that was difficult to understand?
The Feynman Technique for teaching and communication is a mental model (a breakdown of his personal thought process) to convey information using concise thoughts and simple language. This technique is derived from Feynman's studying methods. Feynman understood the difference between understanding something and knowing the name of something. He was never content with just knowing the name of something rather he wanted to understand it at a deeper level.
Feynman started to record and connect the things he did know with those he did not. In the end, Feynman had a comprehensive notebook of subjects that had been disassembled, translated, and recorded.
He tried to find the essential kernels of each subjects
You can use this model to quickly learn new concepts, shore up knowledge gaps you have (targeted learning), recall ideas you don't want to forget, or to study more efficiently.
Taking the concept further
Feynman's technique is also useful to those who find writing a challenge. "In order to talk to each other, we have to have words, and that's all right. It's a good idea to try to see the difference, and it's a good idea to know when we are teaching the tools of science, such as words, and when we are teaching science itself." Feynman
Feynman's cartoonish diagrams of highly scientific principles, for example, he could tap into ideas with shapes, squiggly lines, and drawings. It eliminated away clunky language and allowed the power of verbal storytelling to take root as you can imagine explaining the essentials of particle physics is a extremely difficult subject in itself.
Feynman's illustrations and visual equations rather than verbal explanations at the time (the squiggly lines, diagrams, arrows, and the cartoonish figures)
are now part-package of visual storytelling that students, scientists, and readers will see when they learn about this field of science.
There are four key steps to the Feynman Technique:
1.Choose a concept you want to learn about
2.Explain it to a 12 year old
3.Reflect, Refine, and Simplify
4.Organize and Review
Essentially, the Feynman Technique is this:
1.Identify the subject
Write down everything you know about the topic. Each time you run into new sources of information, add them to the notes
Take out a blank sheet of paper. Write out everything you know about the subject you want to understand as if you were teaching it to a child.
As you learn more about the topic, add it to your notes. Trick* People find it helpful to use a different colour so you can see your learning growth/progress
Get organized!
2.Teach it to a child
Now that you think you understand a topic reasonably well, explain it to a 12-year-old. If you can explain a concept to a child, you're way ahead of the game.
Start with a blank note and write the topic or subject you want to teach. Then, below that topic, write everything you know about it.
The trick is to write plainly and simply - so that a child can understand what your talking about
Use your sheet, sheets/notebook as a reference
Children don't understand jargon or a lexicon of dense vocabulary so speaking in plain terms is a must
* When we speak without jargon, it frees us from hiding behind knowledge we don't have. Big words and fluffy "business talk" cripples us from getting to the point, getting a point across and/or passing knowledge to others
"Anyone can make a subject complicated but only someone who understands can make it simple."
Now this part goes without saying or bringing a 12 year old into the equation but when forced to write out an idea from start to finish in simple language, you actually discover where you struggle, where you get frustrated and where you don't really understand as well as you thought. Only by identifying gaps in your knowledge can you fill them.
3. Identify your knowledge gaps
This is the point where the real learning happens.
Highlighting subject, sub-subjects and other inter-linked gaps will help you collect and organize your notes into more cohesive structured _______
Now you can call upon your source material (lecture notes, ideas, etc.) when you run into questions about how much you do know about your topic you can go back to the source material and review the parts you don't quite understand yet.
Reflect, Refine and Simplify
If you don't know something, hit the books. Go back to the source material and draw upon the information that will help you fill the cracks.
Repeat until you have a simple explanation.
Simple is beautiful :)
4. Organize and Review
Piece together your notes using concise explanations. Bring the most vital pieces about the topic together.
To test your understanding in the real world, run it by someone else. What questions did they ask? What parts did they get confused about?
Making things stick forever
As Feynman illustrates in his mental model, learning can be a lifelong pursuit. This technique is designed to help you study for exams and learn new subjects, but it can be easily adapted to pursue deep work.
Dedicating a notebook to a place where your knowledge can grow, evolve your ideas and provide inspiration to continue following a path of ongoing learning critical to the fundamentals of deeper, meaningful work.
The Feynman Technique is the foundation of our 'blank sheet' approach to supercharging your reading and retention.
The next time you stare at an empty notebook page, think about turning that page into an opportunity.
Armed with the Feynman technique anything is possible.
OANDA:EURUSD
👍
Market Tutorial: Varying Degrees Investigated with ArcsHello! Well wishes to you!
In this tutorial is seen varying arcs with more - or less - eccentricity. In practical trading terms, the eccentricity would be how much time the arc covers compared to how much price it covers.
An arc covering one days worth of time for a set amount of price would have more eccentricity - making it more oval shaped - than an arc covering an hour worth of time for that same amount of price.
In viewing charts, it can be seen that varying degrees of impulse and corrective waves arise. One way in which these waves can be viewed is by the use of arcs.
First, identity the degree of impulse that is desired. Use the steepest geometric angle - typically the 8x1 - to align the axis of the impulse with. Now, use the newly generated 1x1 impulse as the axis of the arc.
Next and finally, repeat this procedure for any degree of impulse desired.

Market Structure: Speed and Slope on Multiple TimeframesHey! Hope you are well!
In this selection, there is a showing of the use of angles to measure the passage of time and price.
In the first chart, the 30 minute chart, there is 40 units of time, and 40 units of price. The angle that is correspondent with this ratio spans to the end of the enclosed trend.
In the next chart, the four minute chart, there is 40 units of time and 40 units of price. The angle that corresponds to this ratio spans only to the end of the first trend.
However, the 8x1 angle stretches to the end of the full segment.
By these examples, the concept of speed is meant to be shown. In each corresponding timeframe, there is a speed. For the daily chart, the speed is one day. On the five minute chart, the speed is five minutes, so in making forecasts, predictions, trendlines, and others, consider the speed.
Suggested Reading:
Law of Vibration - Tony Plummer
Michael Jenkins - Geometry of Stock Market Profits, Chart Reading for Professional Traders, Complete Stock Market Forecasting Course
Scott M. Carney - The Harmonic Trader, Harmonic Trading Volume I, Harmonic Trading Volume II, Harmonic Trading Volume III
H.M. Gartley - Profits in the Stock Market
Bill Williams - Trading Chaos, New Trading Dimensions, Trading Chaos 2nd Edition
J.M. Hurst - The Profit Magic of Stock Transaction Timing, Cyclic Analysis: A Dynamic Approach
Fabio Oreste - Quantum Trading
Michael Jardine - New Frontiers in Fibonacci Trading
The Wave Principle, Nature's Law
Ralph Nelson Elliot
Technical Analysis of the Financial Markets
John J. Murphy
A Complete Guide to Volume Price Analysis
Anna Coulling
Mastering The Elliot Wave
Glenn Neely

AUDNZD Trade ReviewHey guys,
As I sat down this morning to do my trade review from yesterday, I figured why not do it on video for you guys to watch and see.
This is a good opportunity to have a look at my initial analysis, how I managed the trade through-out the day and how we finished up.
If you don't already do trade reviews I highly recommend you do, as it can be a great way to familiarise yourself with the emotions you feel through-out your trades.
If you enjoyed the content leave a like, if the feedback is good I will continue to make these!

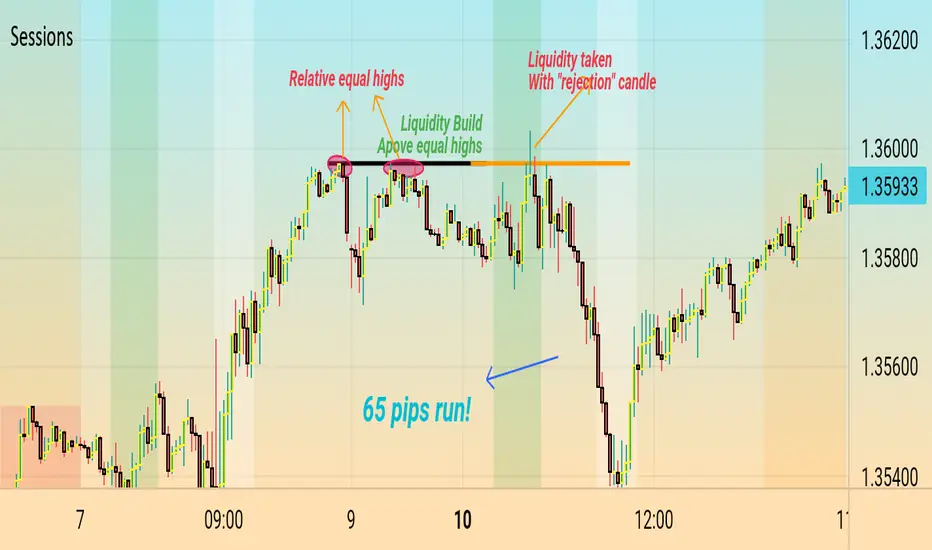
Only Strategy You Ever Need! .. Liquidity Build&SweepHello everyone!
Liquidity is the main force that moves all markets, understand it well, and everything becomes clearer...
Liquidity, simply, is "where orders are resting". Sometimes it is clear, other times not. So you have to look really well into where we have relative equal highs (sell-side) or lows (buy-side).Does that mean to jump into buying below relative equal lows/selling above relative equal highs right away? Of course no. As explained above, most of the time we have an indication as to whether the Market is responding as it shouldmd or not. Like a rejection or multiple rejections or a candle pattern or whatever.. you should see and indiction in price action, not indicators. Also pay attention to time frames. Equal highs/lows should not be treated the same way in small and big time frames... At least 15-min timeframe is recommended...
Your comments are highly appreciated...
Please don't forget to ▶️ FOLLOW & ▶️LIKE if you found my tutorial a help to you... Great content is to come yet.. hopefully..
Thanks Guys!
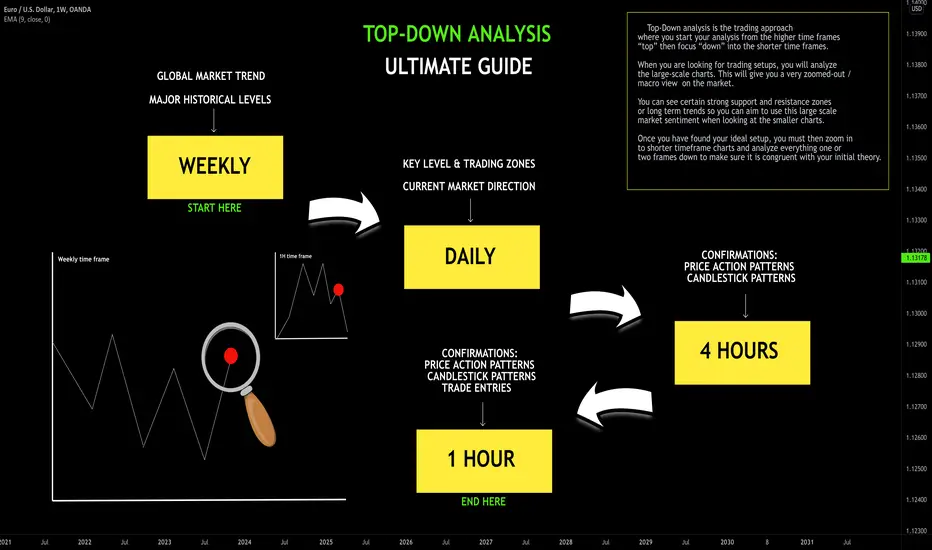
Learn Top-Down Analysis | The Best Trading Strategy 🏆
Hey traders,
🔝Top-Down analysis is one of the most efficient ways to analyze & trade different financial markets. In this post, we will discuss the time frames to watch and the main steps to go through to execute a Top-Down trading strategy properly.
Being a Top-Down trader your task is to assess the global market perspective and identify the zones, the areas from where it will be relatively safe for you to trade it following the trend or catching the reversals.
➖Weekly time frame shows you the price action during the last couple of years. It unveils the major zones of supply and demand and indicates the long-term direction of the market.
Your task is to spot these zones and underline them.
The strongest market moves most of the time initiate from these zones.
At the same time, you must remember that on a weekly time frame the market is extremely slow. Being beyond the key zones 90% of the time, it takes many weeks, even months for the market to reach them.
➖Once you completed a weekly time frame analysis,
the next on your radar is a daily time frame.
Daily time frame shows you 1-year-long price action.
It indicates a mid-term sentiment.
And again, here your task is to simply identify the market trend and underline major key levels.
*It is highly recommendable to apply different colors for highlighting weekly/daily levels.
Completing weekly/daily time frame analysis, your task is to set the alerts on at least two closest support/resistance clusters. You must patiently wait for the moment when the price reaches one of them.
Once the underlined key level is reached, you start the analysis of intraday time frames.
➖The intraday time frames on focus are 4H/1H.
Your task here is to spot the price action/candlestick patterns.
With such formations, the market unveils its reaction to the key level that it is approaching.
You are looking for a pattern that confirms the strength of the level.
Spotting the pattern you are looking for a trigger to open a trading position. Most of the time it is a breakout of a trend line or a horizontal neckline.
The breakout confirms the willingness of buyers/sellers to buy/sell from the underlined support/resistance. Only then a trading position is opened.
Of course, in practice, Top-Down analysis is very complex and many things and concepts must be learned in order to apply that strategy properly. Follow the steps described in this post, learn to identify key levels and recognize the price action patterns and you will see how efficient this strategy is.
Do you apply a Top-Down trading strategy?
❤️Please, support this idea with like and comment!❤️
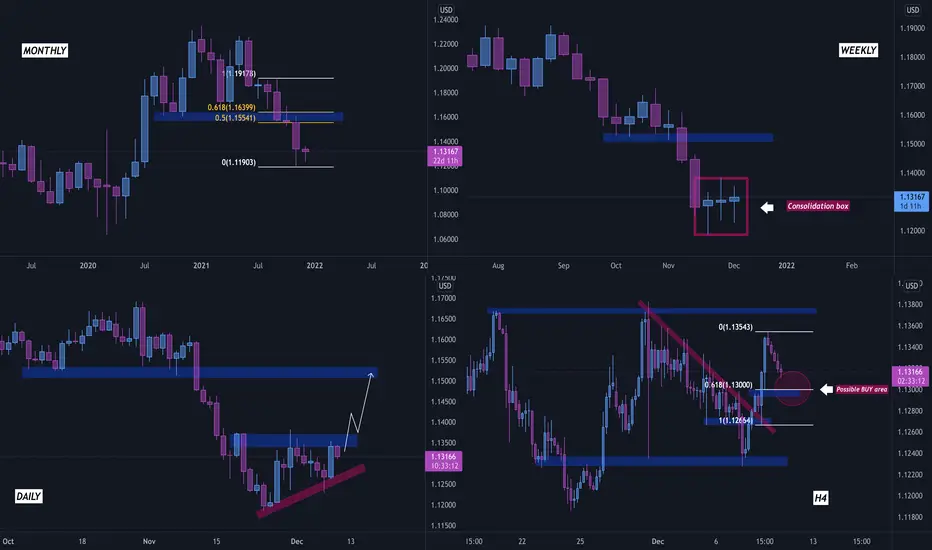
THE ART OF MULTI-TIMEFRAME ANALYSIS AND MULTIPLE CONFLUENCESHey, wizards, hope you are all having a great week so far! We would like to welcome all of you on another educational post, the topic of which is Multi-Timeframe analysis and multiple confluneces involved.
As it can be inferred, the Monthly and Weekly timeframes are used to determine the direction of the market, the Daily timeframe is used to identify key areas and important zones, and finally, the 4-hourly timeframe is utilized for entering trades. Now, let’s dig deeper into it and analyze the situation that we have on EUR/USD.
MONTHLY: Observing the weekly timeframe graph, we can say that the price has been printing bearish candles for a few consecutive weeks. As one of the main trading principles says, after a strong impulsive move, a correction is needed. We can witness some bearish weakening signs and therefore we are looking for a short-term long position. Our possible target would be set at a previous level of support turned resistance, which aligns with the golden Fibonacci zone.
WEEKLY: Leveling down to the weekly timeframe chart, we can see that the price is consolidating, as it is unable to push lower. Technically, after long lasting consolidations, it is believed that the price will either fly like a rocket or drop like a needle. This gives us another confluence and backs up our plan.
DAILY: Moving down to the daily timeframe graphic, we can notice that the previous candle was super bullish and some kind of an ascending triangle is being formed. If the price breaks and retests the upper boundary of the formed triangle, we can see some nice bullish moves.
4H: Last but not least, the 4-hourly timeframe a.k.a. the timeframe of entries. After a massive bullish push to the upside yesterday, the price has started correcting before further bullish moves happen. Here, we are using two entry confluences: the area of previously broken structure that nicely aligns with the 61.8% fibonacci retracement level. Before entering the trade, we will carefully monitor the price action and wait for the price to bounce off the local zone.
We are hoping that this educational post will be of value for you and we are wishing you all a great day!
Regards,
Investroy Team
How To Trade High and Low Volatile Currency PairsTrading volatile pairs is like knowing what's in season and not in season. Whats hot and not hot. Who is in and who is out.
In this video, I am going to show you what high and low volatile pairs look like and trade examples.

When Not To Trade A Currency PairDo you know what it looks like when you don't have a trade? Let's face it, there are a lot of videos that tells you when to place a trade or how to trade, but not when not to trade and that is what I'm showing you in detail today.
I hope you enjoy my mini Ted Talk, I mean mini lesson.

Diversify your strategyThe holy grail of diversification is to find several uncorrelated asset classes all with positive returns. One problem, though, is that diversified passive investing has caused all asset classes to become more and more correlated over time. Increasingly, you see stocks, bonds, commodities, and cryptocurrencies all move together.
One approach to diversification that's increasingly popular with quants is to diversify your strategies rather than your asset classes . Long-short strategies are a popular example. Almost by definition, your short strategies will make money when your long strategies lose money, and vice versa. The challenge of making this work is that it's really hard to design short strategies with positive expected return. Since the market tends to go up over time, playing the market short is a bit like betting against the house at a casino. If you find a short strategy that actually works, that's gold right there.
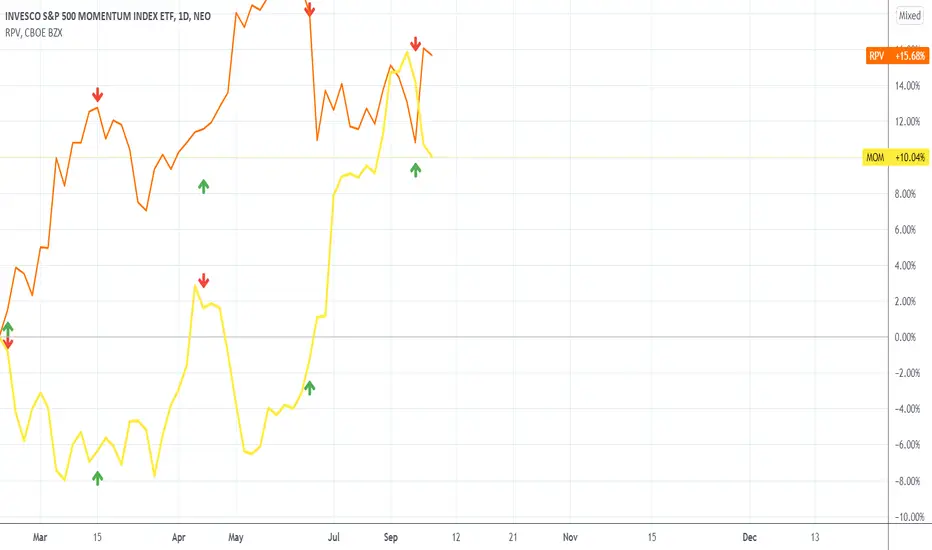
Fortunately, there are some relatively uncorrelated strategies that work for long-only traders. This chart shows the Invesco "Momentum" and "Pure Value" ETFs. As you can see from the red and green arrows, the two ETFs often move in opposite directions. When one is producing positive returns, the other often isn't. Owning both can help smooth out your drawdowns and returns.
The same can be said for "mean-reversion" and "trend-following" strategies. Mean-reversion strategies involve buying assets that have made a big move downward. If you bought China stocks after their recent huge-selloff, that was a mean-reversion trade. Trend-following strategies, by contrast, involve buying assets that have made a big move upward. If you've bought oil and gas stocks in recent weeks, that was a trend-following trade. Both strategies tend to "work," but again, they're somewhat uncorrelated.
These strategies can further be broken down into short-term and long-term versions. Oil and gas is in a short-term uptrend, while the Nasdaq index is in a long-term uptrend. Facebook and Bristol-Myers Squibb are a short-term mean-reversion candidates after their recent sell-offs, while Calavo Growers and Regis Corporation are long-term mean-reversion candidates. The nice thing about using a mixture of short-term and long-term signals is that they allow you both to profit from stable market conditions and to quickly pivot at least some of your capital when market conditions change.
Trading Basics | Your Main Trading Time Frame ⏳
Hey traders,
You frequently ask me what is the most important time frame to analyze and follow.
And even though I must admit that multiple time frames must be taken into consideration for successful trading like weekly/daily/4h/1h. Among them, there is the one that is universally considered to be principal. That is a daily time frame.
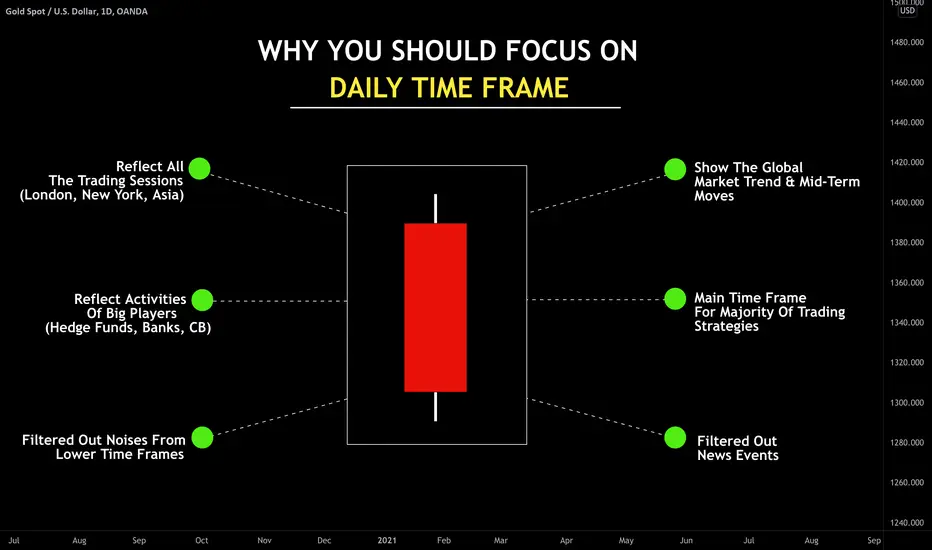
There are a lot of reasons why so many traders rely on a daily time frame:
1️⃣ - Daily time frame shows a global market trend at the same time reflecting a mid-term and short-term perspective letting the trader catch trend following moves and spot early reversal signs.
2️⃣ - Covering multiple perspectives, daily time frame is the foundation of the majority of the trading strategies being the main source of key levels & pattern analysis.
3️⃣ - Daily time filters out news events that happened during the trading day. It shows the composite reaction of the market participants to all the data posted in the economic calendar.
4️⃣ - Daily time frame reflects all trading sessions. Within one single candle, we see the outcome of the Asian, London, and New York Sessions.
5️⃣ - Daily candle filters out all the noise from lower time frames & intraday price fluctuations and sudden spikes & rejections.
6️⃣ - Covering all the trading sessions, daily time frame mirrors the activities of big players like hedge funds and banks. Showing us the flow & direction of big money.
⚠️Being so important for analysis, do not neglect other time frames.
The most accurate trading decision can be made only relying on a combination of intraday and daily time frames.
What is your favorite time frame to trade?
❤️Please, support this idea with like and comment!❤️
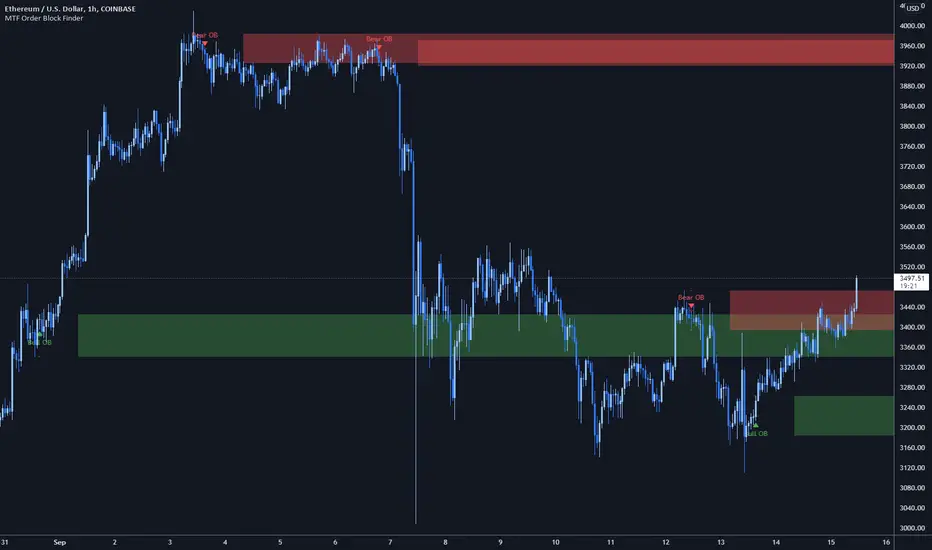
New Upgrade to [MTF Order Block Finder]Thank you all for the support on my most recent indicator - MTF Order Block Finder
I'm happy to announce a new update with new default settings, added features requested by traders, and a new setting to make MTF Order Block analysis significantly less frustrating!
Check out the indicator page for more details if you've never used the tool :)
Release Notes: Settings changes, feature requests, and upgrades!
1. New default values for settings
- Min. Percent move for valid OB (0.25% -> 0.3%)
- Max Bullish Zones to show (2 -> 4)
- Max Bearish Zones to show (2 -> 4)
- Ignore Dojis at Start (disabled -> enabled)
2. Requested Features
- Bullish/Bearish Zone color - set your own color and transparency instead of choosing from presets
- Line Widths for High/Low and Avg- set your own line width when using the LINE drawing style
3. Upgrades
Order Block Draw Distance
Often times when using an Intraday chart and drawing MTF Order Blocks, you'll see
your candles shrink and compress - this can be very annoying, especially on TradingView mobile.
TradingView automatically resizes the chart to keep ALL drawings within view and unfortunately,
there are no chart settings to "ignore" drawings that aren't relevant to current price.
Now you can set a Draw Distance by percent (%) change to hide Order Blocks that are
very distant from current price.
Using this setting has several benefits:
- MTF Order Block zones plot much faster (less objects for TV to draw)
- Allows you to have many Order Blocks (more than the default of 4) and only show most relevant
- Overall less frustration! No need to take your chart off "Auto" and resize it manually
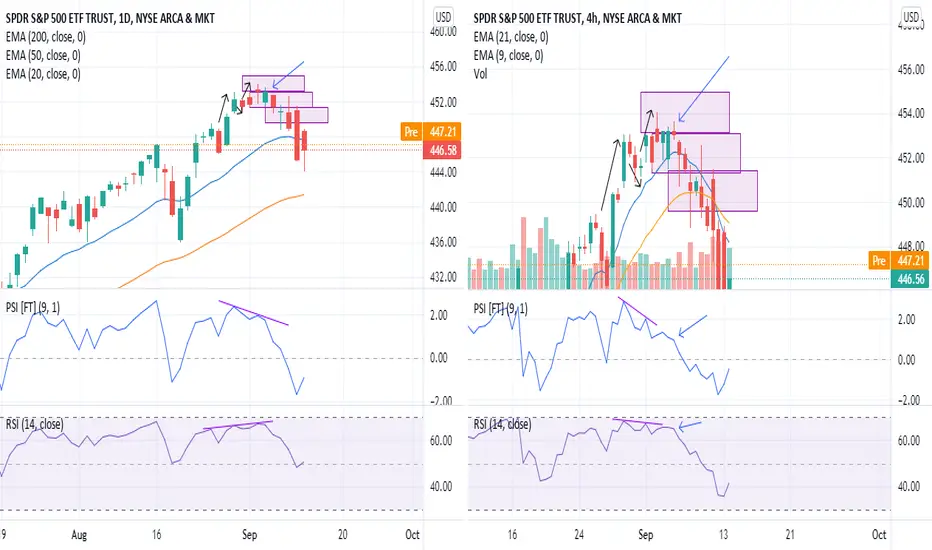
Example of Shorting SPY w PSI and comparison w RSIThis is an example of Shorting SPY at the High and a comparison of RSI and Price Strength Index (PSI).
AMEX:SPY made a great upside move towards 450 and then 453 on a valid strong move after a bounce of higher Low.
Then, it made a pullback to 450 and made a retest of 453 to go higher.
Price action w PSI analysis
On 4H chart, at the second test of 453, buyer is significantly weaker because it did not even break or test previous High of the PSI 4H. PSI 4H had already shown obvious divergence even before the retest of 453, and when it retest 453 and failed, this give confidence to Short.
Now on Daily, at the second test to 453, PSI shows that the move is not even strong at all. It actually made a lower High on PSI, now confirms the divergence shown on lower time frame 4h. This gives another confidence boost to Short.
With these confluence, this gives a good confidence to Short.
Price action w RSI analysis
On 4H chart, the RSI 4H appears to look good for a push to break that 453 and go into overbought level. Even at the retest of 453, while price action shows that rejection (Red Topping Tail candle), RSI however still looks somewhat okay because it still holding on above 60 and near to previous Low.
On the Daily, RSI is showing that it is still in the direction of the trend to push higher.
To conclude, this is not looking clear, there is a difference of information on 4H and Daily. While RSI on 4H does indeed shows some weakness, RSI on Daily still going strong on uptrend. This does not gives confidence to Short.
PSI vs RSI
While both are useful, PSI do appear to have better clarity of strength/momentum in comparison to RSI.
DISCLAIMER: Nothing in this content should be interpreted as financial advice or a recommendation to buy or sell any sort of security, investment, currencies or assets. This is for educational purposes only.
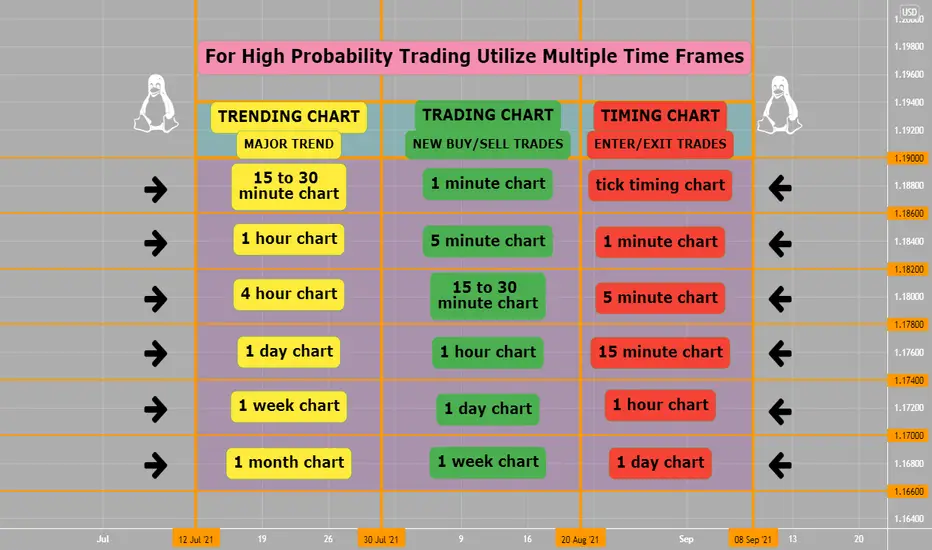
Use Multiple Time Frames For Success Once you have analysed each Trend and Trade time frames, you can put them all together to confirm a high-probability trading set up.
1)TREND CHART- The trend chart, as the name suggests, helps you identify the predominant trend you should be looking to trade with. If the currency pair in the trend chart is trending upward, you should be looking to buy the currency pair ONLY . If the currency pair in the trend chart is trending downward, you should be looking to sell the currency pair ONLY.Once you have identified the time frame you should be using for trend chart, all you need to do is determine what the prevailing trend on the chart is. You can use diagonal support and resistance levels or moving averages to identify the trend.
Once you have identified the trend, you now need to identify profitable trading (TIMING) signals.
2) (TIMING) SIGNAL CHART- The (timing) signal chart is your most important chart. It provides the trading signals that tell you when to look for buying and selling opportunities based on the trading methodology you use. You might use the following to pinpoint your entry and exit or timing signals. You can identify the trend and support and resistance levels. You can use the same technical indicator you use to generate your trading signals.
Using a (timing) signal chart in conjunction with a trend chart enables you to more accurately identify potentially profitable trade signals.In effect, the trend chart allows you to ignore the less-profitable half of the trading signals you see on your signal chart. Since these trading signals are going against the longer-term trend, they will most likely be unsuccessful. You need to determine exactly when to enter and exit your trades using your timing chart.
3) TIMING CHART- The timing chart, as the name suggests, helps you time exactly when you should enter and exit a trade. Every pip counts when you are a Forex trader so the more accurately you can identify your entry and exit points, the more money you keep in your account.
In Forex trading you should at least minimum utilize three time frames in your plan, edge and strategy. This will make trading a lot easier.