How to Take Advantage of Both Market Directions?Today we will talk about a very common situation that occurs in the vast majority of traders (if not all), especially when we have just started to get into this bussiness.
There is a consistent struggle between convictions, ego, and market views or analysis. This generates that we try to see in our analysis what we want to happen, or what we need to happen, and ultimately this the only thing that generates are psychological issues on the trader.
The best way to remain calm and be able to trade in a cold and consistent way is to plan in advance all the situations that may occur in the scenario we are analyzing, and how we would act in front of them. In this way, we do not allow ambiguities and we will only take positions if what we are waiting for happens. And, covering both directions, we will not feel that we are missing something if the movement is the opposite of what we expect (as it would happen in case of analyzing only in one direction).
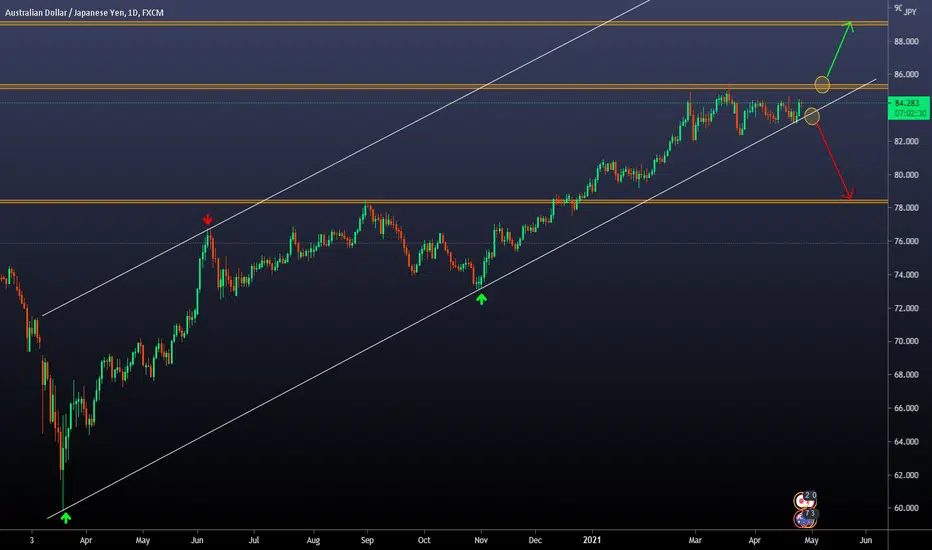
In this case we will analyze AUD/JPY to show you how we carry out this analysis:
🔸First, we are going to detail our vision of the daily graph that is the one shown in the publication.
🔸As we can see, the price is in a clear uptrend, and when faced with the Resistance zone it began to consolidate for several weeks.
🔸From there, we didn't see a clear direction. When we detect that there is no type of trend or clear behavior, we stay out of the market and wait for an opportunity to happen where we can establish a clear horizon.
🔸What we propose to trade this pair is that there is a brekaout. It can be in a bullish or bearish direction. In case of being bullish, it must be from the Resistance zone and in case it is bearish it must be from the trend line.
🔸We are going to decrease the timeframe to show exactly what we expect:
🔸In this image we see the 4H chart.
🔸Basically what we detail is that we expect a break and then a retest / corrective structure. This is because it is a security add-on to avoid potential fakeouts (the trade can fail anyway, of course).
🔸Once we see the retest, we will have a new swing or structure to be able to position our entry and stop loss safely, with a favorable risk-benefit ratio.
🔸The targets are: Resistance zone in case of bullish breakout, and Support zone in case of bullish breakout.
Multiple Time Frame Analysis
A diffrent way to interpreter Candle Wicksin this tutorial i'll explain how to interpreter candlestick Wicks, or Shadow to get a better understanding of the price action, and market behaviour.
in this example we have a range with a lot of wick's at the bottom. A lot of you learned that wicks means rejection in the opposite side, that's right in some way.
But in this case you can interpreter it as selling pressure, first thing first look at the current situation; AUDUSD is downtrending, and the trend is you're friend,
most likely it's gonna follow up in the direction of the trend. If there are some wicks to the downside it means that seller are entering the market in that specific zone,
but even that buyers are entering at the bottom of those wicks (another specific zone). So once we get a clear breaking of the "buyers zone" we can have a clear idea where
the market is gonna go, since the buyers are out of the market and sellers are taking over buyers.
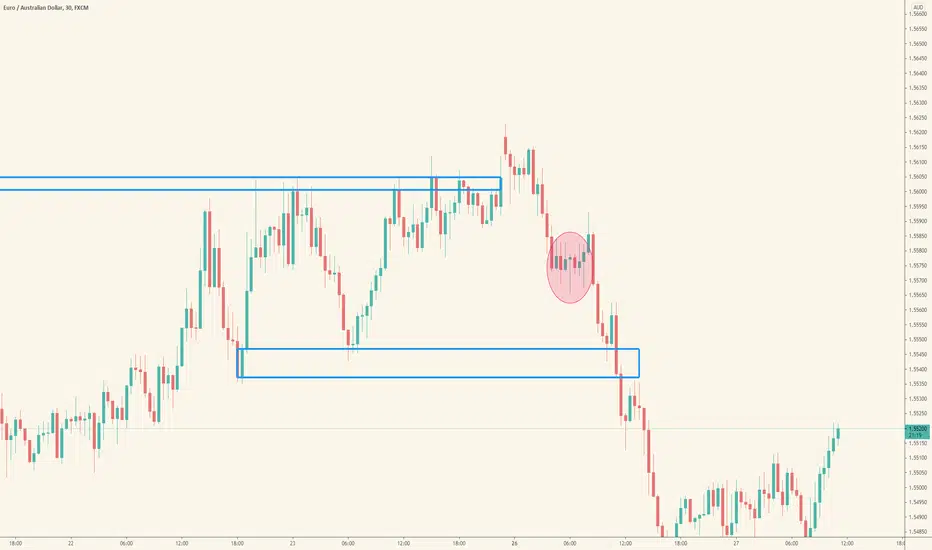
Let's take another example for a better understading of this concept
in this example we have again a clear trend, a "buyers zone" and a "sellers zone" and look what happen once we break the "buyers zone" we can clearly see a continuation
of the bearish that we had before, since in that zone both buyers and sellers entered the market, so it create indecision in the market. you can see that we have a break above
the "sellers zone" as the exaustion of the last push, then it got below the "buyers zone" breaking the previous lower low and creating a possible continuation of the
current trend, resulting in bearish momentum.
The main points of this lession are:
- wicks dosen't always mean rejection, but can indicate market sentment
- follow the trend not the rejection.
Trade safe
8 Steps To Make A Forex Trade!!8 Step To Make A Forex Trade:
1) Start the Trading Platform- The first step is opening the trading platform.
2) Open The Chart- Now choose a currency pair and open a chart. Select a time frame.
3) Add Indicators (if you want too)- or skip this step.
4) Place The Order- Now prepare to place the order.
5) Set The Stop Loss And Take Profit Levels- Now set your stop loss and take profit levels. This step is optional but highly recommended. Experienced traders have found that setting a stop loss at half the pip amount or less than your take profit level can set you up for long-term success. This is because you can be right less than half the time and still come out at the end of the week, month, year ahead if you have a favorable risk-reward. Setting the stop loss will limit your losses if the market does not move in the preferred direction. Setting the take profit level will make sure that the trade exits in profit once the market makes the downward move that is expected. It can be an advantage to set these levels when you place the trade because once the trade is actually in the market, the pressure can make it difficult to make decisions.
6) Order Confirmation- Submit order and wait for confirmation screen. Confirmation is important as is ticket number because you may need to reference the ticket number if you need to call broker about trade. Of course, you don't want anything wrong to happen with execution, but if there is a mistake in execution on part of broker you will need to go to them with confirmation and ticket number so they can correct their mistake and credit account back if necessary.
7) The Waiting Period (Waiting Not Trading Is Where You Make Or Lose Money)- Now waiting period begins. This is the more difficult concepts in Forex trading. Some traders find it helpful to turn off the screen and get away from the market once they've entered so that they are not constantly fretting over market moves. Either way, sticking to a good risk reward is a favorable approach and whether your stop or take profit order gets hit, you have done your job correctly.
8) Trade Completion- Finally, the trade is complete. Trade results can be only three, which are makes money, loses money or breaks even.
Remember in trading to do four things: Win Big, Win Small, Lose Small but Never ever Lose Big!!! Risk management on all trades is necessary.
Drawing Support and Resistance Using Multiple Time FramesHi all,
Here is a quick tutorial on how I draw support and resistance lines. A few things to keep in mind are use multiple time frames to get a more comprehensive understanding of trend and to determine which lines are more significant than others. Also, by using these lines you can set more accurate limit orders and save money by not having to pay extra fees for market orders. It is important to NOT enter long positions as we near areas of strong resistance. We should be taking profits at those levels and entering longs when approaching lines of support. Additionally, this allows you to set a tighter stop loss because if the line of support is rejected then it invalidates the idea that the asset is increasing in value. Of course, you need to use indicators and do a more comprehensive analysis but this should be a helpful tool to help you manage risk. I plan to make more of these videos laying out trend lines, dynamic lines of support and resistance, fibonacci retracements and spiderlines etc. If there is anything you want me to provide a tutorial on please leave a comment and I will get around to it as time permits.
Best,
Brad

ETHUSD Weekly Overview 3/26ETHUSD WEEKLY OVERVIEW 3/21 - 3/26
In this video I go over my personal perspective on the opportunities Ethereum presented throughout this week. There were 2 amazing entries that were presented totaling over 350+ points! The first setup averages around 250 points and the second was around 100 points. My first entry was at the 1780 key level and the second was around the 1700 whole level. The entry was also given extra confirmation based off the Fibonacci key levels. My initial targets were fibonacci extensions leading all the way towards the -618, around the 1550 price point.
There are times where price presented hundreds of points and then pulled back before continuing the overall trend. It is important to always secure some type of profits on a trade when you are significantly ahead. Never leave any money on the table or turn a winning trade into a losing trade. Even if your entry gets stopped out, continue working that zone over and over until the analysis invalidates itself. The level must prove that it is valid before having real confirmation that it may continue.
My style of trading uses Market Structure, Price Action, Fibonacci, Wave Sequences, Moving Averages , and a mixture of Multi Time Frame Confluence . Most importantly the visual realization of emotions cycled into the chart.
As always THANK YOU and if you found this video helpful, please let me know by hitting that like button and/or leaving me a comment below.
Also, feel free to share your opinion on this setup or other setups that you have. The more ideas we can generate together, the more informative these ideas become for newer traders. STAY PATIENT & STAY BLESSED!
~T$

BTCUSD Weekly Overview 3/26BTCUSD WEEKLY OVERVIEW 3/21 - 3/26
In this video I go over my personal perspective on the opportunities Bitcoin presented during this week. This week there were 2 possible entries that were presented totaling over 7500 pips! The first setup average around 5000pips and the second was around 2500pips. My initial target was my -13 extension level around 52k.
There are times where price presented several thousands of pips and then would pullback before continuing the overall trend. It is important to always secure some type of profits on a trade when you are significantly ahead. Never leave any money on the table or turn a winning trade into a losing trade. Even if your entry gets stopped out, then continue working that zone over and over until the analysis invalidates itself. The level must prove that it is valid before having real confirmation that it may continue. I ran into this same example around my first entry at 57K and then again later after the continuation of the first sequence.
Even though my first target was 52k price made a lower move into 49K! This is huge for the continuation back up higher into the 60K+ range, or even back lower into a deeper retrace. Whatever price decides to do I will remain patient and let the story unfold for me. We always REACT NOT PREDICT!!!
My style of trading uses Market Structure, Price Action, Fibonacci, Wave Sequences and Moving Averages . Most importantly the visual realization of emotions cycled in the chart.
As always THANK YOU and if you found this video helpful, please let me know by hitting that like button and/or leaving me a comment below.
Also, feel free to share your opinion on this setup or other setups that you have. The more ideas we can generate together, the more informative these ideas become for newer traders. STAY PATIENT & BE BLESSED!
~T$

Which timeframe is best? Do Sniper entries exist? Time vs priceIn this video, I discuss the different trading perspectives based on different timeframes.
We also take a look at which timeframe will give you the best entry depending on how you define your entry.
Do you define entry by price or time in trade?
Let me know if you agree in the comment section.
Do not forget to give this a thumbs up.

Trading Channel Fake-outs and Multi-Time Frame Analysis In this video I go over how to trade with channels and multi-time frame analsys for the best entries. I also show my way of trading fake outs on channels and building a logical and rational case for entering markets with confluence.

A Practical Guide to High Risk/Reward Trading in Forex. This will show my methodology and system for getting high risk to reward trading setups using whatever analysis that you choose that doesn't involve indiaotrs. Wyckoff, Smart Money Concepts, Price Action. But primarily this calls for an understanding of market structure.

Wyckoff Distribution and Sell Limit Orders = Power playsWe always want to trade against the weak hands in the market and get in at optimal entries. THis entry explains that very concept.

Backtesting retest Break of Market Structure on Multi TimeframeStrategy
Create a zone from the order block which created break of market structure on 1D timeframe
Wait for it to be tested on 4H timezone => which will create new 4H order block
Trade the retest of that 4H order block
Color coding & icon use
Green boxes : 1D order block zone
Yellow boxes : 4H order block zone
Tick icon : Trade won on 4H
Cross icon : Trade lost on 4H
Circle with cross icon : Trade in breakeven
Win / loss assumptions
Win : 3R movement without breaking -1R
Loss : -1R movement
Breakeven : 1R movement, followed by -1R movement
Risk Management
50% TP @ 1R
25% TP @ 2R
25% TP / Trade closure @ 3R
RR achieved = 3R
Net R achieved = 1.75R
Strategy results
Testing duration : Jan 2020 - Jan 2021
Wins = 16
Loss = 7
Breakeven = 4
Non-losers = 74%
Absolute Winners = 59%
Net RR = 21
Avg R/Win = 1.31R
Avg R/Trade = 0.78R

HOW you can become TOP author, get a lot of views. HOW you can become TOP author, get a lot of views.
My secrets after 3 years of working on this platform.

Supply & Demand At Work In $GMETaking a quick look at the levels that have been relevant for Gamestop $GME intraday since Friday. Super interesting take on trading and how markets behave. Not trading it, just observing it as a barometer of market risk appetite.

Trading Mean Reversion & Rangebound MarketsIn this video, I outline the characteristics of environments where I'm looking for mean reversion and rangebound trades. I define what constitutes a rangebound market and how I should trade these setups from an entry, stop, and target perspective. This is part of an effort to more clearly define my trading plan so that I only need to focus on execution during market hours.

Trading Subsequent Breakouts In Trending MarketsIn this video, I outline the characteristics of environments where I'm looking to buy subsequent breakouts for a day/swing trade. I define what constitutes a breakout and how I should trade it from an entry, stop, and target perspective. This is part of an effort to more clearly define my trading plan so that I only need to focus on execution during market hours.

Trading Subsequent Breakdowns In Trending MarketsIn this video, I outline the characteristics of environments where I'm looking to sell subsequent breakdowns for a day/swing trade. I define what constitutes a breakdown and how I should trade it from an entry, stop, and target perspective. This is part of an effort to more clearly define my trading plan so that I only need to focus on execution during market hours.

Selling Strength In Trending MarketsIn this video, I outline the characteristics of environments where I'm looking to sell strength within an already established trend for a day/swing trade. I define what constitutes strength and how I should trade it from an entry, stop, and target perspective. This is part of an effort to more clearly define my trading plan so that I only need to focus on execution during market hours.

Trading Initial Breakdowns In Trending MarketsIn this video, I outline the characteristics of environments where I'm looking to sell initial breakdowns for a day/swing trade. I define what constitutes a breakdown and how I should trade it from an entry, stop, and target perspective. This is part of an effort to more clearly define my trading plan so that I only need to focus on execution during market hours.

Buying Pullbacks In Trending MarketsIn this video, I outline the characteristics of environments where I'm looking to buy a pullback within an already established trend for a day/swing trade. I define what constitutes a pullback and how I should trade it from an entry, stop, and target perspective. This is part of an effort to more clearly define my trading plan so that I only need to focus on execution during market hours.

Trading Initial Breakouts In Trending MarketsIn this video, I outline the characteristics of environments where I'm looking to buy initial breakouts for a day/swing trade. I define what constitutes a breakout and how I should trade it from an entry, stop, and target perspective. This is part of an effort to more clearly define my trading plan so that I only need to focus on execution during market hours.

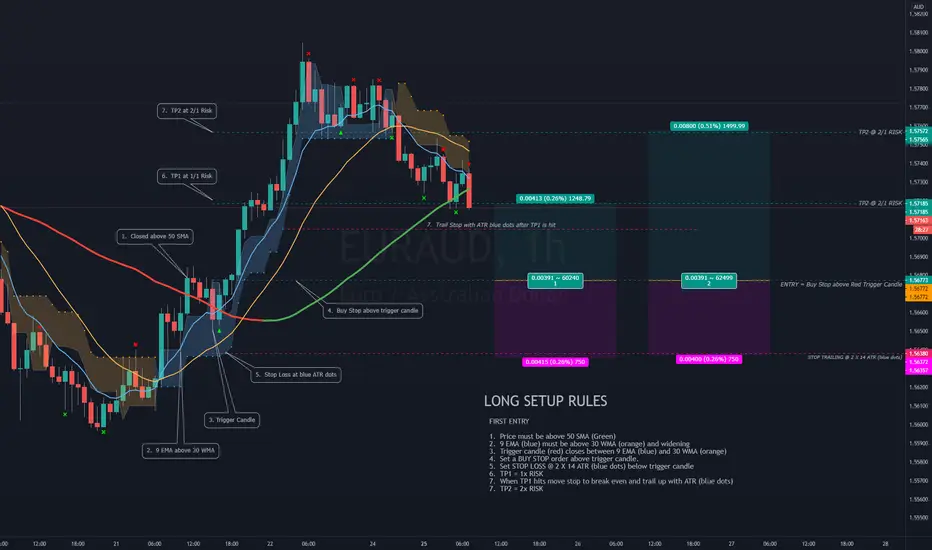
Trade Setup Rules for Long EntryRULES
1. Price must be above 50 SMA (Green)
2. 9 EMA (blue) must be above 30 WMA (orange) and widening
3. Trigger candle (red) closes between 9 EMA (blue) and 30 WMA (orange)
4. Set a BUY STOP order above trigger candle.
5. Set STOP LOSS @ 2 X 14 ATR (blue dots) below trigger candle
6. TP1 = 1x RISK
7. When TP1 hits move stop to break even and trail up with ATR (blue dots)
7. TP2 = 2x RISK
HOW-TO: Getting started with Price Finder IndicatorHello there, fellow trader!
If you are starting to use Price Finder indicator, or is just interested on knowing some of the basics, here is a brief video you may find useful.
In it I cover the overall meanings of indicator's components , how they relate and work with each other , and how to set it up to see and work with multiple time frames (multiple structures) in a single chart . This is one of the most useful and innovative features. So, make sure you check it out, and get to know it.
If you have any doubts, please let me know.
Thank you for you attention!
Best of success,
PHInkTrade

3 Market Movements- Range, Volatile, Trend.Today , I will be showing the 3 kinds of movement in the market (besides our classic up , down , sideways ) ,how to spot them, and how they tend to intervene with one another.
Range ;
When price is sitting in a range, that means it tends to be moving sideways , usually due to indecision amongst big investors.
I usually don't trade if price is moving in a range, however if you scalp you can catch huge R/R by buying at the bottom and selling at the top.
Trend :
The more safe, slow, and practical market to trade in. When price is moving in a trend, it tends to be moving *smoothly*. What I mean by this
is that while price is respecting the trend, it gradually moves to the desired location. This usually provides decent R/R with decent probability.
Fast Moving/Volatile :
This is the most dangerous market to trade if you're not experienced, knocking SL' clean out. When market is moving very volatile and fast, that's
usually due to more positions being added amongst traders. If you're not on the right side of the tug of war while these positions are being filled, you will suffer.
When price moves fast, it tends to stop fast also. TP' are harder to calculate during these times.
