Eg.2: Viewing Break of Market Structures as Broken Expectations Another example of how market structure breaks can be viewed from a perspective of broken expectations of either parties (buyers or sellers). If you were a buyer or seller, where would you be getting involved? Had you gotten involved, would your expectations have been met? If not, how violently were they broken?
Multiple Time Frame Analysis
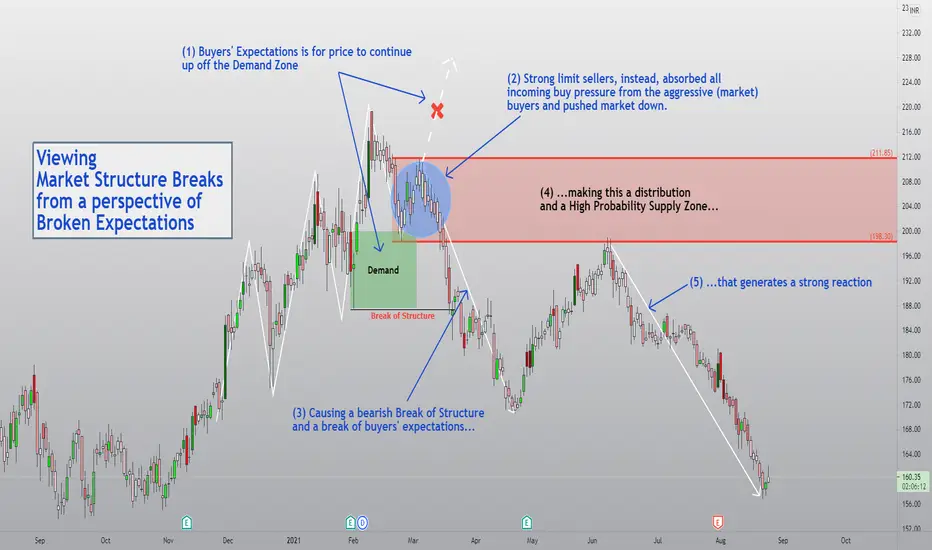
Viewing Break of Market Structures as Broken ExpectationsBreak of expectations is a perspective from which I look at market moves a lot of the time. Broken expectations manifest in the form of broken structures. It's the same thing, but just another way of looking at such moves which makes the liquidity story a bit clearer thereby inducing more confidence in taking trades off these zones. Obvious trend continuation zones, when broken, catch many a trader offside. These make for high probability trade locations (for trades in the opposite direction).

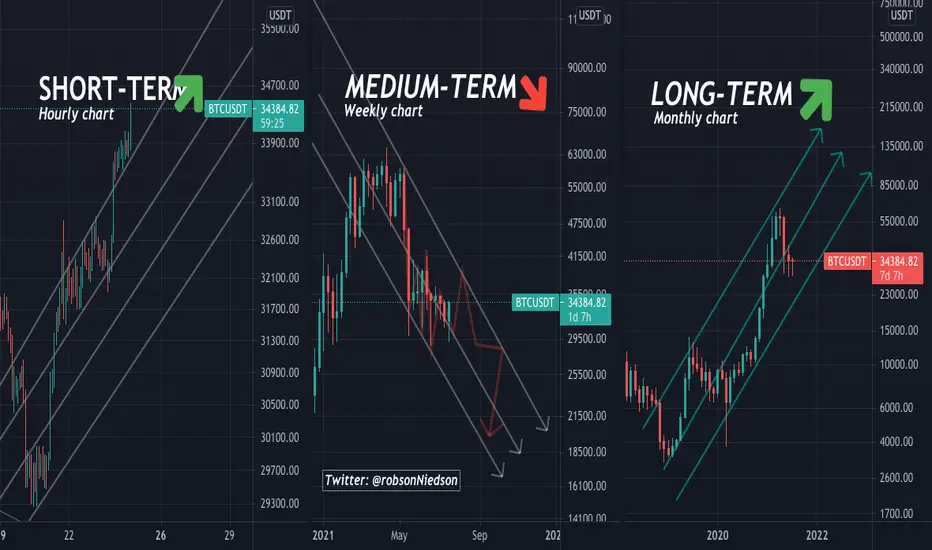
Bitcoin: Multiple time frame analysisWhat is your favorite time frame? When you finally decide on your preferred time frame, that’s when the fun begins!
SHORT-TERM (SWING)
PERSPECTIVE: "Earning assets with trades. Looking to sell near the top to buy near the bottom.".
Short-term traders use hourly time frames and hold trades for several hours to a week.
ADVANTAGE: More opportunities for trades. Less chance of losing months.
DIFFICULT: HARD - The smaller the time frame, the greater the difficulty. Study the market daily and be prepared for the worst.
MEDIUM-TERM
Mix of shorts and longs. It's my favorite.
LONG-TERM
Trades usually from a few weeks to many months, sometimes years.
PERSPECTIVE: "Buy and to forget and when it falls, buy more."
ADVANTAGE: Don’t have to watch the markets intraday.Fewer transactions mean fewer times to pay the spread. More time to think through each trade.
DIFFICULT: EASY - With cash in reserve to take advantage of opportunities, it's easy.
Characteristics of Corrective WavesThis is an educational video covering the characteristics of counter-trend price action.

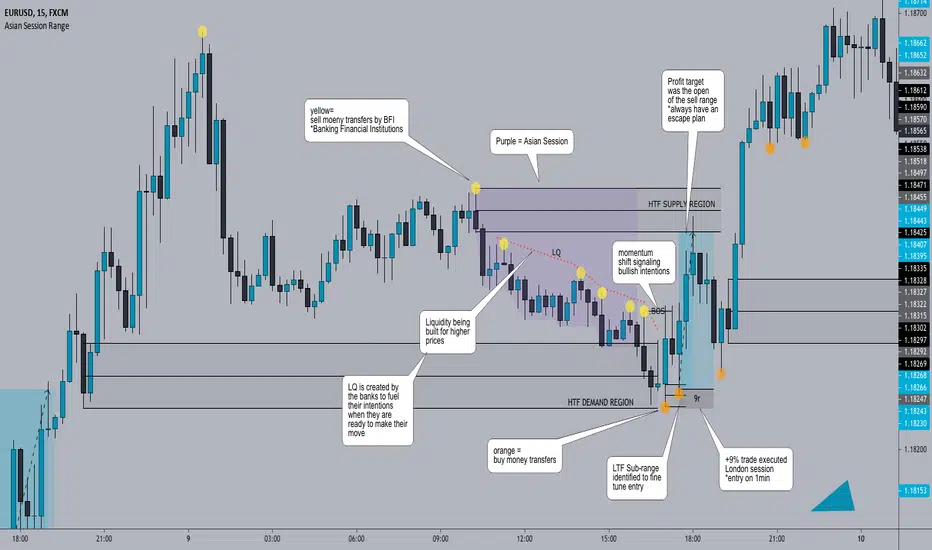
A breakdown of my EU entry showcasing how I analyse the market.I've annotated my charts for your convenience. Enjoy!
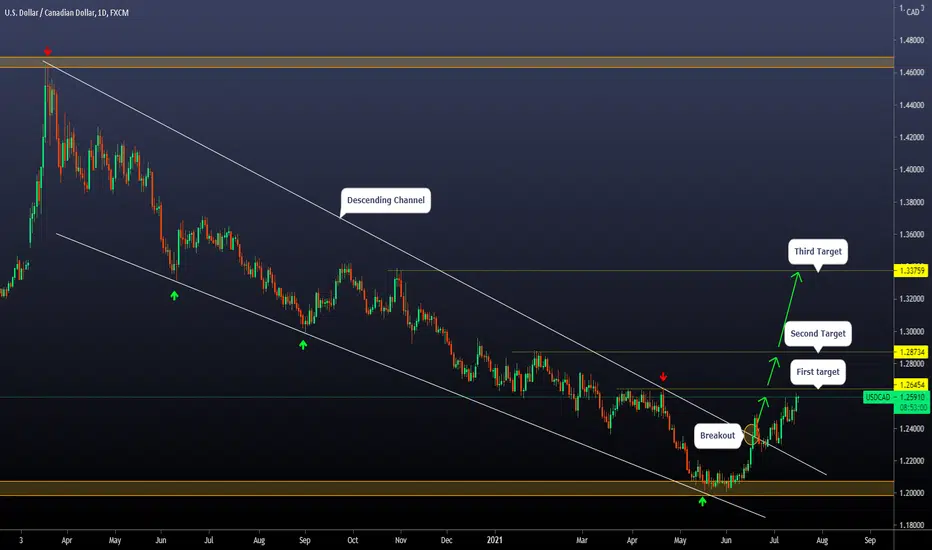
How to trade based on a Multi-Timeframe Analysis?Good morning, traders! Today we will do an explanatory post on how a Multi-Timeframe Analysis (Weekly-Daily-4H) can be used to take a trade. The benefit of this is that we will be trading taking into account the short, medium, and long-term behavior of the price, which gives us a higher success rate. Many times, we take a trade focusing only on one timeframe, and we are missing relevant information of higher temporalities, such as areas that we are not seeing.
Let's see how it would look in practice:
🔸The first thing is to start with the chart with the higher temporality, in this case, the Weekly:
- We see here that the price is in a range and bouncing in the support zone where a strong bullish momentum was previously generated. This gives us a first bullish hint.
🔸Then, in the Daily chart (published), we see that the price bounces off the previously marked zone and breaks the downtrend channel. This is the second bullish sign.
- In addition, in this chart, we proceed to mark the potential targets of the movement.
🔸Finally, in the 4H chart is where we will look for our entry into the market:
- After the break of the bearish channel, the price begins a corrective process at the edge of the trend line. When the breakout of this structure happens, the optimal thing is to place an income above the last lower high of the structure to avoid potential fakeouts.
Reasons Why I trade on Higher Timeframes OnlyOver here I explain why its necessary to stay on higher timeframes and avoid noise on the lower timeframes.
Hope you enjoy it.
Thank you

This is ALL you need to be Profitable in TradingGood morning traders! Today we will make an educational post about something that generates many doubts in many people:
That is, what are the tools that I should use to trade correctly? Do I need indicators? do I need extremely complex strategies? The answer is DEPENDS.
Why does it depend? It depends because there are many ways to see and trade the market, and just as there are thousands of traders, so there are also thousands of strategies since there are many ways to combine the different tools that we have. That said, it is worth clarifying that this post is made 100% from our experience, and the objective is not to discredit or downplay other trading methods. This is simply what we use, and for a long period of time, it has served us well.
We will divide this post into two parts, first, a theoretical explanation of each tool, and second, show how we apply the previously explained concepts.
🔸Price action:
This is the first concept that we must cover since it incorporates everything in a certain way. The price action, basically, is the behavior of the price. Depending on the market situation (trend, either bearish or bullish or in range), we may see different price actions. The technical analysis starts from the basis that the price action discounts everything necessary to decide on an asset; therefore, everything that is happening, the price is transmitting in its behavior. For example, if the price is in strong support, and we see that a candle with a lot of volume appears, and it forms a candlestick pattern (suppose bullish engulfing), clearly the price action tells us that there is strong buying interest. This applies to all scenarios; we can also consider a breakout of a structure or correction that closes with a strong candle above the previous high, and so on with infinite cases.
Example of price action in support (real situation in USD / CAD in Weekly Chart):
🔸Trendlines/channels:
This will be a determining tool when defining a trend. Depending on which market or timeframe we trade, we will see more or fewer trends, but they are a very comfortable visual way of marking them. In the case of an upward trend, the concept is based on joining the increasing lows with a line and the same with the increasing highs. Same situation for a downtrend, but with the highs and lows in reverse. The price tends to respect these lines very well, bouncing off them every time it touches them.
Example of trend lines in channel form in EUR / USD Daily Chart (Real example):
🔸Support / Resistance Zones:
The Support and Resistance zones are horizontal and static supply and demand zones. As we saw previously in the trend lines that the price reacts (these are considered dynamic supports and resistances since the value changes as time progresses), the same thing happens here, since they are specific places where there are many buy or sell orders. The key is to wait for a reaction in the price in that area to confirm the movement. When the price moves for a long time between support and resistance, we can say that it is within a range. This usually happens after periods of a powerful trend, where the price begins accumulation/distribution consolidation processes that last a long time.
Here, we have an example on Amazon (AMZN):
🔸Corrective Patterns:
This is a particular concept since it is focused on momentum/trend traders. This trading style is characterized by taking positions that are always in favor of the trend, and corrective patterns are an exciting time to join the movement. These patterns happen after impulses; if we have a strong upward movement, then once the price starts to retrace, it will form a correction pattern in the opposite direction of the trend. They are very useful to be able to join the next trend.
Real example on Facebook (FB):
🔸Risk Management:
The basic idea of risk management is to be able to earn as much as possible but always keeping losses as low as possible, and of course, avoid destroying an account. It is very common to see traders who try to "duplicate" accounts or obtain exorbitant results in very short periods of time. Is this possible? Of course, YES, but we must ask ourselves whether this is functional in the long term, and the answer is NO. OBLIGATORY, if we take high risks, we will lose a lot of money after a certain period of time. This is very simple, trading is a game of statistics, and streaks exist either for better or worse.
There are certain basic rules, such as the % risk of the total capital in each trade. For example, if we have an account of $10,000, a conservative and correct risk to assume, it would not be more than $300 per trade, which implies 3% of the total capital. We recommend risking that value as much as possible, and even the optimum is a little less. We handle ourselves with risks between 1-2%.
Assuming real situations, there are bad streaks of trades that can reach 10-15 consecutive negative trades. Assuming a risk of 2% per operation, we would have a maximum loss of capital of 30%. In this way, we can stay in the game for the long term. Never forget that capital is the raw material of labor, and rule number 1 is NOT TO LOSE IT.
🔸Psychology:
When it comes to trading, thousands of emotions appear that go through our heads, both positive and negative. We will feel fear, euphoria, anxiety, greed, depression, excitement, happiness, and infinite emotions depending on the situation in which we find ourselves. The objective of working on psychology is, obviously, to reduce these sensations, but more importantly, it is to ensure that they do not affect us in our daily work. In the end, we are human, and we will always feel emotions, but the goal is that they do not negatively influence our trading.
In the first place, to reduce negative emotions, we must necessarily know perfectly the statistics of the strategy that we are carrying out. This implies knowing what your return is, what period, maximum loss, how long it will take me to recover it, etc.
On the other hand, it is necessary to perform a backtest to know how it behaved over time and if what I see at the moment is correct. In this way, we will have peace of mind when operating.
We must never forget that this is a business, and expectations must be long-term. Do not measure the result in days or weeks. Look at it in months, quarters, or years. In this way, the results will be more representative.
🔸With the concepts explained, we will see how we can unite them all to take a trade. Although they are all useful, individually, they do not serve us to take a trade. We must unite them in an organized way to use them to our advantage.
We will show you some positions we have taken over the last few months (some already closed, others active).
Bullish Trade on INTU:
In this trade, we see a clear uptrend. The price, after making a maximum, was consolidating for a few months. We detected a clear corrective pattern and took a bullish position once it was broken to the upside. The entry was above the previous high, the stop loss behind the low, and the target in the Fibonacci extension (this concept is not explained, but we can make an informative post later if you want). The risk assumed was 1% of the capital, with a potential gain of +2.5%. The position is open but near the take profit.
Bullish Trade on FB:
Similar scenario to the previous one. Price builds bullish momentum and then corrects. We operate the correction breakout, assuming a risk of 1% with a potential gain of +2.4%.
Bullish Trade on FB (short-term):
This is a trade that we take in addition to the previous one; it is an internal trade. Here, we also incorporate the concept of support/resistance. There was a broken resistance to the upside, and then the price generates a throwback (retest). This setback forms a corrective pattern, which gives us a good opportunity to enter the market—assumed the risk of 1% with a potential gain of +2%.
Bullish Trade on GOOGL:
In this trade, the price breaks the upper end of the bullish channel and begins to correct at the edge. We see a clear consolidation, and we trade the bullish breakout. This trade is already closed with a profit of +1.75% with an assumed risk of 1%.
Of course, not everything is so nice, and there are also stop losses.
Bullish Trade on TLRY:
In this trade, the price breaks the descending trendline and the resistance zone (then support). It generates a corrective structure, and we take a bullish position at the break. The price was a bit in our favor, but then everything turned against us, and we jumped our stop loss.
🔸 This is a small sample of certain technical analysis concepts and how they can be applied to the market. There is no complex science here, no confusing indicators. Simply clear trends, trade-in that direction, and interesting profits with limited risks. That's all it takes to make money on this.

Let's refresh some Forex Market Theory and AnalysisGood morning, traders! Today we have an informative post about the Forex Market. The idea is that traders who have just started in this have clear the fundamental concepts, and for those of us who have been around for a long time, it never hurts to refresh some content!
🔸Let's start with some basic concepts:
The forex market is where numerous participants, including banks, funds, and individuals, carry out transactions to buy or sell currencies. There are several reasons why this happens, but most of the volume of transactions is for speculative or investment reasons. This market operates every business day of the week, 24 hours a day.
There are three sessions, the Asian session, the European session, and the US session.
It is the largest financial market in the world, and the main participants (those that negotiate the highest volume) are private banks, central banks, private companies, investment firms, or funds and brokers. Retail investors are involved, of course, but they do not do the high volume.
The main characteristic of this market is that it is not a centralized market such as futures or stocks. It comprises two levels, the interbank level and the OTC level (over the counter). The interbank market is where large institutions carry out their transactions, and the OTC market is where individuals carry out theirs.
The volume that is handled daily usually exceeds 5 trillion dollars.
In short, the foreign exchange market is unique because of the following characteristics:
- its huge trading volume, representing the largest asset class in the world, leading to high liquidity;
- its geographical dispersion;
- its continuous operation: 24 hours a day except for weekends, i.e., trading from 22:00 GMT on Sunday (Sydney) until 22:00 GMT Friday (New York);
- the variety of factors that affect exchange rates;
- the use of leverage to enhance profit and loss margins and concerning account size.
🔸How did the Forex Market originate?
After the Second World War, the system known (currencies tied to precious metals) collapsed and was replaced by the Bretton Woods agreement. This implied creating three international organizations that are in charge of facilitating economic activities within the planet. They were the IMF (International Monetary Fund), the General Agreement on Tariffs and Trade (GATT), and the International Bank for Reconstruction and Development (IBRD). The idea of this system was to replace gold with the US dollar to tie international currencies.
🔸Currency Predominance:
Obviously, the USD is the most traded currency in the forex market, with approximately 85% of transactions, followed by the euro and the Japanese Yen.
The currencies are shown in pairs, where the value of one currency to another—the base currency (or the first one) versus the second or the quote currency. It indicates how much of the quote currency is needed to purchase one unit of the base currency.
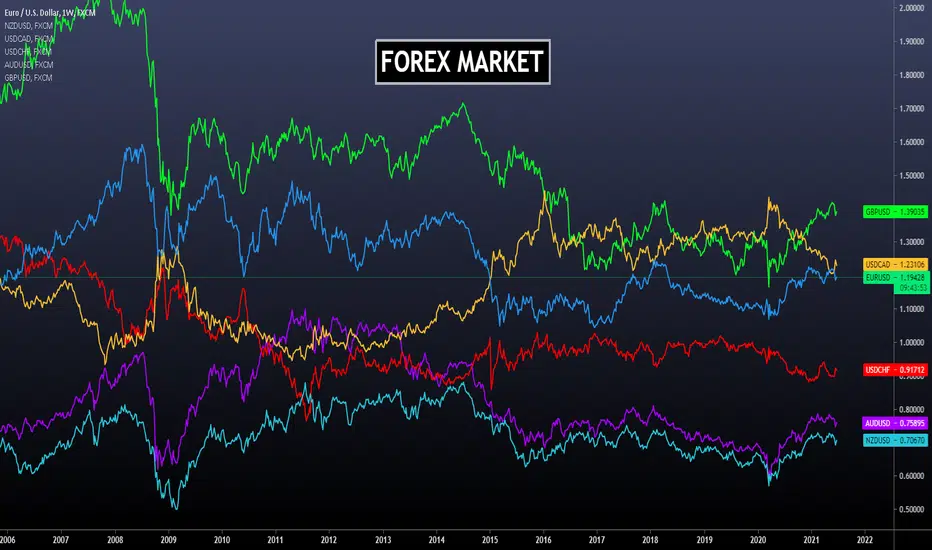
Here, we leave our daily chart analysis of all the major pairs, that is, the pairs tied to the USD.
🔸AUD/USD:
The price has bounced at the Daily Demand Zone and was rejected there. We expect a bullish push towards the Descending Trendline of the current structure.
🔸EUR/USD:
The price was slightly rejected at the Ascending Trendline, making us think about a potential bullish move towards the Resistance Zone again. However, if that fails, we need to consider the bearish view also.
🔸GBP/USD:
It broke the Ascending Channel, with a nice push to the downside. We expect a bearish move towards the next Support/Demand Zone.
🔸NZD/USD:
This scenario is pretty similar to AUD/USD. The price bounced at the Demand Zone, and we are waiting for the movement to reach the Descending Trendline.
🔸USD/CAD:
The price broke the Descending Channel with a strong impulse, and now it is correcting on edge. If we see a rejection here, the bullish view will remain valid towards the next Resistance Zone.
🔸USD/JPY:
The price is facing the previous high, where it has been consolidating a bit. If we see a breakout, a safe scenario would be to wait for a retest + rejection to confirm the bullish move towards the next Resistance Zone.
🔸USD/CHF:
The price bounced slightly at the Ascending Trendline (pullback), but we need to see a deeper push to confirm the downside continuation. We consider this because the main trend is bearish at this pair.
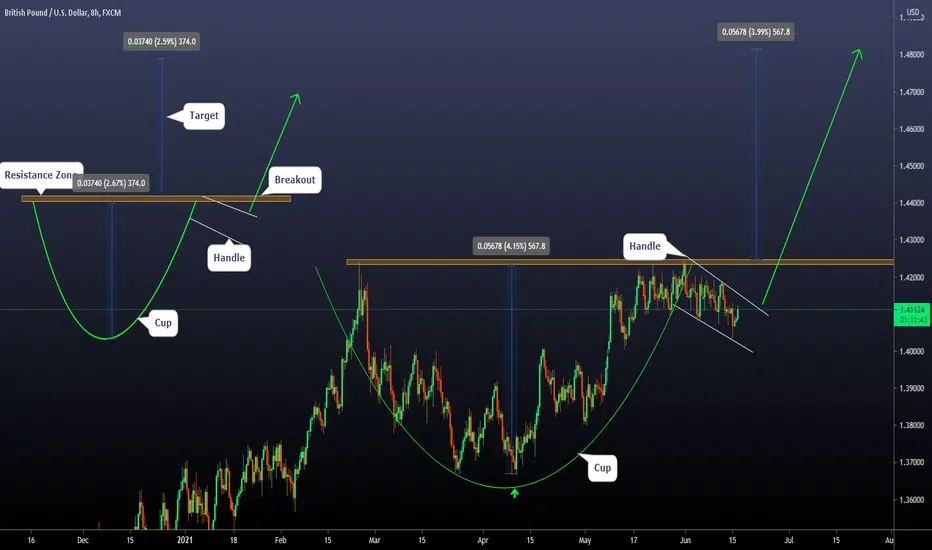
What is a Cup and Handle Pattern? GBP/USD Real ExampleGood morning, traders! Today we will make an educational post about a specific behavior in the market in certain circumstances, and we wanted to take advantage of the situation in GBP/USD that is currently happening.
The pattern we are talking about is the CUP AND HANDLE PATTERN . This pattern is widely used in stocks or indices since they are trend instruments by their essence, and it serves to catch a potential rise in price after a correction. The premise for this pattern to be valid is that the asset is in a CLEAR trend, either bullish or bearish, and has initiated a corrective process.
A cup and handle is a technical chart pattern that resembles a cup and handle where the cup is in the shape of a "u," and the handle has a slight downward drift.
There are three key things to consider when forming these patterns:
🔸Length: Generally, cups with longer and more "U" shaped bottoms provide a stronger signal (this case). Avoid cups with sharp "V" bottoms.
🔸Depth: Ideally, the cup should not be overly deep. Avoid overly deep handles, as handles should form in the top half of the cup pattern.
🔸Volume: Volume should decrease as prices decline and remain lower than average in the bowl base; it should then increase when the stock begins to make its move higher, back up to test the previous high.
🔸In addition, it is also an important factor that the handle is a clear corrective pattern and has some point of support or support. In this situation, we see that in the daily chart, the price is touching the uptrend line, and also in the published chart, we see how it is also testing the broken zone of the range. The current reversal point is solid.
How to Determine Market Direction Using Multiple time frameIn this video I try to explain the best way to determine market direction.
Define a uptrend--- Series of higher highs and higher lows
In an uptrend your goal is to buy from a support and form a new higher high
In order for you to buy from a support, your lower timeframe must be in a downtrend
Define a downtrend--- Series of lower highs and lower lows
In an downtrend your goal is to sell from a resistance and form a new lower low
In order for you to sell from a resistance, your lower timeframe must be in an uptrend
Avoid using historical levels to fight market direction
If you can keep these rules, you will always be safe. Few is always more
Thank you and trade safe

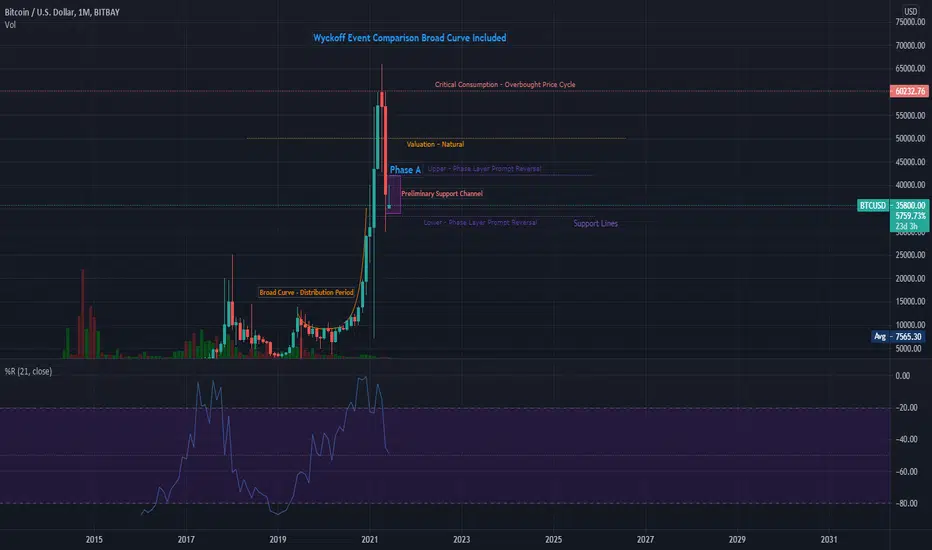
ACCUMULATION PHASE A : BTC Wyckoff Law Curve VisualWyckoff's three laws:
Supply and demand.
Cause and effect.
Law of effort.
Saved for personal and public curve representation and visuals on a large time frame.
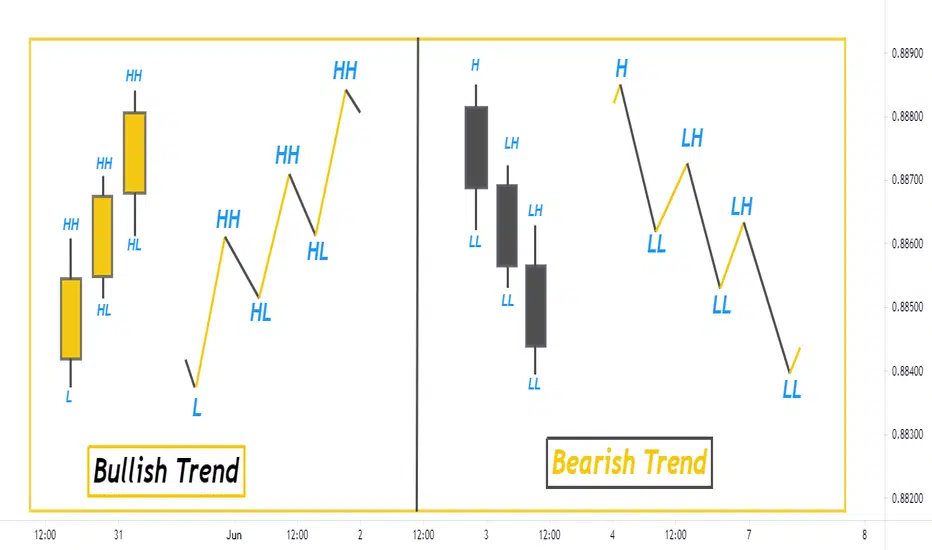
Bullish and Bearish Trend | ForexbeeBullish Trend
Bullish trend refers to consecutive higher highs
and higher lows in the price of a currency pair in forex during a specific timeframe. it shows that there is strong buying pressure.
Bearish Trend
The formation of consecutive lower lows and lower highs in the price of a currency during a specific timeframe is called a bearish trend. It indicates strong selling pressure.
Engage- Reversal Pattern -2 Extreme Reversal setupThe first Video on Education series - Engage - The Trade Setup
The first candlestick pattern that I will discuss is the wick reversal setup, which is a pattern that can spotlight some of the best reversal opportunities in the market.
studied from Book Secrets of a Pivot Boss: Revealing Proven Methods for Profiting in the Market
www.amazon.in
Happy learning.
( Education purpose for all )

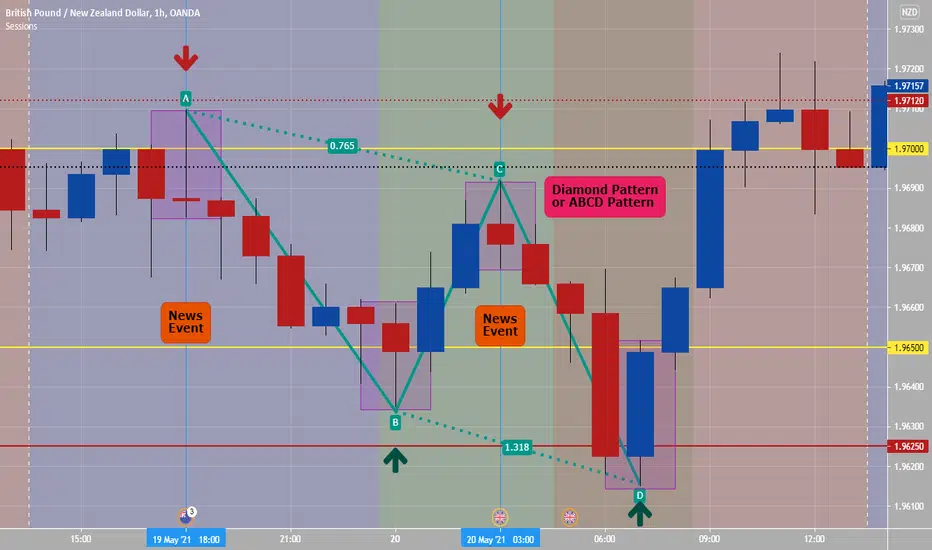
(How To Trade) Diamond Pattern or ABCD PatternYes, possible 4 obvious trades on hourly chart of GBPNZD on Thursday (two sells and two buys), you need to ask yourself HOW could you have entered these trades with right risk management related to- lot size, entry price, stop loss and target? Diamond Pattern is a harmonic pattern.
What do you always need to be aware of is bigger picture, like the following: You should use support and resistance and Fib ret. tool in trading.
- What is GBPNZD doing on higher time frames, earlier this week, etc...
- What is GBPNZD current ADR?
- What pair are you trading?
- Any news events that have or will be happening? Noted: on chart two new events that actually were part of revering short term trends.
- What is current price? any psychological numbers around current price? triple 000 or 500 numbers on charts?
- What are sessions currently open? With GBPNZD on left part of chart is when Sydney is open, so AUD and NZD are being traded - what is price action doing?
- What is time in session? you would need to know exact time where currency is being traded: Convert Sydney time to your time, Convert Tokyo time to your time, Convert London time to your time and Convert New York time to your time.
Trading Forex is really not difficult, but you need to always with with big banks and not trade against them. You need to be able to understand candlestick language and what each one is telling you in the bigger context of price action. This is all about probabilities and if you employ a certain strategy or edge- how many times out of 100 trades would you win? not gambling!!!
Really, look at hourly charts and higher ones of any pair- put in the homework, take notes and be one with Forex- then you will succeed.
Trend Continuation Patterns with Real-Time ExamplesGood morning, Traders! Today we will make an educational post about the most used corrective patterns. There are numerous patterns, even more complex, such as Elliott counts where each internal wave of corrections is explored, but the reality is that it is not 100% necessary to apply it in the market.
The idea of this information is to provide a simplified, useful and applicable overview. For this, we will explain the corrective patterns and then we will show real-time examples that are being presented in the market at the moment or that have happened recently.
The examples will be in high temporalities so that the charts are valid for a few days/weeks.
One concept that encompasses all the corrective patterns that we are going to talk about is that they are all trend continuation patterns. That is to say, it is a correction that is formed and then continues to the previous trend. That said, in all cases, it is necessary that prior to the pattern, there is an impulse in that direction, that is, if we see a triangle, for it to have an upward resolution it is necessary that the previous trend be upward. While there are some cases where the patterns can go in both directions depending on the context, we won't get into them.
Keep in mind that we ALWAYS have to analyze the context of the pattern correctly. For example, if we see a bullish continuation pattern forming near a major resistance or trend line that could interrupt the price movement, it is clearly not the place to put your money. You should always look for the correct pattern + the appropriate scenario for the trade, where the risk-benefit ratio that we obtain is appropriate.
🔸Pennant Pattern: is a type of continuation pattern formed when there is a large movement in a security, known as the flagpole, followed by a consolidation period with converging trend lines—the pennant—followed by a breakout movement in the same direction as the initial large movement, which represents the second half of the flagpole.
🔸Ascending Triangle: it is created by price moves that allow a horizontal line to be drawn along the swing highs and a rising trendline to be drawn along the swing lows. The two lines form a triangle. Traders often watch for breakouts from triangle patterns.
🔸Flag Pattern: when price moves counter to the prevailing price trend observed in a longer time frame on a price chart. It is named because of the way it reminds the viewer of a flag on a flagpole. The flag pattern is used to identify the possible continuation of a previous trend from a point at which price has drifted against that same trend. Should the trend resume, the price increase could be rapid, making trade timing advantageous by noticing the flag pattern.
🔸Descending Wedge: The wedge pattern is a continuation pattern formed when the price bounces between two downward slopings, converging trendlines. It is considered a bullish chart formation but can indicate both reversal and continuation patterns – depending on where it appears in the trend.
🔸Rectangle: is when the price reaches the same horizontal support and resistance levels multiple times. The price is confined to moving between the two horizontal levels, creating a rectangle.
Real-Time examples:
AUD/USD Descending Wedge:
EUR/GBP Rectangle:
EUR/NZD Rectangle:
GBP/USD Flag:
NZD/USD Flag:
USD/JPY Flag:

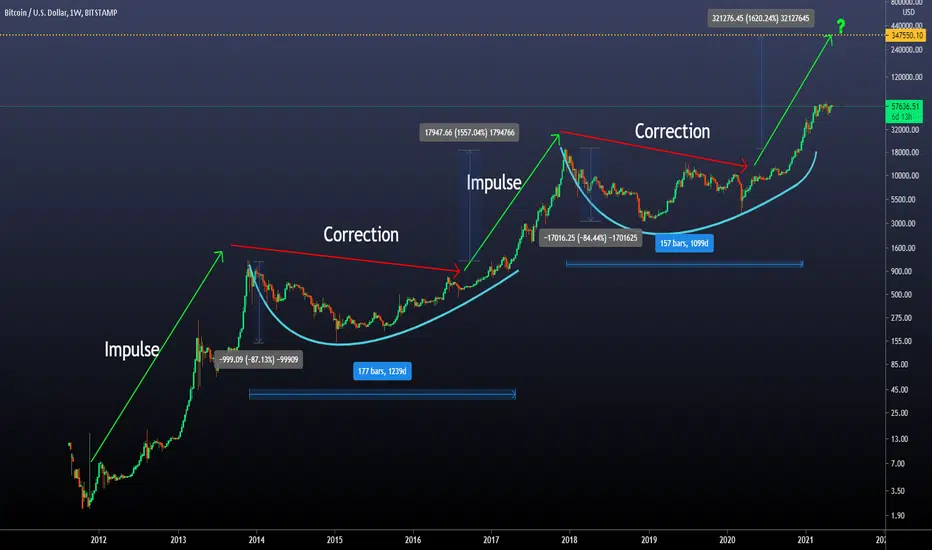
Parabolic Explosion / The Bitcoin PhenomenaGood Morning traders! Today we bring you a curious post, and maybe a bit controversial, since we are going to propose a future behavior in bitcoin (in relation to past events) with an extremely interesting price target.
To make this post, we will focus on the last large corrections, that is, backward movements that lasted for months or perhaps years. They can be clearly seen in the chart of the post, because the chart is in a logarithmic scale (if you do not know what the logarithmic scale means, leave a comment and we will gladly make an educational post in relation to the different scales in the graph).
We can see great similarities in the corrective movements, and so far the impulsive movements have been respected.
Speaking of corrective movements, we see that both have a depth of approximately 85%, and a duration of between 1100 and 1300 days.
🔸We can see more clearly the corrections in the two charts below:
🔸The target set in both situations is the theoretical target of this type of movements. Of course, the movement after the first correction ended up being abruptly greater than the theoretical. The rise of the previous impulse was +1600%:
Now what we ask ourselves is if the current impulsive movement replicates the previous rise. If so, it would imply a +1600% rise from the breakout, resulting in an approximate target of $340,000.
Interesting, right?
This kind of behavior is common on many cryptocurrencies. We have more examples and cases, so, feel free to comment the cryptocurrency you are inteterested in and we will try to apply this kind of analysis to it!
Market Structure - The Chart analysis (simplified!!!)Using Market Structure to identify entries in the FX market has been a life changing technique for me. Through this video, i described my process of entering trades using MS without a single indicator in sight!!!
You'll see the following :
1. How to draw support and resistance.
2. How to identify the trends in a market ? What is a Break of Structure ?
3. Avoiding fake outs using the Law of 2's (by waiting for two consecutive HH's and HL's | LH's and LL's).
4. What is a Major Level ? Is it really useful to my analysis?
5. How to determine Take Profit using MS.....etc

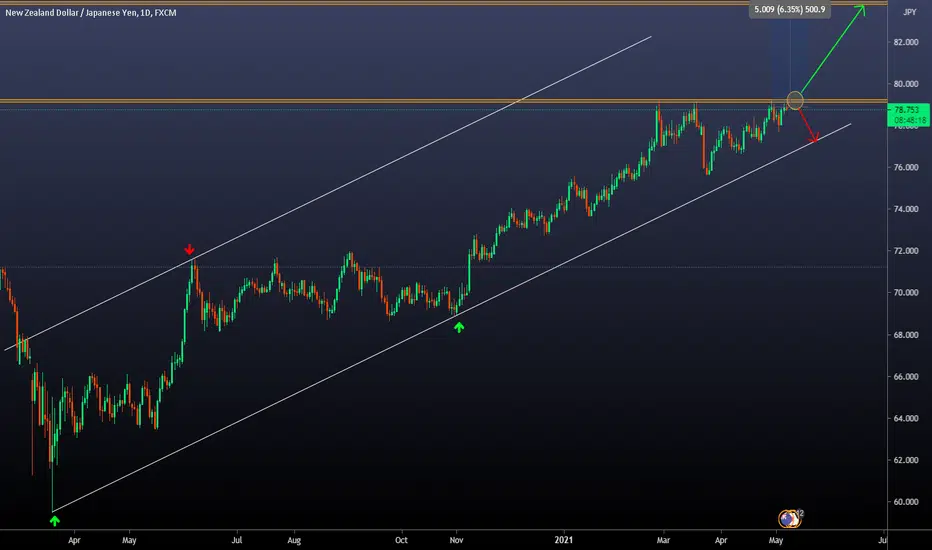
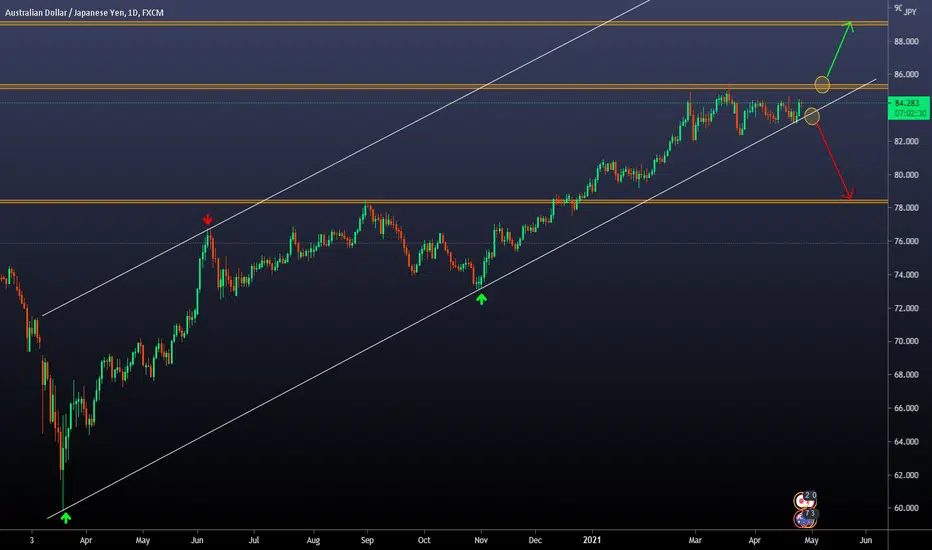
How to Catch a Trend? Deep Explanation on a Real SituationGood Morning traders! Interesting idea today regarding the NZD/JPY pair.
This post is aimed to all the trend followers, since it implies a breakout of an interesting ceiling. This pair has been consolidating in the current retracement for more than two months, and we can already begin to see intentions of a breakout in the short term.
Why do we say this?
🔸Since March 25, the minor trend is clearly bullish. This determines that there is an interesting demand, and it is possible that we will see a brekaout soon. The target of the potential movement is in the next Resistance zone, at 84,000. We determined this based on the analysis of the Weekly chart:
🔸Well, the above is just an analysis. The question is, how are we going to trade this movement?
🔸In the 4H chart we will plan the setup. It involves a corrective move in a throwback towards the broken zone, and then the corresponding momentum. It has a GREAT potential if it happens, since it can be a trade with a return greater than 4 or 5 times the risk assumed.
Why are we trading this way?
Because we are momentum traders and we look for trades that goes in the direction on the main trend.
And how to catch a trend?
This is a commonly asked question. As a breakout traders, we always look for clear impulses followed by corrective moves. After that, we will look for the new impulse in the direction of the main trend, using that corrective move to place our entry and stop loss level. Here are 5 examples of the last bullish trend:
The first thing we will do is to position on the daily chart to show you all the corrections we saw on the chart. After that, we will decrease to the corresponding timeframe to be able to see the structure comfortably and detail how we would have traded it. We will use a very simple risk scheme, fixed 2: 1 R / R ratio in order to simplify the explanation. The entry point is at the breakout of the structure, and the stop loss below it.
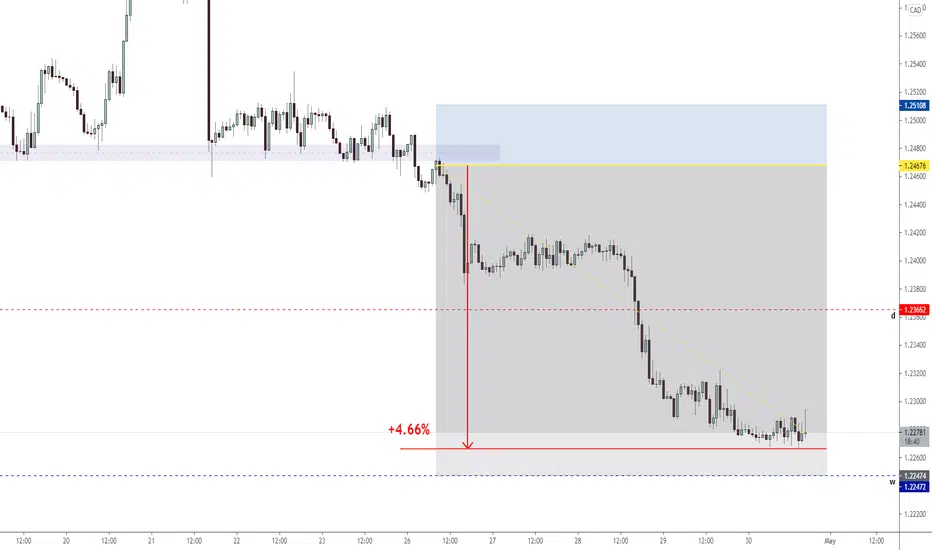
IDF Play - Fading a daily inside barSTATEMENT
This publication aim to explain as detailed as possible the IDF play strategy.
To do so, we will analyse USDCAD chart and the inside bar that was printed on 22-04-2021.
RATIONALE
Why trading the failure of an inside bar? It's commonly known that retail traders will identify an inside bar as a reversal candle. Institutions and big players know how retail traders play these kind of candles and will most likely fade them.
Also, before directly trading this technique, please backtest it through different time period (what could have workd in 2020 might not work anymore in 2021 as it's well known that market behaviour can change) and different currencies (an high strike rate with EURUSD doesn't mean it will work with GPBUSD for example). I would consider it as an edge it win rate is above 60% adn the ratio is in average above 1% ROI.
INSIDE BAR
What's an inside bar? It is a candle in which the high to low range is smaller than the prior candle; i.e., the high is lower than the previous bar's high, and the low is higher than the previous bar's low .
THE PLAY
First of all, we identify an inside bar on the daily time frame:
In this particular trade, our inside bar can also be identified as a Doji candle (another reversal candle), reinforcing the retail trader's sentiment that we are about to witness a trend reversal (meaning that most of them will be placing an order to go long with a stop loss below the wick of the candle).
Additionally, if we check the prior day we notice that price printed an Outside bar (or Engulfing candle), confirming our bias that we are most likely to find opportunities to go short.
Next step is to go down to the hourly time frame and look for a significant leven from which we can short.
So far in below screenshot we have identify a significant support level where price was rejected 6 times. As we would like to find an opportunity to go short, we need to wait for the price to break through this level.
Now, as we have short bias, we need to wait for the price to break through that support level, so we can consider placing an order (sell limit).
With 6 touches on the support level, market is telling us that we have a strong level, having saying that, we won't need any further confluence to look for entry after the breakout.
After breakout is confirmed (1) and there is no an immediate pullback (few candles between breakout and pullback to significant level) we can place our order (in this case, sell limit).
We do not place our stop loss above the latest lower high; we play it safe and place it at 1.25104 (the prior lower high).
Take profit is placed at a weekly level we have identified we do believe can represent a valid target.
THE RESULT
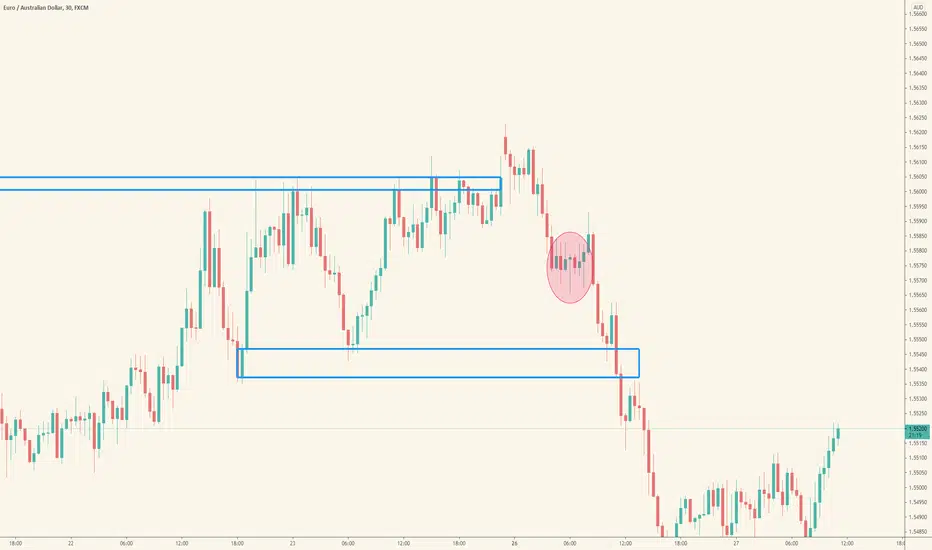
How to Take Advantage of Both Market Directions?Today we will talk about a very common situation that occurs in the vast majority of traders (if not all), especially when we have just started to get into this bussiness.
There is a consistent struggle between convictions, ego, and market views or analysis. This generates that we try to see in our analysis what we want to happen, or what we need to happen, and ultimately this the only thing that generates are psychological issues on the trader.
The best way to remain calm and be able to trade in a cold and consistent way is to plan in advance all the situations that may occur in the scenario we are analyzing, and how we would act in front of them. In this way, we do not allow ambiguities and we will only take positions if what we are waiting for happens. And, covering both directions, we will not feel that we are missing something if the movement is the opposite of what we expect (as it would happen in case of analyzing only in one direction).
In this case we will analyze AUD/JPY to show you how we carry out this analysis:
🔸First, we are going to detail our vision of the daily graph that is the one shown in the publication.
🔸As we can see, the price is in a clear uptrend, and when faced with the Resistance zone it began to consolidate for several weeks.
🔸From there, we didn't see a clear direction. When we detect that there is no type of trend or clear behavior, we stay out of the market and wait for an opportunity to happen where we can establish a clear horizon.
🔸What we propose to trade this pair is that there is a brekaout. It can be in a bullish or bearish direction. In case of being bullish, it must be from the Resistance zone and in case it is bearish it must be from the trend line.
🔸We are going to decrease the timeframe to show exactly what we expect:
🔸In this image we see the 4H chart.
🔸Basically what we detail is that we expect a break and then a retest / corrective structure. This is because it is a security add-on to avoid potential fakeouts (the trade can fail anyway, of course).
🔸Once we see the retest, we will have a new swing or structure to be able to position our entry and stop loss safely, with a favorable risk-benefit ratio.
🔸The targets are: Resistance zone in case of bullish breakout, and Support zone in case of bullish breakout.
A diffrent way to interpreter Candle Wicksin this tutorial i'll explain how to interpreter candlestick Wicks, or Shadow to get a better understanding of the price action, and market behaviour.
in this example we have a range with a lot of wick's at the bottom. A lot of you learned that wicks means rejection in the opposite side, that's right in some way.
But in this case you can interpreter it as selling pressure, first thing first look at the current situation; AUDUSD is downtrending, and the trend is you're friend,
most likely it's gonna follow up in the direction of the trend. If there are some wicks to the downside it means that seller are entering the market in that specific zone,
but even that buyers are entering at the bottom of those wicks (another specific zone). So once we get a clear breaking of the "buyers zone" we can have a clear idea where
the market is gonna go, since the buyers are out of the market and sellers are taking over buyers.
Let's take another example for a better understading of this concept
in this example we have again a clear trend, a "buyers zone" and a "sellers zone" and look what happen once we break the "buyers zone" we can clearly see a continuation
of the bearish that we had before, since in that zone both buyers and sellers entered the market, so it create indecision in the market. you can see that we have a break above
the "sellers zone" as the exaustion of the last push, then it got below the "buyers zone" breaking the previous lower low and creating a possible continuation of the
current trend, resulting in bearish momentum.
The main points of this lession are:
- wicks dosen't always mean rejection, but can indicate market sentment
- follow the trend not the rejection.
Trade safe
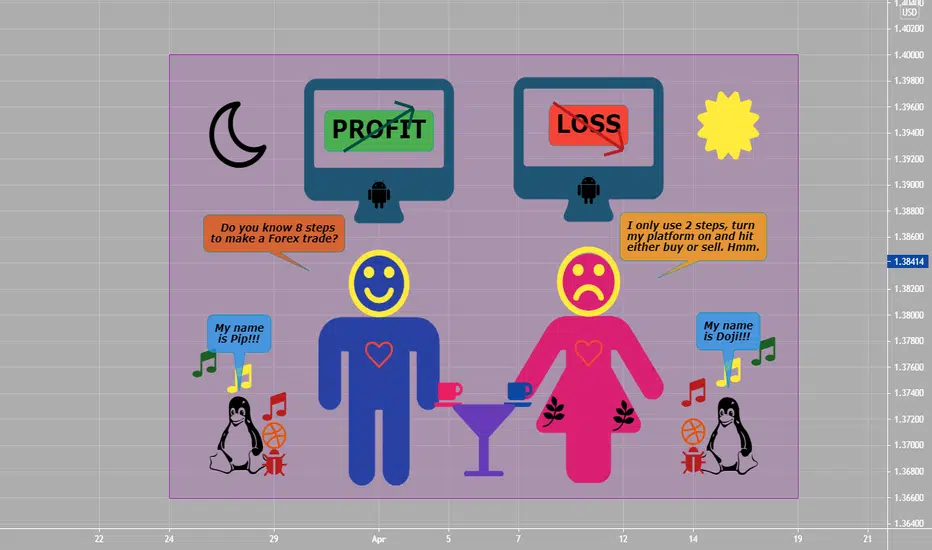
8 Steps To Make A Forex Trade!!8 Step To Make A Forex Trade:
1) Start the Trading Platform- The first step is opening the trading platform.
2) Open The Chart- Now choose a currency pair and open a chart. Select a time frame.
3) Add Indicators (if you want too)- or skip this step.
4) Place The Order- Now prepare to place the order.
5) Set The Stop Loss And Take Profit Levels- Now set your stop loss and take profit levels. This step is optional but highly recommended. Experienced traders have found that setting a stop loss at half the pip amount or less than your take profit level can set you up for long-term success. This is because you can be right less than half the time and still come out at the end of the week, month, year ahead if you have a favorable risk-reward. Setting the stop loss will limit your losses if the market does not move in the preferred direction. Setting the take profit level will make sure that the trade exits in profit once the market makes the downward move that is expected. It can be an advantage to set these levels when you place the trade because once the trade is actually in the market, the pressure can make it difficult to make decisions.
6) Order Confirmation- Submit order and wait for confirmation screen. Confirmation is important as is ticket number because you may need to reference the ticket number if you need to call broker about trade. Of course, you don't want anything wrong to happen with execution, but if there is a mistake in execution on part of broker you will need to go to them with confirmation and ticket number so they can correct their mistake and credit account back if necessary.
7) The Waiting Period (Waiting Not Trading Is Where You Make Or Lose Money)- Now waiting period begins. This is the more difficult concepts in Forex trading. Some traders find it helpful to turn off the screen and get away from the market once they've entered so that they are not constantly fretting over market moves. Either way, sticking to a good risk reward is a favorable approach and whether your stop or take profit order gets hit, you have done your job correctly.
8) Trade Completion- Finally, the trade is complete. Trade results can be only three, which are makes money, loses money or breaks even.
Remember in trading to do four things: Win Big, Win Small, Lose Small but Never ever Lose Big!!! Risk management on all trades is necessary.