✳️TRADING HACKS: Read your chart like a book✳️Everything is in the video :) Let me know if the concept is clear. Cheers!
Multiple Time Frame Analysis

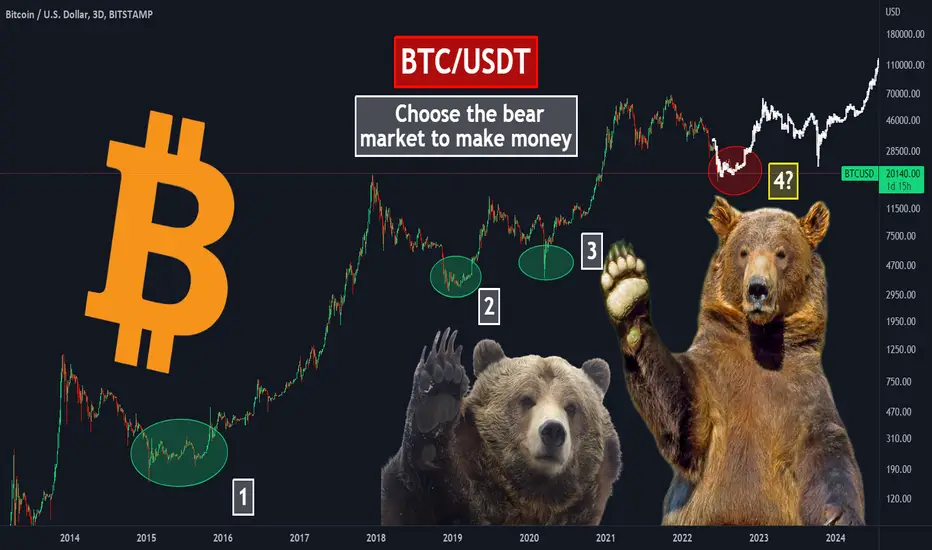
🔥Why does a bear market make traders rich?🔥 Why does a bear market make traders rich? The answer is very simple. All really rich people can buy any asset at a big discount. In crypto this discount can be up to 80% and sometimes more than 95%.
📊 But why is it a bear market and not a bull market that makes traders rich?
A bull market helps active traders (scalpers, swing traders) a lot, especially to quickly build up their capita l if they are trade follow the trend.
Also, it`s a good time to study trade and when the real bull market return you will be highly prepared to this!
🚩 While the market is out of trend and certainty, the biggest upside potential for cryptocurrency is at the end of a bear market, as it was in: 2017, 2019, 2020 and possibly now in 2022.
Never can crypto give more profit than the one bought at the end of a bull market. For example, Bitcoin at $3200, which rose to $69,000. That's 20x to your deposit. And you just need to buy close to the bottom (green areas).
📊 Which strategy should I use to buy crypto?
The best strategy for that is DCA. This strategy helps to get an average buy price over a certain period. That way you won't make the maximum profit, but you won't incur huge drawdown when buying crypto.
In the following tutorials I will tell you about the DCA and the advanced DCA used by professionals to buy crypto on the spot.
🔥Also you can check the Greendwhich indicator that help to BUY crypto at the bottom and sell close to the HIGHS. The additional module helps to increase the number of crypto during the bull market growth.
✅ My recommendation is not to buy more than 30% of altcoins on spot because 95% of them will disappear forever after a bear market.
✅ I suggest focusing on buying Bitcoin and the biggest altcoin Ethereum. They should be the biggest part of your portfolio if you want to buy cryptocurrency on spot (long term).
🚩 Write the comments, if you have a question about this topic. Do you agree with this idea or have smonething to add about the highest possible profit?
💻Friends, press the "boost"🚀 button, write comments and share with your friends - it will be the best THANK YOU.
P.S. Personally, I open an entry if the price shows it according to my strategy.
Always do your analysis before making a trade.
Learn How to Trade Top-Down Analysis | Full Guide 📚
Learn how to trade multiple time frame analysis.
Includes important theory and real market examples.
Entry/stop/targets explained.
❤️If you have any questions, please, ask me in the comment section.
Please, support my work with like, thank you!❤️

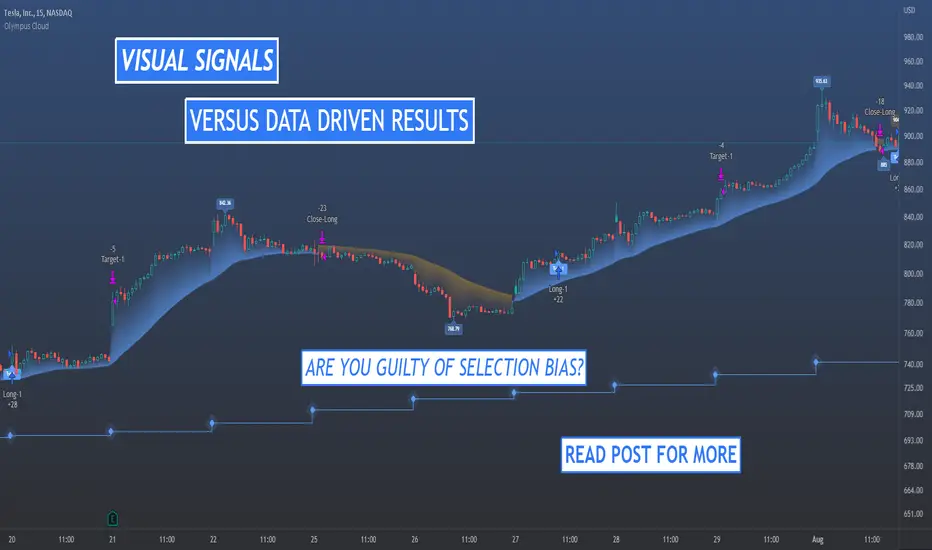
Visual Signals Versus Data Driven ResultsMany traders fall into the habit of judging a trading system or methodology by observing visual signals. A visual signal can range from a bot or algorithm signals, moving average interactions, a stochastic cross, or a plethora of other common patterns.
Observation is the first step to finding a successful trading system but relying solely on visual cues will leave you open to selection bias. In other words, people tend to focus on the signals that worked and ignore the ones that didn’t. In addition to selection bias, if you make adjustments to an indicator or strategy based on visual cues without knowing the results in terms of accuracy and profit, you may suffer from what we call cascading changes, also known as unforeseen side effects.
Tuning For Results
The opposite of relying on visual cues is basing your decisions on the past results of a trading system. While past results do not guarantee future results, a pattern that has produced historical net profit is likely to work to some degree in the future.
Indicators and systems that are packaged with backtesting logic allow you to make adjustments to the system and then view how your changes affect real outcomes like net profit, trade accuracy, and profit factor. Making indicator changes based on results means you are using data in your favor.
Avoiding Selection Bias
The fix for selection bias is simple. If a pattern looks good to your eyes, backtest it and ensure you locate every last instance of the pattern, especially failed outcomes. It’s also important that you backtest over a long time period and do so on multiple different tickers. Some systems work well over a specific date range on a certain ticker but are much less successful on other securities or date ranges. Those who are unable to write automated backtesting scripts will have to rely on manual backtesting or find others who provide backtesting suites.
We highly recommend you avoid indicators and systems that do not include the ability to backtest and view past performance. It’s also best to remain skeptical when taking the word of many online influencers. Looking at a few signals that produced winning trades does not mean the system is capable of producing net profit over large sample sizes. In addition, only testing a system in a rampant bull market can be misleading. In other words, don’t fall victim to visual signals that don’t reveal results across time.
Avoiding Cascading Changes
When backtesting, sometimes tweaks you believe ought to improve your net profit do not produce the expected results. During extensive backtesting, many system changes we thought were improvements turned out to produce undesired outcomes. Not all changes improve your strategy even though the most recent visual signals appear better.
For example, by adjusting a strategy variable to avoid a few unwanted losses you may inadvertently miss a few trades that were big winners. The same variables that produced the unwanted losses were the same variables that produced the big winners. Some of the best trading systems follow the trend and a pattern similar to the Pareto principle, which means a small number of trades produce a large amount of the total gains. Missing the big winning trades has a significant negative impact on your net profit. You will never know in advance if the trade will become a big winner, and anyone who tells you they know is naive.
Trying to achieve perfect trade accuracy will cause you to miss many excellent opportunities. Adding more variables to a trading strategy means you are limiting the conditions that will activate a signal and increasing the likelihood your strategy will miss winning trades. A good strategy is strict, but simple, and does not attempt to achieve perfection.
Technical analysis does not predict the future, it simply provides us with an indication that one outcome is more likely. Changing trading variables without knowing the full extent of your changes over time is akin to fighting with a blindfold on.
Below you can observe the excellent gains produced by our Olympus Cloud backtest logic with only a 54% win rate.
THE MOST PROFITABLE PATTERN: how to trade liquidity collection?What is your favourite pattern in trading? Write in the comments below this educational idea. I think one of the best patterns is liquidity collection.
This pattern has become so common in Bitcoin trading that it is no longer considered unique. But if you look at the history of trades over the last year, you can see the profitability and reliability of this pattern. The number of profitable trades using this pattern is close to 100%.
🚩 To understand what liquidity collection is, we need to understand the definition of liquidity.
📊 What is liquidity?
✅ Liquidity is the ability of a cryptocurrency to exchange into fiat or another cryptocurrency. From this came the concept of high liquidity and low liquidity assets. If you can sell or buy 1 Bitcoin in 1 second. It`s a high liquidity, then you can sell unknown coin on small exchange for the whole 2-3 days. It`s a low liquidity.
Also, there are high and low liquidity exchanges. For example, you want to trade 1 Bitcoin for $30 000. On a high liquidity exchange you can do it in 1 second and 1 click, but on a low liquidity exchange, where there are simply no buyers for your Bitcoin, the trade can take more than 1 minute.
📊 What is liquidity collection?
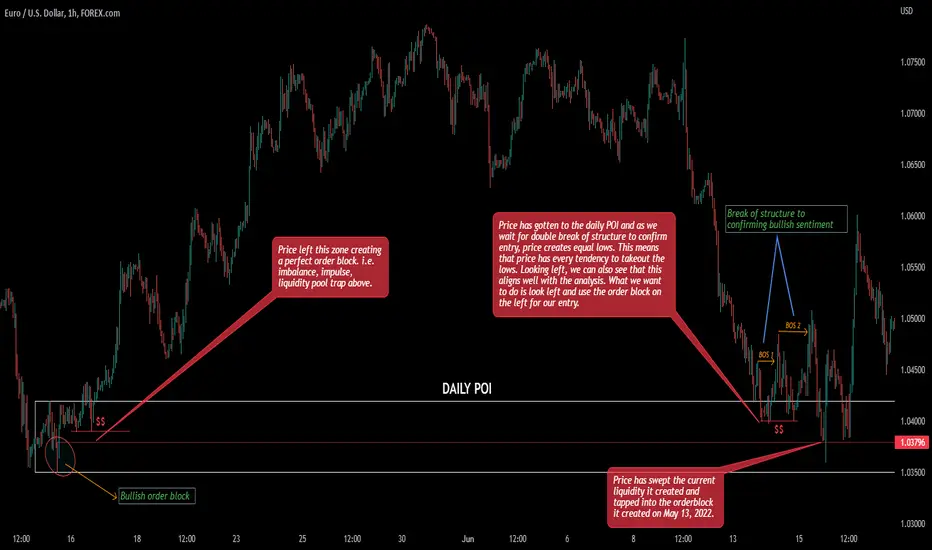
Liquidity collection is an intentional price movement where a big player pushes the price up or down in order to get enough cryptocurrency to oprn his short or long . You can see examples of liquidity collection on the chart.
🚩 After liquidity collections, the price could fall by -50-70% and rise by >+100%. This shows how important this pattern is in trading and what profit it may give.
📊 What types of liquidity collection are possible?
There are 2 types of liquidity collection:
1️⃣ liquidity collection to buy. This happens when a big player wants to open a long trade. He pushes the price below a local low or important level to activate stop losses of long traders and buy back their cryptocurrency (their liquidity). After that, the price starts to rise.
🚩 You can see such an example on the $30,000 chart. There have been 2 liquidity collections to buy.
2️⃣ A liquidity collection to sell occurs when the whale needs to open a short. He intentionally pushes the price above the local level. By doing this he activates stop losses of short traders and he can also sell enough of his cryptocurrency to long traders who are trading a breakout of the highs.
🚩 There are a lot of examples on the chart. My favourite is the liquidity collection at the ATH and new ATH. The price fall so much and you can get good profit from 30 to 70%.
📊 How can you identify liquidity collection?
It can be in the form of a false breakout or an intentional takeout of stops like a shakeout (where a major player intentionally pushes the price to activate traders' stop-losses).
Liquidity collection happens not only on higher timeframes, but also on lower ones. Some scalpers use this pattern to trade on 5-15 min.
🚩 I decided to show you liquidity collection on the daily timeframe because these signals are more noticeable and have better results on 4h-1d timeframes. Also you can use this pattern at any crypto, Forex or stocks.
📊 Why are big players looking for liquidity?
If you're a big player, even on a highly liquid exchange it's hard for you to sell or buy >100 Bitcoins. There are simply no buyers or sellers at the price you need. To do that, the whale is looking for liquidity accumulation areas, which are very often placed below or above important price levels (local lows/highs, all-time highs, even numbers). These are the places where traders place most of their buy or sell orders and big player have enough liquidity to buy or sell crypto.
I like the example with the bread and it`s easy to understand for the beginner. Image that you need to buy bread to yout home. You can buy it at any shop. But what if you are large enterprenuer and want to buy the bread to your 100 shops? You not able to buy it in the closest shop because there is no bread (no liquidity). You have to go to the the large bakery where you can order enough bread for your shops. This large bakery is the liquidity accumulation areas above or below important price levels.
📊 What tools can help you identify liquidity collection?
What can help you understand where the price will go more than the whale's own orders? The whale places his buy/sell orders near important levels in advance, because this is his only chance to open a deal for $100-200 million or more.
That's why I use the DOM and Footprint indicators , where I can clearly see the orders of the big players. With this information I can:
1️⃣ close the trade in profit in time , before the price starts to make a pullback.
2️⃣ open a trade in the same side with a big player : put a short stop loss close to the whale's order and get a best risk reward.
You can see an example of a large whale order on the chart. One whale placed an order to buy 98 Bitcoins at $23,200, after which the price rebounded during the fall and continued rising.
🔥 Traders, how do you use liquidity collection? Write in the comments if you found this educational idea useful and going to use it in your trading strategy.
💻Friends, press the "boost"🚀 button, write comments and share with your friends - it will be the best THANK YOU.
P.S. Personally, I open an entry if the price shows it according to my strategy.
Always do your analysis before making a trade.

What is liquidity gap? Why there is always pump?🚀 When the bull market start with a good news? It`s always bad news at the beginning of the uptrend: in 2015, 2019, 2020. Always the same situation. And now we a here in 2022 and bad news at the bottom of the market. Push 🚀 if it looks similar to other cycles.
In this idea i explain you what is liquidity gap and global situation on BTC. You can identify it using the Volume Profile which is default tool at TradingView.
📊Liquidity gap is an area where the price not stay for the long time and don`t create any levels or order flows. So as you understand there are areas without any liquidity where the traders can set a sl or tp. We can compare it with empty space where is no life or it`s really rare thing.
The price break this areas so easy because there are no liquidity and the price:
🔥 have no support if it falls (as it was when BTC fall in a week from $29k to 17k few month ago)
🔥 have no resistance if it growth (as it was at any bull market when the price nreak the ATH and scyrocketing)
Now the price of BTC consolidating below such liquidity gap of $24500-29500 and going to break it up after some accumulation. As a rule, the liquidity gap breaking with a pumps because nothing stop them inside this gaps.
The top of this gap is a bottom of a huge consolidation channel $29500-69000, so the price can make a pullback after $29500 test. In final, price break this level and continue it`s growth to the previous ATH.
Thanks in large part to consolidation at the bottom, where the bulls were able to accumulate enough Bitcoins and are ready to sell them higher and higher. Consolidation is always good for the bulls especially for the biggest one 🐳
📊Why are these white circles marked? It's a bonus for my subscribers. Remember that before the very PUMP you will think everything will fall to zero, and many analysts on the trading view will say that the price has created a bear flag or a wedge etc. At that point, you may be disappointed and afraid to open a trade or sell all your crypto, but that will only be an emotion you should not succumb to. Only if your strategy says so. Keep these words in mind.
🔥 I will open a trade if I will see the large whales orders on DOM and Footprint. These are usually the most profitable trades with a short stop loss and excellent risk to reward.
💻Friends, press the "boost"🚀 button, write comments and share with your friends - it will be the best THANK YOU.
P.S. Personally, I open an entry if the price shows it according to my strategy.
Always do your analysis before making a trade.

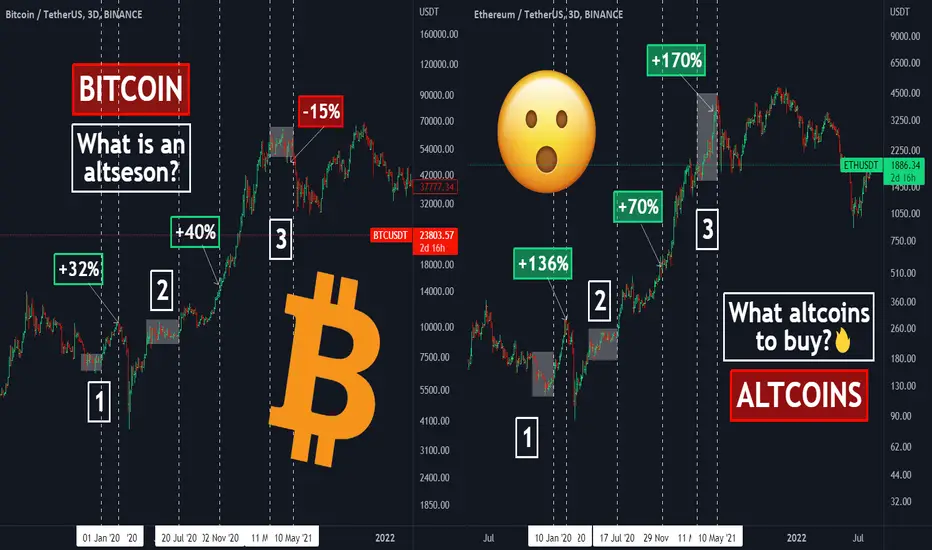
What is an altseason❓What altcoins to BUY❓Altseason is a time when you can increase your deposit by several times in just a couple of weeks. But how to identify why and when the altseason starts, what is domination and what altcoins to buy? We will talk about that in this educational idea.
📊 What is an altseason?
Altseason is a period in the cryptocurrency market when altcoins grow by 50-100% or more in a few weeks.
📊 When does the altseason start?
Typically, the altseason happens when Bitcoin:
🔥 is in consolidation, i.e. trades in the same price range for a long time or 1-1,5 month after it
🔥 renewed it`s ATH ($20k in 2017, $69k in 2021, etc.)
🔥 starts it`s correction close to ATH or when BTC has already reached its new all-time highs before bear market
🚩 In this example I have compared Bitcoin and Ethereum. Ethereum is the largest and most famous altcoin. If you want to understand what will happen with altcoins, look at Ethereum.
On the chart you can see the altseasons and how much more percent Ethereum is growing than Bitcoin:
1️⃣ BTC +32% vs ETH +136%
2️⃣ BTC +40% vs ETH +70%
3️⃣ BTC -15% vs ETH +170% for the same period
🚩 There are the altseasons.
📊 Why should you pay attention to Bitcoin and Ethereum?
99% of altcoins follow Bitcoin. When Bitcoin is in a bear market, all altcoins fall except the popular ones at the time. For example, like GMT in its day.
When Bitcoin is rising, all altcoins are rising. When Ethereum rises in pair with Bitcoin (ETH/BTC), all other altcoins rise. This is especially common when Bitcoin begins its first correction after reaching its all-time highs and a bear market begins.
📊 Why does an altseason happen?
The main reason for an altseason is the outflow of money from Bitcoin and its flow into altcoins.
The second reason is the desire to make as much money as possible. Especially this huge desire has retail traders and newcomers who have just come on the highs of the crypto market. They sell their Bitcoins and use the money to buy altcoins, which grow by 100% or more in a few weeks.
🚩 Of course, Bitcoin has a much larger capitalisation and cannot grow that fast, but altcoins with a capitalisation of up to 1 billion grow very quickly.
✅ As a consequence, Bitcoin's Domination falls. Dominance is a measure that shows the ratio of the worth of all Bitcoins to the total worth of the crypto market (the capitalisation of the entire crypto market). If Bitcoin Dominance is 40%, it means that 60% of the remaining money is in altcoins. A rise in Dominance to 50% means that Bitcoin has equalised in value to all other altcoins combined.
Many people think that Domination helps determine the altcoin season, but this index only shows the fact✅of the flow and predicting that money from Bitcoin will start flowing into altcoins at a certain point using Domination is quite difficult.
📊 What altcoins to buy before the alt season has started?
Friends, how to predict that AXS will grow by 130x or meme lord Elon Musk will start pamping exactly meme coins? It's almost like a lottery, that's why I recommend you to choose altcoins from different categories and buy them in equal parts: DeFi, Game-Fi, Exchange and wallet tokens etc.
Equal capital allocation will ensure that you don't miss out on any kind of altcoin growth. From practice, this is the most correct way. And what ways to buy altcoins do you know? Share in the comments.
🔥 Most likely, the next BIG altseason will start after Bitcoin renews its all-time highs. In the current market situation, that could happen within 6-12 months.
Traders, was this article about the altseason useful to you? Write your opinion in the comments.
💻Friends, press the "like"👍 button, write comments and share with your friends - it will be the best THANK YOU.
P.S. Personally, I open an entry if the price shows it according to my strategy.
Always do your analysis before making a trade.
Think like a PRO and trade at ANY markets🔥Hi friends! Do you want to know what zones I marked on the chart? Put 🚀 and read to the end.
In this educational idea I will explain a few traders secrets that will help you stay profitable in any market for the long term. Take Bitcoin as an example and you'll be surprised how often the same mistake is repeated by beginners and understand how professional traders take advantage of it.
📊 But first, let's find out why the psychology of the crowd drives the market
Fortunately for professional traders, human psychology has not changed in centuries. Bubbles in financial markets now appear just as they did before the Great Depression🔻in the early 20th century, when stocks rose by hundreds of percent in a month, and just as they did during the Tulip Fever🌷in the 17th century, when the price of tulips really soared to the moon due to the huge demand for the flower.
🚩 This shows the similarity in the thoughts of people in the 17th, 20th, 21st centuries. It is these faults in human psychology that allow the patterns in trading to work and professional traders to be profitable over the long term. Just don't tell anyone about it!)
📊 Why do people tend to panic during a fall and get greedy during a rise? The fact is that our brain tends to paint wishful thinking in our imagination. When a cryptocurrency is rising, the imagination thinks that the price will rise forever, and you get excited just thinking about the possible earning. And the happiness hormones just keep surging.
The opposite is the situation with the fall. When markets fall, our brain tries to protect us from more losses and forces us to sell cryptocurrency.
📊 What help the big players to control the psychology of the crowd? Of course, it's the media. Remember when news of the US recession was at its peak and it seemed like a crisis was imminent. Just at the bottom of the market, when Bitcoin fell to $17k and the SnP500 to $361.
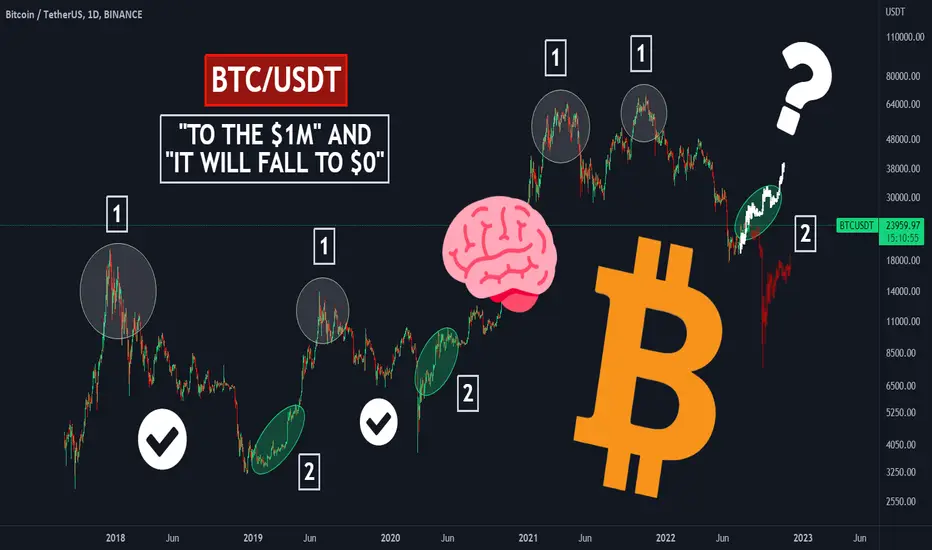
I may surprise you, but in 2018, 2020 people had identical thoughts and all thought Bitcoin would fall to $1000. The crypto market can fall lower to 10-12k of course, but just interesting to know did any of my subscribers buy cryptocurrency back then or at 17-19k❓Write in the comments./b]
📊 What are the areas on the chart? I marked 2 areas:
🔥The 1st area (white) is the areawhere the majority of traders, especially newbies, want to buy cryptocurrency. I call this " Bitcoin will rise to 1 million" zone.
🔥The 2nd area (green) is the area where most traders sell the cryptocurrency they bought at a higher price. Most importantly, it is where most traders believe that the fall will continue even lower and do not buy, expecting a fall. I call this "Bitcoin will fall to zero" zone.
✅How can you use the psychology of the crowd to your advantage? I can tell you from my own example that a clear strategy and working with indicators helps me. For example DOM and Footprint, where I can see huge whale orders and open a trade in the same direction as a big player. A large order is a clear signal✅, not a psychological speculation because of the news.
A few days ago I showed in one of my ideas how Bitcoin rebounded from a large whale order. Bitcoin then grow by 4-5% in just a few hours.
I also use trading systems such as Greenwich or Pump Tracker to identify Bitcoin and altcoins bottoms and ATH. You can see ideas about them on TradingView and their live results✅ It may surprise you!
🏁Summary. This knowledges are usefull for any market: crypto, stocks, ForEx, bonds etc. Human psychology and thinking are the same, but each market has its own specifics. Perhaps I will talk about this in the next educational ideas.
Friends, was the idea useful to you? Have you noticed such psychological zones? Do you agree with this idea or do you think Bitcoin will fall below $17k? Write in the comments.
💻Friends, press the "like"👍 button, write comments and share with your friends - it will be the best THANK YOU.
P.S. Personally, I open an entry if the price shows it according to my strategy.
Always do your analysis before making a trade.
Rare PUMP pattern. Look for a "Base" on BTC🚀Every trader want to catch the pumps because only in this situation you can get the highest RR. In this educational idea we will talk about pattern which help you to identify upcoming pumps. It`s a base pattern.
"Base" is consolidation pattern which is forming at the market bottom and a part of famous cup and handle pattern. "Base" is acually a copy of cup and it`s lead to PUMP✅when the price break up this pattern.
📊 Why base is important for the long traders❓ Because there is a lot of whales have enough liquidity to accumulate their position. The big volume bars at the bottom are also confirmed that whales buy ADA at the "dip"!
📊 Why the formation of the base leads to PUMP❓ As i said the base is the consolidation pattern where the big players can accumulate enough✅liquidity from scared retail traders.
🔥In the most cases the base forming at the market bottom when the biggest part of traders think that crypto continue to DUMP and sell their crypto at loss or at breakeven. But who buys this huge amount of crypto? Of course this is someone who don`t scare - the big players.
🔥Additionally, the price "compresses like a spring" in consolidation range and when the crypto break up the base the "spring uncompresses" and PUMP begin.
📊 What indicator helps to identify the base and upcoming PUMPS❓ This is a basic volume indicator. The volume growth helps you to identify the bottom. A lot of crypto sells by retail traders and the volume bars grows.
📊 What timeframes should you use to have beggiest winrate (80-90%)❓ The higher the timeframe the better, especially for beginners:
1️⃣ 4h
2️⃣ 1d
3️⃣ 1w
🚩 You need to have experience and complete scalping studying to identify PUMPS at lower timeframes (5m, 15m, 1h).
Look for the "base" on the higher timeframes then move to lower timeframes to have clear understanding of this pattern and find the best entry point. I use the trandline breakout to open a long before the pump. Maybe, you will share your tools to open a long before a pump?
🚩 Traders, do we have the base on BTC now❓ Are retail traders scared and think that BTC will fall lower? Let`s discuss it in the comment!
💻Friends, press the "like"👍 button, write comments and share with your friends - it will be the best THANK YOU.
P.S. Personally, I open an entry if the price shows it according to my strategy.
Always do your analysis before making a trade.

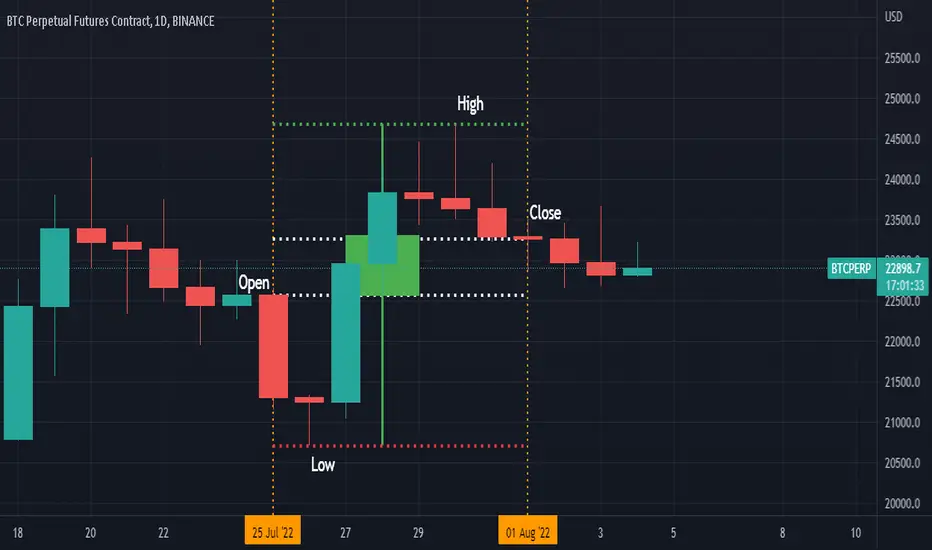
Weekly Time Frame
Open
Monday's Opening Price
High
The highest price at which the stock traded during the entire week
Low
The lowest price at which the stock traded during the entire week
Close
The closing price on Sunday
Number of Candles
52 candles for the entire year
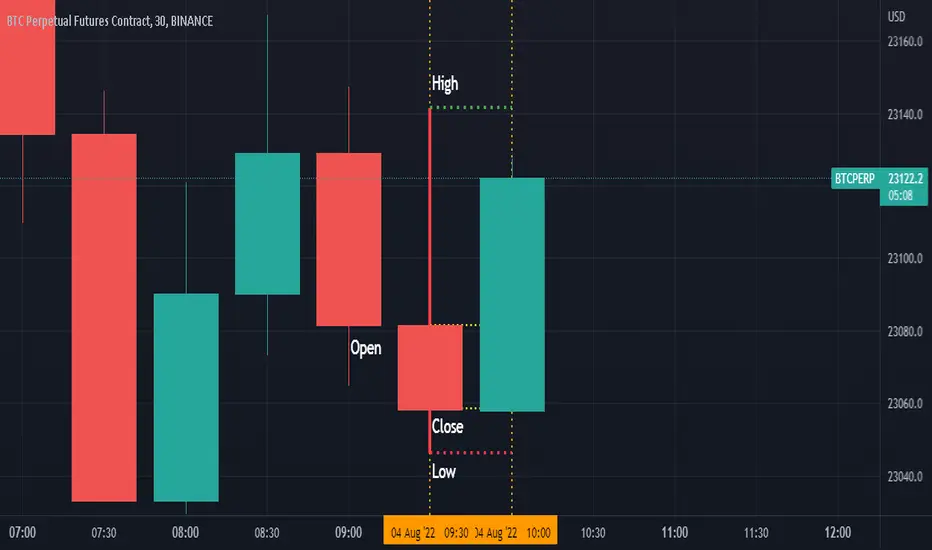
Intraday 30 Minutes Time FrameTask: Change the time frame to 1-minute to see how we can make a 30-minute candlestick.
Open
The opening price at the beginning of the 1st minute
High
The highest price at which the stock traded during the 30-minute duration
Low
The lowest price at which the stock traded during the 30-minute duration
Close
The closing price as on the 30th minute
Number of Candles
Approximately 48 candles per day
HOW TO USE TRENDLINE FOR ENTRYIn this video i showed you how to use Trendline for entry in the easiest and simple way.
What do you think about this?
I would like to hear your view, drop your comment.

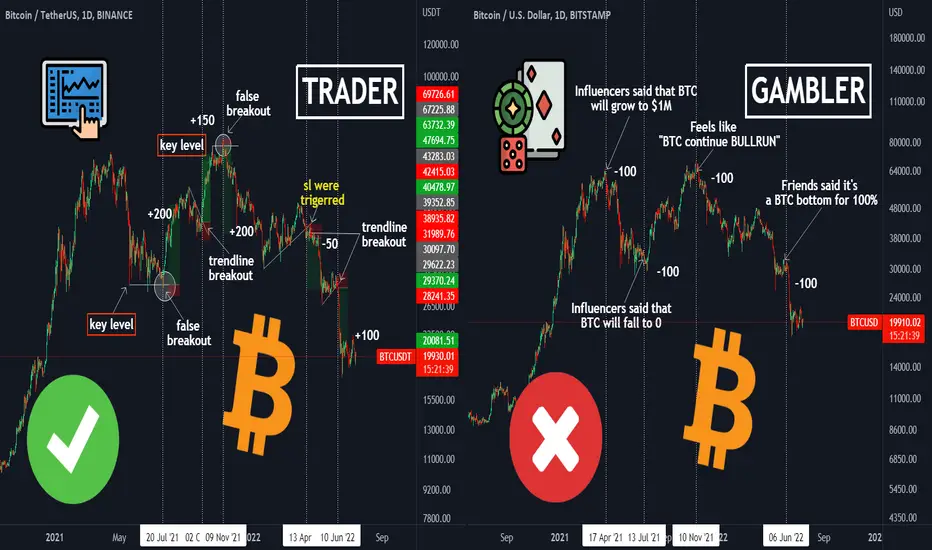
Trader📈 VS Gambler🎲: who are you?Press the "like"👍 button if you find yourself at this charts.
Hi friends! Today i`ll give you 5 simple advice how to improve your trading results if you are beginner. But first of all we have to identify who you are in trading.
📊Who is a gambler? A gambler is a person in the financial markets who:
1️⃣ does not control his/her risks and can use leverage without thinking about losing capital
2️⃣ trades mainly on info occasions (someone said something somewhere in Tweeter or Reddit)
3️⃣ does not have his/her own trading strategy and style
4️⃣ wants to make money and lambo as famous influencer here and now, without even knowing how to calculate the size of the position or the ability to determine the market trend
🚩Why is gambling so dangerous? Once you have earned a lot of money and of course lose it, the gambler is trying to win back, losing more and more money. This is a condition of excessive greed.
📊Who is a trader? A trader is a person who earns by buying cryptocurrency cheaper and selling it higher (long), or by selling it higher and buying it lower (short).
🚩Why a trader can make money, but a gambler can't? The trader follows these rules:
1️⃣ knows his/her trading style and
2️⃣ knows WHEN and WHY he/she buys or sells cryptocurrencies, which means he/she has a working trading strategy
3️⃣ is not afraid to miss opportunities, because he knows that the market gives them all the time
4️⃣ gradually increases deposit and increases the size of trades step by step
5️⃣ asks more experienced traders for advice, because he wants to avoid making the same mistakes and saves his time for trading
🔥The trader grows gradually, step by step, he is interested in new approaches, adapts to the market. If you are reading this idea now, it means that you really want to improve your trading skills and you are probably not a gambler.
✅How can you switch from gambling to trading mode? It's very simple if you start to follow the trader's points:
1️⃣ Define your trading style. Who are you: a scalper, a swing or a position trader? Try different styles and understand how you trade comfortably, which one gives you more pleasure and results. Don't forget about these 2 points.
2️⃣ Create or borrow a trading strategy that suits your trading style.
📈 If you don't know how to determine your trading style and where you can get free trading strategy, leave the comment or DM. I'll give you some advice.
3️⃣ Start trading with a small deposit . This will save you from possible losses due to inexperience, but it is worth to try. For example, use $50-100 or a demo account. If you can't make money with $100, how can you make money using $10,000?
4️⃣ Get in touch with newbies like you and share your trades. This is what our community of more than 800 traders with different trading level allows you to do, either share your ideas in comments on trading view or post your ideas and test their success over time.
🚩Of course, perfect trading only happens in a picture. Catching a stop loss because of your own mistake is a common thing both for an advanced trader and a beginner, but you have to work on your mistakes. 1 out of the 5 lessons in my mini-course is about typical trader's mistakes and how to fix them. Enjoy it!✅
Traders, what would you add to the traders` list to improve trading skills? Let`s discuss in the comments.
💻Friends, press the "like"👍 button, write comments and share with your friends - it will be the best THANK YOU.
P.S. Personally, I open an entry if the price shows it according to my strategy.
Always do your analysis before making a trade.
When is the perfect time to participate in Launchpads?Hi friends! No, the best place is not BTC`s ATH but why a lot of hype around it exactly there? In this idea i will explain you where it`s better participate in ICO, IEO to get the profit during the bull run.
Fewer of the most experienced make money in the market, and the majority always lose in the end. A common example is Doge millionaires who lose their money in a few days on a Bitcoin dump.
Why it's worth it to participate in lanchpads at the beginning of the Bitcoin bull market:
1. all altcoins follow Bitcoin and will grow till BTC grow. Yes, Bitcoin outperforms alts in short terms at the beginning, but they make good profits during altseasons. Often there are 2-3 such altseasons. By the way, if you are interested to know how to determine the best place to buy altcoins - write me in the comments, I will make an educational idea for you.
2. If the lunchpad was unsuccessful and you get a loss, during the BTC bull market the price of alt return at least to you entry point . As long as the loss isn't fixed, it's not a loss, so you can wait for a return to the entry point and come out at break even or in profit. That way you will save your money because you bought alts at the beginning of bull market.
For example, let's take the coins from the Binance Launchpad in 2020 when the bullmarket just begin:
1. WRX +9700% to its peak (ATH). At hte beginning you even can gea a loss. but after had amazing return.
2. SAND +11300%
3. AXS +112670%
I don't think it's worth adding anything.
Why are lunchpads almost no profitable at ATH:
1. a lot of hype around the new launchpads , people feel extreme greed. You know, that 90% of traders are not profitable. Majority will not earn because the majority can`t be the professionals.
2. after lunchpads at crypto market highs, altcoins don't grow so high. If you bought any altcoin when Bitcoin was $4-5 or $10k, you would have made more money than on popular lunchpads. This only works if you don't have a strategy for trading Bitcoin futures trading during a bull market, when you are increasing just the number of Bitcoins. Then you can make much more money than on altcoins.
But if you prefer Altcoins, you can not only fail to earn, but also lose a lot of money, as most of traders, who bought crypto when Bitcoin was above 50-60 thousands, did.
To give you an example, let's take the lunchpads on Binance for the then popular Game-Fi projects on ATH:
1. DAR - up 35% and down 91%
2. MBOX - after growing by 130%, it fell by 95%.
Is this the kind of profit you want to make? The fairy tale about 100x is definitely not here.
Summing up, it's better to take part in several Lunchpads at Bitcoin's "bottom" and get 1000% or at least break-even, than to participate at ATH and get a loss of 95%.
It`s worth to say that only 1 out of 100 coins/crypto have a some value, another one made for collecting money from the crypto newbees. Our aim is to buy low and sell high. That`s all.
Check the idea about when it`s better to come to a crypto market and crypto trading. This idea give you a clear understanding about why you are at the rights place now!
I will explain you where is the best place to buy ALT`s in the next educational ideas! Cheers!
💻Friends, press the "like"👍 button, write comments and share with your friends - it will be the best THANK YOU.
P.S. Personally, I open an entry if the price shows it according to my strategy.
Always do your analysis before making a trade.

📊BTC and FED RATE: is it better to hike? Crypto mythbusters!Some experts use such rules as hiking rate = bear market and falling rate = bull market but if we compare the fed rate with the BTC price we can see that the price is not always follow this rule. Trully say in most cases it don`t.
Let's dive deeper into it!
______________
📊THE BULL MARKETS:
1️⃣ 2015-2017 – the rate is growing.
2️⃣ 2018-2019 - the rate isn`t growing but still high.
3️⃣ 2020-2021 - the rate is 0 and market is growing.
In 2 out of 3 cases the market is growing when the rate is high.
At the end if we compare two Bull markets of 2017 and 2021 there is more massive and longer growth was at 2017 when the rate was hicking.
______________
📊THE BEAR MARKETS:
1️⃣ 2017-2018 - the rate is growing and market is falling. Actually, it can happen because of the lack of buyers. It was the biggest BTC bullrun so the hicking rate is not the main reason.
2️⃣ 2019-2020 - the rate is falling and price is falling too.
3️⃣ 2021-2022 - the rate is growing but the price is falling.
In 2 out of 3 cases the hicking of the rate push the price lower but as we have already identified the 1st bear market of 2017-2018 had to happen after the biggest bull market.
🚩Why the market can fall this time? We had the case of Do Kwon and Luna, UST. Additionally, the stock market push the price of crypto lower. This 2 thing caused the extreme fear at the market and forced retail traders to sell.
🏁Finally, we can say that this pattern is unclear and in most cases work against the rule "hicking rate = bear market".
Traders, what do you think about this patterns of the FED rate and BTC price? Maybe we need to use it with other aproaches such as inflation rate, money supply etc together to make a succesfull fundamental analysis? Write your thoughts in the comments.
💻Friends, press the "like"👍 button, write comments and share with your friends - it will be the best THANK YOU.
P.S. Personally, I open an entry if the price shows it according to my strategy.
Always do your analysis before making a trade.

How Market Manipulation WorksEver find yourself agreeing with someone who complains about rampant market manipulation, even though you don't really know how it happens or where it comes from? If so, do not feel embarrassed; the person complaining about it probably doesn't know either.
The truth is that the practice is so blatant and routine these days that it hides in plain sight. That, or it has simply become a modern taboo among those in power because widespread exposure of it could pose as a significant risk to said power.
Either way, it has gotten so ridiculous lately that it needs to stop before it potentially damages the all-important trust dynamic that maintains the "free" system's status quo.
Thus, let us begin this enlightening discussion with identifying who the direct culprits are.
These would be just about every financial institution that operates in some form as a Market Maker (MM) of weekly equity options. Yes - even your friendly mainstream broker that you had assumed was rooting for your financial success. Basically, if you can purchase weekly put options from them, they are part of the problem.
While this seems absurd, let's just discuss how markets get manipulated before you dismiss the idea entirely.
Markets can get manipulated through any number of sketchy practices. Just refer to the FINRA website and you will find terms for such practices, as well as laws governing their misuse. (Like when crude oil futures reach real negative levels, lol). But, the most tangibly-felt form of manipulation occurs in the way that is depicted in the chart above: by preventing markets from breaking out in either direction, particularly on days when options are set to expire. Quadruple Witching days, for example, are named as such because of how "supernatural" price movements tend to be throughout their sessions. This is complete nonsense, of course, since they move according to how the culprits want them to move - within a pre-defined range that is designed to suck traders into false-breakouts only to close very near the daily opening-cross.
The process of such a corrupt practice is known as price-pinning and it is at the core of every inexplicable market observation that seems uncannily perfect - like when markets only reveal their true direction during the last singular minute of trading. Note the extreme volume abnormality underlying the last-minute candle of today's E-mini session for a perfect example of this.
Despite what is commonly accepted, it is actually the case that MMs are essentially omnipotent, insofar as they can, and do, directly determine the opening and closing prices of individual issues - even on smaller timeframes such as the hourly or 15-minute scales. On most trading days, it is even possible for them to control outcomes on entire indices because of how influential options have become in today's market environment. The really serious problem with this is that it causes markets to crash wildly leading to widespread loss of wealth and subsequent economic severities.
How does too much power in free market system lead to the system crashing? It is because MMs are human beings and are therefore prone to making emotionally-charged mistakes; like getting cocky during times of persistently scarce volatility.
What ends up happening is that on very rare occasions, even bigger market players (like managers of huge pension funds that can affect markets absolutely) decide to unwind their long-held pure-equity positions accumulated over several years in a discreet manner. All the while, greedy/overconfident MMs continue to sell extreme quantities of put options to the public, thinking that there is no possible way that they'd ever need to pay for them at expiration. They'd be correct about this 99.99% of the time, and so they fail to realize how dangerous of a situation their in and how stupid it is to blindly sell such large quantities of out-the-money puts on the open market. The selling is so violent at the point of realization that MMs have no choice but to sell everything at once - even if everyone else suffers from the resultant market crash.
At this point, you might be wondering how this rare scenario has anything to do with the prevalent practice of price-pinning.
It relates because what normally happens when MMs get ahead of themselves in terms of how many puts they short on an expiration day is that they end up offsetting their risk via the mass purchasing of call options as the expiration nears. The calls become cheap enough that the entire cost of this process of risk hedging is pennies when considering the profits generated from selling the much more expensive time-heavy puts to the public. It is also a much more practical way to cover, which is why markets rarely make significant moves (especially downward) on Fridays. The process of MMs selling out-of-the-money puts, which they knowingly perceive as riskless for an exorbitant premium only to turn around and use call options to prevent prices from moving for the rest of the day IS THE MANIPULATION.
To reiterate, what I am saying is that the common form of market manipulation that most people arbitrarily place their blame on is the weekly Market Making process of covering themselves every Friday (and sometimes Wednesdays and Mondays as well) that is the de facto Manipulation that I am trying to convey in the chart above.
The reason why this process should be acknowledged as an illegal manipulative practice, rather than just some existential side-effect that comes with ever-evolving complex market systems is because:
1) It is enabling large institutions to sell grossly mispriced derivatives en masse with no intention of realizing the equivalent risk
2) It is a literal form of manipulation, as per the definition of the word "manipulation"
3) Once understood, it becomes blatantly obvious that markets lack the freedom that has always been pre-supposed, which will eventually change the nature of our
market to something non-sensical, like the concept of equal-outcome investments (you cannot grow your wealth in a market that grows everyone else's wealth at the
same pace, since that is just pure inflation).
To finish this lesson, I will use the chart of yesterday's price/volume action of the S&P futures as an example of how the manipulation of price-pinning can be applied practically:
1) Start with the obvious outlier that is the selling volume incurred at 3:59 p.m. yesterday
2) What this represents is the true bearish sentiment that should have resulted in a panic-sell to close the week
3) The reason why this panic sell never occurred is because MMs had bought very cheap call options starting around noon
4) Specifically, as soon as MMs feared that sentiment had turned bearish enough to threaten their short-put liability, they started covering with calls
5) This can be seen in the upper half of the chart, on the second breakdown, which notched the LOD
6) We can rule out the possibility of a major support bounce because the LOD is simply not a major point of support even if near the 4500 level.
7) This can be corroborated by the lack of historical price action around such high levels of the S&P. To naturally prevent a breakdown of this nature would require a more
historically tested level of support, in my opinion
8) Manipulation resulting from too much leverage and greedy MMs created a very tiny snapshot of the wrongdoing, which is captured full-circle in the volume reading of the last minute of the session.
I hope I was able to present this entire idea in a sensible way. Manipulative practices are very hard to pinpoint, prove and define, which is partially why they can persist for months on end. On a personal note, I really hate this type of market environment because it sucks to trade and limits the possibility of what makes markets fun in the first place. Ironically, I am sort of doing the very kind of complaining that I made fun of in the opening paragraph - the only difference is that I am certain about what is causing my frustration.
-Pig-Police
CME_MINI:ES1!
AMEX:SPY
SP:SPX
CURRENCYCOM:US500
DJ:DWCPF

📊When you come to the crypto vs When you really need to comePush the like if you come to cryptomarket at #1 and #4 areas or write a comment if at #2, #3, #5. I bet it will be more likes. Today, i`ll explain you why you need to come at #2, #3, #5 in crypto and most of traders don`t understand it.
As you can see the yellow areas is always the "hype" area when most of the newbees are coming at the crypto market and any other markets. It`s actually not bad because more and more people discover the crypto and trading of crypto.
What is wrong with the bear market? Market is crashing, everithing is bad for short-term for hodlers. But guys, traders can open short trades using futures trading. Essential thing that is potential to earn. At the falling market it`s much less then at the BULL market.
EXAMPLE: if you open a short with x1 leverage even from ATH to the bottom it`s just: +83%, +71%, +70%. If you open the long with x1 leverage or just trade the bull market which start at white areas you can earn +350%, +1300% and it`s just about BTC.
What about the altcoins? They have unexpected % of growth. Most of them grow higher than Bitcoin. Some of them make x10, x50, x100. And it`s only at the BULL MARKETS which start at white areas.
So if you are at crypto now start to study and be ready for the next bull market. Please don't follow the majority and leave the market when everyone else does. Your time will come soon, if you prepare for it well.
💻Friends, press the "like"👍 button, write comments and share with your friends - it will be the best THANK YOU.
P.S. Personally, I open an entry if the price shows it according to my strategy.
Always do your analysis before making a trade.

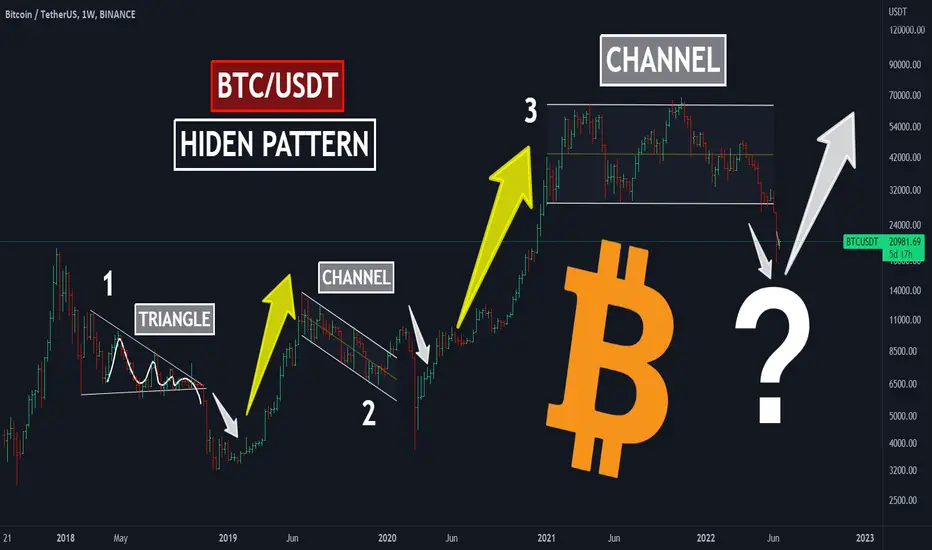
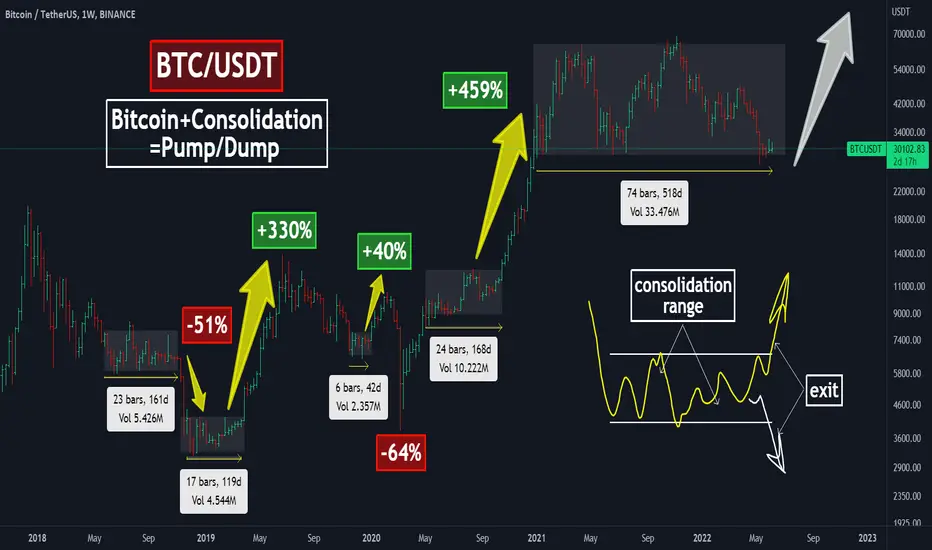
📊Bitcoin HIDEN pattern!Every pattern in trading is created by someone. Why not be the author of the pattern? If you see a succesfull price pattern, you can make a backtest and use it in your trading strategy. In this idea i`ll show you some BTC pattern which the crypto follow for 4-5 years.
This pattern is very simple. After the consolidation the price break the range and fell. After dumpo for 50-60% which is liquidated all margin long traders the price continue it`s rise for XXX%. The key thing is the consolidation for 5-12 months.
Consolidation is the price movement is the range. Price can consolidate not only inside the patterns as it shown on the chart (channel, triangle, etc.), but just inside the price range $10-12k, $18-22k etc.
How does consolidation happen? Consolidation in the price range appears because of the uncertainty of traders in which direction the price will go. When there is conditionally 50% of long traders and 50% of short traders in the market, the price can move only in a narrow range due to uncertainty.
What happens when price breaks through a consolidation? For an example of consolidation, let's imagine that price is a spring. The harder the spring is compressed, the more it bounces back. When the price breaks through the consolidation, it contracts like a "spring" and most often falls by 40-50%, as you can see on the chart.
After such a huge drop and the liquidation of all long traders, price bounces up. Since most long traders became fuel for the fall, now the short traders who wanted to make money on the fall become fuel for the growth. Now it`s the same!
Is the BTC reach the bottom and can start the growth? A lot of traders expect the DUMP to 12-14k and as we know everyone can`t earn, only prepared one.
What the price mark will be the bottom for BTC? Or BTC already there? Leave your thoughts on it in the comments!
💻Friends, press the "like"👍 button, write comments and share with your friends - it will be the best THANK YOU.
P.S. Personally, I open an entry if the price shows it according to my strategy.
Always do your analysis before making a trade.
EURUSD.... SEE WHY MANY PEOPLE LOST THIS TRADE... AVOID ITHello Traders,
So today I am doing a trade recap on a trade I lost due to lack of detail. Note, in trading, after knowing how trading works, every thing comes down to the level of attention/detail you give to your chart.
Detail, detail, detail... never forget.
I have labelled the chart accordingly so your understanding can be seamless. But if you still need clarity let me know.
I use my weekend to analyse why my trade won or lost. And this is an approach to trading that people should undertake. This should come after journaling your trade.
The thing is, you will make mistakes, you will not see everything (detail) but continue. Reduce the number of pairs you trade, reduce the indicators, reduce the trendlines and every other thing... Your chart should be clear and easy on the eyes. I only look at 10 markets (the 7 majors and AUDNZD, CADCHF & EURGBP). I add the 3 crosses only because I want to have alternative for all the currencies excluding JPY. I don't use indicators (not saying it is bad but reduce it), I don't use trendline (because price is moves horizontally - unpopular opinion).
When you have just a few pairs, you are able to understand the moves better and you can free your brain from analysing so many pairs. Just imagine using indicators, lines upon lines, and the market changes form... now you need to start all over again your analysis on all your multiple markets, looking at so many things. Trust me, you are bound to miss the obvious details not to talk of the hidden ones and its a lot of work. I am sure you must have experienced it.
I am still very bullish on EURUSD and right now, I am not looking for an entry, I am waiting for a break of the 4H high then I will look for an entry which I will share on my page.
If you would like to see it, all you need to do is click on follow.
I will also link my previous analysis on EURUSD, AUDNZD, USDJPY
Stay tuned for more.
BR.
David
Daily Breakout Strategy A breakout trader is a type of trader that uses a breakout strategy. This strategy looks for levels or areas that a security has been unable to move beyond, and waits for it to move beyond those levels (as it could keep moving in that direction). When a price moves beyond one of these levels, it is called a breakout.

📊Bitcoin consolidation pattern! Read the description!Hi friends, you've probably noticed that Bitcoin and cryptocurrencies start to rise or fall after consolidation. In this idea I will explain why consolidations happen, how to use this in cryptocurrency market analysis and where the next ATH for Bitcoin will be.
📊What is a consolidation? Consolidation is the small price range. Unlike a bullish or bearish trend, a consolidation is the absence of a trend. As we can see from the chart after consolidations price fall or rise for amazing %. In trading it calls "become volatile".
🔸Why consolidations happen? Actually, consolidations happen because of traders sentiment. If the price don`t move in any side this is bad for most of them. As we know, the biggest part of traders earn on the huge price movements. So when the price start consolidate there are no bull or bear power and price move in the range.
🔸What happend when the price leave the consolidation range? Consolidation is like a spring. The harder you squeeze it, the more it bounces back. It's the same with the price. For example, Bitcoin starts to rise or fall a lot when it comes out of consolidation, the spring rebound, and this has happened in all the examples in Bitcoin's history.
🔸What will happen to BTC next? For more 516 days BTC price is in $29-64k consolidation range. Now we can see the largest consolidation since 2015-2016 before the price reached ATH in 2017.
📈If we follow the rule that the longer the consolidation, the bigger the fall/rise, it's actually hard to predict what will happen next. In any case, Bitcoin will not be able to grow by 5000% in the next bull cycle because of its huge capitalization, but 600-900% growth from global lows ($20-26k) is quite possible.
🚩Traders, what do you think about this pattern? What will be the next ATH for Bitcoin in the next bull cycle based on this rules? Write in the comments, let's discuss it together.
💻Friends, press the "like"👍 button, write comments and share with your friends - it will be the best THANK YOU.
P.S. Personally, I open an entry if the price shows it according to my strategy.
Always do your analysis before making a trade.
A Roadmap Reversal Strategy Using Higher TimeframesHi Purpose Traders. If you've been struggling with reversals and when to use more timeframes to trade them, I created a video for my client Eddie that I wanted to share with you all. He has progressed so much and is overcoming one of the greatest fears most traders have which is relinquishing control over the trade.
I pray this video helps you as well. Be blessed.

📊Why do the trading patterns work?Hi friends! Probably all traders began their career by learning the trading patterns.
A trading pattern is a price movement pattern in a certain range. Generally there are 2 types of patterns: candlesticks (shooting star, hammer, bullish or bearish engulfing) and figures (triangles, channels, flags, head and shoulders, etc.). The number of them is constantly increasing, through the change of market, but there are up to 50 main patterns.
📊So why do the trading patterns work?
The answer is very simple - because many traders use them in trading. Imagine a traffic light with a red light🔴 According to the rules all drivers who have the same signal stand waiting for a green light✅ Here, it lights up and allows all cars to move in the right direction. It's a clear rule, not only in your country, but in all the countries in the world. The situation is the same with trading patterns.
Let's imagine that a chart is a road, and a pattern is a light. The price rises or falls and a pattern is formed. You have determined that it is a bullish pattern, such as a bullish wedge. Of course, you are waiting for the wedge to move to the upper boundary and break it up, that will be a signal to open a trade (green signal to move✅). At the same time, all the drivers (read as "traders") begin buying with you and pushing the price higher and higher.
Why do traders do this? As I said in the beginning, patterns, like the rules of the road, are learned by all traders, regardless of nationality, this is the general rule, that is why these patterns work.
📊In what cases do they not work?
As you know, most people in the market can't be right. Conventionally, if everyone opened a long and bought Bitcoins at $50,000 and the price went up to $100,000, then someone should have bought those Bitcoins from you for 100% more. If everyone held a long, there would be no one to sell and no one would make a profit in the end. That's why there are always 2 sides in trading: buyers and sellers.
With the increasing popularity of patterns, most traders and especially beginners who first study patterns began to open trades according to these rules and .... took a loss. Patterns work especially badly on the cryptocurrency market, which shows how young this market is. But why? All because most cannot be right when trading patterns, otherwise no one would make money.
📊What should I do if I trade only paterns?
I would recommend adding more rules to your trading strategy. These can be different trading tools, filters which will help you to remove "fake" signals and increase win rate. For example, trade not the triangle pattern, but its false breakout using a volume indicator:
1️⃣A false breakout in most cases shows that the price will not go in the direction of the breakout, as there are too many willing to open a trade in the direction of the price movement.
2️⃣The volume indicator will show the actual number of buy and sell orders. If the volume at a false breakdown of the lower boundary of the triangle has increased - this tells us that the price is more likely not to move down, as there is serious support there.
This is the simplest example. You can also use indicators, additional trend lines, candlestick or fundamental analysis.
💻Friends, press the "like"👍 button, write comments and share with your friends - it will be the best THANK YOU.
