day trading forex strategies price action for beginnersIn this video, you will see me analyse my forex watchlists to look for trading opportunities
day trading for forex beginners
day trading forex strategies
forex day trading strategies for beginners
day trading forex strategies price action for beginners
Multiple Time Frame Analysis

day trading for beginners 2022 the ultimate in-depth guideIn this video, you will see me analyze the crypto market from a higher time frame to lower time frame and pick my intraday trades for the day.
If you like this video, like this video and click on the subscribe button to subscribe to me and access more videos like this from me anytime i upload new videos.

📊How to use the VOLUME indicator? Tutorial for traders!The volume indicator is so universal that it is used by most traders, no matter what their trading style. I will talk about the main methods of using this indicator in this idea.
📊What is the volume? A volume indicator is data from the exchange on how much cryptocurrency or shares were traded during a certain period of time. Volumes are displayed in the form of bars. The more bought and sold, the higher the bars on the indicator.
How can I use volumes?
✅Volumes show large trades, which helps to understand the sentiment of the market (bullish or bearish). In this GMT example, you can see how traders bought this coin 4 times and did not "let" the price go lower. After that, you could open a profitable trade on a breakdown of the trend line.
✅Test levels as support. The same principle as in the first example, but here there is a clear test of the level by the price. Volume growth in this case helps you to understand the strength of the buyers and open your trade!
✅False breakout is a situation in the market when the price breaks through a key level for a while and comes back under it. This pattern happens very often in the cryptocurrency market. The volumes grew, which shows a large amount of traded volume, but the price did not go higher and showed weakness, and then Bitcoin fell. Keep this pattern in mind.
✅Divergences. You can see a divergence in the Bitcoin price. Divergence is when the indicator and price values start to be different. As volumes rose, so did the price. After volumes began to fall and the price continued to rise, a divergence formed and Bitcoin fell by 50%. Divergences can be looked for in any cryptocurrency and any timeframe.
✅Indicators. Volumes are a classical indicator, on the basis of which many other well-known indicators are built: VWAP, OBV, etc.
⚙How can I add the volume indicator to the chart? You need to open "Indicators" on the top panel of TradingView and write "Volume" in the search bar. After clicking on the title, it will automatically be added to the chart.
🚩On what timeframes can I use volumes?
Volumes can be used on all timeframes, but it all depends on trading style:
1️⃣ Scalpers watch volumes on lower timeframes: 1m, 5m, 30m. In this way they can identify if the price reacts to a key level, trend line or value zone;
2️⃣ Swing traders use the indicator on timeframes from 1 hour to 1 day. By the same principle as scalpers, you can identify the reaction of other traders to a particular level. For example, Bitcoin has fallen to $50,000 and touched a key level where other traders' buy orders may have been placed. If there were really a lot of bids there, then on the volume indicator, you will see the bars rise as well as price rise. If there was no growth in the bars, it means that most likely the price will fall further.
3️⃣ Long-term traders use the indicator on timeframes from 1 day to 1 week and more. With the help of volumes on higher timeframes, you can identify large liquidation zones on exchanges, important resistance and support levels.
Friends, if you still have questions about how to use the volume indicator, write in the comments. What other methods of using this indicator do you know?
💻Press the "like"👍 button, write comments and share with your friends - it will be the best THANK YOU.
P.S. Personally, I open an entry if the price shows it according to my strategy.
Always do your analysis before making a trade.

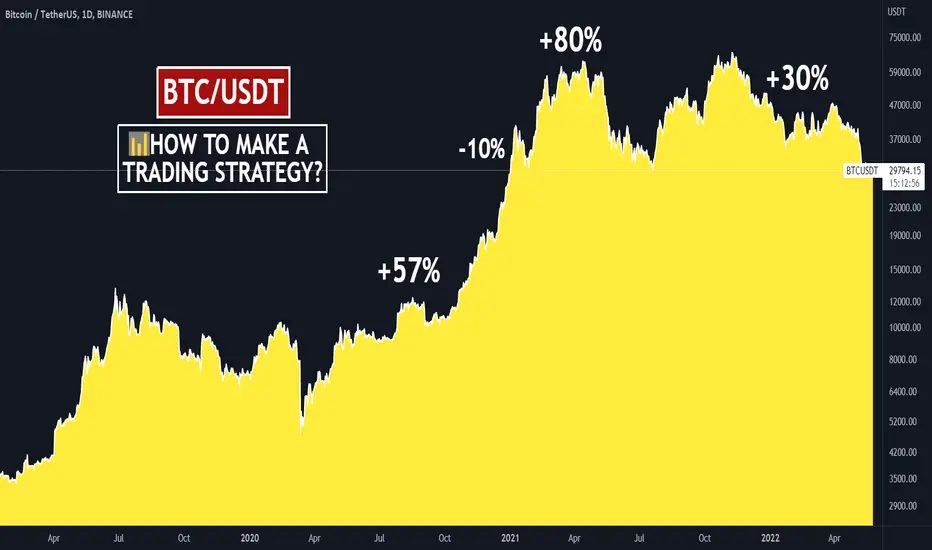
📊How to make a trading strategy?What helps the traders to be successful? That's right, their trading strategies. A trading strategy is a trader's plan for deciding whether or not to open a trade. The purpose of the strategy is to help the trader to make more successful trades, to analyze the mistakes and successes. At a time of uncertainty, these rules help to keep calm and make the right decision. Simply put, it's a set of filters that remove unnecessary noise from the charts and help you make right decision.
💹How to develop a trading strategy? Figure out what you want to trade and what you're best at. Do you like trading false breakouts? Let`s do it! Like to trade patterns? Perfect! Pick your best 20-30 possible trades from the past on the chart, and look for those patterns to repeat on the chart.
As soon as you get a chance to make a trade, remember the rules of your strategy, and if they all match, then do it.
💹What does a trading strategy consist of? This set of rules includes:
1️⃣ The tool you use (patterns, levels, indicators, waves, candlestick analysis, etc.). For example, a squeeze under the trend line, a false breakout of a level, the exit of the indicator into the oversold or overbought zone - all these trading tools can be used in your strategy.
2️⃣ Risk Management. How much money to use in 1 trade, risk per trade. This is a mandatory ingredient of any trading strategy. You can't be 100% right on every trade, so risking all of your capital is not advisable. The average win rate of traders is 50-60%. That means that 5-6 out of 10 trades will be successful - an excellent result. The other 4 trades will be either loss-making or break-even, so it is better to start with a small amount or virtual account on the crypto exchange. In the picture below, you can see what the risk-to-reward ratio and winrate should be.
If you have 50% of successful trades, then at least in each trade you should have RR 1:2 (for 1 risk you receive 2 rewards). To calculate your RR in TradingView, use the "Date and Price Range" section on the left side of the screen and choose "Long Positions" or "Short Position".
✅Example of a trading strategy.
Tools:
🔶false breakout of the key level;
🔶volume indicator.
Description: you marked a key level of $30420 on the chart. After the false breakout you noticed that a large volume appeared on the chart.
Target: the level of highs of $42K.
Risk to reward (RR) 1:5. Good for us? Let's look at the table! The win rate of this strategy is 50% and so RR profitable.
🚩Summary: by opening a trade with a risk of $10, you got $50.
💹Advice for beginners:
1. the trading strategy does not have to be yours. You can take the rules from another strategy and adapt them to you, make your own risk management, rules of entering the trade, in the end, how many trades you make per week or month.
2. start with something simple, like a channel trade and a volume indicator that will show you the reaction of a buyer or seller when it touches the channel boundary. Gradually add filters to remove noise from your charts and increase your win rate. For example, do not open a long on altcoins if Bitcoin is falling. Statistically, 99% of cryptocurrencies repeat Bitcoin's movements, so it is unlikely to be a good trade. Unless you know the secret information, or you have more than 8 years in trading, and you have enough experience.
3. make screenshots of your best and unsuccessful trades, analyze problems and fix them, and try to repeat the best trades more often. A trading journal is best for keeping statistics.
🏁Follow your plan and you will succeed. If you still have questions about how to create your trading strategy, write in the comments. Experienced traders, how did you create your own trading strategy? Share it with the beginners!
💻Friends, press the "like"👍 button, write comments and share with your friends - it will be the best THANK YOU.
P.S. Personally, I open an entry if the price shows it according to my strategy.
Always do your analysis before making a trade.
📉How to stay calm during market crashes?🔋Hi friends! Have you saved your deposit to buy crypto? Markets are falling lower and lower every day. In this idea I will give you some tips on how to open successful trades when the market is bleeding and emotions are taking over.
At the crypto market, such massive dumps happen once in 3 years, but the price sometimes falls by 30% and rises by 500-700%. This is called volatility. Crypto market is still quite young, so it is very high here.
I think it`s an advantage because it`s give more opportunities to traders and investors to grow their deposit faster in compare to stock or forex markets. But if you don`t know what to do during market crashes and stay calm at any markets i`ll share with you some tips:
📈Follow the trend. First and foremost rule. You think you can reverse the price direction by yourself? Unless you have more than $1 trillion:) Why would you fight the market when it can help you? If you don`t know what is trend, please, check this idea. It helps you to identify it on lower (1m-1h), middle (1h-1d), higher (1d-1M) timeframes.
📣Join the trading community. Talk to different traders (scalpers, swingers), investors. Share ideas, keep an eye on other people's trading ideas. This way you'll faster understand your mistakes, raise your win rate and look at trading from different points of view. The human mind is built so that you calm down when you shares your thoughts. Do it!
💹Use the trading strategy. Open trades only when the strategy tells you to do so. If you don't know what a trading strategy is or how to make one, post in the comments I'll do an update for you. Simply put, you need to:
1. Create filters to help you identify future price movement.
2. Use risk and money management. To earn in trading you don`t need to open a trade using all your depo.
🚩Personally, I use: trend lines, squeeze under them, mark key levels, volume and horizontal volume indicators, track the market manipulation. There are many trading tools - find your own or borrow someone else's and adapt to yourself and your psychology.
👶If you are new to the market and this is your first experience, trade on a virtual account or try to start with 1% of your capital. If you can't make $200 from $100, how can you make $20,000 from $10,000?
🏁The statistics says that only 1% of traders make profit, 9% trade at breakeven and the other 90% lose money. Be the 1%, learn, read, develop and stay calm!
Friends, press the "like"👍 button, write comments and share with your friends - it will be the best THANK YOU.
P.S. Personally, I open an entry if the price shows it according to my strategy.
Always do your analysis before making a trade.

Differences in Philip & CHoCH Scenarios
When an area is immediately broken we will have ( CHoCH ) . When an area on the opposite side is consumed and the price returns, we expect the area that caused the failure to be consumed at the time trigger.
When an area reacts but cannot break the surface, we have ( FILIP ) . When the price breaks the opposite areas and consumes one and returns, we expect in the time trigger to consume the area that caused the failure.
Continued ENTER
Two modes occur.
We either lost the Filip or ( CHoCH ) scenario and are waiting for it to return.
Or a high time zone is broken by a lower time trigger where we expect orders to continue flowing.

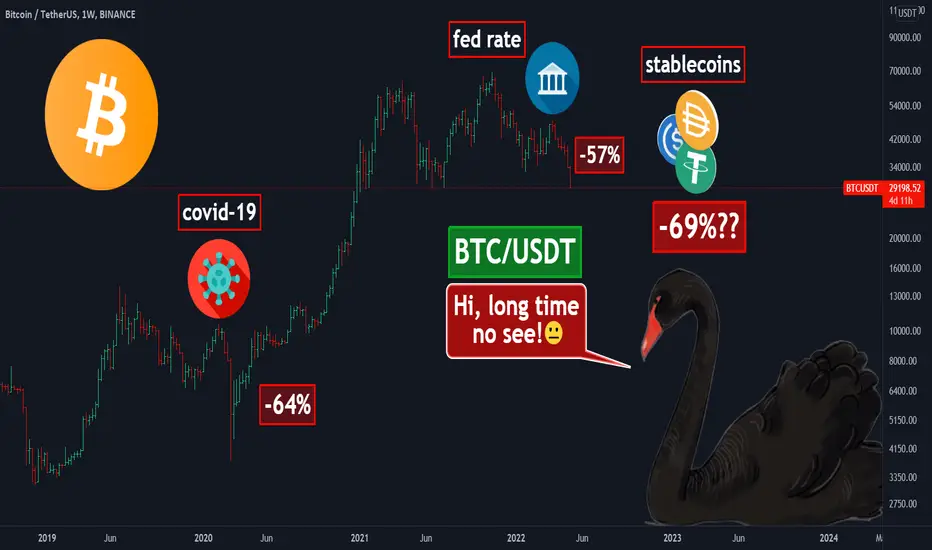
❗Black Swan by stablecoins. Threat or opportunity for traders?Hi friends! If it heppen to one UST is it heppen to another stablecoins? Next trigger for BTC dump can be caused by stablecoins instability. In this idea i`ll show you some facts about it!
🦢Black Swan. The last Black Swan in all financial markets happened in 2020 because of Covid-19. The crypto market fell by 64%. After the bull market, the Fed Reserve started raising the interest rate, BTC fell by 56%.
What if all the stabelcoins are not secured by anything? If previously the fall of cryptocurrencies was caused by global cataclysms, now we can expect the first black swan only for the cryptocurrency market.
With a EXTREME fear in the market and panic sales of retail traders, BTC could fall to $22k or lower.
📊Stablecoins by Market Capitalization:
1. Tether (USDT) - $83B
2. USD Coin (USDC) - $48.5B
3. Binance USD (BUSD) - $17.1B
4. Dai (DAI) - $6.9B
5. TerraUSD (UST) - $6.9B
Total: $169.4B
❗It`s almost 10% of TOTAL Crypto market Capitalization (169.4/1400).
💱We all know what happened to Luna and UST stabelcoin. US Treasury Secretary Janet Yellen pushes for stablecoin regulation by end of year. Even if the LUNA and UST recover to their previous price, a lot of attention will be focused on other stablecoins as well. On the other hand, this is positive for the crypto market and market players, as crypto security will increase.
✅Friends, if you don`t know what to do when BTC fall by 60-75%, check this idea! I made an educational idea for you when BTC was $39k. It describes 3 ways how you can identify the bottom of the market for BTC and Altcoins!
Friends, where will Bitcoin bottom price? $20-22k or lower? Or BTC already find the dip and go to renew ATH? Share your ideas in comments!
Friends, press the "like"👍 button, write comments and share with your friends - it will be the best THANK YOU.
P.S. Personally, I open an entry if the price shows it according to my strategy.
Always do your analysis before making a trade.
📊How to use Volume indicator to identify the BOTTOM?...and finally buy the right BTC and ALTs dip!😊
Hi friends! Lots of traders buy crypto at the ATH or close to it in hope to make 10x,100x etc. Is it possible and how to do it more succesfull? In this idea i`ll share with you some methods that can realy help you to:
🔶 identify the bottom of the market
🔶 use the volume indicator in right way
🔶 get crypto at a discount
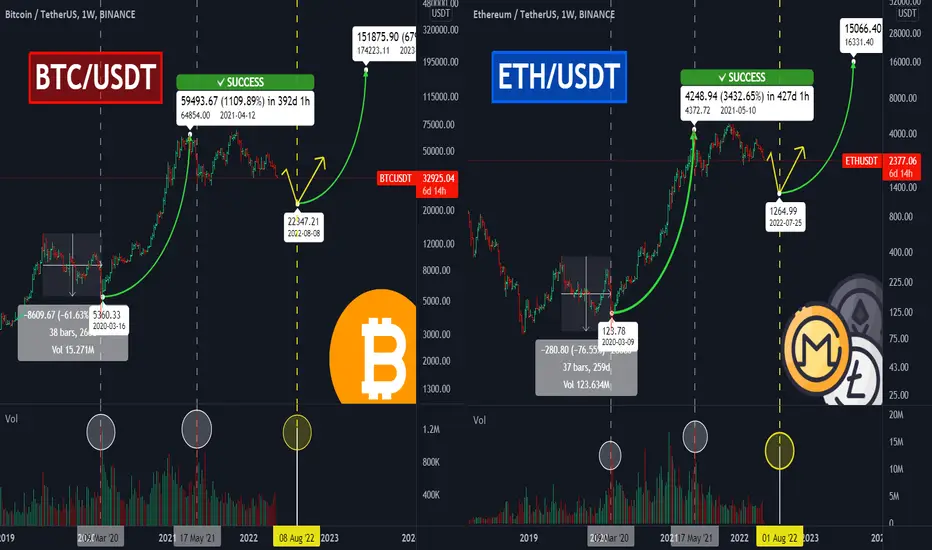
1. Identify the bottom of the market. Already in several ideas I explain you how you can identify the bottom of the market, and traders shared their ideas in the comments also. We will not stop for a long time around all the methods, you can read about them in this idea and in the comments below it.
💹In this idea I will talk about the fundamental method of how to identify the bottom - liquidation . Liquidation is the process when the exchange takes traders' money to cover losses of a long or short. This can happen if you use leverage in trading and do not use risk and money management. 'Cascades of Liquidations' happen when the price falls without any stops by 30-50%. This is a result of not enough buyers in the market to hold the price and as the price drops, more and more leveraged positions get liquidated - it's like a snowball effect🏂 I've seen this in 2018, seen traders who entered the crypto market in the spring of 2020 and most recently in 2021.
2. Use the volume indicator in right way. Why do I use a volume indicator? It's very simple. This is an indicator that shows where a big players open or close their trades. 🚩If a huge liquidations have happened, someone has sold a lot and someone has bought a lot. Why? Just as DOM and Footprint help to identify whale buying or selling orders, so the volumes show the amount of money traded and help to identify liquidations. Also, it can be used at different timeframes to see whales' willingness to buy or sell at key levels, trend lines and other trading instruments. Volume is a real representation of the number of trades.
3. Get crypto at a discount. If you wanted to buy Bitcoin at 60k, why when it drop by 70% you don't want to buy it? Or altcoin, which is down by 95%? A simple example, when you go to the store you want to buy a car with a discount . If there are two identical Lambos🚙 which cost $250,000 and $100,000, why do you want to buy the one that costs more? Ask yourself this question. This is not financial advice, just a comparison of facts and explanation of traders psychology.
✅As we can see on the chart, the last time after such a massive liquidation in 2020-2021, Bitcoin and Ethereum rose by 1100% and 3400%. For example, Binance Coin (BNB) rose by 6460%, Cardano rose by 11400%. Also, after the last liquidations in 2021, there was a good ALTSEASON, when Bitcoin grew by 100%, and all Altcoins by more than 300%.
🏁My personal advice if it`s happen again:
1. Remember about your risks and money management.
2. Use your strategy and don`t panic. You need to just wait for good entry point.
3. Use VOLUME indicator like an additional tool. This indicator can help you to identify the bottom, but not to do all the work for you.
💻Please write in the comments if you still have the questions about the liquidations or Volume indicator! I`ll try to explain you additional tips 🎇
Press the "like"👍 button, write comments and share with your friends - it will be the best THANK YOU.
P.S. Personally, I open an entry if the price shows it according to my strategy.
Always do your analysis before making a trade.
DAY TRADING STRATEGY USING TOP DOWN ANALYSISIn this video i walk you through my day trading strategy from higher time frame to lower time frame.
In the video, you will discover;
How to day trade
How to analyze the market from a higher time frame to a lower time frame
How to pick the best trades that win.
How to mark your support and resistance.
How to follow the trend and many more.

SWING TRADING STRATEGY AND TOP DOWN ANALYSISIn this video i revealed my secret swing trading strategy used in taking profitable trades.
You will learn;
Swing trading strategy
Top down analysis
Multi-time frame analysis
Price Action
Best entry strategy.

🚩How to identify the bottom and BUY the crypto in time? 3 tips!🌟How to BUY crypto in time and with the possible highest RETURN? The correct answer is during the capitulations.
🎯Capitulation is when even patient and experienced traders start to panic, but this is the opportunity time (Jan 2015, Nov 2018, Mar 2020, May 2021).
🔶How to buy crypto during the capitulations? Use the dollar cost average (DCA) strategy. This strategy allows you to buy crypto by parts without risking all of your capital.
🔶How to use DCA strategy? This strategy helps to average the BUY price. You can only sell at the top and buy at the bottom by accident. In real life, this strategy helps to average the buy price of a crypto. For example, back in 2019, you bought Bitcoin 3 times at $3,000, $4,000, and $5,000. The average purchase price in this case is $4,000. If the price go lower, you would average the price, if it rose, you already bought at a good price. Also, you can BUY at the weekly candle close during the capitulions. It is important to use the equal parts of the capital to buy (1/10, 1/20 etc.). Another simple example is shown on the chart😉
🔶How you can identify a capitulation?
1. Look at the volumes and record liquidations as shown on the chart. The liquidation of 50-100k Bitcoins is the best indicator.
2. Look at the percentage of drop from the highs. Historically, a price drop by 65-80% has been the bottom of the market.
3. Use the indicators that show the bottom of the market. Read this idea about the 🔋Greenwich indicator. It shows both the top and bottom of the market. So when BUY signals (green diamonds) appear, you can use this indicator to buy crypto by parts.
🔶Why does the DCA strategy work? Bitcoin, like U.S. stock markets, is in a long-term Uptrend. After buying Bitcoin in 2017 at its ATH ($18-19k), investors are now still at +100% profit. And as long as this trend is not broken this strategy will work. For example, the U.S. stock market has been in uptrend for over 80-90 years.
💻Please write in the comments if you still have questions about the DCA strategy or how else you can identify the bottom. What methods do you use for that? 🎇
Press the "like"👍 button, write comments and share with your friends - it will be the best THANK YOU.
P.S. Personally, I open an entry if the price shows it according to my strategy.
Always do your analysis before making a trade.

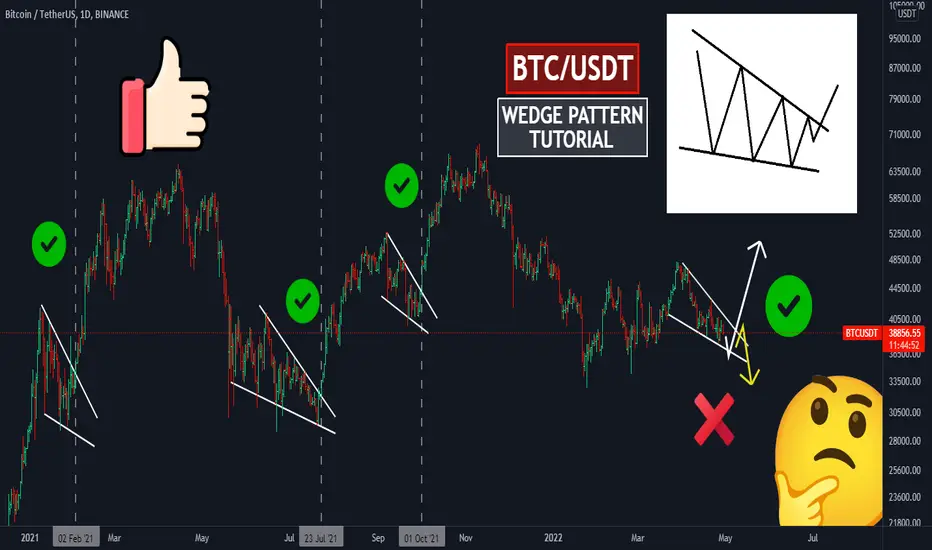
🎯BTC: Real Life wedge trading! Tutorial for traders!🌟 The picture of the wedge pattern is beautiful, but you have to understand how to trade in Real Life! In this idea I will try to teach you how to enter the trade and what to look for. The descending wedge is a bullish pattern. On the chart you can see how it works on Bitcoin. Over the past year, it has worked well in 3 out of 3 trades.
🎓What is the wedge? Wedge is the price consolidation in downtrend or uptrend. So if it`s UPTREND, the price making higher highs and higher lows. The whales in this case sell higher and higher. Ascending (uptrend) wedge is bearish pattern. So If it`s downtrend the price making lower highs and lower lows. The big players try to hunt trader stop losses to get the liquidity for their LONG positions.
🚩Let`s start from the May-July 2021 wedge! In addition to the descending wedge, there are several triggers to open a long:
1. false breakout (liquidity collection) of the $30K key level. A lot of stop losses were collected, a lot of traders were liquidated. The whales were happy. Additionally, pay attention to volumes as well as liquidation volumes.
2. squeeze under the upper boundary of the wedge and test it as support. Here you can open a trade during the squeeze under the trendline and after test it as support. It`s better to check at lower timeframe.
All this added up to a long two-month consolidation with stops losses hunting and Bitcoin DUMP by 50-55%. Many traders simply lost faith and closed positions at a loss.
The price rose by 50-60%, but if you had closed the trade on the next Dump, you would have a profit at least +30-35%.
🚩Next is the Sep 2021 wedge! In this case we didn't see big liquidations, the whales had enough liquidity, and everyone who shorted on this 23% drop became the fuel🔥 for further growth. Additional triggers:
1. a trend change. The price trend changed from a downtrend to a small consolidation and then started to create higher highs and lows.
2. squeezing under the local trend line on lower timeframes. If you switch to the 1 hour timeframe this is clearly visible.
3. test of the global and local trend line as support and growth without pullbacks (strength of the bulls).
We close the deal as soon as the target is reached. If you continued to hold the trade for more than 10 days, the profit would be at least +30%.
🚩 Will the fourth wedge break up(4/4)? During this Apr 2021 wedge, we have not seen the huge liquidations yet. Also, we haven't seen bullish strength, squeezes under trend lines or levels. Therefore, we should wait for our entry point and don`t open trades without the confirmation of the trading strategy. I'll share with you my local ideas later.
🌐Globally, the market has been in a $30-67k consolidation for more than 1.5 years. Sooner or later the price will choose the trend and maybe even in the next few weeks.
🔥Trading is the combination of trading tools, using filters and non-standard methods, which I try to explain in my training ideas.
Friends, press the "like"👍 button, write comments and share with your friends - it will be the best THANK YOU.
P.S. Personally, I open an entry if the price shows it according to my strategy.
Always do your analysis before making a trade.
Two types of Candlestick Patterns that you need to make moneyIn this video, I explained in detail the two most important candlestick patterns that you will ever need to make money from the financial market consistently.

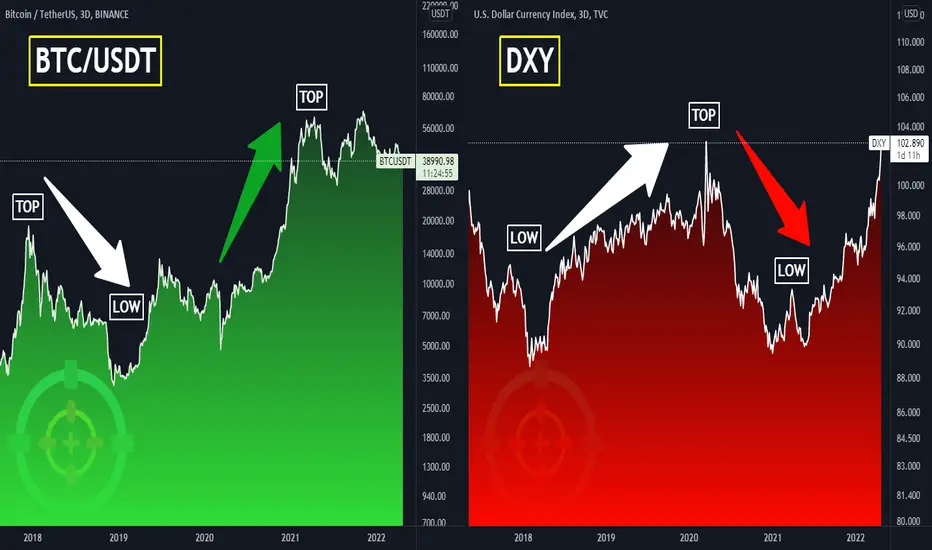
🎯BTC & $US index: the secret combo for traders!📊Bitcoin is rising while the dollar is falling and vice versa. Today I will use the simple examples to show the pattern that helps to identify the trend of Bitcoin for many years.
The instruments that we need:
🔶Bitcoin is the #1 cryptocurrency, the first and foremost crypto-asset, our favorite grandpa. Bitcoin's movement is copied by 99% of all crypto, it is the main indicator of the crypto market.
🔶DXY - U.S. Dollar Index. It was created in 1974 and shows the ratio of the US dollar to the basket of six other major currencies: euro, yena, pound sterling, Canadian dollar, Swedish krona and Swiss franc. The index essentially shows how strong the U.S. dollar is.
💡I've taken a few cycles as an example to make it easy to understand this principle. For the example, I don't take data up to 2017. At that time Bitcoin was with the small capitalization and a big HYPE. You're not interested in perfect examples, but in real experience and usage, aren't you?
So, the first cycle of 2017-2018 shows us that:
1. as soon as the index started to fall🐻, Bitcoin had an active bull run.
2. when the index hit lows it was almost Bitcoin's tops.
The second cycle of 2018-2020, Bitcoin spent in a huge consolidation and two corrections of -70%🐻 What was the index doing this time? Of course it was rising! Only after the last fall of Bitcoin in 2020, it was able to recover and continue its rise to the new ATH!
In the third cycle of 2020-2021 Bitcoin was able to grow to $63-67 thousand due to the unprecedented weakness of the dollar. Now Bitcoin is in consolidation and even the mass adoption and hype around crypto is not help BTC to renew ATH.
🏁The dollar was weakening amid huge inflation and Bitcoin was rising, but when the FED began raising the interest rate and investors began to transfer money from Europe to the United States, the index began a new bull run. You saw an example of what happens during an index bull run. Therefore, we should expect an active phase of Bitcoin growth at the moment when the FED rate hike ends (the end of August) and geopolitical issues will be solved😉
Friends, press the "like"👍 button, write comments and share with your friends - it will be the best THANK YOU.
P.S. Personally, I open an entry if the price shows it according to my strategy.
Always do your analysis before making a trade.
BTC: Real Life mirror level trading! Tutorial for Beginners!💡A mirror level is a level that price tests as support and resistance several times. It helps to open long or short trades on a test of the level. Usually the mirror levels are numbers like 100, 1000, 50,000, which traders pay attention to. It can also be previous ATHs, important global levels that can be easily identified. Price bounces off of them because a large number of traders pay attention to it.
I have marked 2 global mirror levels for you:
1. $10101
2. $41950
On the chart I have marked tests of these levels. Also, on the chart you can see several short (+63%) and long (+59.7%) trades.
Now I give you 2 tips on how to open a trade using the mirror level:
🔶open a trade with a pending stop order. When the price is testing the level as support you can put a stop order to buy, and when it's resistance you can put a stop order to sell
🔶open the trade after the close of the candle. Once you are sure that the level has held the price as support or resistance you can open a trade
📑Based on the statistics, you can see that longs are more profitable. This is because Bitcoin and cryptocurrencies are growing 80% of the time. But you can calculate the statistics by yourself and consolidate your new knowledge!
🎓Also you can read the basic desription about Real Life channel trading in this educational idea!
✉Friends, if you still have questions about using the mirror level, write the comments or to the DM!
Press the "like"💟 button and share with your friends - it will be the best THANK YOU.
P.S. Personally, I open an entry if the price shows it according to my strategy.
Always do your analysis before making a trade.

GMT Repeat Same history as AXS infinity. GMT Repeat Same history as AXS infinity did.
AXS highest price was $166 per coin at that time Market cap was 9.75B of USD. Huge number
GMT current price is $3.16 with a market cap of 2B of USD. That means if this coin repat same history it could make an additional 5x. To reach a 10B market cap.
I think We can trade this coin during significant pullbacks because so many people bought a LOT of coins during IEO.
at $ 0.01 per coin rased $ 4,200,000. That means every dollars is made 321.98x ( +32,098.1% ) of profit.
PRIVATE sale. Price per coin was $ 0.005. Raise $ 5,000,000. Current RIO 643.96x ( +64,296.1% )
Friends, it's huge numbers. That means when the lock-up period will end part of people will sell their coins to the market.
that's why when u trade ALWAYS use STOP Losses. And book your profit as i mentioned in a video.

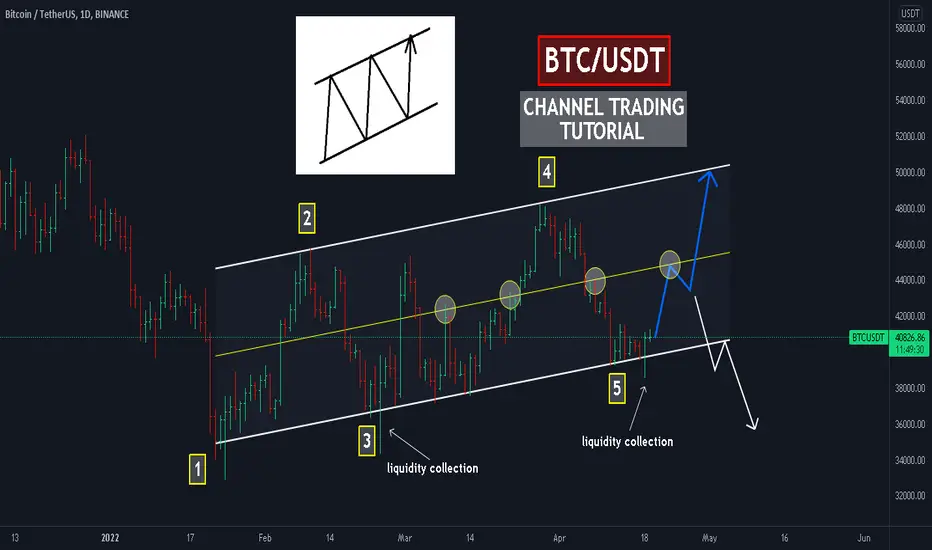
BTC: Real Life channel trading! 3 tips for beginners95% of beginners don't understand why patterns don't work as it shown in the books. That's why losses, stress, and worries appear. The point is that only practice and personal experience will help you understand how to use it correctly.
I will give you a few secrets how to trade in the channel successfully:
1. after testing the borders of the channel, wait for a false breakout or liquidity collection. At point 3 and point 5, there was a large collection of liquidity, after which you can open a LONG. You can see the result by yourself (+28%).
2. Pay attention to the key levels and value zones - combine instruments.
2.1. At point 4 there is a large value zone of $46-47k, which became a resistance. Combined with the upper boundary of the channel, it was a strong resistance zone, which means price is sure to bounce off. We saw a 20% drop!
2.2. At point 5, there was a large value zone of $37.5-40k from which the price also bounced off. The lower boundary of the channel+value zone was a major support for price. Not bad?
3. The middle of the channel. On the chart, we can see that it is often tested as resistance/support. An additional opportunity to open a trade.
Be crafty, use trading tools in combination with each other and you will notice results immediately.
Friends, press the "like" button, write comments and share with your friends - it will be the best THANK YOU.
P.S. Personally, I open an entry if the price shows it according to my strategy.
Always do your analysis before making a trade.
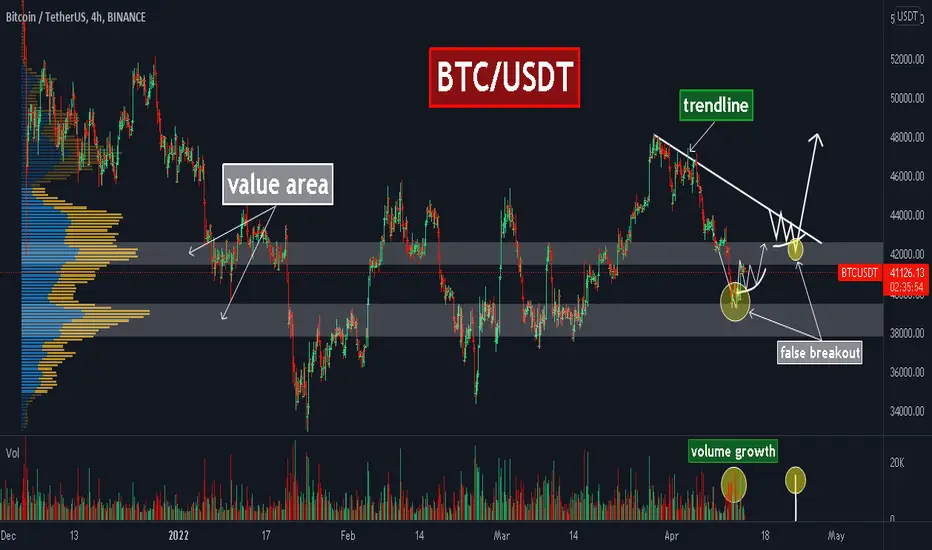
BTC: identified the bottom with VOLUME PROFILE! How to use it?
As we expected, Bitcoin tested the $37800-39600 zone. But how could you predict this? You have to use the volume profile.
A volume profile is close to horizontal volumes (bottom panel), but using them, you can indicate:
1. value areas(support and resistance)
2. liquidity gaps
This indicator is easy to apply, it is in the left sidebar in the "Prediction and Measurement Tools". You can use it to indicate the value zones in ANY crypto/stocks/currency.
Why does it work? The volume profile is a real value data and that's why the price reacts to it most of the time. Similarly, you can use the DOM and Footprint in real time to track the value zones and reversal points for price. If you have questions about it, write in comments or to the DM!
Right now we expect an upward move on Bitcoin:
1. The price has started to squeeze under the $41400-42700 value zone, which shows buyer strength.
2. Volumes have also increased. BIG VOLUMES=BIG PLAYERS.
3. Short traders who opened trades on the fall will be the FUEL for the upward movement.
Friends, press the "like" button, write comments and share with your friends - it will be the best THANK YOU.
P.S. Personally, I open an entry if the price shows it according to my strategy.
Always do your analysis before making a trade.
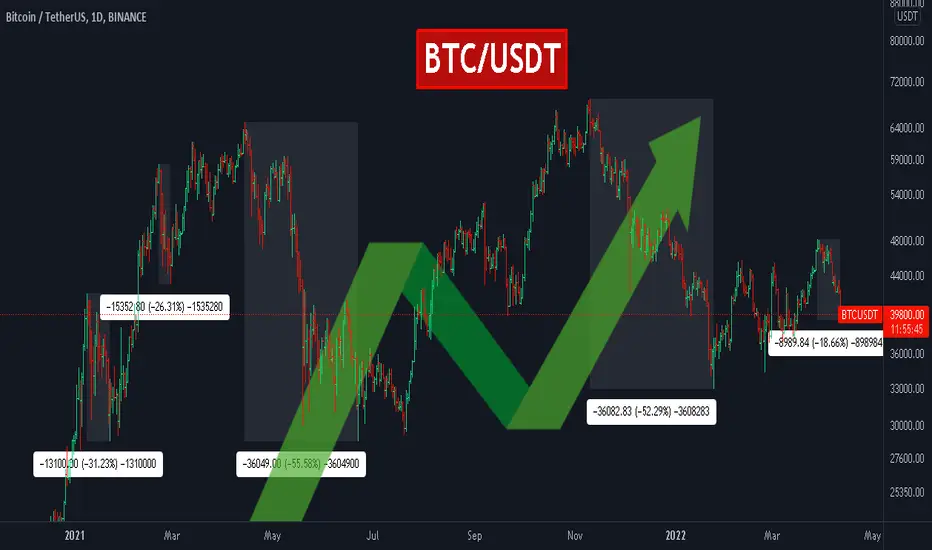
Bitcoin: 2 trading tips for BEGGINERS!Bitcoin has been in a $30,000 to $67,000 global consolidation for more than a YEAR. You can see on the chart that Bitcoin was down -31%, -36%, -58%, -25%, -52%, -19%. If you use a leverage larger than x2, you could be liquidated multiple times!
Do you want to increase your deposit? Use risk and money management! These are simple rules that help to calculate the risk of your position and the amount of money to buy CRYPTO.
For example, Bitcoin price is $40k and you see a sqeeze under the trend line. Knowing that 60% (6/10) of the time such trend lines break UP, you can divide your capital into 10 parts and buy Bitcoin for 20% of your money with a target of +25% to $50k. That way, the chance of losing your money is minimal (-1-2%) and the profit will be +5% to capital. If you have $10,000, you will earn +$500 per trade. Not bad, don't you think?
In addition, you can also use the short positions, it means to earn on the falls. To do this you:
1. have to understand the basics of trading
2. need to have a desire to study and earnr
This is a short and basic description of risk and money management principles. Trading is easy, but knowing the basics is essential.
If you still have questions how to use the RISK and MONEY management to increase your profitability - write in the comments or to the DM .
Friends, push the like button, write a comment, and share with your mates - that would be the best THANK YOU.
P.S. Always make your analysis before a trade.
AXS, how to trade using KEY LEVELS? FREE education!Key Level. How can a common tool help you to earn more? Let's take Axie Infinity (AXS) as an example!
A key level is a local minimum or maximum. It can be clearly marked after a BIG price movement up or down (points of extremum). Key levels are often the price of 1, 10, 50, 100 dollars, because many traders pay attention to this numbers.
On the chart we have marked two key levels:
1. lower (for longs) - $44.68
2. upper (for shorts) - $72
When to open a trade:
1. on a test of the key level as support or resistance;
2. on false breakdown of the level.
IMPORTANT: IN BOTH CASES, VOLUMES MUST INCREASE! It`s an indicator that a big player opens a trade too!
Using the KEY LEVELS you could earn: +62%, +62%, +38%. Risk to reward for these trades from 1:7 to 1:14(!). It's a good statistic, right?
If you still have questions how to use the key level and what tools can be used to increase your profitability - write in the comments or to the DM.
Friends, push the like button, write a comment, and share with your mates - that would be the best THANK YOU.
P.S. I personally will open entry if the price will show it according to my strategy.
Always make your analysis before a trade.

BTCvsS&P500! Is volatility the key to SUCCESS?Bitcoin versus the S&P500! Why is volatility so important?
Volatility is always an opportunity for the trader and investor. But what is it?
Volatility is the ability of price to change in % over a period of time. Buying Bitcoin and the S&P500 at the same time close to the lows you would earn +$400 and the S&P500 +$130. The same with short positions. Volatility helps a trader to earn more!
The price of Bitcoin has been very dependent on the S&P500 lately. Bitcoin is down by 52% from its ATH and up by 47%. The S&P500 is down by 14.6% and up by 13%.
Why such different changes in price and how to make money on it? It's all very simple! The total value (capitalization) of the S&P500 is about $40 trillion. The value of all Bitcoins is about $0.9 trillion. Let's imagine that the S&P500 and Bitcoin gained +1 trillion dollars to their value. The S&P500 price would rise by +2.4% ($41 billion) and Bitcoin by more than 100% ($1.9 billion).
I have been in trading for a very long time and I can tell you that your INCOME depend on your skills. If you have a trading strategy, use trading tools, money management and risk management, you can earn more.
Friends, if you still have questions, leave a comment or write to DM!
Friends, press the "like" button and share with your friends - it will be the best THANK YOU.
P.S. Personally, I open an entry if the price shows it according to my strategy.
Always do your analysis before making a trade.

Is SHIB in the ACCUMULATION phase? Identifying the WHALES!Shiba Inu (SHIB) is one of the most popular project of 2021. After the accumulation phase, it rose by about 1000%!
Now the token has dropped by 70% of its ATH and has been consolidating for about 2 months. Could this mean the beginning of a new growth phase?
Accumulation phase is the purchase of cryptocurrency by BIG players to sell higher to the retail investor.
There's not a lot of HYPE around this token right now. Retail traders who have lost 20-50% of their money are starting to sell out in a panic. At this time, the BIG players buy the available tokens from the market to sell higher to new traders who will come on the next HYPE. The same situation as it was in 2021!
It is important to say that if Bitcoin starts its drop, then altcoins will drop too.
Is this really the accumulation phase and we close to RENEW the ATH? We will only know after some time, but we already see the signs of accumulation phase on the chart.
Friends, press the "like" button, write comments and share with your friends - it will be the best THANK YOU.
P.S. Personally, I open an entry if the price shows it according to my strategy.
Always do your analysis before making a trade.

The importance of confirmationsHey Traders,
How many times in your trading career have you had a set up that you are so confident in and is so clean that you just enter it without checking for confirmations? How many times have you seen price retract into a demand or supply area with so much force that you simply think it cannot go wrong? This trade setup right here is a prime example of why it is so important to check for confirmations and ensure that the lower time frames are indicating exactly what you want to see prior to entering a trade and not entering a trade out of fear of missing out and buying as soon as the price dips into a demand zone. Let me know in the comments if this relates to you or you've ever had an issue like this.
The analysis on the four hour had me very confident once we had broken over the recent highs. We indicated after a very long and steady downtrend that we could potentially start seeing a movement to the upside. Once we did get a clear structure break, it was followed by a strong push to the downside in which I like to call The Archers pullback. Price retraced straight back down into our demand area, which means we ticked step one and now we were looking for step 2 and Step 3.
As you can see, looking at the one hour chart, we had a steady downtrend formed prior to having a strong news release which pushed price down into the demand zone. Once we had this trendline formed, what I simply wanted to see was an area of consolidation, potentially a descending channel. Then a break of this trend line followed by a pull back followed by a break of structure down on the 15 minute. But what you can notice is as we have this trendline drawn an we dip into the demand zone, that price didn't break the trend line. It simply went sideways and did form a descending channel, but to the point where we broke the recent demand and set a lower low. In turn, it made this analysis invalid.
It is highly important that with all trade setups like this, especially trading the higher time frames, that we dive into the lower timeframes to ensure that the demand or the supply is entering the market the way we're anticipating so we can trade the distance with confidence. If we do not wait for confirmations then we are sitting blind and entering what you would call FOMO trades. Entering with much higher risk. As we can see here, price can just rip straight through these areas and we must be prepared to not take trades. If we were to enter blindly into these areas, this trade would of resulted in a loss on the account.
Do you find this analysis helpful? Should we chat more about this in the future?
