GbpUsd Daily Chart : Long Idea, Bull Flag Pattern looks like we have some resistance around the 1.33 area we need to get through
Multiple Time Frame Analysis


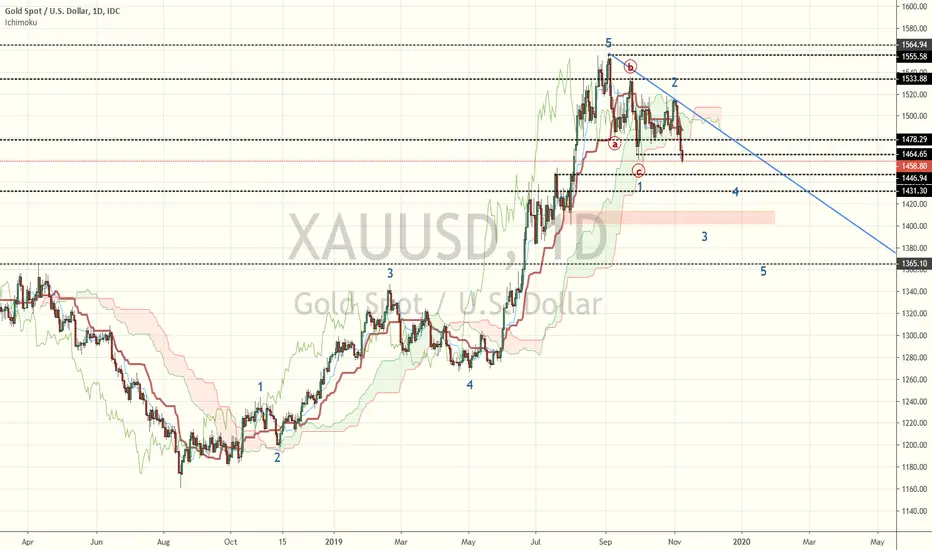
GOLD Trade Plan (11 ~ 15 Nov 2019)Ichimoku Trends:
Weekly Trend: Bullilsh - clear
Daily Trend : Bearish - clear
H4 : Bearish - clear
H1 : Bearish - clear
Remarks:
W1 and D1 trends contradicting. Bigger TF in sideway. Look for lower TF to trade. Refer to EW possible counting.
Trade Plan:
1- Long at support level near 1459 and take profit at 61.8 (near 1493) of D1 small wave.
2- Wait support breakout and retest before going short.
Setup invalid if :
Hit SL for long entry
Breakout Kumo H4 for short entry.
Target : 1493 for long. Wave 3 for short.
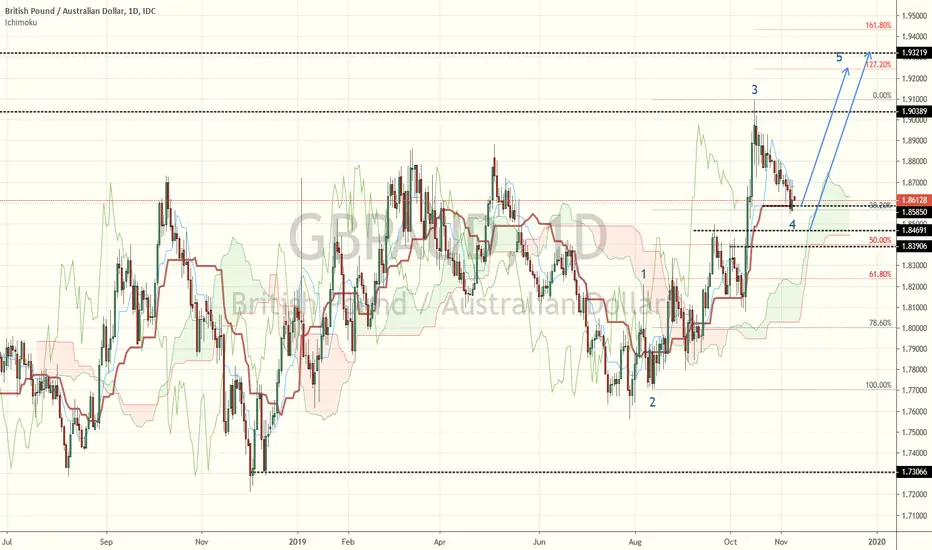
GBPAUD Trade Plan (11 ~ 15 Nov 2019)Ichimoku Trends:
Weekly Trend: Bullish - Strong
Daily Trend : Bullish - At Support Level
H4 : Bear - At Resistance Level
H1 : Bullish - At Support Level
Remarks:
To trade according to W1 and D1 trend.
Trade Plan:
1- Wait for resistance at 1.8700 breakout and retest resistance become support.
2- Enter long at H1 support near 1.8600 and SL 10 to 20 pips below it.
Setup invalid if : Price break and close below H1 kumo.
Target : Next resistance level 1.8800 or Wave 5 with multiple entry using lower time frame.
structure , supply and demand, timeframe correlation, price actistructure , supply and demand, timeframe correlation, price acti
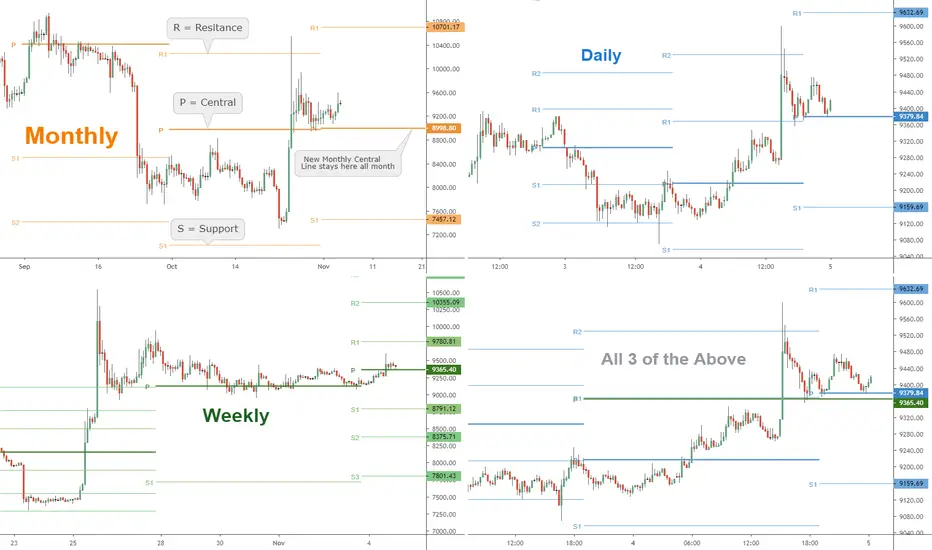
BTC.USD "Pivot Points" in action: If have ONE indi, this is it !What is a Pivot?
The word "Pivot" is used a lot, meaning many different things.
What I am showing is the ''Old-School'' definition of that term.
This "indicator" has been in use since 1970's with great results.
Pivots are as simple as this:
(H+L+C)/3 of the previous period = Center Pivot (P) in current period.
The 'Support' ( Sx ) and 'Resistance' ( Rx ) pivots are calculated based on above equation.
There are many variations used, but ''Traditional'' is the first, and I think most commonly used.
Some very cool aspects:
Pivots do NOT repaint, they are plotted at period beginning and stay till end.
Backtesting is easy, change "Historical Pivots" setting as far back as you want.
Clutter free, Interpretation free, Labor free, and best of all, for FREE on TV :)
What do they tell you?
They seem to make good TARGETS for a move, and often lose energy there.
Many traders will look to take profits at a Pivot , which is obvious in above chart.
Strength of a trend can be gauged by which Pivots the asset is hitting most often.
Who uses them?
Many, many traders still use them, as do Banks and Money Managers.
Swing traders looking for Daily, Weekly, or Monthly trades, set and forget.
Even Fibonacci fans such as myself will glance at the Pivots to get a bearing.
How to Deploy them?
Back in the day Pit Traders had index cards with Pivot Points (values).
Trading View has a free indicator "Pivot Points Standard" which I use.
For a detailed Tutorial on How to Use Pivots, see these Ideas below:
Chapter 1 : Intro and Setup
Chapter 2 : Adding "Mid Pivots"
Chapter 3: Plotting Future Pivots
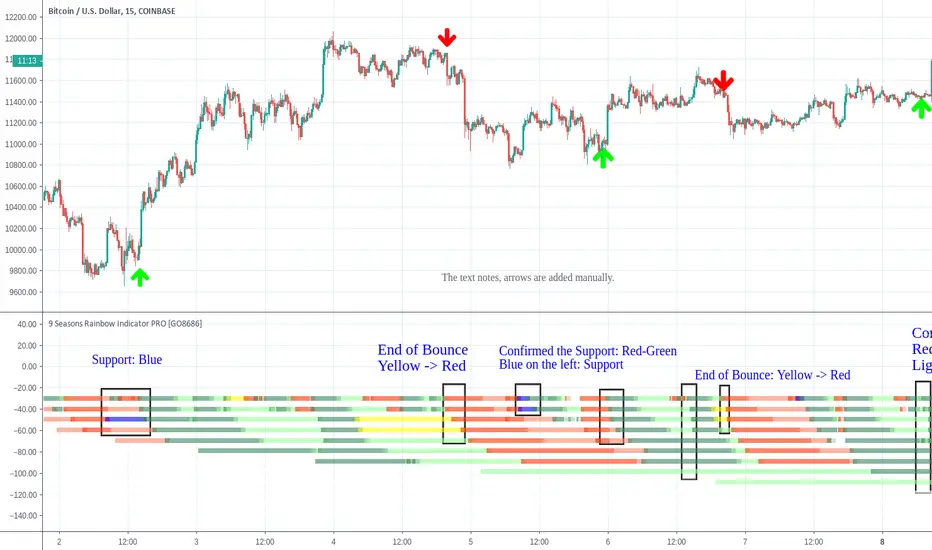
Bitcoin Trade Signals Review 15M Since 2019 July to 2019 Oct 25BITMEX:XBTUSD
COINBASE:BTCUSD
BINANCE:BTCUSDT
Timeframes on Ribbons: 15m -> 12H
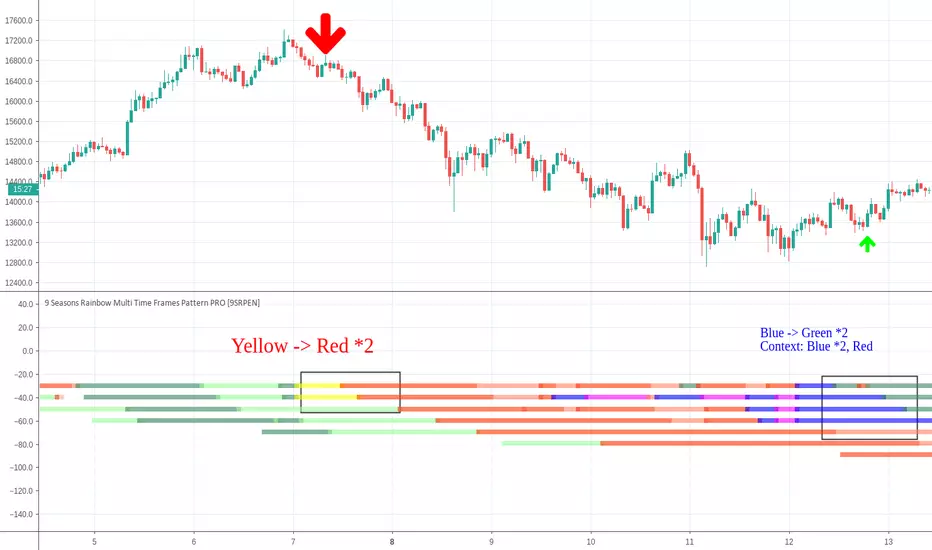
Indicator: 9 Seasons Rainbow Multi TimeFrames Pattern
This Tutorial Idea Indicates some important trading signals of Bitcoin given by the indicator since 2019 July to 2019 Oct 25, in order to help users of the indicator learn how to identify opportunities.
Signals Pattern
Trigger in Short Term: Ribbon 1 - Ribbon 3/4
Context: Ribbon 3/4 - Ribbon 12, which is the most outstanding ribbons with priority: Yellow-Blue, Lime-Purple, Red - Green, else.
Some Typical Trigger Signals :
Long:
Yellow -> Lime: Breakout
Blue -> Green: Reverse
Purple -> Blue: Fading Breakout downward
Light Green / Red -> Green
Short:
Blue -> Purple: Breakout downward
Yellow -> Red: Reverse
Lime -> Yellow: Fading Breakout
Light Red / Green -> Red
I appreciate your like or comment. Welcome to share your idea here.
PM the author for a free trial of "9 Seasons Rainbow Multi TimeFrames Pattern".
DISCLAIMER
This idea is only a personal opinion and does NOT serve as investing advice NOR as trading advice.
This idea, "9 Seasons Rainbow Multi TimeFrames Pattern" indicators, and all related contents are for the purpose of trading strategies studying or paper trading.
If a user or a customer uses any of these related contents for live trading or investment, she/he should take all risks.
The Gold Method Ichimoku Weekly reviewThis week was our first in the Training room for The Gold Method Ichimoku.
First, I want to thank those who participated and for all their hard work and effort this week. Working with you guys was an absolute pleasure and I look forward to continuing our relationship, so you achieve your goal of becoming Professional traders.
Here are the quick Stats for our 4 days together:
1 winning trade
2/3 loosing trades (discussed below)
1 Flat trade
1 No trade day
Pips won: 138
Pips Lost: 51.8
Here is a day by day breakdown:
Monday we closed our trade flat as all indications were the market was going to move against our position. This trade was reviewed on Wednesday with the conclusion being that while it was a good trade set-up, either a slightly larger stop or a more conservative pullback level could have been used to make this trade successful.
Tuesday: We did not meet
Wednesday: We took a GBPCAD Breakout trade that failed for -26.8 pips
Thursday: We could not find a high probability trade set-up, so we did not take a trade.
Friday: We had 2 Type 1 Trades on GBPCHF and GBPJPY with both Breakout and pullback entries. The Breakout trades were triggered at the European open. Some traders took GBPCHF, others took GBPJPY and some, including myself split my risk-based position between the two. That is why it listed as 2/3 losing trades
Unfortunately, as shown above the breakout trades on both pairs failed.
However, the pullback trade on GBPJPY triggered at 8:44 a.m. GMT (4:44 a.m. edt) and ran to it’s profit target for a + 138 Pip gain. Since the training room ended approximately 30 minutes before the pullback trade triggered only slightly more than half of the class took the trade. I take responsibility for not making it clear that the pullback trade was still viable. That is on me and I will make that up to you guys.
For the week, since I risk 2% per trade, I ended the week with a 7.7% gain and while those who caught the GBPJPY pullback trade ended similarly, I want every trader in the room to experience those gains.
Sincerely,
Allen Gold

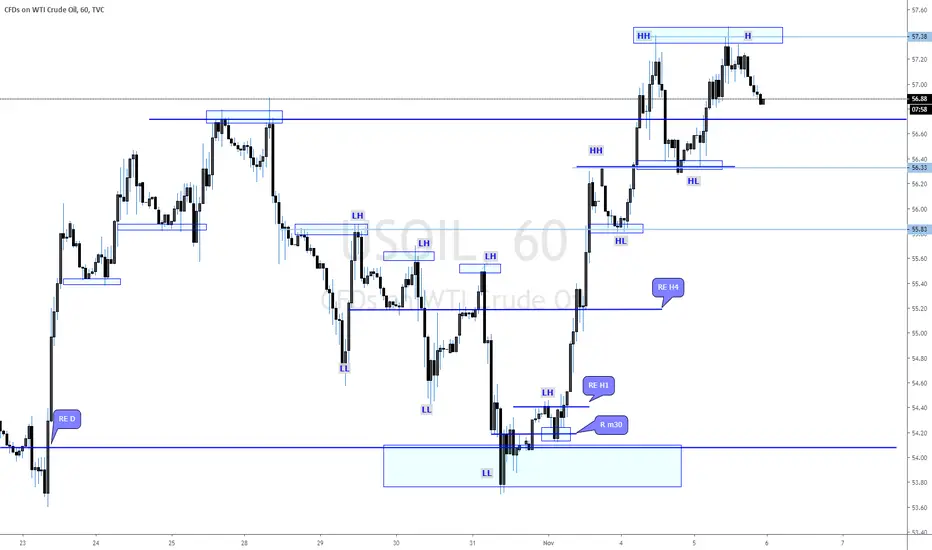
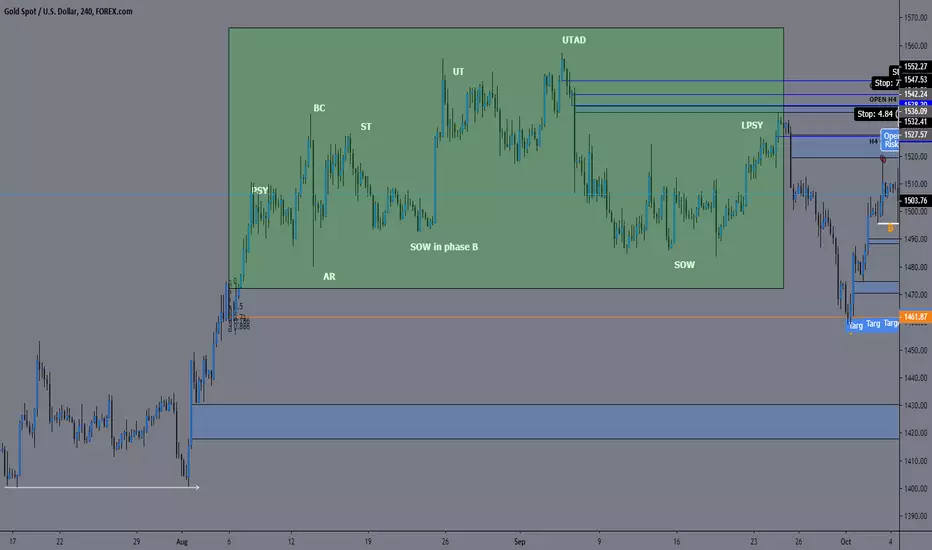
XAUUSD WYCKOFF DISTRIBUTION EXAMPLEHello traders,
we would like to share some value knowledge, about structure based mostly on Wyckoff schematics. As an example u have marked up area identify by us as Wyckoff distribution schematic to help u get deeper understanding about markets and printed structure itself. Please, scroll left and right chart to see multiple examples of accumulation and distribution schematics. Hopefully this will help u get some breakthrough in your trading journey.
God bless u all.
USDCAD WYCKOFF DISTRIBUTION EXAMPLEHello traders,
we would like to share some value knowledge, about structure based on Wyckoff schematics. As an example u have marked up area identify by us on 5m TF, to help u deeper understanding about markets and printed structure itself. Hopefully this will help u get some breakthrough in your trading journey.
God bless u all.

GBPNZD WYCKOFF SCHEMATICS EXAMPLESHello traders,
we would like to share some value knowledge, about structure based mostly on Wyckoff schematics. As an example u have marked up few areas identify by us on multiple TF to help u deeper understanding about markets and printed structure itself. Please, scroll left and right chart to see multiple examples of accumulation and distribution schematics. Hopefully this will help u get some breakthrough in your trading journey.
God bless u all.

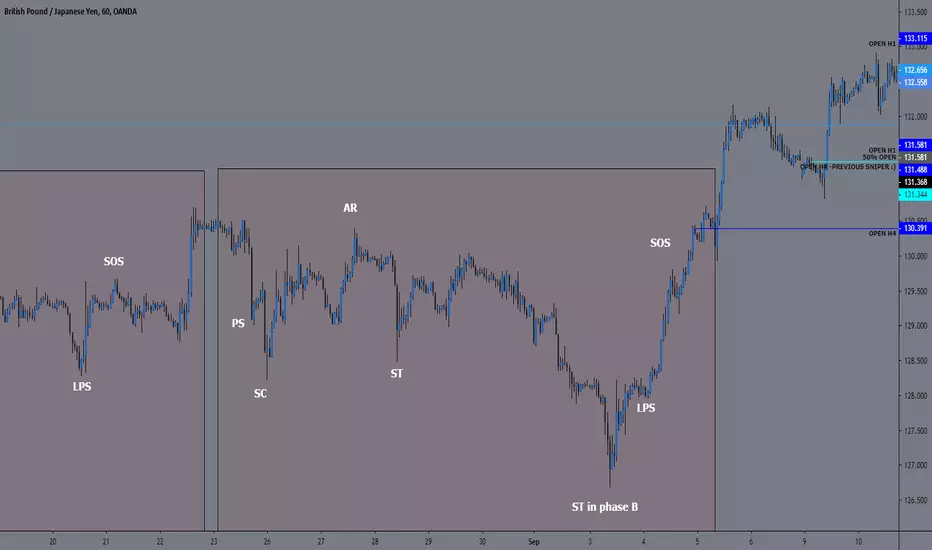
GBPJPY WYCKOFF SCHEMATICS EXAMPLESHello traders,
we would like to share some value knowledge, about structure based mostly on Wyckoff schematics. As an example u have marked up few areas identify by us on multiple TF to help u deeper understanding about markets and printed structure itself. Please, scroll left and right chart to see multiple examples of accumulation and distribution schematics. Hopefully this will help u get some breakthrough in your trading journey.
God bless u all.
EURNZD WYCKOFF SCHEMATICS EXAMPLEHello traders,
we would like to share some value knowledge, about structure based mostly on Wyckoff schematics. As an example u have marked up few areas identify by us on multiple TF to help u deeper understanding about markets and printed structure itself. Please, scroll up chart to see multiple examples of accumulation and distribution schematics. Hopefully this will help u get some breakthrough in your trading journey.
God bless u all.

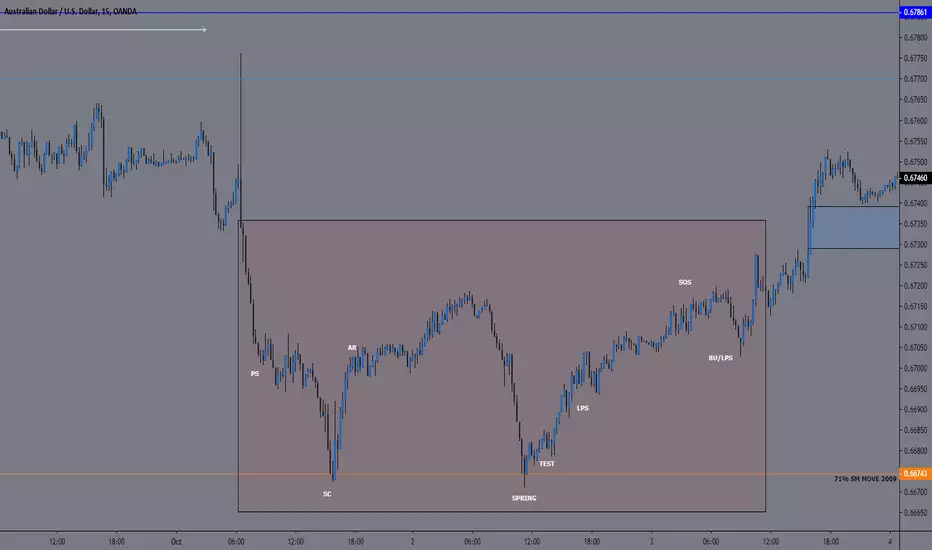
AUDUSD WYCKOFF ACCUMULATION SCHEMATIC EXHello traders,
we would like to share some value knowledge, about structure based mostly on Wyckoff schematics. As an example u have marked up few areas identify by us on multiple TF to help u deeper understanding about markets and printed structure itself. Hopefully this will help u get some breakthrough in trader journey.
God bless u all.
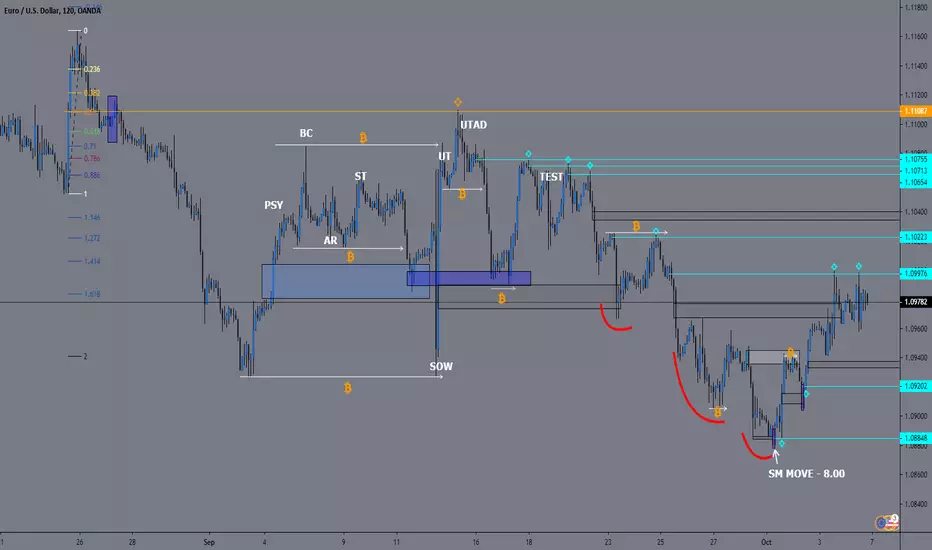
EURUSD - ex. of WICKOFF ACCUMULATION for DISTRIBUTION 4/10/2019HELLO TRADERS!
EXAMPLE HOW SMARTMONEY ACCUMULATE TO DISTRIBUTE MORE.. AS U CAN NOTICE WICKOFF ACCUMULATION SCHEMATIC WAS IN THIS PLAY..
ALL LIQUIDITY AS ABOVE SO BELOW WAS PICKED UP BY SMART MONEY ON WAY DOWN, NOW SINCE WE START OCTOBER, AND DXY HAS DROPPED, THEY PUSHING PRICE HIGHER TO ACCUMULATE TO DISTRIBUTE MORE...
CHECK OUT LAST EURUSD MARKUPS WITH SM CONCEPTS ATTACHED BELOW... THERE IS STILL A GAP FROM 2017 WHICH WE EXPECTING TO BE FILLED IN NEAR FUTURE..
GOD BLESS U ALL!
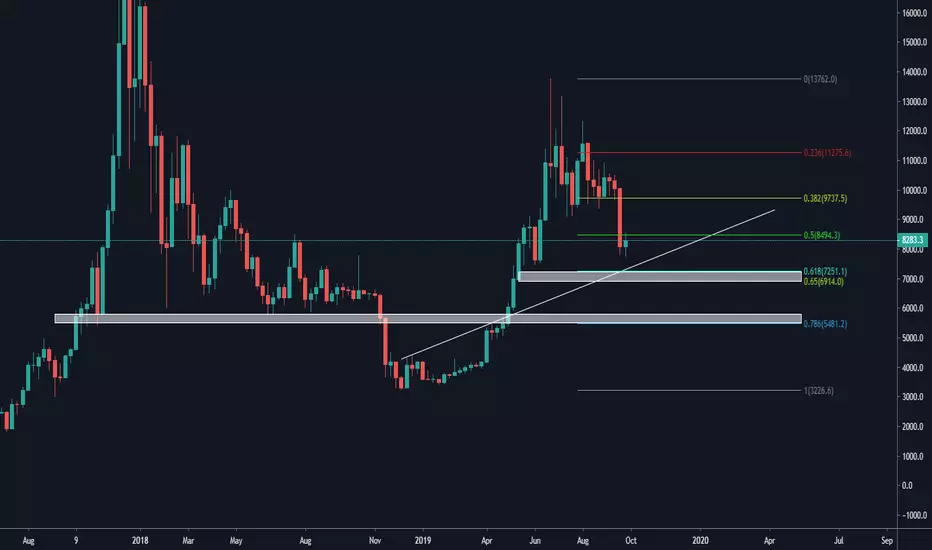
BTC : Trend line and key levelsHello fellas, Let's we start about the analysis podcast about bitcoin which is very important right now. so, sit tight and read this analysis carefully.
This is the weekly chart. And just like the title of this current article, we will discuss about the key levels and trend line on bitcoin. Let's make trend line at the first topic to discuss in this first paragraph. Connecting the high of the December 27th candle and the high of April 8th candle will produce an extended trend line that is now acting as a support trend line. Like what I've always said, even we have broken out of previous resistance trend line, in the future there will be an action to retest again the previous resistance trend line to become a support and vice versa. Currently, we see it clearly occur on current bitcoin's chart. And what's make it more interesting is the trend line is moving align with the golden pocket zone which act as a support too. With those facts above, we clearly see current support trend line is very significant on current bitcoin's movement.
And to anticipate the wick fishing region, I will give the 78.6% fib level as a perfect label for wick fishing region. This is make sense to me, if we see back at 2017 and 2018 which most of the investment instrument had a bounce right after they corrected the major trend at around 78.6% region. Beside it, if we look back at the historical data, we can easily see the $6000 - $5000 region was a really strong support during the 2018 consolidation market.
On every trade, it is important to anticipate the wick fishing region. because there will be a room for liquidation on short or long before it is going to claim the real major trend.
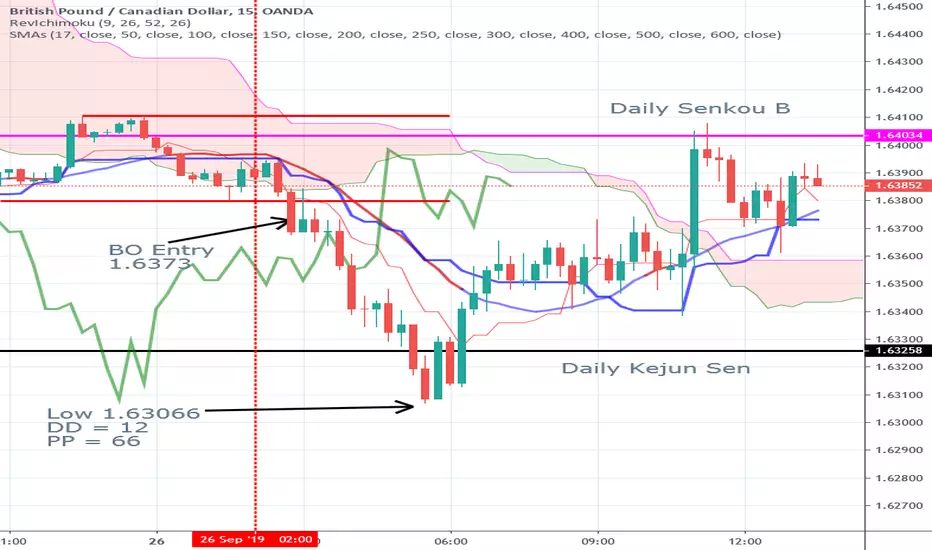
How to be a Successful Forex trader Segement 12Ichimoku Daily Levels:
The ichimoku Daily levels are like stone walls. price hits them and stops. As you can see above price came down to the Daily Kejun Sen (black line) at 1.63258 and reversed.
You could have placed a buy order at that level with the following parameters:
Entry: 1.6325
Sop: 1.6295
Risk = -30 pips
profit target = 1.6403 (the daily Senkou B)
Reward = + 73 Pips
RRR = 2.43 - 1
that trade would have hit the Profit target for + 73 pips
with a draw down of 19 pips
You could then take a stop and reverse trade at the Daily Senkou B
which would have been good for + 42 pips with a drawdown of only 5 pips.
Although the daily Ichimoku levels are very powerful, the only issue is the amount of trades.
Moreover, I would point out that you only want to trade the level the first time and reaches it.
hope you guys like the post.
Also I would like to thank everybody who has pre-ordered my new book which will be published this Monday September 30th.
Those who have pre-ordered, will be receiving their copy tomorrow afternoon ( Friday September 27).
In fact, from all the support I have gotten while working on the book has made me even more precise and focused resulting in one of my best performance months ever.
Accordingly, I felt compelled to give a little love in the book to everybody who has pre-ordered the book, because it has in fact raised my game.
I can't wait to work with each and everyone of you and assist you in becoming professional traders.
warm regards,
Allen
DXY Daily Chart : Technical AnalysisMessage to learn more about how to trade the basket pairs with this chart

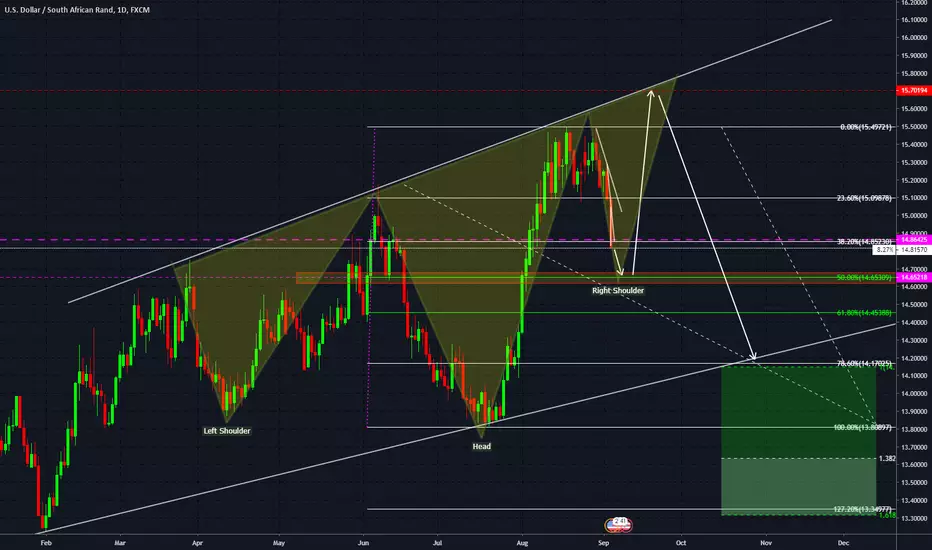
USD/ZAR Purely for Educational Purposes - Price Action StudyPlease note, this idea is for educational and demonstration purposes and does not constitute a trade idea or a signal. The entire idea is much too far out to predict. As such, this is a study. Trade at your own risk. To demonstrate please note the following:
1. This pair has seen an extended bull run. Given this we can expect the market to adjust itself by way of experiencing at least a 50% to 61.8% retracement of the entire previous swing before continuation back up to higher prices.
2. You may ask.....Continuation back up? If we keep fundamentals in mind (remember we do not trade based on fundamentals, but technicals, but we keep the fundamentals in mind), is the rand yet ready to strengthen to prices under 14.5?
3. We see an inverse head and shoulders possibly forming. The continuation up could possibly put us on track to previous highs and beyond, given the fundamental sentiment of the market.
4. We also see that price is being contained with an ascending channel. Price could reach 14.2 before year end, especially if we see strengthening of the rand. This would result in a double top formation.
This is strictly for educational purposes. Study, study, study price action along the way! Trade at your own risk. Follow me on Instagram and Facebook (see links below) for more updates along the way!
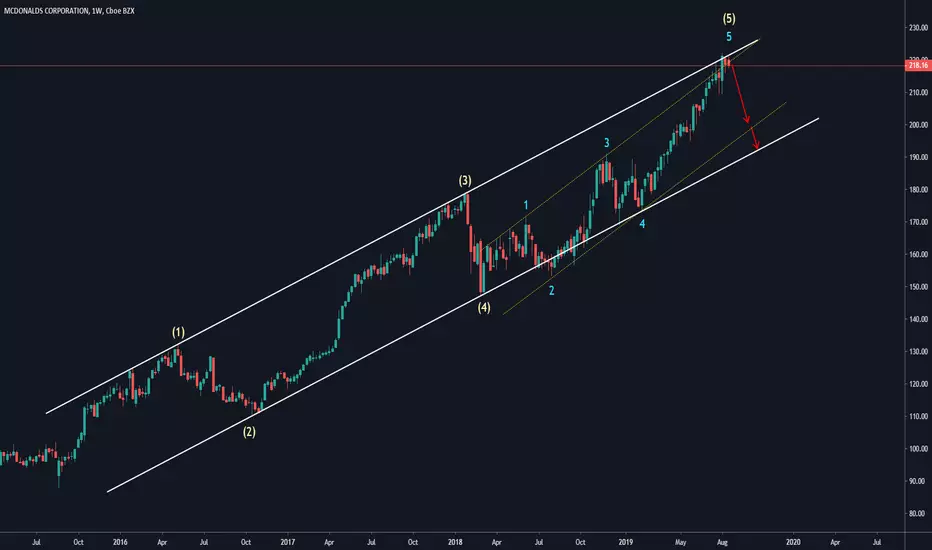
Applying Elliott Wave Theory on MC DONALDS by ThinkingAntsOkToday we will Use Elliott Wave Theory as a method to bring extra information to the chart, remember that this is a tool that must be combined with other trading analysis methods, and the final objective is to bring a clear framework for decision making. We will give a Real example on MC DONALDS chart, Elliot Wave Theory was developed by Ralph Nelson Elliott by observing the behavior of the Stock Market. This is a complex Theory, if you are interested in learning more about this, we recommend Robert Balan´s Book "Elliott Wave Principle"
Remember the Basic 3 Rules of Elliot Wave Theory:
1) Wave 2 will not retrace past the starting point of wave 1. If the impulse waves are going up, wave 2 cannot go below the origin of wave 1. If the impulse sequence is going down, wave 2 cannot exceed the peak from whence wave 1 originated.
2) Wave 3 can not be the shortest of the "impulsive waves". Wave 3 is not necessarily the longest, but it is almost always the longest
3) In an upward sequence. Wave 4 cannot overlap the peak of wave 1. In a downward sequence, Wave 4 can not rally above the bottom of Wave 1. If any of these combinations is violated the particular sequence is not impulsive in nature.
Another important concept is that Markets are Fractals by Nature, that means that the structures that you find on a 1D chart, for example, will be replicated on lower timeframes like 4HS. This Rule keeps going independently of the timeframe you are working on, the same happens on a 1H chart and a 10 minutes Chart. That's the reason you will see different symbols on the Elliott Count on this Example.
Observe how we can make a new Count on the 5th Wave we see on the Weekly Chart (is composed by a new 12345 full count). And if we go to the Daily chart, we can make a new count over the 5th wave of the 5th wave, I know this might sound complex but when you take the idea of Fractals, this process becomes really logical.
In this case, Elliott Wave Theory will tell us that all the Cycles are completed, if we combine this with price action for example (using trendlines) we can see that also the price is against a major trendline that is working as resistance, and the last Item will be the Divergence on MACD. This doesn't mean that the price will go in that direction, but if we have to put our money on something, for sure you want to do it in the strongest direction of your analysis.
Hope this Educational post is Usefull for People interested in Elliot Wave Theory.
Thinking Ants
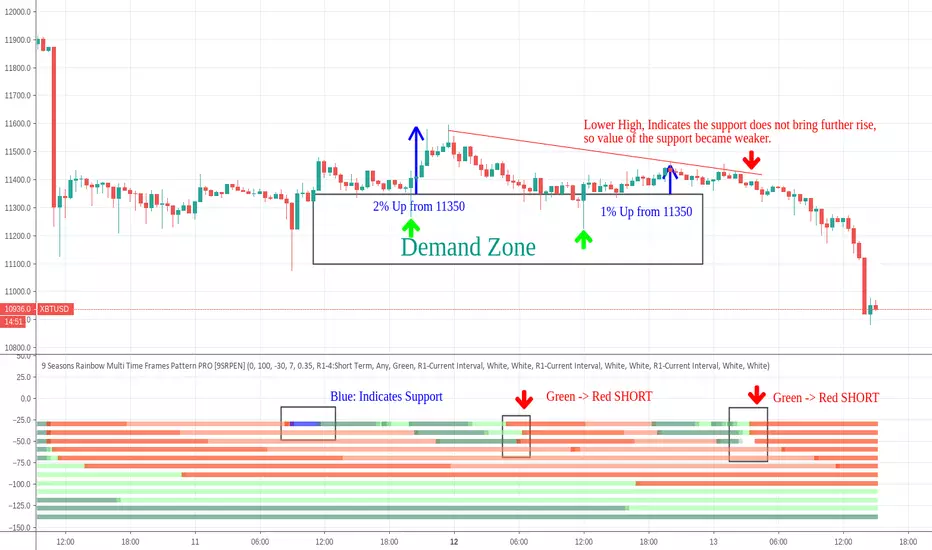
When A Support Does Not Generate Further Value 20190813ukA support may bring two possibilities, Reverse or Continuous Drop.
A method to judge the change of validation or strength of a support: rise percentage the support generates, if % decreases, the value of the support is weakened.
As shown in the chart, the Blue in 30M indicates the support. From the support, there were two bounces:
1st 2% rise from 11350
2nd 1% rise from 11350
The lower High Indicated the support did not generate more value.
Considering the big trend is down, the breakdown is high probability event, so the support should not be taken as a Demand Zone any more after two bounces. Instead, a short trade may be placed when the second bounce ended ( Green -> Red after the Lower High)
Indicator: 9 Seasons Rainbow Multi TimeFrames Pattern
Signals
Blue: Support
Blue -> Green -> Red: A cycle of Support -> Bounce -> End of Bounce
Green -> Red with a Lower High: Short Trade Entrance
I appreciate your like or comment. Welcome to share your idea here.
PM the author for a one-week free trial of "9 Seasons Rainbow Multi TimeFrames Pattern".
DISCLAIMER
This is only a personal opinion and does NOT serve as investing NOR trading advice.
Please make your own decisions, carefully assess risks and be responsible for your own investing and trading Activities.
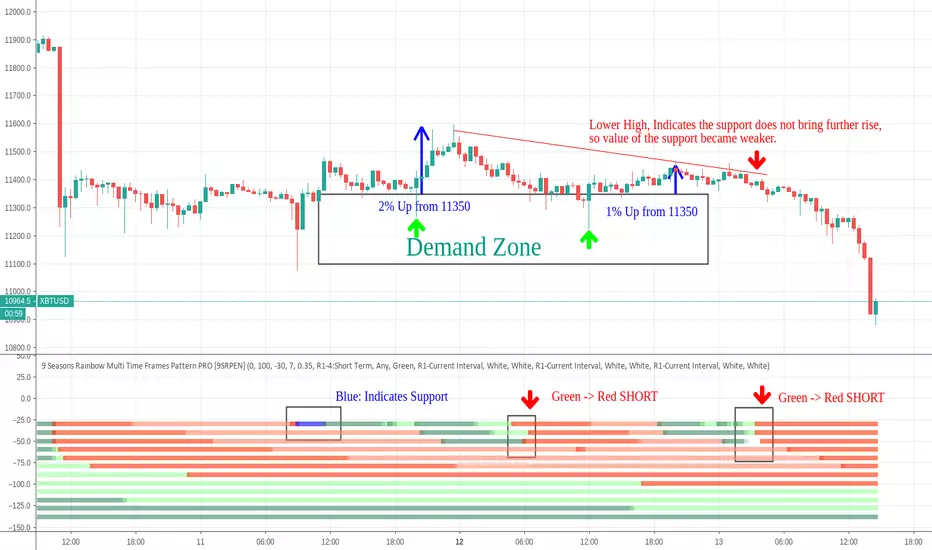
When A Support Does Not Generate Further ValueA support may bring two possibilities, Reverse or Continuous Drop.
A method to judge the change of validation or strength of a support: rise percentage the support generates, if % decreases, the value of the support is decreased.
As shown in the chart, the Blue in 30M indicates the support. From the support, there were two bounces:
1st 2% rise from 11350
2nd 1% rise from 11350
The lower High Indicated the support did not generate more value.
Considering the big trend is down, the breakdown is high probability event, so the support should not be taken as a Demand Zone any more after two bounces. Instead, a short trade may be placed when the second bounce ended ( Green -> Red after the Lower High)
Indicator: 9 Seasons Rainbow Multi TimeFrames Pattern
Signals
Blue: Support
Blue -> Green -> Red: A cycle of Support -> Bounce -> End of Bounce
Green -> Red with a Lower High: Short Trade Entrance
I appreciate your like or comment. Welcome to share your idea here.
PM the author for a one-week free trial of "9 Seasons Rainbow Multi TimeFrames Pattern".
DISCLAIMER
This is only a personal opinion and does NOT serve as investing NOR trading advice.
Please make your own decisions, carefully assess risks and be responsible for your own investing and trading Activities.
Bitcoin Trade Signals Review - 1H Since 2018 Jan To 20190730ukBITMEX:XBTUSD
BITSTAMP:BTCUSD
BINANCE:BTCUSDT
Timeframes on Ribbons: 1H -> 45H
Indicator: 9 Seasons Rainbow Multi TimeFrames Pattern
This Tutorial Idea Indicates some important trading signals of Bitcoin given by the indicator since 2018 January, in order to help users of the indicator learn how to identify opportunities.
Some Typical Trigger Signals:
Long:
Yellow -> Lime: Breakout
Blue -> Green: Reverse
Purple -> Blue: Fading Breakout downward
Short:
Blue -> Purple: Breakout downward
Yellow -> Red: Reverse
Lime -> Yellow: Fading Breakout
Signals Pattern
Trigger in Short Term: Ribbon 1 - Ribbon 3/4
Context: Ribbon 3/4 - Ribbon 12, which is the most outstanding ribbons with priority: Yellow-Blue, Lime-Purple, Red - Green, else.
I appreciate your like or comment. Welcome to share your idea here.
PM the author for a one-week free trial of "9 Seasons Rainbow Multi TimeFrames Pattern".
DISCLAIMER
This idea is only a personal opinion and does NOT serve as investing advice NOR as trading advice.
This idea, "9 Seasons Rainbow Multi TimeFrames Pattern" indicators, and all related contents are for the purpose of trading strategies studying or paper trading.
If a user or a customer uses any of these related contents for live trading or investment, she/he should take all risks.