XRP SeekingPips reminds himself STICK TO THE PLAN, XRP LONG ONLY
I would consider the following as a GOLD STAR LESSON TO BE SAVED.
Yesterday created a great reminder opportunity that you must have a PLAN & RULES.
Even SeekingPips is human and therefore sometimes will deviate from the plan.
The GOLD SECRET is to realise the error and get back on track as soon as possible.
I was very clear on the chart share on 01/01/2025 that I only wanted to accumulate XRP
Here is the copy of that paragraph :
"ℹ️ However whilst price remains above 2.10 USD I do not want to take the short side of XRP."
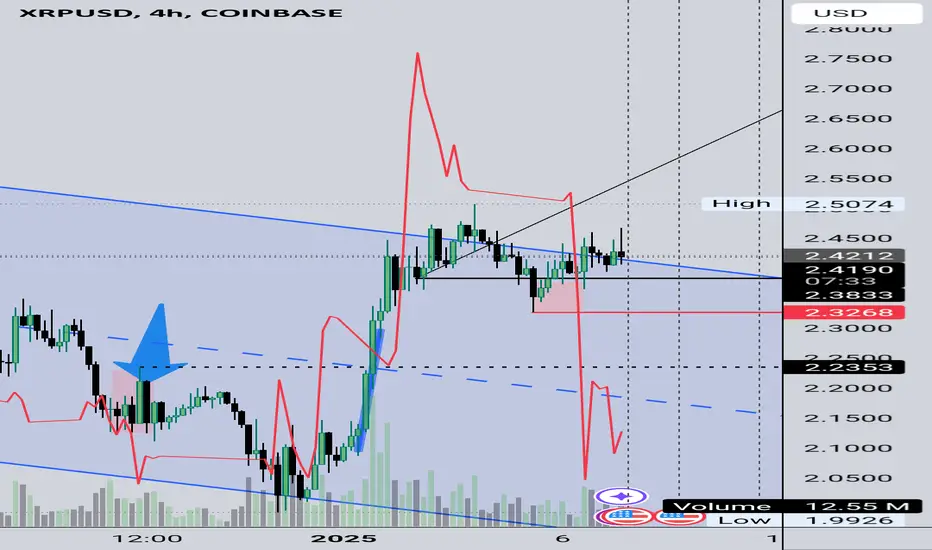
By the next chart share the next day 02/01/25 it was clear to me where price was and that I was seeing a clear BULL FLAG on the DAILY CHART.
✅️ With that information I had a plan❕️✅️
ℹ️So what's the lesson you ask?❔️
⭐️Well Seeking Pips didn't stick to the plan.
Price was still well above 2.10 but shared a short chart idea.
This is why a TRADE JOURNAL is a GREAT idea.
In real time you may not see or notice any TRADING ERRORS but by having a journal it's in black and white and you can spot any problems early.✅️
⚠️So what were the KEY POINTS from yesterday?
🟢 Based on the D1 timeframe chart there was no valid reason according to my PLAN to conditioner any short positions.
🟢 Even based on the intra day timeframes that I use my RED LINE on my chart share at 2.3268 was never traded below.
🟢 Too zoomed in to price on lower timeframes. Seeking Pips considered the intra day timeframes and price action over what the Daily and Weekly charts were indicating.
🟢 Quantity over quality, wanting to be active and share some content, even given the fact that the DAY, WEEK and EVEN YEAR had just started.
🟢 NOT GIVING the IDEA time to play out. Barely two hours earlier I had already decided that my bias was to the long side.
There was no trigger to invalid that bias.
⭐️THE LESSON⭐️
Trading is not all about Lambos and penthouses. Yes that can be a final goal if you want it to be BUT to get to that point you really do have to iron out all of the ugly stuff first...
If this post helps even one peron on their trading journey it has done it's job.👌
PLEASE LIKE AND SHARE THIS POST IF YOU FOUND IT USEFUL. 👍
Multiple Time Frame Analysis
Textbook Reversal Setup: Liquidity Zone + Channel BreakReversal Setup Analysis: HTF Liquidity Zone + Ascending Channel Breakdown
This chart highlights a high-probability bearish reversal setup based on key technical confluences. Here’s a step-by-step breakdown of the analysis:
1. High-Timeframe (HTF) Liquidity Zone (LQZ):
- The red zone marks a major HTF supply area where price previously rejected with a strong impulsive move downward. This liquidity zone is critical as it represents an area where institutional players have shown activity, creating a high-probability region for a potential reversal.
- As price approached this zone again, it did so in a corrective manner (via an ascending channel), which indicates weakening bullish momentum.
2. Impulsive vs. Corrective Structures:
- Impulsive Move: The strong move away from the HTF LQZ (highlighted earlier in the chart) confirms bearish intent, serving as a key reference point for this trade idea.
Corrective Structure: The price forms an ascending channel on the way back to retest the HTF LQZ, signaling exhaustion of buyers.
- The third touch of the channel’s trendline coincides with the HTF LQZ, adding confluence for a potential bearish reversal.
3. Liquidity Zones in Play:
- HTF Liquidity Zone (Supply): Serves as the key resistance level and primary rejection zone.
- 15-Minute Liquidity Zone (Demand): Acts as a potential target for bearish momentum post-breakdown.
- This multi-timeframe liquidity alignment strengthens the trade idea by providing clear areas of interest for entry, stop-loss, and take-profit placement.
4. Breakdown Entry and Structure:
- Entry Trigger: The trade is triggered on the break of structure, where price falls through the lower boundary of the ascending channel. This breakdown confirms bearish momentum resuming after the corrective phase.
- Stop-Loss Placement: Ideally placed above the HTF liquidity zone and beyond the third touch of the channel to account for potential fake-outs.
- Take-Profit Levels: Targets can be set near the 15M liquidity zone or prior swing lows for a solid risk-to-reward ratio.
5. Key Takeaways:
- This setup offers an excellent example of combining HTF liquidity zones, structural patterns, and market context to develop a high-probability trade idea. The rejection from the HTF LQZ aligns with the broader bearish narrative, while the ascending channel acts as a corrective structure leading to a continuation of the downward move.
- By focusing on confluence factors like liquidity zones, impulsive vs. corrective moves, and structural breaks, this trade idea demonstrates a disciplined and strategic approach to trading reversals.
Educational Insights:
- Always zoom out to identify HTF zones of significance to ensure alignment with the larger market context.
- Differentiate between impulsive and corrective structures to gauge the strength and intent of price movements.
- Use pattern confluences (e.g., ascending channels) in combination with key zones to identify high-probability entries.
- Prioritize patience and discipline by waiting for clear structural breaks to confirm your setup.

Best Chart Patterns in Price Action for Intraday & Swing Trading
Last year I shared more than 1000 free swing and intraday trading signals for Forex, Gold, Silver, Oil, Crypto and Major Indexes.
The majority of the setups were based on classic price action chart patterns.
What I did through the trading year, I kept a record of each free signal that I posted: noting the winners, losers and the entry reason.
In this article, I will share with you the most accurate and profitable patterns for trading by accuracy and winning rate.
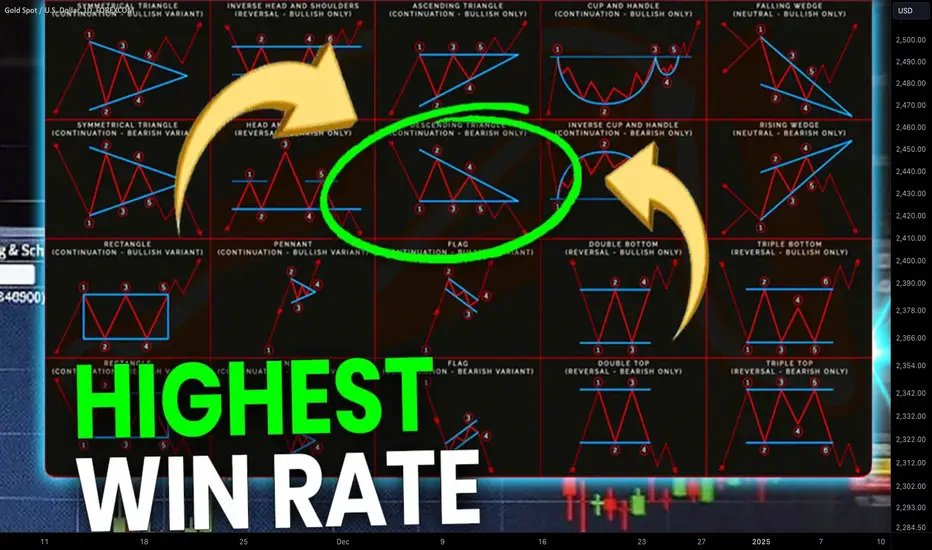
First, let me reveal the list of chart patterns that I traded this year:
double top & double bottom, head & shoulders pattern, cup & handle, bullish and bearish flag, rising and falling wedge, horizontal channel, ascending, descending and symmetrical triangles.
And I did not trade every pattern that I spotted. There were some specific criteria that I relied on to confirm the validity of the patterns.
Keep reading and you will learn these criteria.
Secondly, you can back test the performance of a trading setup and of each pattern that I shared on my official tradingview page by your own.
Simply, use the filter to display the desired pattern.
Tradingview does not allow removing the trading signal once it is posted, so all the results are 100% real.
My TradingView Page - tradingview.sweetlogin.com
Thirdly, all the chart patterns that I trade strictly formed on key daily supports and resistances . I never trade the patterns beyond key levels.
For example, the triangle chart pattern on an hourly time frame on EURAUD that I posted recently was formed on a key daily horizontal resistance.
Please, note that the price action patterns alone that are formed far from strong supports and resistances will always have a lower winning rate.
Also, I applied the chart patterns primarily for day trading and swing trading.
The time frames that I used were daily/4h/1h. For scalping, the performance will be different.
And the last thing that patterns in chart patterns trading is the direction of the market trend. The price action pattern that indicates a price movement against the trend will always have a lower accuracy than the one the aligns with the trend and give a trend following signal.
In the trading setup above, I spotted not only a bullish price action pattern on an hourly time frame but also a strong bullish trend on a daily.
Following all these criteria, here are the winning rates of chart patterns that I traded this year.
Double top & double bottom pattern get 66% winning rate.
That's the example of a perfect double bottom chart pattern for trading.
Remember that the fact that the price formed a pattern does not provide a reliable signal, we trade only after a breakout of its neckline and a candle close beyond, that is our strong confirmation.
Head & shoulders pattern and its inverted version get 69% winning rate.
You can find a valid head and shoulders pattern above. It was formed on a key daily resistance, and the trade was opened strictly after a violation of the neckline.
Cup & handle pattern and its inverted version has 67% accuracy this year.
That's a very perfect cup and handle that the price formed on a key support. Confirmation is the violation of the horizontal neckline.
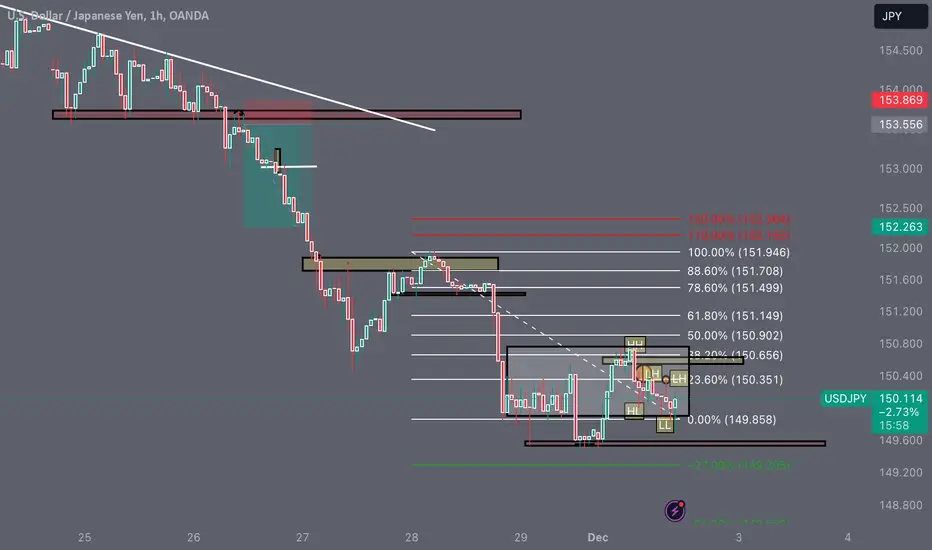
Bullish and bearish flags get 62% accuracy.
Examine the perfect flag pattern on USDJPY. The market is bullish on a daily and trades within a rising channel. The price formed a bullish flag on an hourly, approaching its support. Our signal to buy is the violation of its upper trend line.
Rising and falling wedges get 64% accuracy.
The rising wedge that the price formed on the chart above perfectly aligns with the up trend on a daily.
Horizontal channel - the range achieves 68% winning rate.
The horizontal range that the price formed after a breakout of a key daily support and its consequent test was broken to the downside, giving a reliable intraday confirmation signal.
The accuracy of ascending and descending triangles gave correct signals in 67% of the trades.
We made a nice profit, buying Bitcoin after a breakout of a neckline of the ascending triangle pattern that was formed on a retest recently broken daily resistance that turned into support.
Symmetrical triangle got 61% winning chance.
The violation of a falling trend line of a symmetrical triangle after a test of a key daily support gave a strong intraday bullish signal.
The best and the most accurate trading setups were based on a combination of multiple patterns.
It is a situation, when the market forms 2 or even more the-same biased patterns.
The trading setup above combines 2 bearish price action patterns on a key daily resistance: rising wedge pattern and descending triangle. Breakouts the trend line and neckline of both patterns gave very accurate bearish signal.
Such setups have a winning chance above 70%.
The one setup that gave almost 83% winning rate this year was based on a combination of a falling wedge pattern and a cup & handle pattern within.
In that setup, you can find not only a falling wedge pattern and its resistance breakout but also a cup & handle pattern that formed within and its neckline violation as well.
Always record the results and the entry criteria of your trades.
It will help you to identify the most efficient entry signals and the worst ones.
I hope that my observations will help you in the next trading year.
❤️Please, support my work with like, thank you!❤️
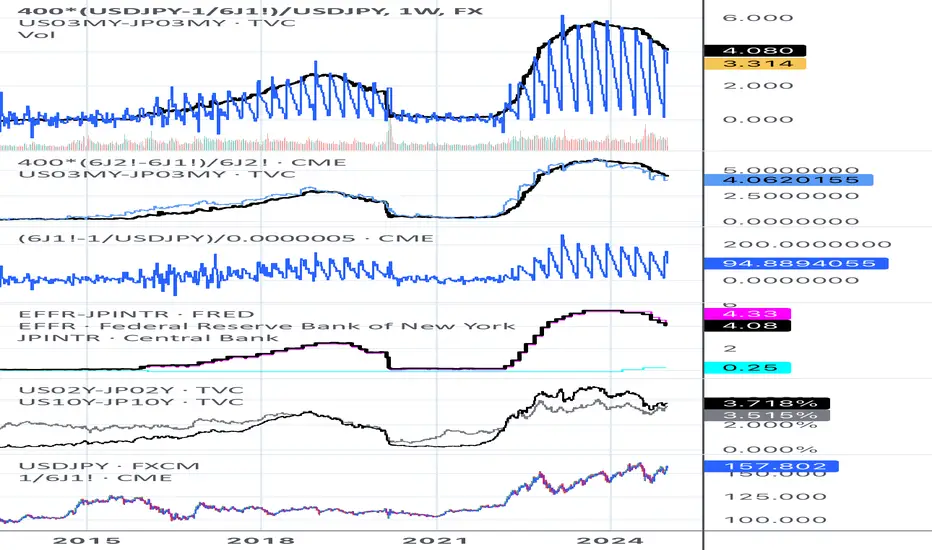
What influences $USDJPY & how $6J futures work.This is a “checklist” of computed and grouped time series which illustrate both what directly influences FX:USDJPY (in terms of interest rates and differences thereof) as well as how $6J futures work and how their basis is computed and compared side-by-side to its no-arbitrage value.
I use this myself so I’m sharing in case it’s useful to others.
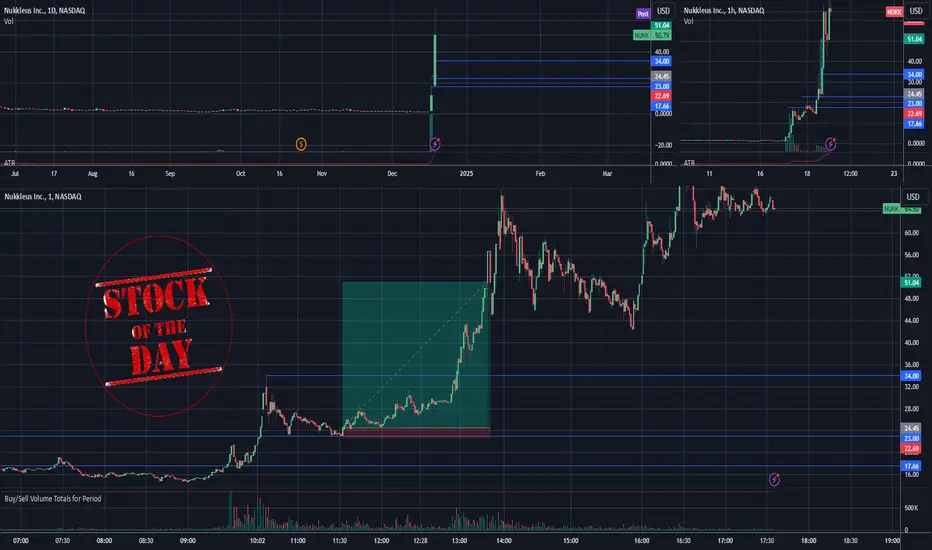
Stock Of The Day / 12.18.24 / NUKK12.18.2024 / NASDAQ:NUKK
Fundamentals. Second day of growth on the news of the acquisition.
Technical analysis.
Daily chart: Exit upwards from the annual accumulation.
Premarket: Range movement on increased volume.
Main session: We observe a confident upward movement at the beginning of the session after holding the previous day's high level 17.66. After acceleration and the formation of the top of 34.00, the price begins to tighten to the level of 23.00 against the upward movement. We consider a long trade to continue the movement in case the structure of the tightening is broken upward.
Trading scenario: #pullback along the trend (#false tightening) to the level 23.00
Entry: 24.45 on the breakout of the tightening structure and an upward exit on increased volume.
Stop: 22.69 we hide behind the level with a reserve for slippage.
Exit: Close part of the position before the level of 34.00 (RR1/5), close the rest of the position on the return candle after the trading halted at 1:30 p.m. (RR 1/15).
Trade potential: 1/15
P.S. Today's has shown a clear advantage of trading "In Play" stocks. Despite the fact that the market fell by 3%, NUKK did not notice this and continued to go one's own way, demonstrating significant growth and a very technical nature of the movement.
Profitable SMC Smart MoneyConcept Strategy Explained
I will teach you how to trade liquidity grab, a trap, inducement, order block and imbalance.
I will share with you my Smart Money Concept strategy for trading forex & gold.
We will study a real SMC trading setup that I took on a live stream with my students.
Trend Analysis With Structure Mapping
The first step in our trading strategy will be the analysis of a market trend on a daily time frame with structure mapping.
Analyzing GBPNZD on a daily time frame, we can see that the conditions for a bullish trend are met.
Liquidity Zones Analysis
The second step will be to find liquidity - supply and demand zones on a daily time frame.
According to our rules, here are 3 liquidity zones that I spotted on GBPNZD. We see 2 demand zones and 1 supply zone.
Test of Liquidity Zone
The third step will be to wait for a test of a liquidity zone.
And on that step, we should remember an important rule:
We will wait only for a test of a liquidity zone that ALIGN with the market trend.
It means that we will wait for a test of a demand zone in a bullish trend.
We will wait for a test of a supply zone in a bearish trend.
The only demand zones that meets these criteria on GBPNZD is Demand Zone 1.
It aligns with a bullish trend.
We don't consider Demand Zone 2, because a bearish violation of a Demand Zone 1 will be a Change of Character and a violation of a bearish trend.
And here is how a test of a liquidity zone should look like. The price should simply reach that.
Liquidity Grab & Imbalance
After we identified a test of a significant liquidity zone that aligns with a market trend, we will start analyzing lower time frames.
We will look for a liquidity grab, order block and imbalance on 4H and 1H time frames.
Here is a liquidity grab that is confirmed by a bullish imbalance.
We see a false violation of a liquidity zone, followed by a high momentum bullish candle.
It will be our strong bullish signal.
Order Block Zone
In order to identify the entry point, the next step will be to identify the order block zone.
According to our rules, here is the order block zone on a 4H time frame.
Entry Level
Our entry level will be the level of the upper boundary of the order block zone.
Here is such a level on GBPNZD.
A buy limit order should be set on that level.
Please, note that in that particular case we don't need a 1H time frame analysis, because we have a confirmation signal on a 4H time frame. We will analyse an hourly time frame only when THERE IS NO SIGNAL on a 4H time frame.
Stop Loss & Take Profit
Safe stop loss should be below the lowest low of a bearish movement.
To safely calculate a stop loss in pips for the trade, simply take 0.5 ATR - Average True Range.
For Average True Range indicator , take the default settings - 14 length.
Here is a safe stop loss level on GBPNZD. ATR is 55 pips. Our stop loss for the trade is 28 pips.
Take profit for the trade will be based on the closest 4H liquidity - supply zone.
That is the closest supply zone that I spotted on GBPNZD on a 4H time frame.
Your target level should be a couple of pips below a supply zone.
Look how perfectly the market reached the target!
As you can see, that trading strategy is quite complex and combines different important elements. But what I like about this SMC trading strategy is that it truly makes sense.
The intentions of Smart Money are crystal clear here and the trade execution rules are straight forward.
❤️Please, support my work with like, thank you!❤️

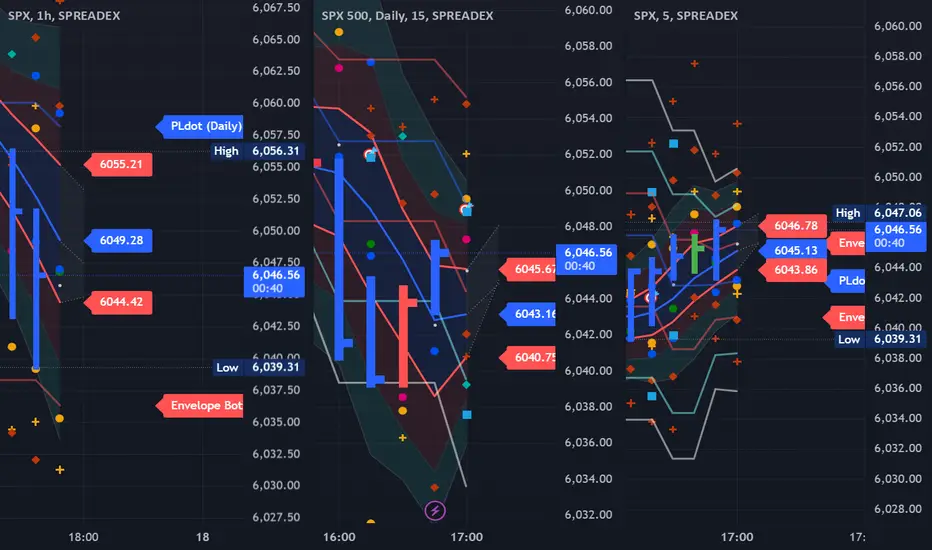
Trading with Multiple Time Frames: A Balanced ApproachWhy Use Multiple Time Frames ?
In trading, understanding flow and target areas across different time frames is essential for precision. Each time frame provides a unique insight:
Higher Time Frame (HTP) : Establishes the direction and target areas.
Focal Time Frame : Serves as your primary or main frame of focus for trading decisions.
Lower Time Frame (LTP) : Confirms the HTP’s direction and offers entry/exit points.
Examples: If you are position trading (holding longer than 1 month) you focal time frame is the monthly, the weekly is the time frame that offers entry/exits and the Quarterly is the time frame that establishes the direction and target areas. If you are swing trading (holding longer than 1 week) then you focal time frame is the weekly, LTP is the daily for entry/exists and HTP is the monthly. If you trade intraday then HTP is the hourly, focal is 15min and LTP is the 5min.
🔎 Key Principles for Multi-Time Frame Analysis
HTP Determines the Flow:
Strong resistance or support on the higher time frame drives the market flow.
Example: If HTP resistance is strong, the LTP will typically trend downward
LTP Monitors the Setup:
Use lower time frames to observe and confirm HTP predictions.
Lower time frame bars should progressively move away from strong HTP levels
Focus on Nearby and Further Out Areas:
Nearby areas provide short-term strength or weakness.
If a nearby area breaks, targets shift to further-out energy zones
🧩 Example Strategy: Integrating Time Frames
Step 1: Identify a strong support/resistance area on the HTP (e.g., Weekly Chart).
Step 2: Use the focal time frame (e.g., Daily Chart) to monitor for trend setups.
Step 3: Zoom into the LTP (e.g., Hourly Chart) to:
Confirm the setup.
Look for price reactions and ideal entry points.
Step 4: Set targets based on the HTP structure, while managing risk on the LTP.
🎯 Tips for Target Setting
Targets are often defined where price terminates energy (e.g., HTP resistance/support levels).
Monitor flow: If LTP flow aligns with HTP direction, the trade is on track.
If nearby energy breaks, shift your target to the next further-out area
🚀 Final Thoughts
The HTP shows the big picture; the LTP provides execution clarity.
Always let the HTP guide you, and the LTP confirm your trade entries/exits.
Remember: “Strength is strength until proven otherwise.”
By combining multiple time frames, traders can trade confidently, anticipate targets, and stay in sync with the market flow.
Reading Price Action to Tell a Chart's (Liquidity) StoryUsing Domino's Pizza in this case I want to show you how simple and practical it is to find important levels and to understand why price is doing what it's doing at a certain level. If we can map out where we are going to have to put a fight, and know why we are going to put up a fight (i.e. buyers or sellers, who needs what to win the fight, who is building liquidity and in control on a certain time frame) --> Then there is no reason why we shouldn't be able to identify solid trade opportunities and take them when they're given. If we are wrong on an analysis (i.e. we lose money on the trade), it's either that you're executing trades on a different time frame than your analysis is telling you to or there is something about your analysis that is wrong or not effective enough.
DPZ Analysis coming next..
Happy Trading :)

YOUR GUIDE TO CANDLESTICK ANALYSIS! What's up guys it's been a while! I know it's the holiday seasons, and that's the best time of year for me. Here is a wonderful present for you all, as a token of my appreciation. Thankful for the supportive and hateful people, not equally of course! 🤣 Anyways.... the things you must keep in mind when utilizing candlestick analysis in your trading are the following, Gs:
1) Understanding the anatomy of a candlestick - images.ctfassets.net
2) Candlestick color - The color of the candles individually matter in structure but also together they tell a story.... three inside down candle stick pattern at a lower high point in market structure for example.
3) Size of the candle - size of candle does matter as it indicates how volatile and wide reaching the market can be that day based on this data.
4) Volume - This one is obvious, Gs.
5) Timeframe of candlesticks being observed - understand candlesticks on higher timeframe hold more weight so they're more valid. (1h+) in consolidated structure on higher timeframe, lower timeframe candlestick structure is what you need to identify breakouts that'll be big on HTF.
6) Candlestick patterns - content.stockstotrade.com
7) Length of wicks on the candles - This is huge because wicks are a direct indication of exhaustion, which BASICALLY is buyer or seller weakness which directly aids me in basically every trade when finding that sniper entry i'm known for! Do not sleep on this step (or any, for that matter, I don't make these for FUN.)
8) Support/Resistance levels - I recommend going to lower time frames in these areas and using steps 2, 3, 6 mixed with timeframe correlation to make a sniper entry. GOODLUCK Gs!
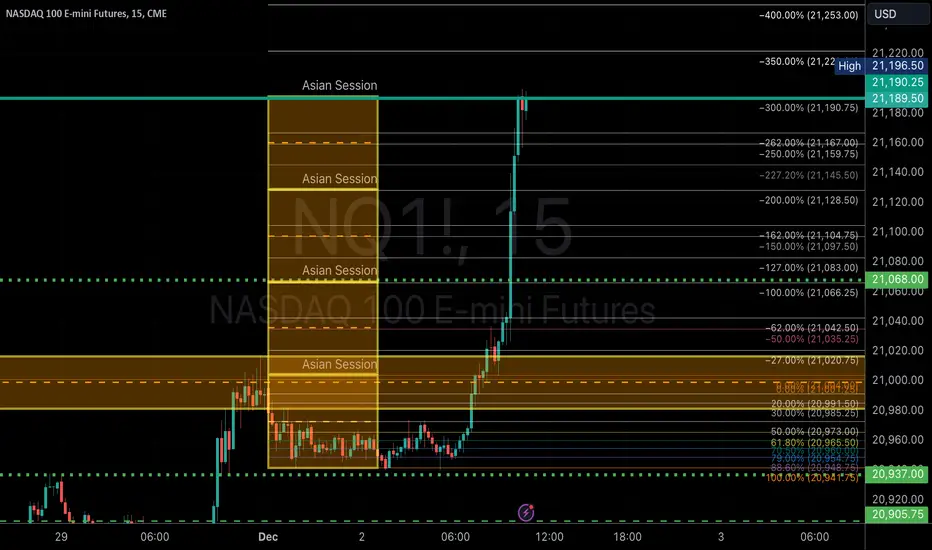
Again... $NQ hits 4x Asian Session Standard Deviation *smc*I made a tutorial not long ago that this setup happens mroe often than not. So I'm posting a second setup to prove my case. What's the difference? The entrance will depend on previous buy/sell models and if price hits the right order block without needing to go after sell side liquidity the higher the entry (or sell side, the lower the entry)... in this case is the higher. Because below is a lot of price action and the bottom hits just below the asian session at a breaker. Exit will head toward liquidity. On the 4 hr chart the liquidity point is 21,190.
4HR HART
I hope these tutorials will help you continue to keep finding these setups.
Happy Trading
CME_MINI:NQ1!
BLACKBULL:NAS100
CAPITALCOM:US100
When is a stock too high to buy? (Example: IHG)How do you know when you’ve missed the boat?
A stock has already gone up a tonne, so bascally you are too late!
Sometimes, you just have to let go, right?
Sometimes yes, but not always - let’s look at an example.
International Hotels Group (IHG)
Back in 2020, LSE:IHG IHG shares were trading down at ~2000 GBX, now they are a hairs breadth from 10,000 - that’s 5X in about 4 years. Not bad.
Can you really even think about buying shares at 10,000 that were 2,000 only 4 years ago. 🤔
We’re saying YES.. if you follow some guidelines.
Clearly this is not a value investment - this is a momentum trade.
To be buying IHG shares up here, one is basically arguing that the price at new highs indicates and buyers are in charge and the price is going to keep going up for the time being.
This helps define the trade risk very well.
If the trade is that IHG has broken out over the previous peak at ~8,800. We don’t want to be owning shares below this level - if they’re back below 8,800 the momentum has stalled and we need to be out.
To put it another way, we are not buying just under 10,000 and willing to hold the shares all the way back down to 2,000 again - no. We want to ride the momentum up - not down !
From here there’s a pretty good chance that momentum takes the price up to the 10,000 level. As a big round number, there is also a good chance that profit taking takes place here too.
That creates our buy zone between 8,800 and the current market price (9,750).
So what might a trading strategy look like to capture this situation?
The following is a way to have:
An intial risk of £1000 to test the waters
A total risk £3000 if/when the trade starts working
A 2X profit potential (with the opportunity to capture more)
Spread Betting Strategy: Target £6000+ Profit with £1000 Initial Risk
Entry Points and Stops
9000 GBX Entry:
Stop Loss: 8600 GBX.
Bet Size: £2.50 per point.
Risk: £1000.
9200 GBX Entry:
Stop Loss: 8800 GBX.
Bet Size: £2.50 per point.
Risk: £1000.
9400 GBX Entry:
Stop Loss: Trailing 400 points.
Bet Size: £2.50 per point.
Initial Risk: £1000.
Profit Targets
First Position (9000):
Gain: 1000 points.
Profit: £2500.
Second Position (9200):
Gain: 800 points.
Profit: £2000.
Third Position (9400):
Trailing Stop Profit Example:
10,400 GBX: Profit = £2500.
11,000 GBX: Profit = £4000 or more.
Summary
Total Risk: £3000.
Fixed Profit (First Two Positions): £4500.
Potential Profit (Third Position): Variable, based on trailing stop.
Reward-to-Risk Ratio: 2:1 or higher, depending on trend continuation.

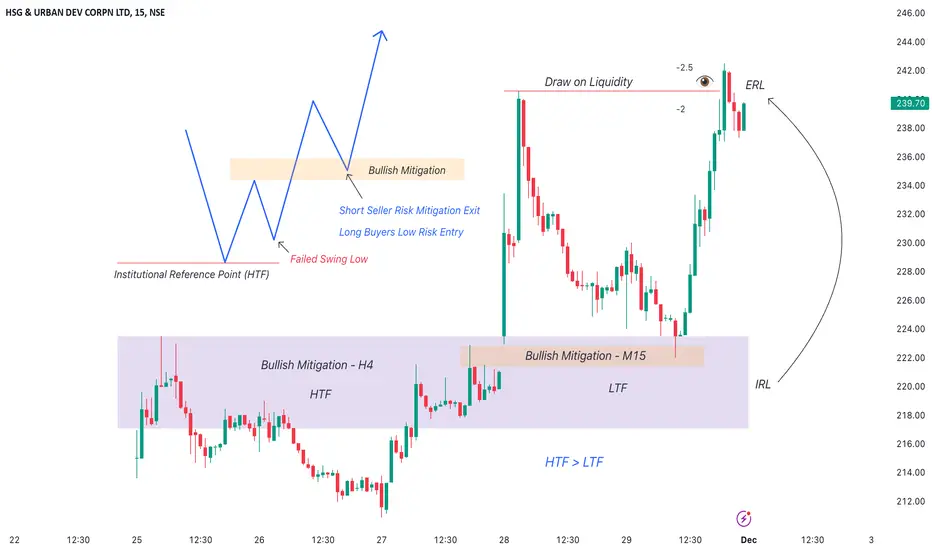
Understanding ICT Bullish Mitigation BlockA Bullish ICT Mitigation Block is a concept from Inner Circle Trader (ICT) methodology.
It forms at the end of a bearish trend when the price reaches a strong bullish institutional reference point, such as a bullish order block or breaker block.
Formation: It occurs when the price fails to create a lower low in a bearish trend and instead reverses to shift the market structure to the bullish side.
Identification: Look for a price level where the market attempted to break lower but was halted by significant buying pressure.
Trading Implications: This area can serve as a strong demand level, from which the price can rally further stronger because of short traders exit and long traders enter at the same area.
Multi Time Frame Analysis:
Higher Time Frame - H4
Lower Time Frame - M15
Institutional Framework:
Price Expansion (MMXM Buy Model)
Institutional Reference Points:
Bullish Mitigation
Sell Side Liquidity (SSL)
Drummond Geometry - Introduction to Time Frames in TradingDrummond Geometry emphasizes the importance of understanding and utilizing multiple time frames for trading. It outlines that higher time periods (HTP) provide critical directional context, while lower time periods (LTP) offer granular confirmation and entry/exit signals. This interplay allows traders to align their trades with the broader market structure while timing their actions effectively. For example, strong resistance in the HTP might signal a downtrend in the LTP, guiding shorter-term trading strategies within a defined market context.
Trading Idea Based on Time Frames:
Strategy: Higher Time Frame Support/Resistance Alignment
1. Objective : Trade in the direction indicated by the higher time period while fine-tuning entries and exits using the lower time period.
2. Setup :
- Identify strong support or resistance in the higher time period (e.g., daily or weekly charts).
- Confirm the trend's alignment in the lower time period (e.g., hourly or 15-minute charts) by observing price movement or the behavior of key levels like PL Dots.
3. Execution :
- Enter trades on the LTP when it confirms the HTP direction (e.g., breakout of a lower time resistance in an uptrend supported by the HTP).
- Exit trades when the LTP shows reversal signals or approaches a critical HTP level.
This method ensures alignment with the market's broader context while allowing for precision in execution.
Understanding ICT Classic Weekly Profile on BANKNIFTYICT weekly profiles are conceptual frameworks that describe typical patterns of price behavior during a trading week.
Each ICT weekly profile has unique characteristics that can hint the traders in anticipating potential market movements.
However, it is important to note that these profiles are not fixed predictions but rather frameworks to understand market tendencies and works with Higher Time Frame PD arrays confluences.
ICT weekly profile is explained below with BANKNIFTY Chart analysis
Classing Thursday High of Week (Bearish Setup)
Key element to focus :
Higher Time Frame Premium array (Weekly Buy Side Liquidity) for bearish setup
Time Frames alignment :
HTF --> W1 (PD Arrays)
LTF ---> H4 (Market Structure)
ETF --> M15 (Entry)
Process :
1. Market offers Liquidity from Monday to Wednesday
2. Market seeks Liquidity on Thursday
3. Market rebalances on Friday

FACT(NSE) Stock - Applying Bullish Breaker Concept on TradingTrading is simple!
All you need to know is Premium / Discount Arrays to understand market dynamics.
Choose the Higher Time Frame (HTF) PD array and trade Lower Time Frame (LTF) PD array.
Time Frame Alignment
HTF - H4
LTF - M15
HTF PD ARRAY - Bullish Breaker
LTF PD Array - Bullish Breaker
Higher Time Frame gives you market direction.
Lower Time Frame gives you entry opportunity

Divergence...one of the only clues you need...NZDUSD EXAMPLEHello hello hello TradingView community! Hope you are all having an amazing day so far getting ready for the fantastic trading week ahead. I saved something special for you guys this week with a more educational videos on one of my favorite confluences/tools I like to use in the market for my analysis and trading and that is the concept of Divergence. This is something I personally use in my analysis and trading that has helped me tremendously find and enhance the opportunities I identify in the markets and wanted to go ahead and share with this awesome community!
So sit back, take some notes, and hope you all get some great nuggets from this video! Cheers!

Robin Trap Strategy Part 6Me Going Over Some Of The Pairs I Trade And What Robin Traps Im Willing To Trade Or avoid !

Learn Best Time Frames For Scalping Any Forex Pair
I am trading forex with top-down analysis for many years.
In this article, I will teach you powerful combinations of multiple time frames for scalping any currency pair.
For scalping financial markets with multiple time frame analysis, I recommend applying 3 time frames: 4H, 15 minutes and 5 minutes time frames.
4H time frame will be applied for trend and structure analysis.
On a 4H time frame, you should identify the direction of the market and significant supports and resistance.
Key supports in a bullish trend will be applied for buying the market.
While key resistances will be applied for counter trend trading.
Above is USDJPY chart, 4H time frame.
The trend is bullish and I have underlined important historical structures.
Key resistances in a bearish trend will be applied for selling the market.
While key supports will be applied for counter trend trading.
Look at a structure and trend analysis on EURUSD on a 4H time frame.
15 minutes and 5 minutes time frames will be applied for confirmation, entry signal and trade execution.
The logic is that once you identified key levels on a 4H time frame, you are patiently waiting for the test of one of these structures.
Once one of the key levels is tested, you start analyzing 15 minutes and 5 minutes time frame and look for a signal there.
What should be the signal?
It can be a specific candlestick pattern, price action pattern, some signal from a technical indicator or some other stuff.
Personally, I look for a price action pattern.
I am looking for a bearish price action pattern on a 4H resistance and a bullish price action pattern on a 4H support.
Look at GBPUSD. The pair is trading in a bearish trend on a 4H time frame, and it tests a key horizontal resistance.
On 15 minutes time frame, we see a strong bearish price action signal.
Head and shoulders pattern formation and a bearish breakout of its horizontal neckline.
That will be our strong scalping short signal.
If you sell the market in a bearish trend on a 4H from a key resistance, you can anticipate a bearish movement to the closest 4H support.
Look how nicely GBPUSD dropped after a strong bearish confirmation of 15 minutes time frame.
In that case, we did not apply 5 minutes time frame in our analysis,
keep reading and I will explain when we apply 5 minutes time frame for scalping.
Above is USDCAD. On a 4H time frame, I executed trend and structure analysis. We see a test of a key support in a bullish trend.
At the same time, no pattern is formed on 15 minutes time frame after a test of structure.
In such a situation, analyze 5 minutes time frame. If there is no pattern on 15m, probabilities will be high that the pattern will appear on 5m.
On 5 minutes time frame, the pair formed the ascending triangle formation. A bullish breakout of its neckline is a strong bullish signal and confirmation for us to buy.
If you buy the market in a bullish trend on a 4H from a key support, you can anticipate a bullish movement to the closest 4H resistance.
You can see that after our confirmed bullish signal, the price went up to Resistance 1.
Both trading opportunities that we discussed are trend following ones.
Remember that the trades that are taken against the trend are riskier and have lower accuracy.
For that reason, if you are a newbie trader, strictly trade with the trend!
Good luck in scalping with multiple time frame analysis!
❤️Please, support my work with like, thank you!❤️

THE TREND IS YOUR FRIEND...UNTIL THE END...EURUSD EXAMPLEHey everyone! Hope you are having an AMAZING weekend and beautiful Sunday so far! I just wanted to get on here and post a quick educational video for my Trading View community and share some nuggets I have learned over the last 14 years of being in the markets that hopefully can help you guys reach consistency and ultimately profitability.
The subject in this video is "THE TREND IS YOUR FRIEND..UNTIL THE END" hope you guys enjoy get a notepad and paper or iPhone out lol and take some notes! You won't want to miss this!
Cheers!

A classic setup for finding trading opportunitiesHi traders and investors!
In a recent post, I talked about a classic setup. You can find the post below in the related ideas section. I decided to elaborate on it a bit more because this setup frequently appears across different assets, and certain elements of this setup are common in various trading methodologies. In this article, I used a bar chart because bars take up less space, making it easier to see other elements of the chart.
Take a look at the chart. The seller's move from the 52,550 level updated the previous local high. The bar with the highest volume in this entire buyer's movement is the bar from September 18. The 50% level of the entire buyer's movement lies within this bar (!).
Next, we see the seller's movement, and on October 3, a test is formed within the key buyer's bar, at the level of 59,828.11. The price didn't reach the 50% level (59,524).
The key seller's bar in this movement (the bar with the highest volume) is the bar from October 1. The 50% level of the entire seller's movement is within this bar (!).
Next, we see the buyer's movement, and on October 5, a test is formed within the key seller's bar, at the level of 62,484.85. The price didn't reach the 50% level (63,163.06).
Then we see the buyer's attack on the test level of 62,484.85 and the 50% level of the seller's movement (63,163.06), followed by the seller returning the price below the test level, accumulating volume for a downward move. After that, the local minimum of 59,828.11 was updated.
Then, the seller attacks the test level of 59,828.11 and the 50% level of the buyer's movement (59,524), and the buyer returns the price above the test level, gathering volume for an upward move. What happens next... we will soon see.
This is how the buyer's attack on the 50% level of the seller's movement looked on the 4-hour time frame.
No differences whatsoever. Although, maybe I didn’t look hard enough. The key bar of the seller's movement intersects the 50% movement. First, there’s a test below the 50% level (test level 62,975), then an attack on the test level and the 50% level.
Hope you found it interesting.
Good luck with your trading and investments!

How to Adapt Your Trading Plan to Any Market ConditionDaily Trendline Break and Market Structure
The break of the daily trendline suggests potential bearish momentum. However, as the break appears corrective, we must be cautious about interpreting it as a reversal too early. As described in the Trinity Rule, it’s crucial to evaluate whether price is moving impulsively or correctively before deciding.
The market could be forming an arcing structure, which traps traders on the wrong side before reversing, as mentioned in Pattern Separation. This aligns with the idea that the market may retest the trendline or break structure in the opposite direction after a fake-out.
Lower Timeframe Ascending Channel
There is an ascending channel on the lower timeframes, which typically signals continuation of the bullish trend unless there’s a strong breakout to the downside. This is where the Multi-Touch Confirmation comes in; if we get a third touch on this channel without a break, it could present a strong reversal signal.
However, if the price decisively breaks the ascending channel with strong momentum, the next step would be to look for a flag or corrective structure for an entry into the bearish continuation, as highlighted in Running Channels.
High-Probability Trade Setup
Impulse and Correction:
As per Entry Types, a high-probability trade should be executed after the first impulse following a correction. If the price breaks out of the ascending channel, wait for a correction (such as a flag) before entering a short position.
You may look for a third touch confirmation to enhance the probability of success.
Risk Management:
Don’t rush the entry based solely on the trendline break. Ensure the structure evolves, showing a confirmed breakout, especially on higher timeframes.
Manage your stop loss based on market structure rather than arbitrary levels. For instance, if the market presents an impulsive move after breaking the channel, your stop could be above the last lower high.
Market Structure and Valid Trades
Evolve Structure: Continuously update your structure by considering the most recent touches. This avoids getting caught in outdated setups.
Where Are We in Structure?: Evaluate whether the price is impulsively breaking key levels or showing corrective behavior. If momentum is lacking after the trendline break, the bearish setup may not play out.
Trade Scenarios
Bearish Scenario (Short Setup):
Price Breaks the Ascending Channel: If the price breaks with momentum, look for a retest or flag formation to enter short.
Manage Your Position: As the Rule of Three suggests, avoid perfectionism. If the market forms a strong flag or corrective structure, trust the process and adjust your stop as the trade moves in your favor.
Bullish Scenario (Long Setup) :
Price Fails to Break the Channel: If the market respects the ascending channel, this could indicate a continuation of the bullish trend. You could enter long after the third touch confirmation or a clear rejection of lower levels.
Multi-Touch Confirmation: This will be a key factor if the market holds within the channel.
Key Considerations
Impulse and Confirmation: Be patient for the first impulse and correction before committing to a trade.
Stay Neutral: Use running channels and the overall structure to keep a neutral mindset until the market gives a clear signal.
Avoid Perfectionism: Don’t hesitate or wait for the “perfect” setup if multiple confluences align. Stick to your pre-trade checklist to avoid overanalyzing.

Unlock the Market's Hidden Rollercoaster: How to Ride the WavesXau/Usd Review with my trading personality
As a Whimsical Rollercoaster Enthusiast, your trading style is likely driven by the excitement of quick market movements and the thrill of capturing early trades. You're probably someone who thrives on dynamic entries, enjoys the fast-paced action, and may have a more intuitive approach to the market. Let’s blend that with risk management to balance your adventurous spirit while still keeping a solid trading plan.
Technical Review for a Whimsical Rollercoaster Trader:
1. Key Levels to Watch:
2,595 (Resistance) and 2,580 (Support) are your playgrounds right now. You’re drawn to the thrill of what might happen at these zones.
If price pushes toward 2,595, you might feel an urge to jump in, expecting an immediate reaction. However, I encourage you to:
Embrace your adventurous nature but temper it with tactical precision.
Let the level hit and then wait for a quick confirmation (like a wick rejection or a mini pullback). This gives you both the excitement of early entry and higher probability without losing your edge.
Scenario: Price pushes toward 2,595. Here, your Risk Entry could be triggered:
Risk-Entry Plan:
Enter short at the first rejection of 2,595.
Set a tight stop-loss just above the liquidity zone (2,600), respecting your love for quick moves but protecting from being shaken out too soon.
Target the 2,580 area first, knowing the ride might be wild but worth it.
Why it suits you: It’s a quick decision, satisfying your need for speed, while the tight stop-loss aligns with managing risk. You get that thrill, but within guardrails.
2. Confirmation Entry – Building Momentum:
Confirmation Entries might feel a bit “slow” to you, but they can help ensure you stay in the game longer. Consider them when you want to ride bigger moves, not just quick scalp trades.
Scenario: If price breaks through 2,595, wait for a retest to confirm this zone is now support. Here’s where you bring in your whimsical nature: instead of waiting too long, spot a smaller timeframe pattern, like a bullish engulfing candle or a rejection wick, and go long.
Confirmation-Entry Plan:
Enter long at the retest of 2,595 after a clear rejection pattern. Think of it as waiting for the next loop on the rollercoaster — the bigger move is coming, and you want to be on board for it.
Set a slightly wider stop-loss, maybe under 2,580, to allow the trade to develop without getting knocked out early.
Aim for the next higher liquidity zones, like 2,600 or 2,615.
Why it suits you: This method still lets you catch the excitement of a momentum breakout, but the confirmation gives you more confidence. You still get the rush but with less risk of getting thrown out before the big move.
3. Patterns Within Patterns – Your Playground:
As a Whimsical Rollercoaster Enthusiast, you probably love when the market shows intricate patterns — they're like hidden rollercoaster tracks, revealing sudden twists and turns.
Scenario: If price breaks above 2,595, zoom into lower time frames and look for miniature patterns within the broader trend. You might find a bull flag within a larger ascending channel. Entering on these small corrective patterns can satisfy your need for fast-paced decision-making while riding the overall trend.
Plan:
Use these smaller patterns for quick entries. Set your stops just outside the pattern, and take profits quickly as the price breaks out.
Think of it as riding the small waves, but always looking for the bigger momentum move to follow.
Why it suits you: You’re jumping in on short-term opportunities while always keeping an eye on the next big move. This keeps you engaged and allows you to take action when you feel that burst of adrenaline without losing sight of the bigger picture.
4. Managing Whimsical Risk:
Stop-loss flexibility: As someone who enjoys spontaneity, a tight stop might feel restrictive but necessary. Here’s the compromise:
Set initial stops tight (like just above 2,595 if shorting), but allow yourself room to evolve the trade based on market action. If the trade moves in your favor, quickly move the stop to breakeven.
Mental Resilience: Losses will happen, but you need that mental discipline to jump back in without chasing every tick. Treat each trade like a separate rollercoaster ride — whether it’s a good or bad one, there’s always another one coming.
Use your intuition and excitement to recognize evolving setups. But keep a few rules in place to avoid the pitfalls of impulsivity (e.g., no more than 3 trades per day on a single idea to avoid over-trading).
5. Incorporating the Rule of Three:
For the rollercoaster trader, the Rule of Three is your ultimate guide. This rule asks you to identify at least three confirming factors before entering a trade:
Scenario: Price reaches 2,595:
You see a rejection (touch #1).
The lower time frame shows consolidation or a mini bear flag (touch #2).
Momentum begins to fade (touch #3).
Action: This triple confirmation allows you to short confidently, knowing you have the right mix of signals to back your bold entry.
Why it suits you: The Rule of Three still gives you the excitement of quickly entering trades but ensures they are high-probability setups. It prevents you from overtrading out of sheer excitement while still letting you capture those thrilling moves.
Summary Action Plan for a Whimsical Rollercoaster Trader:
Risk Entry: When you feel the market is ready to react at key levels (like 2,595), dive in! But do it smartly — use tight stop-losses and a quick decision-making process. Think of it as jumping onto the coaster right before it starts moving.
Confirmation Entry: Use this when you're looking for a bigger, smoother ride. Wait for the breakout-retest combo, then get in for the larger trend move. Stay patient here; it’s worth the wait.
Patterns within Patterns: Zoom into the mini rollercoasters inside the bigger structure. Catch the small waves but keep your eyes on the longer ride.
Trinity Rule : Ensure three factors align before entering. This rule keeps you disciplined while still embracing your whimsical nature.

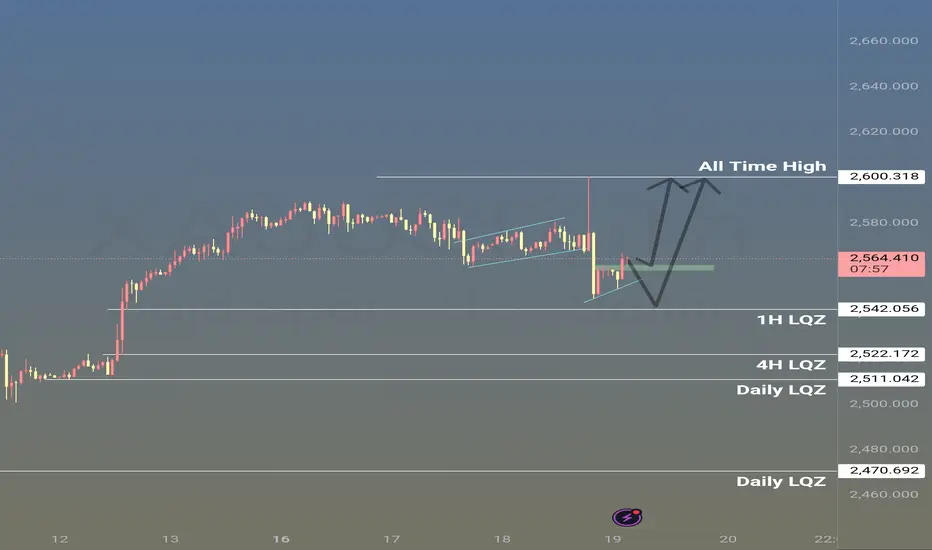
XAUUSD: Navigating Key LQZ 4 HIGH-PROBABILITY shortMulti-Timeframe Analysis of XAUUSD
1. 4-Hour Chart
Key Structure:
All-Time High (ATH) at $2,600.318: This level acts as a strong resistance. Price has rejected this zone, showing an initial failure to break higher.
Corrective Channel: The price has formed a small ascending corrective channel after the ATH rejection, which often indicates a potential continuation move downwards.
Key Liquidity Zones (LQZs):
4H LQZ at $2,522.172: This zone could act as the next support if the downtrend continues.
Daily LQZ at $2,511.042: Deeper support that aligns with the broader timeframe.
Implication: Based on the corrective channel and the rejection of ATH, a continuation down towards the 4H and Daily LQZ is likely unless a strong bullish push occurs.
2. 15-Minute Chart
Bearish Momentum: The price formed a sharp drop after the ATH rejection, leading to a corrective structure forming.
Ascending Channel: A bearish ascending channel (corrective) is visible, which may suggest further downside. A clean break below the lower boundary of this channel would confirm bearish continuation.
1H LQZ at $2,542.056: This zone is likely to be the first target if the breakout occurs.
Implication: If the price breaks below the corrective channel, a potential short entry targeting the 1H LQZ is a strong play. A further drop to the 4H LQZ could follow if momentum continues.
3. 5-Minute Chart
Current Reaction:
The price is bouncing from the lower part of the small corrective structure. There is a minor bounce from the 5M LQZ at $2,562.855.
Next Step:
Monitor for price rejection or failure at the 5M LQZ. If it fails to sustain this level, a short opportunity arises.
Implication: A break below the 5-minute structure could lead to a fast move down toward the 1H LQZ. Watch for strong rejections at this level.
---
Trade Setup Suggestion:
1. Entry:
Aggressive: If the price breaks the corrective channel on the 15-minute chart, you can enter short near $2,562-$2,564.
Conservative: Wait for a confirmed break and retest of the lower channel boundary.
2. Stop Loss:
Set above the corrective channel high, around $2,580, to protect against sudden bullish reversals.
3. Targets:
First target: 1H LQZ at $2,542.056.
Second target: 4H LQZ at $2,522.172.
Third target: Daily LQZ at $2,511.042 if further downside persists.
Conclusion:
The price structure and liquidity zones indicate a bearish continuation is possible, especially if the corrective channel breaks down. Keep an eye on how price interacts with the liquidity zones to refine entries and exits.