Why Daily Time Frame Analysis Will Make You a Better Trader
Most beginner traders often think that money is made in the short-term timeframes, so they go the way of intraday trading, believing that it will enable them to quickly grow their small trading accounts.
They have this belief that the lower timeframe provides more trading opportunities that can allow them to make more money in the long run.
Given, the daily timeframe offers fewer trading opportunities and may seem slow and non-exciting to most traders, but there in lie the benefits — it forces you to have patience, trade less often, and make better trading decisions.
While the intraday timeframes offer more trade setups, most of them fail, making you lose more money.
The benefits of using the daily timeframe:
A better view of the market structure
The daily timeframe helps you to have a broader perspective of the market so you can have a better view of the price structure and the stage of the market cycle.
It gives you a bigger picture of the market — you can see the price action over a longer period.
More significant support and resistance levels
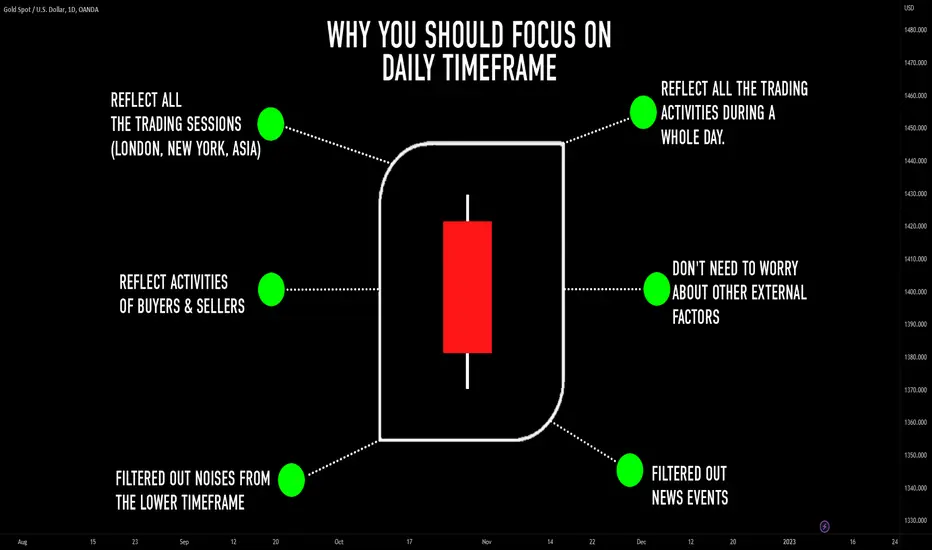
The price swing points on the daily timeframe are more significant than those on the lower timeframes, and you know why — more traders are watching the daily timeframe than any other timeframe.
More reliable price action patterns
One price bar on the daily timeframe represents all the transactions that took place on that trading day, including during news releases.
So, it captures the entire day’s volume of orders, which is more significant — the lower timeframes that may even be too small to absorb all the others from a high-volume trader.
Always start your analysis from a daily time frame.
It is very insightful, and it will bring your trading to the next level.
Hey traders, let me know what subject do you want to dive in in the next post?
Multiple Time Frame Analysis
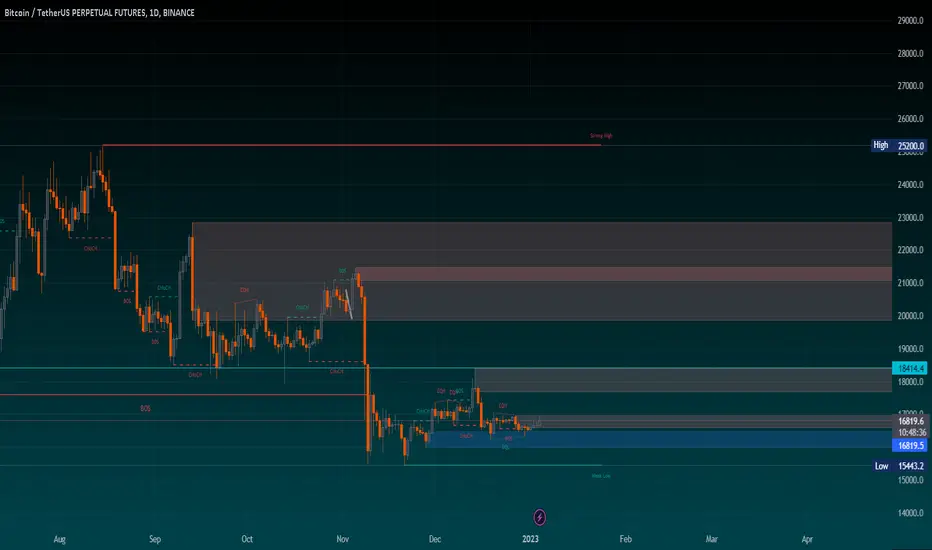
btcusdtperpHello everyone, in this analysis I want to show you how to use the smart money analysis method, so stay with me.
This method is a combination of ict and S&D & rtm
The condition for entering the trade is breaking the limits in the higher time frame, such as monthly and weekly, and the second condition is the appearance of a candlestick pattern in the lower time frame.
All ranges are specified and named
If you have any questions, ask under this post so that I can answer to the best of my ability
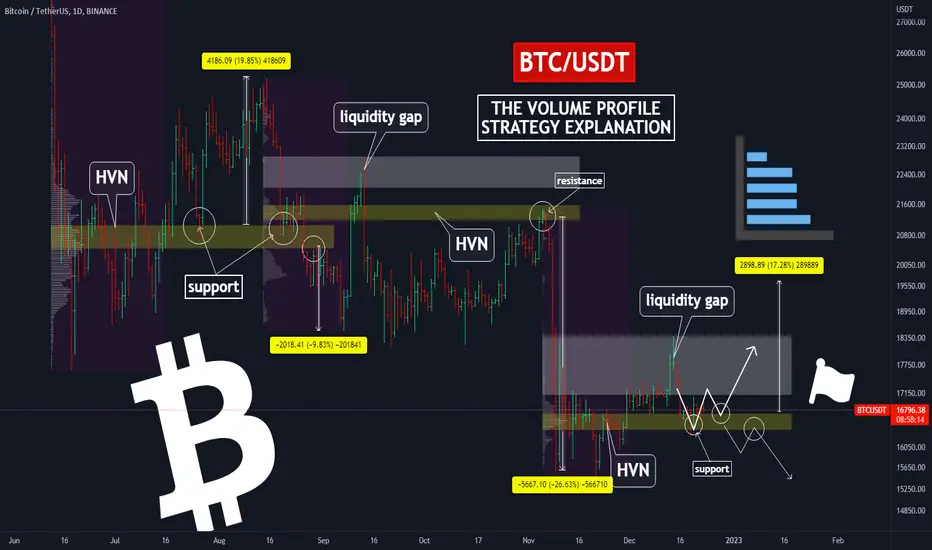
🔥✅HOW TO GET 70% WIN RATE USING VOLUME PROFILE🔥 Hi friends! Today we will talk about a very important trading tool that can give you 70% win rate if you will know how to use it as a pro trader. This tool is a volume profile.
📊 WHAT IS THE VOLUME PROFILE?
The volume profile is a real traded volume. Unlike the usual vertical volumes that show the amount of volume traded over a certain amount of time, the horizontal volume shows the volume traded over a certain price range.
The volume profile has 2 components:
🔥 value area (yellow areas), which is the biggest resistance/support for the price. There can be several value areas, but the largest value areas called HVN or High Volume Nodes.
🔥 liquidity gap (white area) is the area where the least volume is traded. Usually, the price "cuts" through these areas very quickly.
📊 HOW TO USE THE VOLUME PROFILE?
I want to show you how it works. If we want to understand the next price movement, we should identify the biggest value areas. So you see the most significant liquidity (value) areas and wait when the price tests it:
1. if the price breaks the value area and tests it as support , you can enter a trade because bulls are strong and the price should go higher.
🚩 The clear trade example on how to use HVN (value area) as support (+20% of clear move).
2. if the price test it as resistance , this means that bears are stronger and bulls haven`t enough power to push the price higher.
🚩 The clear trade example on how to use HVN (value area) as resistance (+26% of clear move).
So the value areas or HVN are a stop on the way of price movement in one direction or another. The better you determine where the price will go after testing this HVN (value area), the more profitable you will be.
🚩 If you use this approach on lower timeframes, you can get more trades. This is ideal if you are an intraday or swing trader.
Try using horizontal volumes yourself, and in the following ideas, I will tell you how I and other advanced traders use them.
✅ So this approach has 50-70% win rate, but if you want to increase it, you need to use additional filters.
Personally, I use the DOM and Footprint to identify the whales' orders and buy crypto with the big guys. These indicators can easily add 25-35% to your win rate. I make a lot of video lessons and articles about them, so enjoy and make money.
💻Friends, press the "boost"🚀 button, write comments and share with your friends - it will be the best THANK YOU.
P.S. Personally, I open an entry if the price shows it according to my strategy.
Always do your analysis before making a trade.
Learn to Read Candlestick Strength | Trading Basics
Hey traders,
In this educational article, we will discuss how to objectively measure the market momentum with candlesticks.
Please, note that the concepts that will be covered in this article can be applied on any time frame, however, higher is the time frame, more trustworthy are the candles.
Also, remember, that each individual candle is assessed in relation to other candles on the chart.
There are three types of candles depending on its direction:
🟢Bullish candle
Such a candle has a closing price higher than the opening price.
🔴Bearish candle
Such a candle has a closing price lower than the opening price.
🟡Neutral candle
Such a candle has equal or close to equal opening and closing price.
There are three categories of the strength of the candle.
Please, note, the measurement of the strength of the candle is applicable only to bullish/bearish candles.
Neutral candle has no strength by definition. It signifies the absolute equilibrium between buyers and sellers.
1️⃣Strong candle
Strong bullish candle signifies strong buying volumes and dominance of buyers without sellers resistance.
Strong bearish candle means significant selling volumes and high bearish pressure without buyers resistance.
Usually, a strong bullish/bearish candle has a relatively big body and tiny wicks.
2️⃣Medium candle
Medium bullish candle signifies a dominance of buyers with a rising resistance of sellers.
Medium bearish candle means a prevailing strength of sellers with a growing pressure of bulls.
Usually, a medium bullish/bearish candle has its range (based on a wick) 2 times bigger than the body of the candle.
3️⃣Weak candle
Weak bullish candle signifies the exhaustion of buyers and a substantial resistance of sellers.
Weak bearish candle signifies the exhaustion of sellers and a considerable bullish pressure.
Usually, such a candle has a relatively small body and a big wick.
Knowing how to read the strength of the candlestick, one can quite accurately spot the initiate of new waves, market reversals and consolidations. Watch how the price acts, follow the candlesticks and try to spot the change of momentum by yourself.
❤️If you have any questions, please, ask me in the comment section.
Please, support my work with like, thank you!❤️

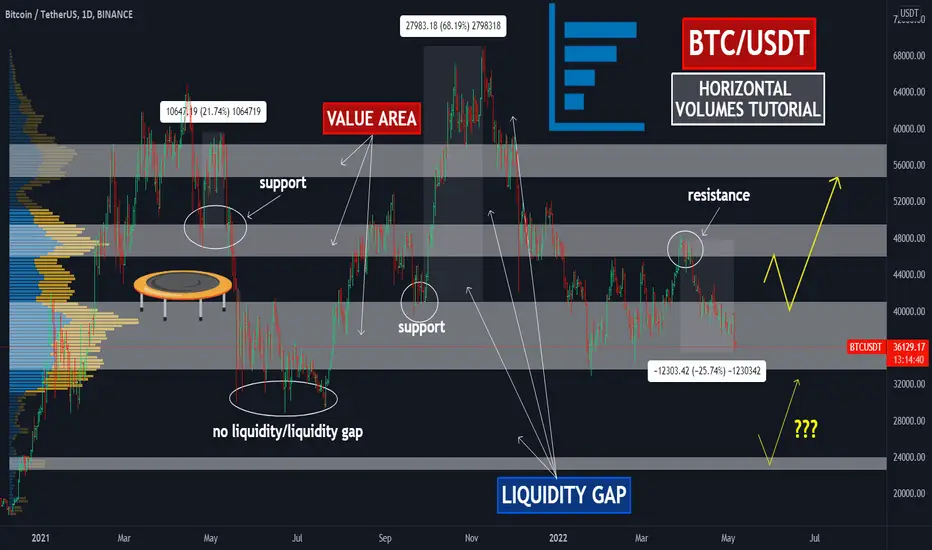
📊How to use HORIZONTAL VOLUMES? Tutorial with examples!Horizontal Volume Indicator or Volume Profile is a simple indicator that helps to identify: value areas (support or resistance zones) and liquidity gaps. In this idea I will explain how to use the indicator and mark these areas to make trades and why it works.
Let's start at the beginning.
💹What are value areas (support and resistance zones)?
🔶The value zone is the price range at which the most trades are made. On the chart we can mark the value zones: 33600-41000, 46000-49500, 54600-58200. I also marked how these zones were support or resistance to price. The value zone becomes a support for price if the price, when it is tested, does not continue its downward movement. A value zone becomes a resistance if price does not continue to rise above that zone. The zone simply doesn't let the price go higher because there aren't enough buyers.
🔶Liquidity gaps are called that way because no trades were made in that zone and there is no liquidity for traders (buyers or sellers), and price, as we know, goes from liquidity to liquidity (from one zone to another). On the chart I have marked for you the liquidity gaps and we can see that the price can' t stay in these zones for a long time.
✅Why do horizontal volumes work? Price reacts to these zones for a simple reason. Many traders pay attention to these areas and put their limit orders to buy or sell or when the area is tested, so the price moves up or down. If there are more sellers than buyers, the price will go lower and lower ; if there are more buyers, the price goes higher and higher.
🚩How can I add this indicator to my chart?
3 steps to add the indicator to your chart:
1. open "prediction and measurement tools" at the left part of chart
2. choose the "Fixed Range Volume Profile"
3. choose the price range from some date till another date. I chose from Dec 10, 2021 till May 6, 2022.
So now you can see and mark all areas on your chart.
🏁This indicator helps to identify areas and can suggest stop points or price reversal, but it should be used with different methods. If the market is in a strong rising trend (UPTREND), it is unlikely to be stopped by a local zone of value, but a global zone may stop it. Also, the support zones can be good entry point. Be more tricky than the market and use different tools. You can use the indicator on different timeframes for scalping or swing trading and with different ALTCOINS. Also, pay attention to the volume indicator, trend lines and key levels that I show in my ideas.
💻Please write in the comments if you still have questions about Horizontal volumes! I`ll try to explain you additional tips 🎇
Press the "like"👍 button, write comments and share with your friends - it will be the best THANK YOU.
P.S. Personally, I open an entry if the price shows it according to my strategy.
Always do your analysis before making a trade.
🔥🚩POINT OF CONTROL: THE MOST USEFUL TOOL FOR TREND TRADER🔥 Hi friends! Point of control is a part of volume profile indicator and very useful tool to identify upcoming BTC or any other asset move. I will explain you how to use this tool in your trading and make a good profit in this idea.
💹 Horizontal Volume Indicator or Volume Profile is a simple indicator that helps to identify: value areas (support or resistance zones), points of control and liquidity gaps.
📊 HOW TO USE POINT OF CONTROL
Point of control (red line on the chart) is the place of the largest accumulation of liquidity. We can say that this is the place of "the biggest battle between bulls and bears":
🔥the point of control becomes a resistance in case of "bears' victory" and crypto start to fall
🔥the point of control becomes a support in case of "bulls' victory and crypto start to grow
🚩 When one of the sides wins the "battle", this is the best time to enter the trade in short or long.
✅ No matter how complicated this tool looks, it is very easy to use:
1. extend the volume profile indicator from the lows to the highs. The indicator automatically shows the largest accumulation of liquidity showing POC (red line).
2. wait until the price tests the POC as support or resistance . From time to time the price can consolidate directly on the POC, which indicates the "battle" of long and short traders.
Pay attention to the chart. I have selected for you 4 cases of using POC on the volume profile:
1. Bitcoin just touched the POC at $39,700 and bounced up 72%.
2. the price tested the POC as resistance at $61,100 after which the price fell by 45% from the absolute highs.
3. Bitcoin consolidated around the POC at $39,000 for some time. The price fell by 31%.
4. POC is at the price of $19,150 per Bitcoin. Now you have to expect the price to return to this level and carefully watch the price reaction on POC.
🔥If the POC is tested as resistance , then it is very likely that we will see the level of $13,000-14,000 for BTC.
🔥If the POC is tested successfully as support , then the price will be able to make higher highs and start a bullish trend for Bitcoin. I talked about this scenario in previous ideas.
🚩 HOW TO ADD VOLUME PROFILE INDICATOR WITH POC TO YOUR CHART?
3 steps to add the indicator to your chart:
1. open "prediction and measurement tools" at the left part of chart
2. choose the "Fixed Range Volume Profile"
3. choose the price range from some date till another date.
So now you can see all important value areas and point of control.
✅ Point of control help you to identify the power of bulls or bears on different timeframes and make the right trading decision in the most of cases. Personally, I use this tool effectively for swing trading and scalping as well.
Traders, do use this indicator and such tools as POC in your trading? What is your favorite idicator for trading? Let me know in the comments.
💻Friends, press the "boost"🚀 button, write comments and share with your friends - it will be the best THANK YOU.
P.S. Personally, I open an entry if the price shows it according to my strategy.
Always do your analysis before making a trade.

Learn How to Apply Multiple Time Frame Analysis
Hey traders,
In this article, we will discuss Multiple Time Frame Analysis.
I will teach you how to apply different time frames and will share with you some useful tips.
Firstly, let's briefly define the classification of time frames that we will discuss:
There are 3 main categories of time frames:
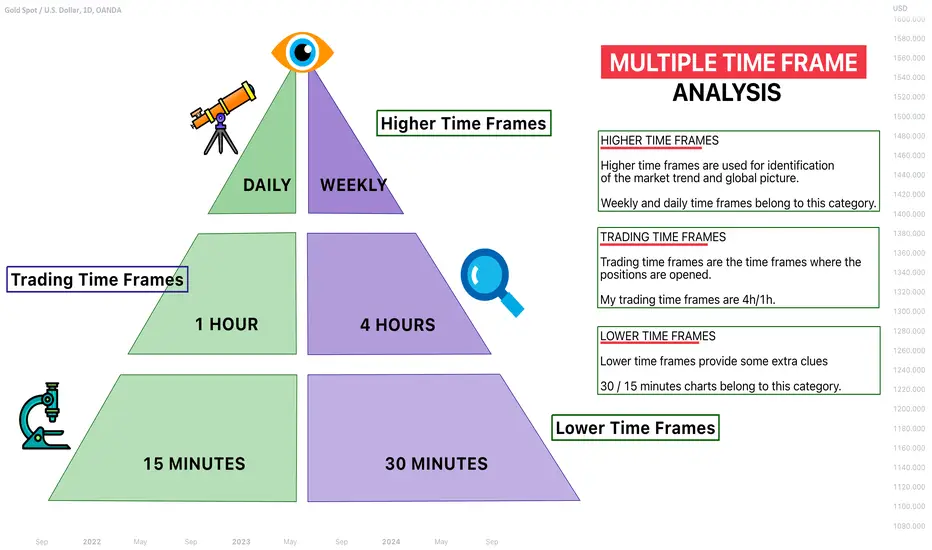
1️⃣Higher time frames
2️⃣Trading time frames
3️⃣Lower time frames
1️⃣Higher time frames are used for identification of the market trend and global picture. Weekly and daily time frames belong to this category.
The analysis of these time frames is the most important.
On these time frames, we make predictions and forecast the future direction of the market with trend analysis and we identify the levels, the areas from where we will trade our predictions with structure analysis.
2️⃣Trading time frames are the time frames where the positions are opened. The analysis of these time frames initiates only after the market reaches the underlined trading levels, the areas on higher time frames.
My trading time frames are 4h/1h. There I am looking for a confirmation of the strength of the structures that I spotted on higher time frames. There are multiple ways to confirm that. My confirmations are the reversal price action patterns.
Once the confirmation is spotted, the position is opened.
3️⃣Lower time frames are 30/15 minutes charts. Even though these time frames are NOT applied for trading, occasionally they provide some extra clues. Also, these time frames can be applied by riskier traders for opening trading positions before the confirmation is spotted on trading time frames.
Learn to apply these 3 categories of time frames in a combination. Start your analysis with the highest time frame and steadily go lower, identifying more and more clues.
You will be impressed how efficient that strategy is.
❤️If you have any questions, please, ask me in the comment section.
Please, support my work with like, thank you!❤️
Educational How Beat Retailers. Mostly Retailers Trap with SMC Traders. Please Carefully all education is good for you and beneficial for you.
if you want to Trap Retailers then you can learn SMC Trade Setup.

Using Multi-Time Frame Analysis To Find Key Levels That MatterDo you find yourself drawing too many levels on your charts?
Do you struggle to know which levels that actually matter for trading decisions?
Do you wonder why price moves straight through some key levels and not others?
This video will show you how to analyse a stock using Multi-Timeframe Analysis techniques to find the key levels that actually matter for trading, and how to quickly find the most important levels where price is likely to react.

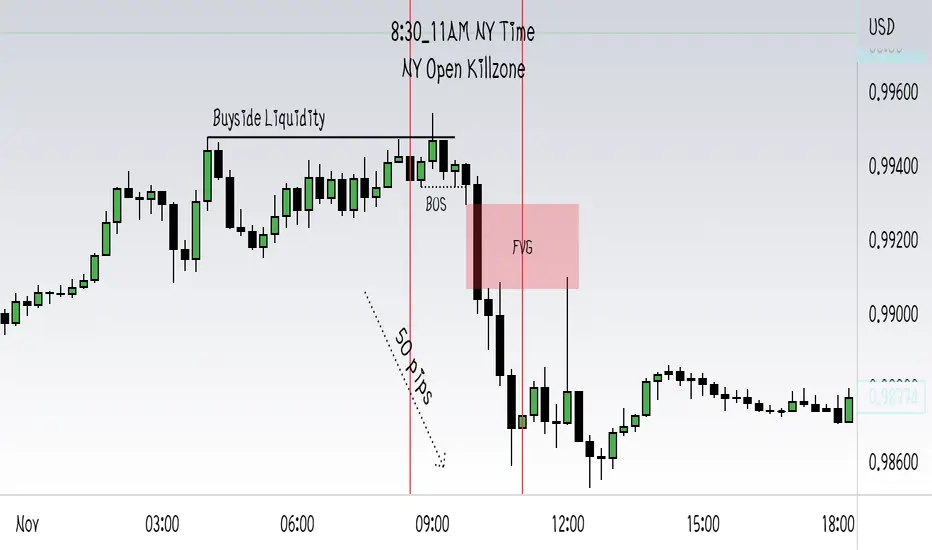
New York Open Killzone Explained | Real Trading Concepts8:30 in the morning NY Time is what your eyes
👁️👁️ should be on. This time of day unleashes huge volatility in the market that you can take advantage of if you know how to benefit from it.
Price at this time likes to entrap a lot of retailers to revers against them and take stoplosses.. Every day at this time..A Lot of news, a lot of volatility, and clear direction and price movements..
Don't Forget to LIKE ♥️ and make sure to FOLLOW if you want useful ideas straight to your email👌
Let me know your opinions in comments 😉
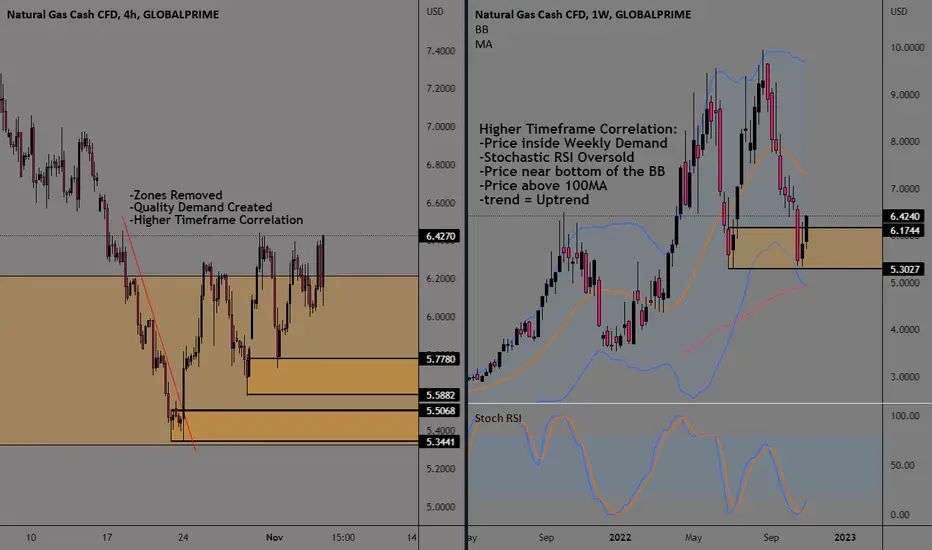
Multiple Timeframe AnalysisWhen traders ask "what was your light-bulb moment in trading", I often say 2 things:
1) stop worrying about what other traders are doing and focus on yourself making sure you are consistent with the trading strategy as that's how you will get consistent results.
2) understanding multiple timeframe analysis.
Once I started focusing on myself and was consistent with my trading, I was able to review my journaled trading results and noticed by best trade setups happened when price has multiple timeframe correlations with both my enter timeframe and higher timeframe.
The main purpose of the higher timeframe is to help me determine if I should be looking for buys, sells, or staying out of the market. The 2nd purpose of the higher timeframe is to determine the trend.
Multiple timeframe analysis can be used on all trading strategies whether you trade supply and demand, support and resistance, chart patterns, or use trading indicators.
All we are trying to do is determine whether we should be looking for buys, or sells as this will help us increase the probability of our trade.
See Chart For Analysis. I also have a full break-down on my youtube: Moneyball Austin
London Open Killzone Liquidity Build and FVG Hello Traders! What I shared with you happens on most days of the week and is a super easy way to get trdaes that are highly probable..
London Open Killzone time is: from 3:00 AM to 5:00 AM New York Time.. (though it could extend a bit further)..
What we should be looking for is this scenario:
We have a clear liquidity area..(single or double lows/relative equal lows) and time is London Open Killzone and we have reached liquidity area.. on this case we expect price to reverse and we look for a confirmation (in this case a "Fair Valie Gab")..
Note that:
I recommend using 15-min chart to spot liquidity area and for looking at how price is performing..
And once we get into a liquid area, we should go lower (5-min_1-min) charts to look for FVG..
Hope you find this helpful 😃
Let me know your thoughts in comments I would be happy..
Be Well All!

The 3 TYPES OF CHART YOU MUST KNOW | Trading Basics
Hey traders,
In this educational video, we will discuss 3 different chart types:
range bar chart,
line chart
candlestick chart.
I will explain to you the difference between them and will teach you why they are important.
❤️Please, support this video with like and comment!❤️

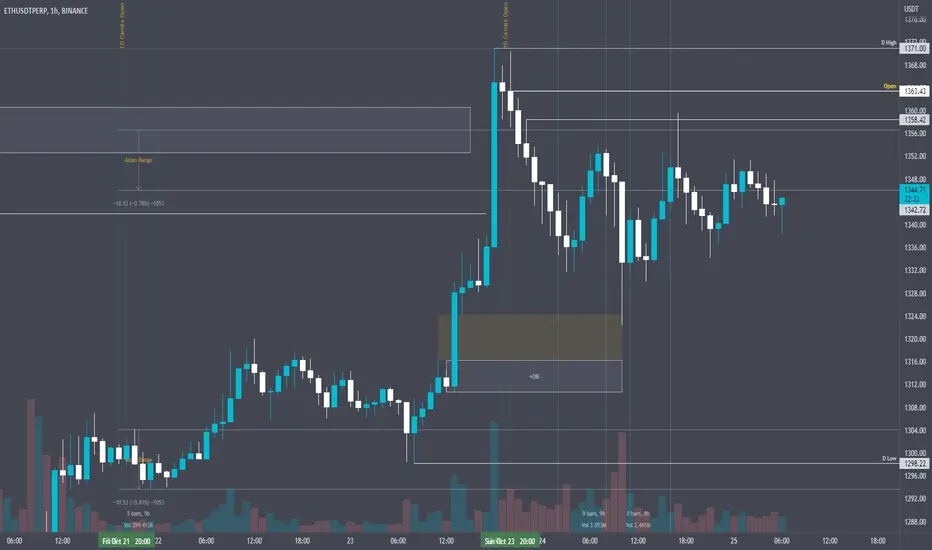
Friday's Asian Range Concept Study in CryptoICT's guide to Friday's Asian Range Concept in relation to a normal Monday's Trading. The accuracy is quite astounding. At exactly 5x the Asian Range of Friday in confluence to any Price Area of Interest and Monday's Daily Bias. It makes price prediction almost quite effortless.
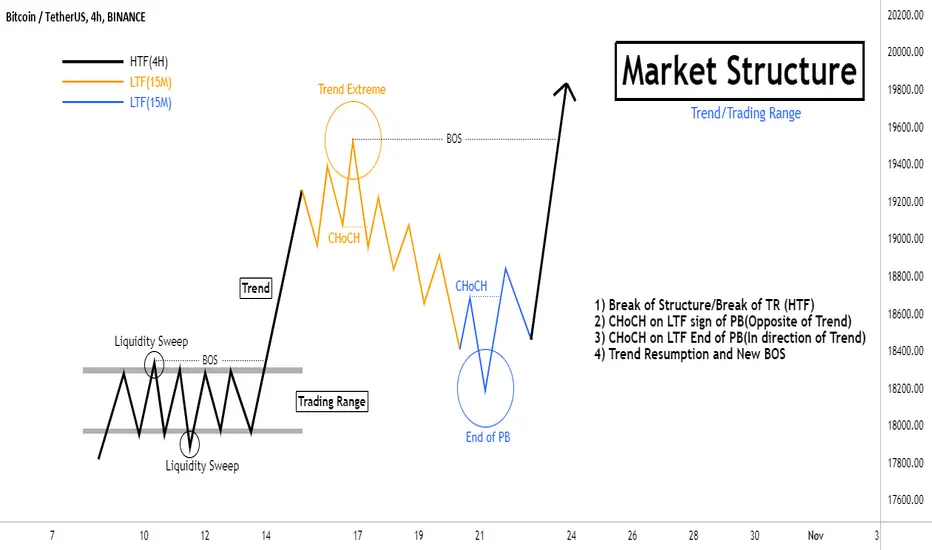
💥Weekend Learning: Simple Approach to Market Structure💥I try to draw a simple market structure for trading range and trend. Lets check details about market structure.
Trading Range:
Trading range is where both buyers and sellers are active and trade. On the range market we see 2 sided liquidity. Above range that is buy side LQ and below range that is sell side LQ.
If one side LQ sweep happens, we can expect the other side sweep too.
USDJPY 4H Example of Trading range and LQ Sweep:
I recommend to avoid trading in trading ranges and wait for clear breakout, but if you want you can use the buy low, sell high strategy. Check out my September 15th analysis on bitcoin to understand what I mean by buy low, sell high👇🏽
Trend
When market is not moving within trading range, moving fast(creating inefficiency) or creating series of HHs and HLs if buyers in control, LLs and LHs if sellers in control. We are going to learn about market structure after trading range breakout or break of prior high and low.
1. Break of Trading Range Happens(4H Timeframe):
2. After Break of Trading Range or Prior High/Low, Always Expect PB. When PB ends look for entries in direction of trend(15M Timeframe):
Check out the 15M chart for CHoCH opposite side on trend. When happens, sign of PB!
3. If CHoCH happens in direction of HTF trend, signaling the trend resumption(15M Timeframe):
4. Trend Resumption(4H Timeframe):
Tips:
1. You check the 4H chart and if you see a movement more than 40-50pips, its another sign for beginning of PB:
2. CHoCH in 15M Timeframe is just a signal for beginning/end of PB. Nothing is 100% in the market.
3. You can use premium/discount areas as filter to check the end of PB:
**You can combine the market structure stuff with supply/demand zones and find entries.**
What do you think about this chart? Feel Free and Comment Below!
Learn "Smart Money" TA - Let All Other TA Go - A Case by BXWToday I posted a GBPUSD idea and it was my first Idea posted that hit my stop loss first before I was able to secure profit. All of my ideas dating back to may are hit the target almost every time. If it doesn't, it will usually hit a couple take profit levels that I will have prepared, Or it may not hit the entrance yet the idea is there and price goes to the area I expect it and I still get in on the trade and update my idea as to when and how My trade was changed.
I cannot give financial advice as I am not a licensed by the SEC for taking the series 7 exam. I'm studying to be a financial advisor and The series 7 is primarily on how to use option on equities (or indices) for your clients and how to protect them from losing a lot of money.
Your taught the straddle strategy, the point of the straddle strategy in options is due expecting volatility but you don't know which direction the market will go.
What if theres a technique out there that will provide you with information to study the price action and you'll be able to know the direction already? You wouldn't need a straddle option for equities. You'll just need to move that principle to futures trading and move away from equities, (Or you can still use options, just buy a call or a put if you know the direction and don't straddle, waste of money on buying the premium for the options contract)
Being Privately mentored in "Smart Money" It has been months since I have had to guess the direction on a trade. I may not have the perfect entrances to trades (Although I'm working on it and getting really close)
I have used "Smart Money" In the Forex Markets, (You can see my recent ideas on EURUSD that took two days to hit the take profit, but I barely got the full take profit ()
I have used it in the Crypto market and have kept the same principles and profited
Ripple hit two take profit levels
()
Ripple Switches directions - Chart Updated
()
Chart for the above idea
Counter Trade within this current trade
Also, Used the same principles on a Commodity such as Gold
()
Current Futures Chart for the Above Idea that was called with Smart Money
If things don't go your way always remember two smart money principles.
1) price will want to attack liquidity
2) (more importantly what helped me out of the red on todays GBPUSD trade) Price will look to fill imbalances.
Therefor you have an advantage as to knowing the direction. But it's much more complicated.
What's an Imbalance?
A fair value gap is an imbalance, a regular gap in price between candles is an imbalance (if you trade equities, you know that those gaps need to be filled), a liquidity void is an imbalance (when bodies of two consecutive candles don't touch, when you get a candle with a large wick, it's close and the next candles open has a sizeable gap) These are all forms of imbalances. Some do not fill immediately. Especially if you see a liquidity void on the monthly chart and you 400 pips away. (But if you have a sizeable one on the 15 minute chart and it's been a few hours, I would start looking for order blocks or breakers that price maybe moving to and reject back to the liquidity void)
The rest of the Tutorial is an example of why learning Smart Money is of utmost importance
(Monthly GBPUSD Chart where there are two liquidity voids, after two, the price moves towards them and fills them but now we have a monthly fair value gap and another liquidity void, this was 1985 and 1986, price is now below this aiming for that monthly fair value gap as rice neared it)
Understand that it will fill at some point, mark it on your chart, but as you move down the smaller time frames (weekly, daily, 4 hour, 1 hour, 15 min Dont use odd time frames like 10 mins or 3 days, the institutions do not think like this, they use the monthly, weekly ,daily to p [lan and the hour and 15 min when executing a trade) Look for these gaps, rectangle them, color coordinate them, make sure you know which one is which because by the time you get to the 15 min chart you could have a monthly weekly and daily overlapping, you need to know which is which, look for areas where liquidity will build (equal lows/highs, Multiple same price level hits)
You see this on your monthly chart
Expect price to break those lows because that's not support, that's where a lot of buy limits will release a lot of money into the market when price nears it. Retail is taught to "BUY" at these lows. But if people buy at support and price goes against what you've been taught and sells through to your stop loss, the money is then transferred from your account to those that shorted. Look below it's the 1986 Monthly fair value gap
You could get lucky and buy at Support, for probably 15 minutes to an hour, after that, I would personally look to bail and get out. In Fact, I wouldn't even be looking to buy. Because price is going to pierce A lot of stop losses.
This is the daily chart buying into 3:1 ratio with 100 pip stop loss, you got slaughtered (I just lost 200 so I can't say anything, but I gained it back so there's that)
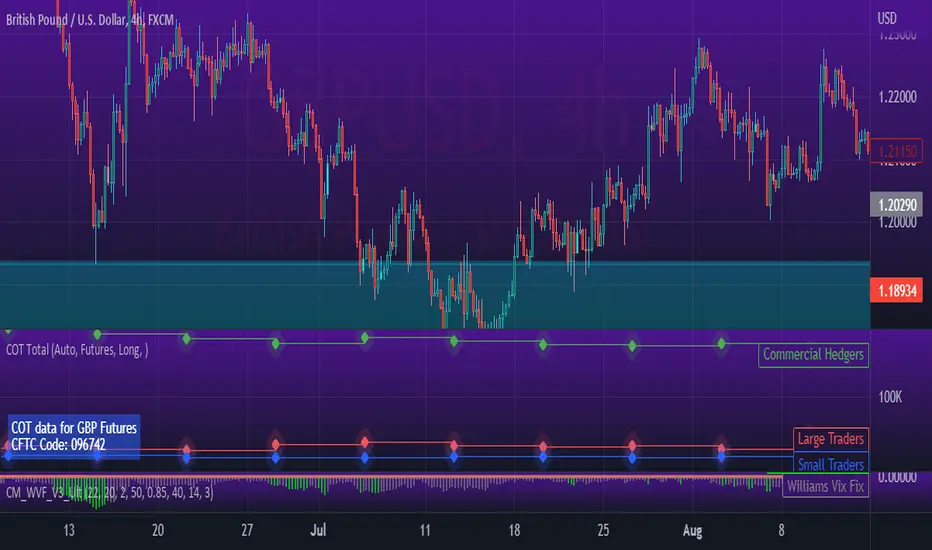
Now 4 hour
You had less than 4 hours to try and catch the "Support long" After price buried into the monthly FVG (Now this was during covid) However, I feel as if it was going to do this anyway at some point just based on the 1985/86 price action. I want you to look at the bottom Indicator. That is the Commitment of Traders. it provides information on 3 classification of traders based on their account sizes. Retail Traders (us using this site mostly), Large Traders, and Commercial Hedgers (I'll explain them in a minute)
Now, You wouldn't have seen theses numbers ahead of time but I encourage you to look up the same chart and add the same indicator, because if you trade anything that is on the Futures Market, it has to be reported to the CFTC and they create a report out of it. And when see a chart with a similar formation, you can expect the same reaction by each of the classification of traders.
Who are the Large Traders and Commercial Hedgers?
It is not very clear who is who, the law was made to be more transparent. However, a brief overview can be found on the CFTC website here: (For Financial Futures - This includes things like Bitcoin, The S&P 500, and the Japanese Yen www.cftc.gov )
Website all inclusive: www.cftc.gov
During my private mentorship this is how the 3 categories were described to me.
The Large Traders (could be a single person that is considered an accredited investor with a lot of money to small money management firms that have been given permission by their client(s) to trade forex. It says on the website it depends on the form 40 that is completed by a broker/dealer. Usually this a small company that find and/or teach people how to trade. They then trade with money given to them by the owners. If they prove themselves to the owner or who's money they are trading with then they get more money to trade and a commission deal is created between them. These guys are taught by technical analysis via another human what they have learned in the basics from the the series 7 test prepared by the SEC (WHERE THE LARGEST BANKS INFLUENCE BUT THE SEC DOES NOT GOVERN) However, these people usually trade in the equities markets and trade single stock options. Not Forex or Crypto. At the time of the above chart, where price came down below "Support" that week the Large Traders added .5k long contracts. This shows me they were thinking it would go long at the level of support.
The Commercial Hedgers are usually in the Asset Managers/Institutions section of the CoT report. These are certified Series 7 completed asset managers that can work for Edward Jones, Scwab, TD Ameritrade, etc. Except they usually focus on long term and manage other peoples 401k's on ETF's and mutual funds. Every once and a while you'll get an accredited investor who asks their asset manager to be more aggressive. At that poin again, they focus on stock option strategies. Forex has the most liquidity of all markets with more that 7 trillion USD$ a day.The reason this number is so big is due to the institutions. Also called Market Makers, they are the traders employed by central mostly banks and other larger banks such as Deutsche Bank, The Federal Reserve, The Bank of England, The Bank of Japan, Credit Suisse, Reserve Bank of Australia, European Central Bank, International Monetary Fund, etc. These are the institutions because currency is their commidity and they want to protect it. (The banks that have endless amounts of money vs. an asset manager like Schwab) In the trade above where price is moving toward "Support", the commercial Hedgers have added 20,000 net short contracts. And those short contracts were probably coordinated on the futures market right at that time between all of the privately owned central banks. These bankers created modern day Technical Analysis.
Here on Tradingview, nearly 99.5% of every chart that is created and shared as an Idea originally was from an institutional trader. They created retail and taught the masses the same. If they know how you trade. And they have much more money than you, then they know how to trade against you.
This is why smart farmers short their trade their crop they grow if they know the yiekld for the year is not going to to be a high yield for most of the U.S. on the futures market, if they probably know that the price is going down then they will move with the commercials like we see in GBPUSD. The following week when price goes up,
the Large Traders (The ones who don't think outside the box and think that they're catching a breakout down, by selling at "Resistance" after it broke "support" because they're just doing what they were taught by the banks. The Large Traders add 10k net short contracts that week. As you can see it does not go down it instead co es back up and is now losing money, Do you have a money manager? Could be your money. Commercial Hedgers? They control the chart so they add 10k net long contracts making the money that the large traders lost. And the Chart moves up past the "Resistance" Into a new level, finding price levels From previous months that need to be filled.
You want your money in the hands of asset managers? As I'm studying to become a asset manager, again, the series 7 required by FINRA, to be an asset manager, is very options heavy. They focus on options Spend large amounts on the premium just to gain a little on a covered call or short. It drives me mad studying for this. Additionally, Yet the Commercial Hedgers (aka large institutional banks) banks only give you 1%-3% annual yield on a savings account or a Cash Deposit (aka "CD"). Whose getting screwed on this deal? (you) Give your money to a licensed money manager? They're going to lose it for you, or at best, grow it very slowly for you you. Whose getting screwed on this deal (You)?
I wanted to learn technical analysis because I wanted to retire earlier. After my first year being taught by a Multi Level Marketing Company, I lost thousands of dollars.
Then by accident, someone mentioned the name of the godfather of smartmoney in the chatroom of the previous scam company I was learning from. At the time I was learning Wyckoff method, (en.wikipedia.org) which really only explains what is typical during consolidation phases and to understand when the chart could ready itself for distribution, and suggests that there's an "operator" in the market manipulating it. Wyckoff is a good thing to know. I took the time to look up who the person named and realized he did not live in the world we all live in. It was a breathe of fresh air. His trades had a meaning to them, a meaning to why the direction was going where it was going, how to measure certain things, when to expect these things, and I was lucky enough to be in his last mentorship program that he will do in private. He has one on youtube now that's free for the public but it's nowhere near as detailed as what he taught us with 3-4 videos a week. Core Lesson Videos along with Current Market Price Reading Videos. For a full year, I stopped trading, I studied instead, I studied what he told us to stuudy and I would do it for hours. There are others that were mentored by him on here as well. They are rare to find. My mentor was innercircletrader, a former computer programmer turned institutional trader. Trading since the 80's, He wanted to learn so he could learn an algorithm and program a robot to trade for him. There were many times he thought he had the market figured out. A combination of a moving average and the commitment of traders, with an overlay of the Commodities index and he thought that was it in his 20's, now in his 50's, I can say I've never seen anyone predict price with such precision, He could get it within 1-2 pips from entry to exit most times. He did say that after so many years there's no way he could program a robot to trade for him even though he knew so much. And that's because the market's algorithm changes every 24 hours.
And by looking at the Commitment of Traders report, seeing this evidence of the so called "Support" your supposed to trust, and see it get obliterated (By institutional traders), I can't trust my money with just anyone and expect to be ok when I retire. I need to take it into my hands. And I did, slowly built up an account lost some trades, but I kept practicing, kept my head in the charts, and I now have a sizeable account myself as you can probably imagine with the ideas posted that I have consistently profited from for the past 6 months. If you're technical analysis is not " Smart Money", and it doesn't have a narrative, you're burning your money.
Are you making the money you want? Would you consider yourself successful? Be honest with yourself. According to statistics, most people quit after 1-2 years because they've lost way more than they should've (money they could've spent on buying a house ,cars, vacations etc... and I was on my way). I was told in the beginning that technical analysis will be easy. Well it's not, it takes time and a lot of work. I can spend hours on one chart.
Are you being consistent with your trading? Do you only trade on certain days? Are their webasites you can go to to see if they will release information that will create market volatility? T
here are a lot of people on here that have very pretty charts, but their analysis is way off, and they offer no explaination as to why they think that price is going to move in the way their chart suggests. I just see "Looks like We're going down!" C'mon, put some effort into it. Yet they are featured by the Tradingview Team.
I remember being feature for my analysis a few times, and it was when I did not know how to trade. Ever since I have learned how to trade, have consistent earnings, and my students that I teach privately have shaared a few consistent winning trades on here, and they haven't been featured on here, yet. I hope one day that it will get recognized and start winning charts with "Smart Money" Principles, and they have yet to be featured. Why? Tradingview wants "Pretty Charts." If you've got a cool looking indicator and you have a channel and use the channel feature in the drawings section, Also ad some solid boxes where you think the "Supply" and "Demand" zones are and boom. Your front and center of everybody. Then you click on their play button on their Idea and you see it go the opposite way. No reflection on the idea after the loss. How are you supposed to learn if you don't opine on the loss? This entire tutorial is has been my reflection on my GBPUSD loss today. Which I actually didin't lose in the end. My mentor would've told me to walk away and not rage trade to try and get my money back. I didn't, Instead, I calmly remembered my training, and what price does, and had a few scalps and earned my money back thast I had lost plus more and I surprised myself that he was spot on what price would do as far as filling imbalances.
After you read this, and you see the evidence I have presented hardening my case for "Smart Money", and if you look at my last 10-12 ideas I have posted here, hit play, and see some charts nail the entrance and exit, some make good profit, but I mmay have not have hit the whole target (But you always have 2 prior targets prior to your final profit that wauy in case you do lose, you'll gain something and add a win to that W column. My charts maybe ugly because I use three features (Horizontal line, Fibonacci that has been altered (specifically for Smart Money trading), and rectangles/boxes featjre), When price finally has a narrative as to where it's going, that's the only things you need.
The Reason I thought about Bodies And Wicks as a name had to do with Smart Money Trading, in a 3 candlestick motion, if he wicks don't touch the bodies on each side, it leaves a gap called the Fair Value GapAnd these gaps need at least halfway filled 95% Of the time. Based on that information alone, Where is Bitcoin going?
Learn Smart Money Technical Analysis
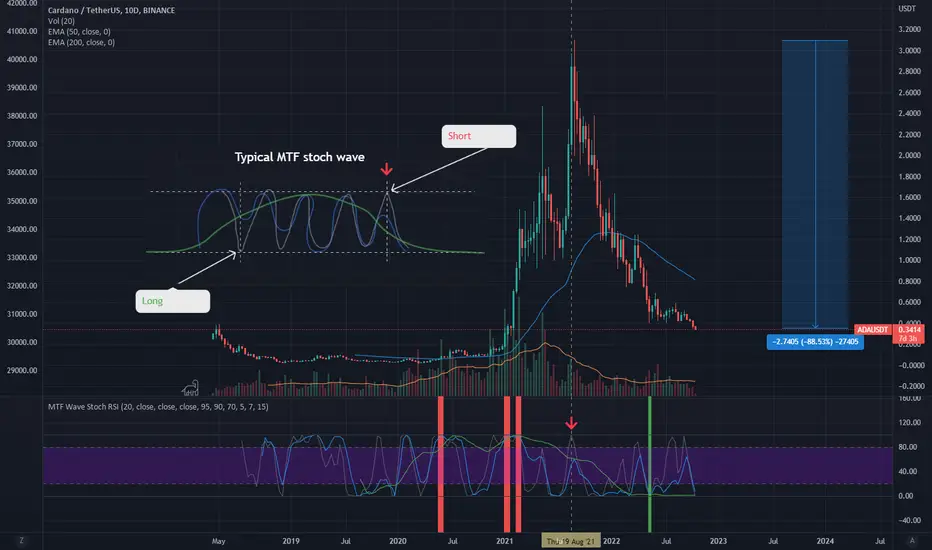
ADA example of MTF Wave Stochastic reversal patternExplaining what the MTF Wave Stoch is all about, does not get any easier with this #Cardano chart $ADA / USDT pair. Feel free to ask if you don't understand!
NAS100 TECNICAL ANALYSIS WITH UNCLNRBZ - PART 4This is a knowledge oriented video and I hope someone gains a bit of something from it.

NAS100 TECNICAL ANALYSIS WITH UNCLNRBZ - PART 2This is a knowledge oriented video and I hope someone gains a bit of something from it.

NAS100 TECNICAL ANALYSIS WITH UNCLNRBZ - PART 1This is a knowledge oriented video and I hope someone gains a bit of something from it.

🔥THE VOLUME PROFILE: HOW TO IDENTIFY THE BOTTOM ON BTC?Hi friends! Today i explain you the method that gives you another confirmation that the bottom of BTC is already reached. You will be well prepared for the next BTC bullrun using this method.
📊 What is volume profile?
Volume profile is the indicator that show us how many trades (volume) were made at some price. If the common volume indicator show us how many trades were made through the time, the volume profile show us how many trades were made at some price (10-12k, 58-60k etc.).
It help to identify the largest support and resistance areas, as well as liquidity gaps where the price PUMP/DUMP🔥 the most. Here is the educational idea with detailed explanation and instruction to the volume profile!
📊 How to identify the bottom of Bitcoin using Volume Profile?
This is what we need:
1. volume profile from the ATH to the bottom
2. point of control or POC
Point of control or POC is the area where the most trades were made. We marked it as the yellow line at the volume profile.
3. BTC dump for >-50%
If the price fell by 50% from the place where the most margin trades on Bitcoins were opened, it means that most marginal traders even with x1 leverage were liquidated.
🚩 Traders with x10 leverage were liquidated at a 10% drop, with x20 leverage were liquidated at a 5% drop.
✅ As you can see it was in 2015, 2018 and it`s happening now. After the 4-6 months consolidations (yellow areas) the small bullruns begin. Will it happen this time? Write your thoughts in the comments.
📊 Why are liquidations important for the growth of crypto?
This way the market becomes "healthier" and is cleared of weak hands. At this time, whales can accumulate a large position in Bitcoin or in another crypto. Liquidity at the bottom allows you to buy 10,000-20,000 Bitcoins. For example, over the past week, 60,000 Bitcoins were withdrawn from exchanges.
🏁 How to open the Volume profile?
1. Look at the left side tools in the TradingView chart
2. Choose the "Prediction and Measurment Tools"
3. Tap on "Fixed range Volume Profile"
That's it.
✅ Traders, every strategy has it's win rate. This one have the 100% win rate. If some patterns work very good for the couple of cycles, it can be changed with the times and market sentiment. So be carefully. Now the world economy has a not the best market conditions, but we get a lot of positive signals. Take a look at the Greenwhich indicator which also already confirm the bottom. Previously it help to sell BTC at 60-63k!
💻Friends, press the "boost"🚀 button, write comments and share with your friends - it will be the best THANK YOU.
P.S. Personally, I open an entry if the price shows it according to my strategy.
Always do your analysis before making a trade

🔥The LAST hope for crypto: why DXY may pump BTC soon❓Hi friends! This educational idea about the dollar index and entire crypto market will be really usefull for the beginners and the experienced traders also.
I`ll explain you several fundamental and technical reasons why and when BTC ans other crpyto will start rise. You can also use it in your trading to identify the global trend and open more succesfull trades.
As far as you may know, ✅the stronger the dollar index (DXY) the weaker all global assets and vice versa. This means that when the index rises, most stocks, cryptocurrencies fall. When the index falls the most assets grow very fast, especially such volatile ones as 🔥crypto: Bitcoin, altcoins
and 🔥shares of technology companies: Tesla, Meta, Apple, etc.
But when actually BTC and other crypto will start it's rise and you can open your best long trades❓ I explain you this in the both chapters about fundamental and technical analysis.
✅ Fundamental analysis
Now the dollar index is strengthening amid the Fed rate hike. This means that we have to wait until the trend reverses and the dollar index starts to fall. After that BTC and altcoins might start it`s new BULL MARKET.
📊 When the dollar index (DXY) starts to fall? The dollar has strengthened significantly against other currencies in the world (pound, euro etc.). This is caused by the latest rate hike to 3.25% and expectations for an increase to 4.4-4.75% by the end of 2022.
The stats for traders who want to understand how the growth of dollar index (DXY) affects other assets and currencies:
🚩The Euro is at 20 year lows.
🚩The Yen is at 24 year lows.
🚩The Pound is at 37 year lows.
📊 Do not be surprised that Bitcoin fell so much🔥, because according to the latest data, even the institutionals (big players) also scared and opened the biggest hedge positions since 2008.
🚩 It can be assumed that from the end of 2022 or early 2023 we can see a global reversal of ALL markets, including crypto depends on FEDs rate hicking end.
✅ Technical analysis
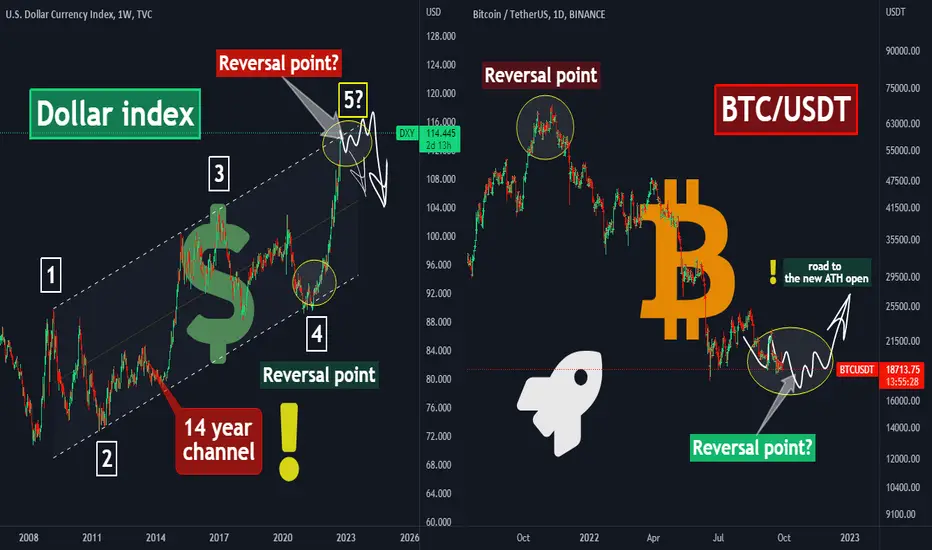
📊 14 year channel on DXY
Pay attention to point #4 on the dollar index chart. This is where the global uptrend for DXY and global downtrend for BTC began. The strongest dependence!
📊 When to open a long trade on Bitcoin❓
The end of the rate hike by the end of 2022 coincides with the technical analysis on the dollar index chart. The index is now at point #5, which is the upper boundary of the channel and the srongest resistance for the dollar index.
It is worth adding that this is not just a channel on the 5 min chart, which globally has no significance. This is a huge 14 year channel (‼️) on the weekly chart, which the price will test for the 5th time! This is a powerful signal for a reversal and resistance for the price.
🚩 The higher the timeframe, the more traders see it and, accordingly, the greater the price reaction on it. Montly>Weekly>Daily>4h>1h>...
🔥We can expect the index to fall from point #5 or at least partially consolidate at these levels before falling, as it was back in 2017 (or point #3). This can pull the price assest including BTC and altcoin to the new ATH.
📊 BTC global bottoms.
In addition, the reversal of the dollar index coincides with the formation of Bitcoin's global bottom. Bitcoin began 3/4 of its bull markets with consolidation at the bottom, which is happening now.
🚩 Of course, local manipulations with the collection of liquidity below $17,000 are very likely, but even now you can start to look for a good entry point in the trend reversal. For example, it may be the pattern of higher lows and higher highs, which is characteristic of a bullish trend.
✅ I use much more advanced trading systems to identify the best entry points and open trades either short or long, about which I write my ideas on TradingView, but this pattern will definitely help both beginner and experienced trader to earn more.
Traders, will you use this analysis in your trading❓ When exactly do you expect the global bottom on Bitcoin❓ Let's discuss it in the comments.
💻Friends, press the "boost"🚀 button, write comments and share with your friends - it will be the best THANK YOU.
P.S. Personally, I open an entry if the price shows it according to my strategy.
Always do your analysis before making a trade.
Learn How to Trade | Why to Analyse Multiple Time Frames 📚
Hey traders,
In this educational video, we will discuss why Top-Down Analysis
is so important and how to apply it in practice.
The video includes important theory and real market examples.
❤️Please, support this video with like and comment!❤️
