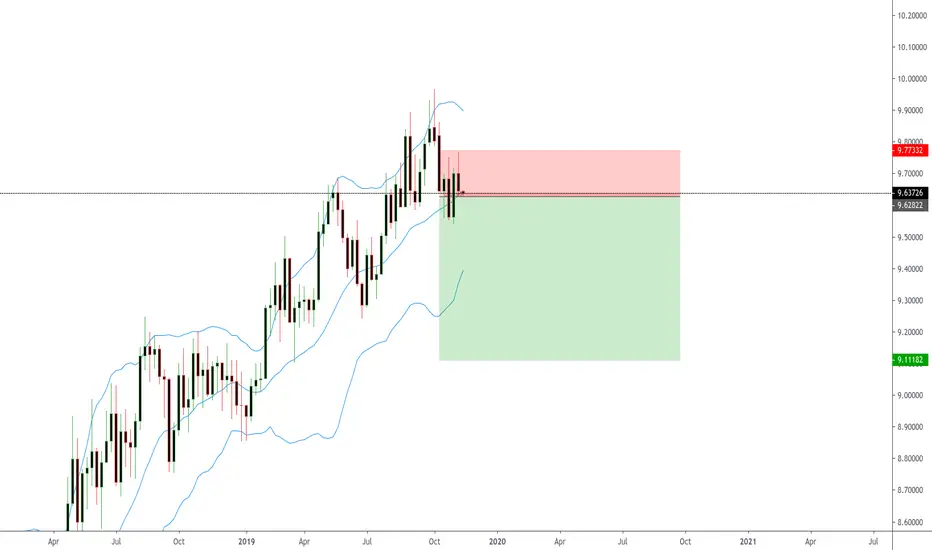
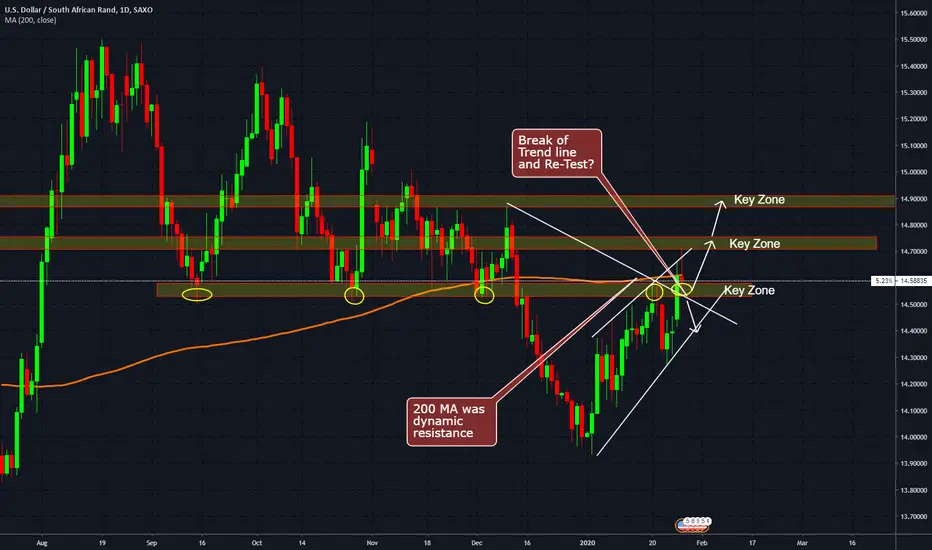
USD/ZAR Are the Bulls Warming Up for a Run? This tutorial is for demonstration and education purposes. For full study as we go along please join my $19 subscription channel where we day trade based on price action at www.celestefrederick.com
Price action trading is like reading a book. As price plays out we take note of what is occurring and can draw conclusions along the way based on price action at key zones in the market.
A few points to note in favor of bull run:
1. The past few weeks have seen more bullish momentum with pullbacks.
2. Price has breached the 200 MA on the daily timeframe. Price could very well attempt to maintain a footing above the 200 MA.
3. We see price is at a key level in the market. See how price likes the zone where we currently are by looking left.
4. Bearish momentum over the past day could very well be a re-test after a break of this key level as demonstrated with my notes. Price could then continue up after the re-test.
5. Keeping fundamentals in mind, with the economic outlook of South Africa and the impact of the Coronavirus in China, the outlook could negatively impact the South African economy. China is a key investor of the South African economy. Economic consequences of the virus spill over to South Africa.
We still can't count the bears totally out.
However, price action tells the story..Will price breach the current zone where it is sitting and pullback? Price action will tell.
My study group is catching pips on this pair daily based on price actions in the market daily. Would love to have you join us!
Please visit my website at www.celestefrederick.com to see my subscription packages and also other free resources. Please also refer to other trade ideas on USD/ZAR which help support this study. Links to a few are below.
Happy Studying and Trading!
Multiple Time Frame Analysis
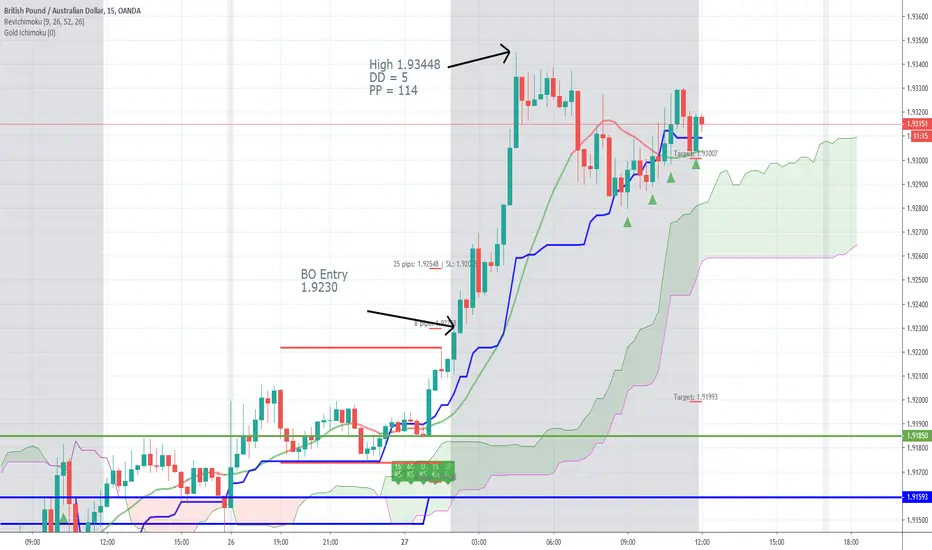
GBPAUD documented Type 1 TradeThis is a Textbook Type 1 trade. All 4 horseman aligned. A good solid breakout. minimal draw down and runs to Profit target.
Allen
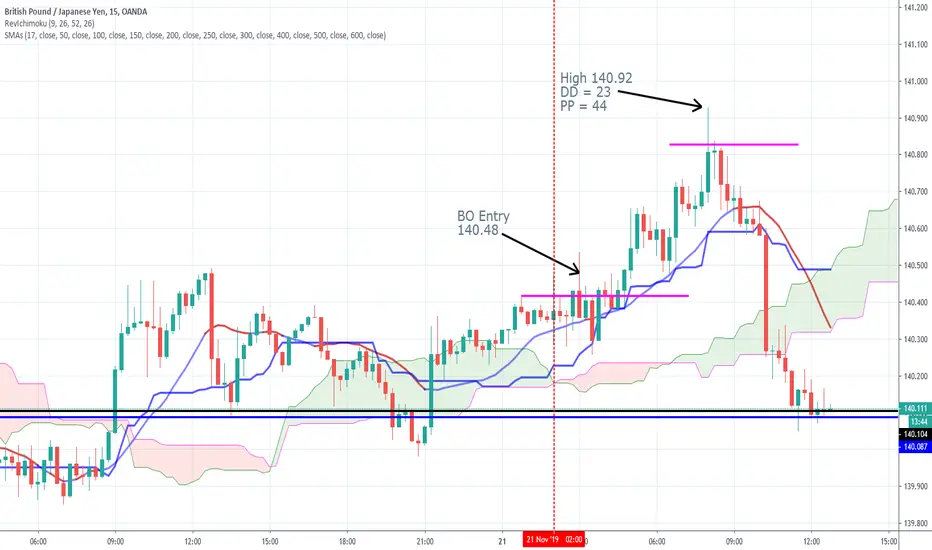
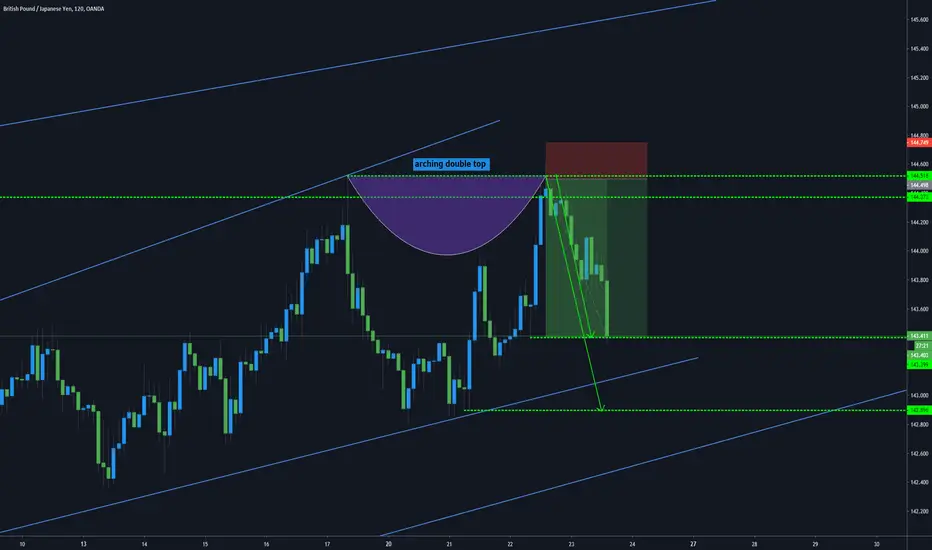
GBPJPY this was a fantastic trade looking at the psychology behind why this trade was taken in the first place we look left and see just before this trade we had 3 high top area, 2nd taking out the last high then dropping or if we trade supply or demand you will understand what this was doing IE filling more orders up so in this case comes back taking the retailers out the trade to then push the markets back down again,so what do we have here again ? the same events taking the retailers out and grabbing more short orders again and breaking a new high catching other traders on the wrong side of the markets.
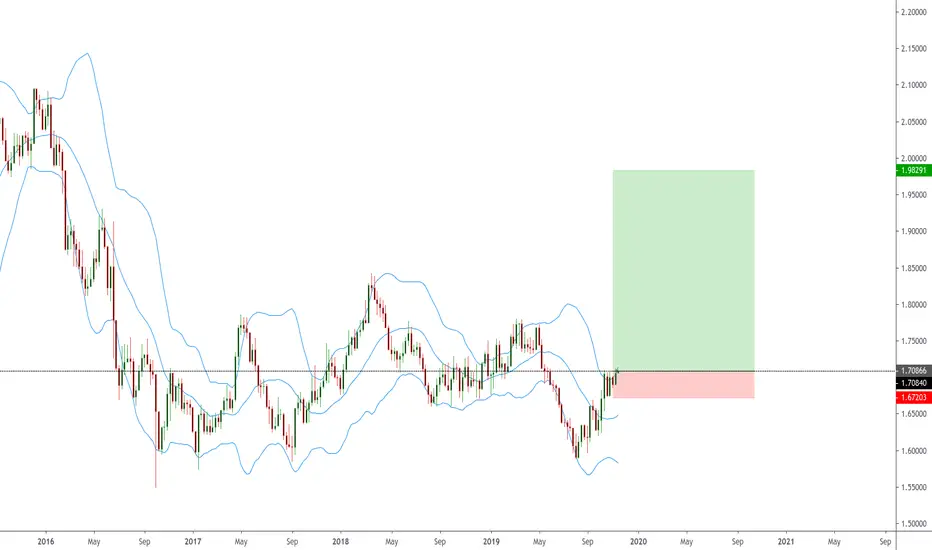
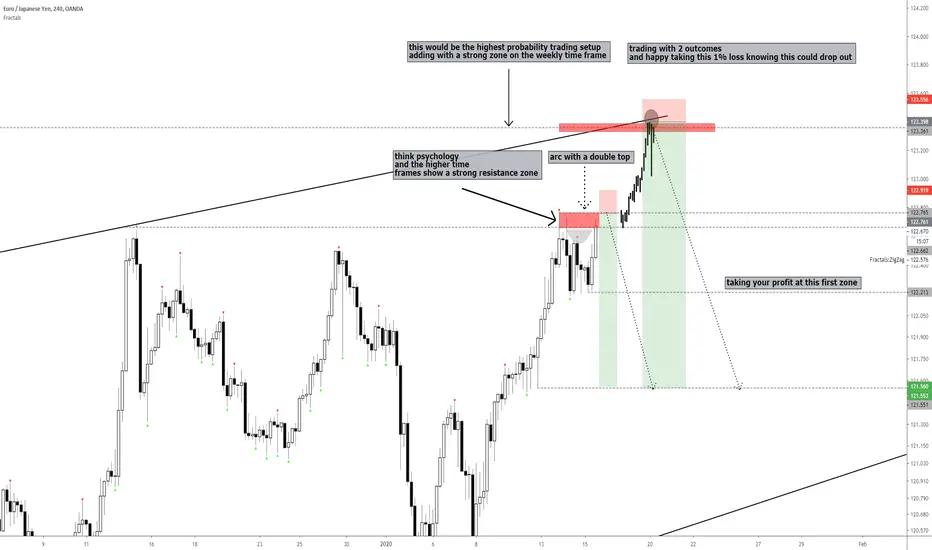
EURJPY psychology can we accept that 1% loss ? so this breakdown shows 2 outcomes and what is possible in both situation and your trading psychology behind both sets up ? can you accept this 1% loss knowing that this trade shows and lines up with the higher time frames ?
and seeing how we got there with some strong momentum would this put you of this trade ?
biggest issue behind trading falls from your emotions
we wouldn't take this trade if we haven't risk correctly
or we haven't respected what the markets give us
or we revenge trade after taking loss after loss
accept any outcome and train your mind to cut your looses and ride your winners
happy trading :)
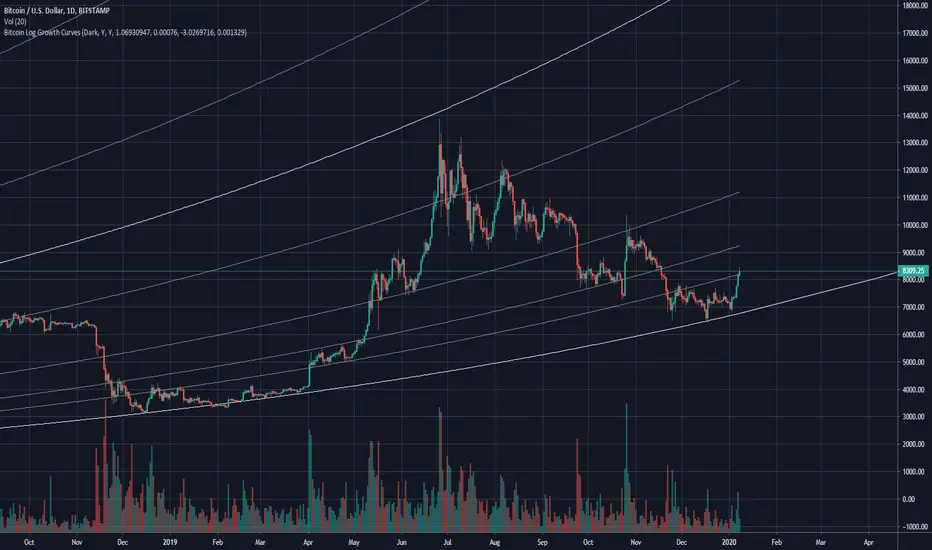
Here is BTC Indicator can find support & resis. using fib levelsI discovered an interesting indicator today called "Bitcoin Logarithmic Growth Curves" (from quantadelic) that bears mentioning. It does a good job of finding support and resistance using Fibonacci levels without having to draw them.
Unfortunately it works only on BTC charts but it does display them well for any time frame. It also works on logarithmic charts but as expected it will create straight lines instead of curved lines.
The lines shown on this chart were drawn automatically by the indicator, so there was no user bias involved.
It's not perfect but since it takes no effort to display the Fib lines on the chart there is no way to misdraw the lines. It gives you the ability to detect strong areas of support and resistance that you may not have seen before. You can also set up alerts for any of the levels which is quite useful.
I have only been playing with it for an hour, but thought you guys might be interested at seeing what it can do. I'm adding it to my arsenal of tools. I only wish I had it sooner.
How To Plan Plan A Trade With Fibonacci Ratio ConfluenceHi Traders, In this video we will look at How To Plan Plan A Trade With Fibonacci Ratio Confluence. Fibonacci ratios are most powerful tools with they are used in right manner. We can use them in all sorts of market conditions and asset classes. Fibonacci confluence creates harmonic patterns and gives us very good reward risk ratio. The best thing is the possibility to pre-plan and quantify a trade with high accuracy.
Please feel free to comment or ask questions. Hit the like button if you found value in this post. Thanks! :)

TRADING TIME FRAMES COVERED!Hi all,
I know i am abit late with the video feature but better late than neverrrr!
In this video i have covered the key trading time frames and the things you should be looking out for.
What would you like me to cover? leave your comments below and i will get back to everyone! :)

GBPJPY Post UK News documenetd trade +122 Pip PotentialThe UK interest rate decision was released today at 12 pm GMT and turned out to be a non-factor. That allows to revert to our technical trades, which provided a Type 1 Breakout on GBPJPY.
With all 4 Horseman aligned, this pair ran beautifully down to our profit target.
Allen

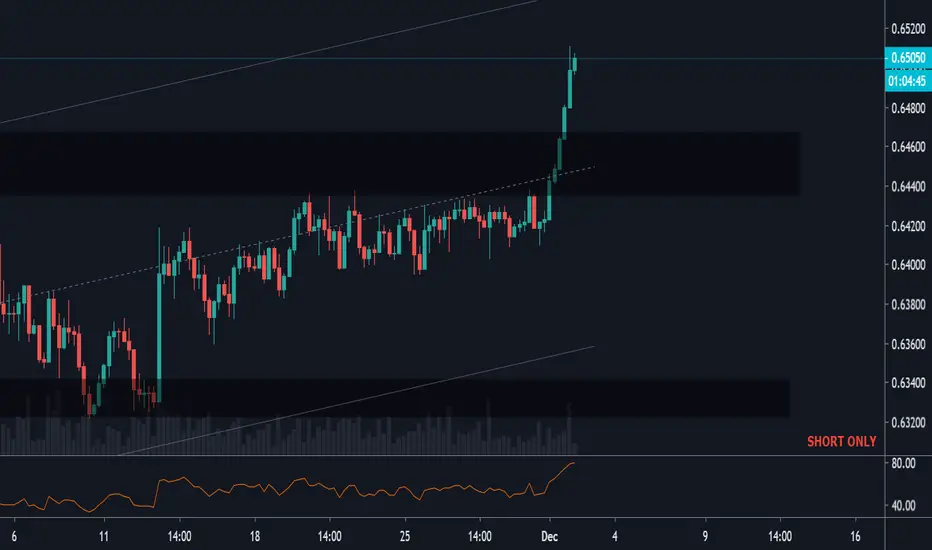
ONE OF TRADINGVIEW'S MOST POWERFUL TOOLS - And it's 100% freeThis tool will eliminate 50% of your bad trades INSTANTLY!
Can you guess which one it is?
RSI?
Volume?
Trend lines?
Sexy rectangles?
No. None.
Anchored text!
Notice I have "SHORT ONLY" at the bottom right of the screen. Anchored text will appear on any time frame, so if you flick from Monthly to 15 minute it will always appear on screen in the same location. It's the T with an anchor under the text tool :)
So why is it so powerful?
Do your Fundamental research, create and idea first. Do you want to go long or short?
Is there is a huge monthly downtrend, would you buy in it?
Pick your direction FIRST, anchor the text to your chart and NEVER EVER go against it. Doesn't matter how good the set up is, only go in the direction you have decided!
BOOM! all them bad trades avoided.
Anchored text, you won't find people selling courses on that !
Make it rain!
GBPCHF Documented MA Trade + 77 Pip Potential (hit 60 Pip Profittoday we started with a slightly mixed market (only 2 bullish pairs) but a preference to sell because of the gap down at the Sunday open. After the GBP pairs pushed down (and we got a great breakout trade), we set-up an MA trade on this pair. This was the last to reach the MA. and clearly worked the best. Those who trade the Gold Method Ichimoku and have been in the training, know exactly what I am talking about.
These trades have been like an ATM machine over the last month :)
Just keep stacking those positive days :)
Allen

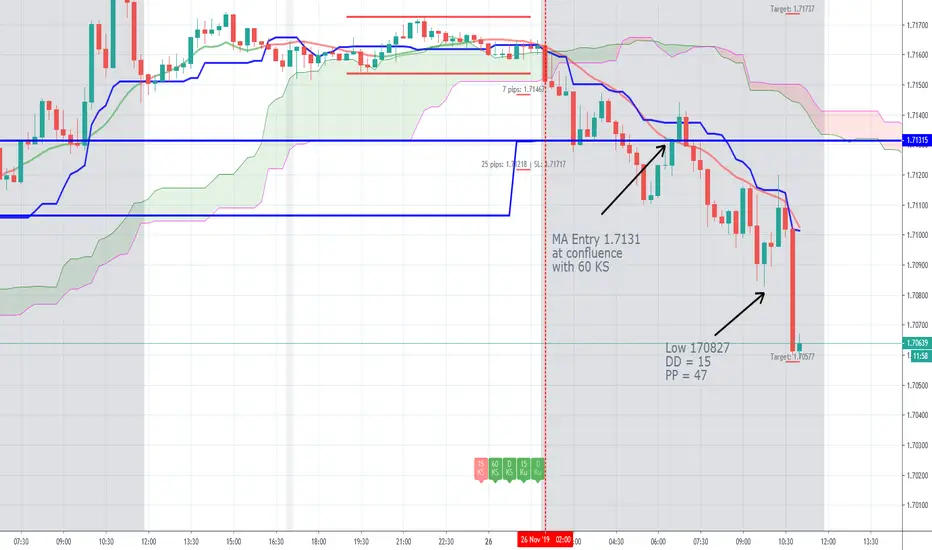
GBPCAD Documentted MA Trade +47 Pip PotentialToday we started with a GBP bullish view but after the GBP pairs pushed down, we set-up an MA trade on this pair. Although this was not the last to reach the MA, price pulled back to the confluence of the MA and the 60 KS. Those who trade the Gold Method Ichimoku and have been in the training, know exactly what I am talking about.
Since this trade triggered later in the London session only about 75% in the trading room took advantage of either this pair or GUSD. All who got in made money :)
Just keep stacking those positive days :)
Allen
The Gold Method Ichimoku Weekly reviewThis was our Seventh week, and the last of the month, in the Training room for The Gold Method Ichimoku.
I need to thank those who took part and for all their hard work and effort this week. With the various news events we were meeting at different times and looking at different market conditions Working with you guys was an absolute pleasure and I look forward to continuing our relationship, so you achieve your goal of becoming Professional traders.
Here are the quick Stats for our days together:
6 winning trades
1 losing trade
Pips won: + 2768
Pips Lost: - 20.3
Here is a day by day breakdown:
Monday: We had a Type 1 trade set-up in GBPJPY which triggered, rocked up to our Profit target, closing for 75.1 Pips profit. The trade never saw red
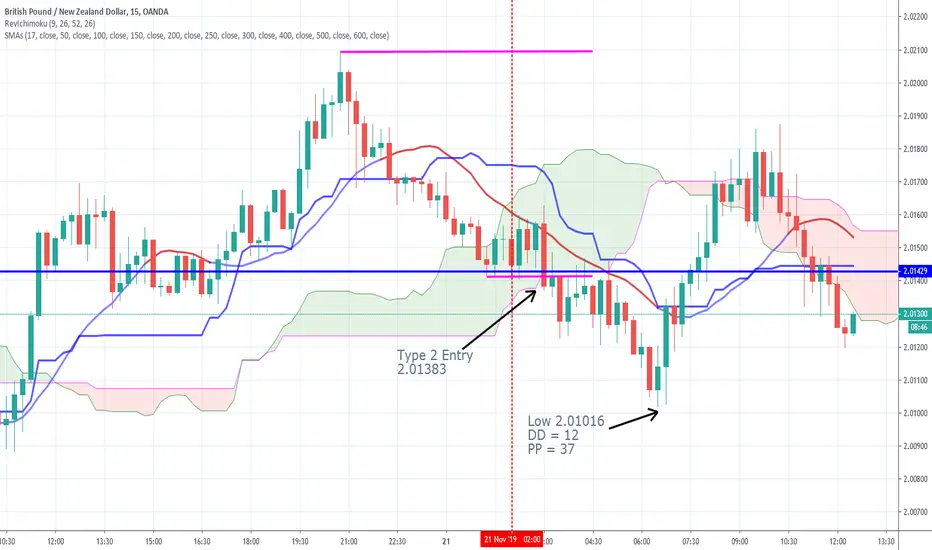
Tuesday: We took a news trade on GBPAUD, which did not work out -20.3 Pips but then Had a great textbook Type 2 trade in GBPNZD god for 82.2 pips.
Wednesday: We took a Type 1 PB trade in GBPNZD trade which worked out unfortunately we got out prematurely with a +10.7 pip gain.
Thursday: We took a GBPJPY Type 1 breakout banking 33.9 Pips and another Type 2 Trade in GBPNZD good for 24.8 PIps
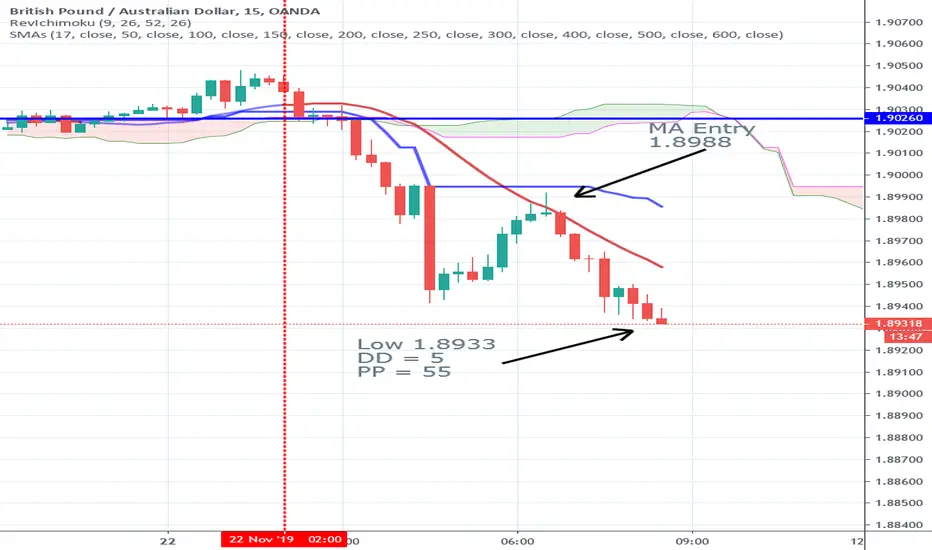
Friday: Starting with a mixed market, we patiently waited for the right opportunity. Which came in a MA trade on GBPAUD which we closed for +50 Pips, although it did reach our profit target of 60. Awesome trade that got positive quickly and stayed that way.
For the week, since I risk 2% per trade, I ended the week with a 21.08% gain. Another Great week!!!
Sincerely,
Allen Gold
* Remember Monday is the deadline to join the Gold Method Ichimoku.
** And for those who missed it…
After I am done with new trader training and starting on December 9th, I will be converting the training room into a trade room for The Gold Method Ichimoku.
This will give all members real time insight as to what I am “seeing” in the live market and allow me to further explain concepts.
All for the tremendous, outrageous price of Zero, nadda, nothing.
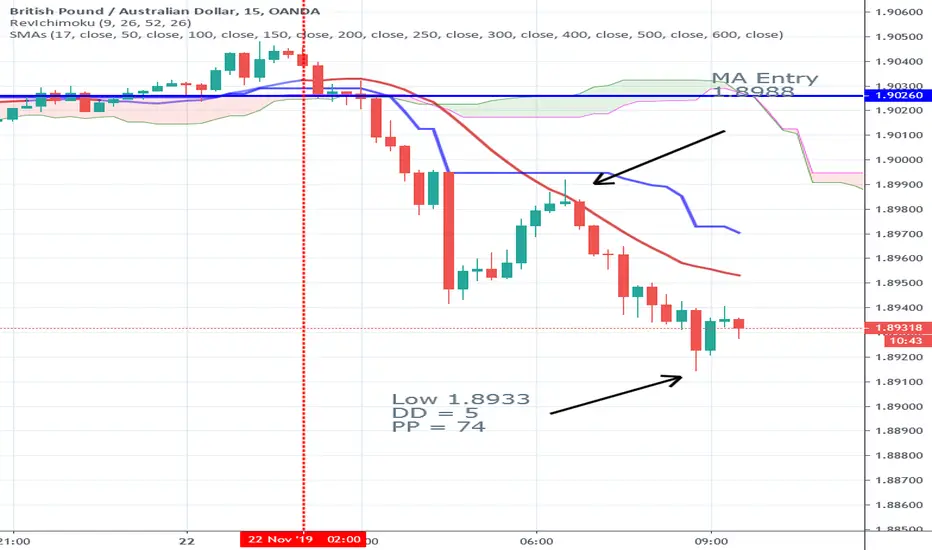

GBPAUD Documented MA trade + 50 PipsToday we had a nice push down in the GBP pairs which set-up an MA trade on this pair. Although this was not the last to reach the MA, price pulled back to the MA as opposed to the MA coming to price. Those who trade the Gold Method Ichimoku and have been in the training, know exactly what I am talking about. GA is also my favorite pair.
Everybody in the training room banked + 50 pips on the trade, Nice and easy.
Have a great weekend!!
Allen
For those traders who I gave extra time to decide if they want to join, remember Monday is the deadline.
GBPNZD Documented tradeThis is a Type 2 trade we took into today's training room. which we all closed for approximately 25 pips. Good solid trade, nothing fancy, just putting money in the account,
GBPJPY Documented trade +34 PipsThis was a Type 1 BO trade we took into today's training room. which we all closed for approximately 34 pips. Good solid trade, nothing fancy, just rocking the Gold Method Ichimoku!