S/R King + MPL 30M SELL USDJPYBacktesting on
Epic system of forex structure. Sniper Forex.
List trading setup:
1. MPL (Maximum Pain Level / QM (Quasimodo) - Reversal
2. SSR (Significant Support Resistance) - Continuous/Follow Trend
3. S/R King Double Moru (DBD, RBR , DBR, RBD )
4. Fakeout King (Big Trader Trade)
5. Hidden King (Sniper Entry)
Priority:
1. Stop loss must smaller than your take profit.
2. Must at least 2 reasons why you enter the trade.
3. Trade and Forget.
Psychology:
1. Not all setup is valid, its fact.
2. Lose small and win big, ratio 1:3/more, lose small multiple time and win big 1-time cover all the loses.
3. The only way to win in Forex is by managing you capital after profit and take a small risk but the reward is more.
4. Sometimes when the price hit your stop loss but you still follow your SYSTEM, its still a good trade. READ IT AGAIN!
Multiple Time Frame Analysis

GBPUSD TP HIT!Trailed my stoploss to this level, if you followed me, could have caught at least 100 pips. Thanks if anyone took it!
The trend is your best friendWe have a descending chanel. the downtrend is strong. we ride with our best friend, the Trend.
This is not a trading advice. It is for educational purposes.
Understanding the influence of Time Frames on Technical AnalysisHi there, if you want to understand Time frames. Watch this.

Change Your Chart's Timeframe in Lightning SpeedIn this video, we show you how to change your chart's timeframe with a few taps on your keyboard. While many of you are already familiar with this shortcut, we think it's worth highlighting here for those who haven't had a chance to try it.
To get started, type any number on your keyboard and then press Enter. Your chart will adjust its timeframe to the number you entered. For days, type D after the number you enter. For example, 1D will show you a daily chart or 5D will show a 5-day chart. For weeks type W and for months type M. If you type 1W, your chart will show a weekly chart and if you type 1M it will show a monthly chart. This is one of the fastest ways to go from any timeframe or time interval you're interested in from minutes to hours, weeks, and months.
For those who look at hundreds of charts or analyze price action, growth, and trends on multiple timeframes, this shortcut will save you time and effort.
We hope you enjoyed this video tutorial. Thanks for watching and please let us know in the comments if you want us to cover any other video shortcuts, ideas or concepts.

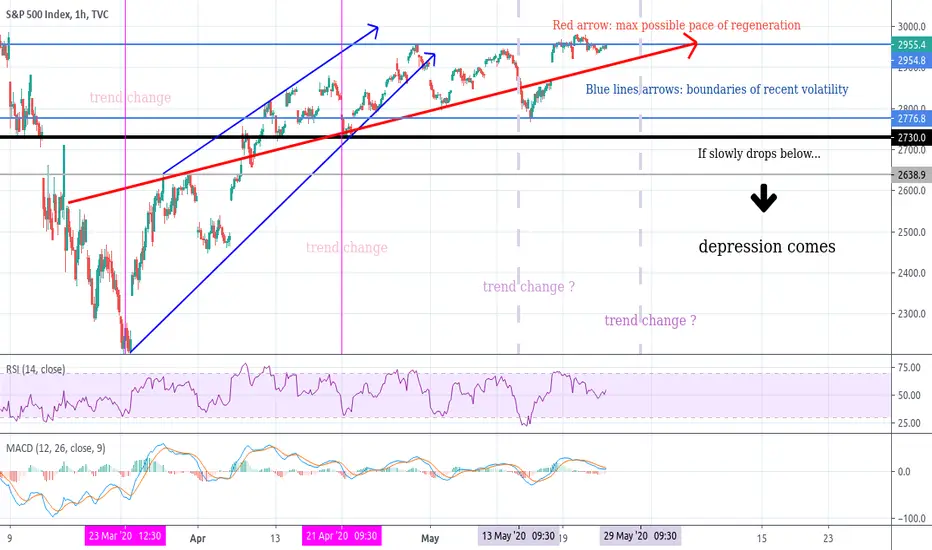
Transition to GREATNESS 3/3OK, here's the last part of the series. SPX is similar to DJI, DJT and IWM, they show the general situation and often sign what's gonna happen in the future of the market over all. If they collapse, everyone follows (even TSLA and BTC, as we experienced during this March, unfortunately). The lines and arrows are quite self explanatory, but read the notes on the chart and see if they make sense. The vertical lines: the first pink one is obviously the first trend change as after a collapse, a bounce should occur (either if it's a poor dead cat or just the start of a recovery of any kind). This steep up move can not last long though. The 2nd pink vertical line marks when the trend angle changed for a more realistic (I wish, though) regeneration pace (represented by the red arrow). If unlimited bailouts will continue to follow as promised ("don't fight the FED", remember?) we could even maintain this one, until -at least or maximum- the end of this year. Of course, several pullbacks/corrections will happen in the meantime, but the bottom line here is if we gonna be able to maintain the regeneration or the 3rd and/or 4th vertical dashed lines will represent an other (or two) trend change any time in the future, where as one could be a sideways consolidation move maybe even for the long run, the other (or say last one) -if we drop below the strong black line- marks a longer bear market and a depression would come as the trend that we see today is not backed up on the financial side (XLF). It's like we are loosing steam, and likely will roll over and fall soon. This is how it feels. This is what we want to avoid though (with the help of president Trump, and I'm not sarcastic now) so this is why I don't wanna fight the "Transition to Greatness" scenario. No point to fight it, 'cause it might very likely play out with newly printed money, fresh bail out checks and/or even the introduction of a $2000 UBI system during any time this year (maybe at a second collapse when the Q2 numbers come out, so that is by the end of July). This way we would regenerate at Q4. You never know, they have this option in their back pockets too. Note that the national debt is now 25 trillion USD, but it can be 50 trillion and 80 trillion too, nobody would die in blood and pain on the streets because of it, it's just economy at modern times (our children/grandchildren could pay for it?), with lots and lots of people getting poorer and some less poor will survive with some luck and some rich loosing some/gaining some, whatever and so on. I hope for the best, but will watch out for anything. Trade safe.
Transition to GREATNESS 2/3DJI just like DJT is a good index and canary, showing the situation in general. Lots of small companies will disappear, shops will close, firms go bankrupt, people will go without luxury, but life goes on and only some will grow. Question is, what direction will we go and/or if we gonna be part of it or out of it financially, in the first place! Either way, I got to accept the situation and as always: act accordingly. I'm not into politics, idk if you are a democrat, a conservative or a liberal. More important to stay healthy (and alive) and do something that is one step ahead to a sustainable future. Common sense. So if I had the chance, I would advice to Mr. President to make peace, not war (with China and in general). I would support China, as they will support the US back too 'cause they are just like that. They also are smart and innovative. It's not like the old times anymore, when we said "poor quality because it's Chinese" remember? That's the old times, put it in a history book or something and step forward now. Together. As according to my belief and experience, cooperation feels and works better that hatred, fights and war. Or it's just me?

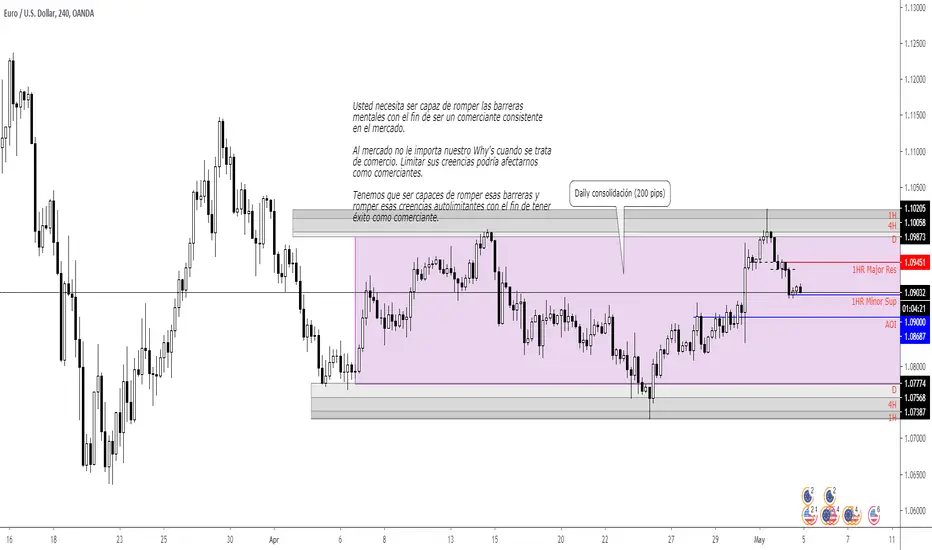
EURUSDEl mercado no pretende hacernos enteros.
Confianza: hacer lo que sabemos debe hacerse una y otra vez.
Confíe en nuestro análisis sin dudarlo.
No sabemos lo que el mercado va a hacer para ganar dinero.
Simplemente reaccionamos a lo que el mercado está haciendo para ganar dinero.
Simplemente necesitamos controlar nuestras acciones objetivamente al operar.
Crucial Zones Testing In BankniftyLook at the bigger picture.
On the chart itself Banknifty is stuck between a significant support and resistance zone. For all those who are waiting for going long on banknifty, a close above this level might decide the future. Also, if you look at RSI it is in the key support zone . If RSI trends upward after taking support at this level long positions can be initiated. On lower time frame if the ascending triangle breaks successfully then upward momentum will be confirmed. ( There might be chances of triangle breakout failure for short term as seen in USDINR)
This setup might take a few weeks to occur or could never happen if the above zones break easily due to any reason. Wait for confirmations then initiate a long position in this scary bearish market only if you believe in your setup.
This explanation is only for educational purpose and isn't any kind of recommendation. Don't take any action based on this explanation itself. Consider your financial advisor before taking any trades.
Thanks for your time. Happy Trading

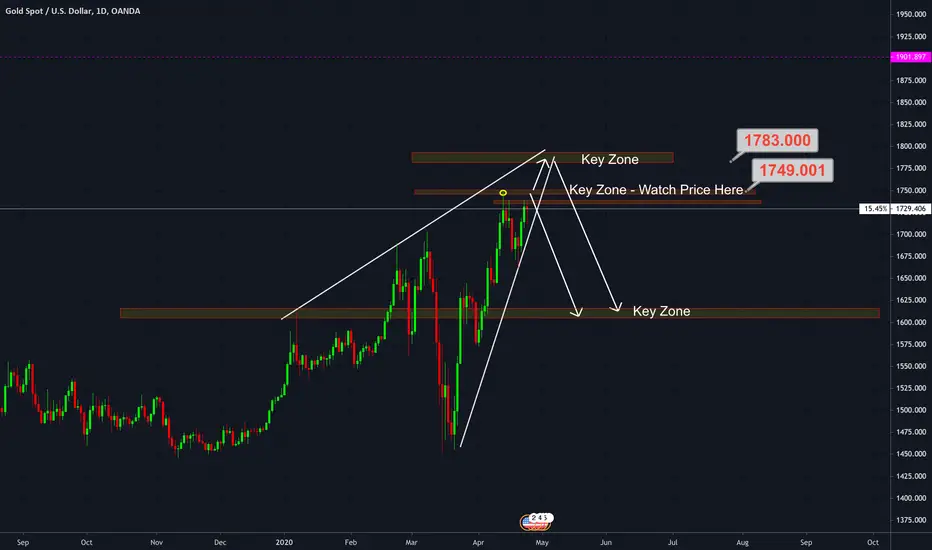
Gold Sell After the BuyWatch price action at 1749 for rejection or continued buy to the next level noted; I do believe a bigger drop is to come.
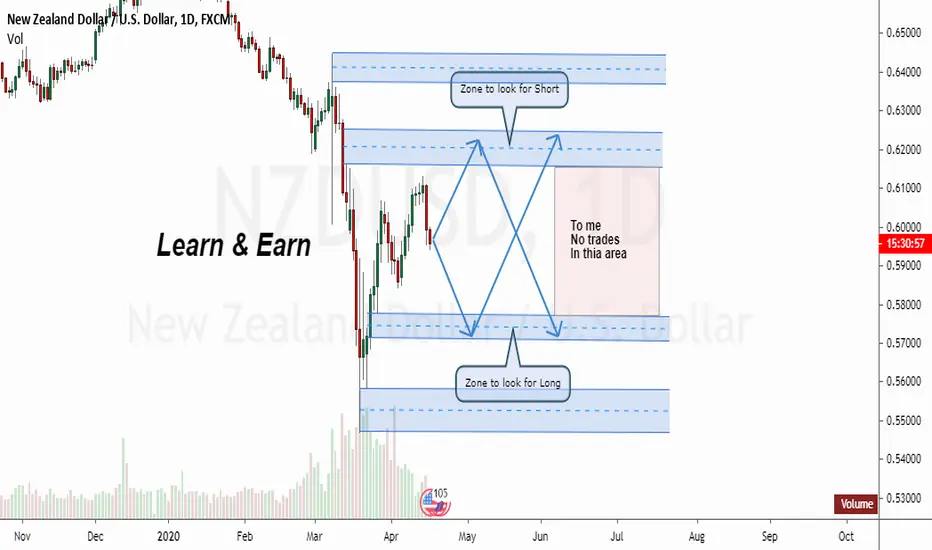
Learn & Earn!What I see!
Looking for Impulse Up & Down! Down & Up!
This is just an idea to see how to read the market. Make sure you have your own rules on RR and follow them. This is just a trading idea to help you/ give better knowledge. If you have any question ask me in comments.
Learn & Earn!
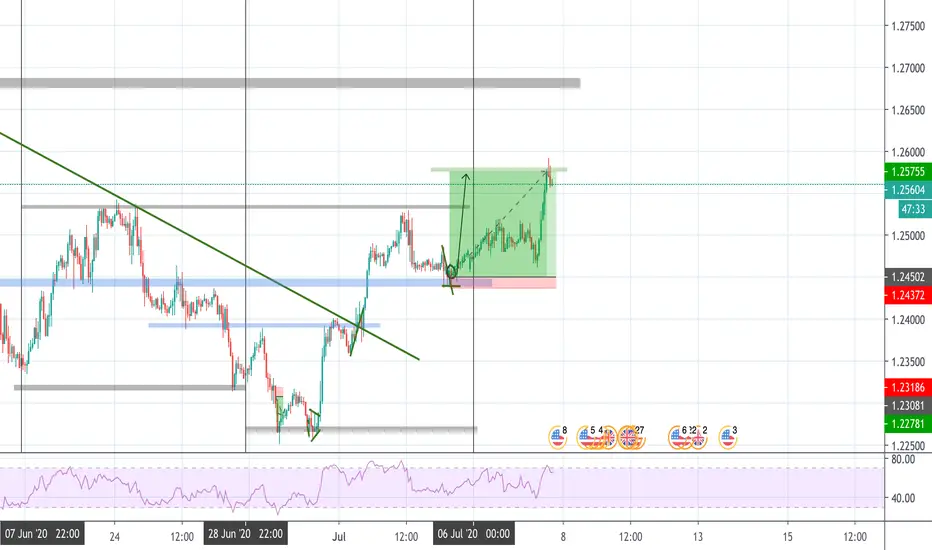
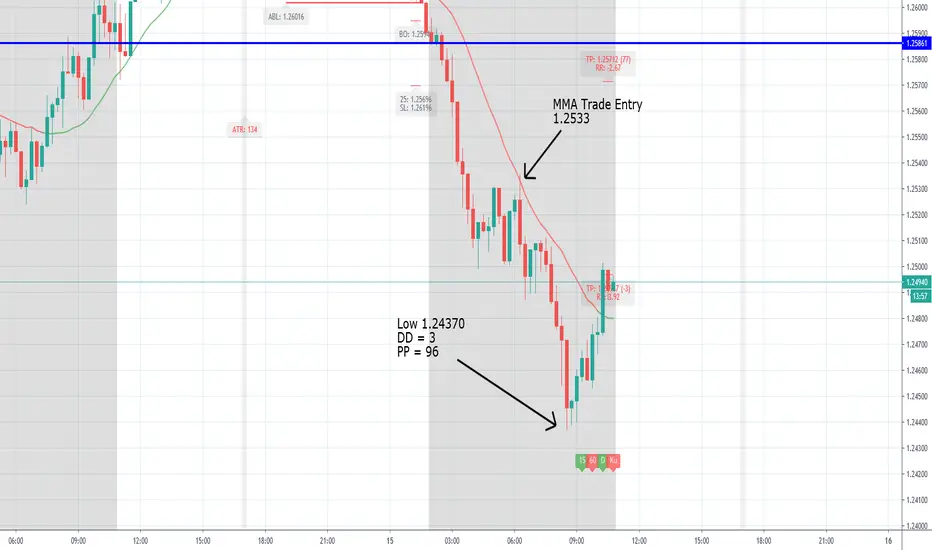
GBPUSD Documented MMA Trade +96 PIp PotentialHere is picture perfect MMA Trade which had a minimal draw down and easily hit it's 90 Pip Profit Target.
Unfortunately, Because these trades involve a moving average and other pair considerations, It is hard to post these before the entry
Allen
How To Day Trade Consolidations Profitably With #FibonacciTraders, Several fellow day traders have been asking to show how they can day trade using fibonacci based analysis which I use for swing trading. The fibonacci based analysis is applicable to all chart time frames and on all instruments in all markets. It even works on tick charts. In this educational video I present how we could have made 130 pips easily with day trading GBPUSD using fibonacci based analysis. Support and motivate me by hitting the like button, subscribing to my channel and sharing this analysis with other traders. Comment below and let me know what you think of this analysis and what is yours? I welcome all comments, feedback, ideas and sharing of knowledge.
Have a great trading week!

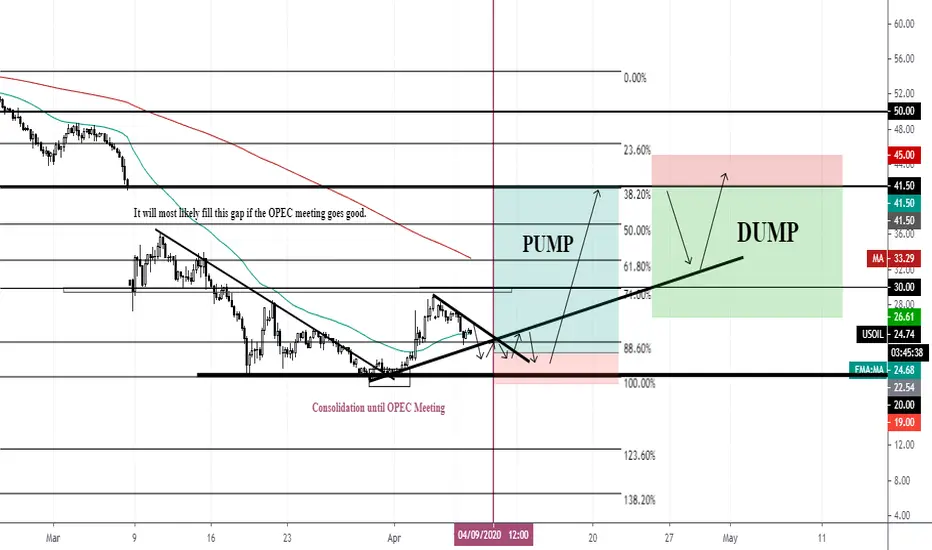
.WTICrude Demand?This my understanding of the current oil situation. If everything goes good on Thursday USOil can have an extremely bullish daily move. Fundamentally we might not have the right demand conditions to sustain a sentimental boost. If it does boost and if it does not break below 20 it can most likely remain bullish. Recommended to trail SL in profit. SL in profit may also be a good Sell Stop entry if fundamental conditions continue to remain bearish for OIL
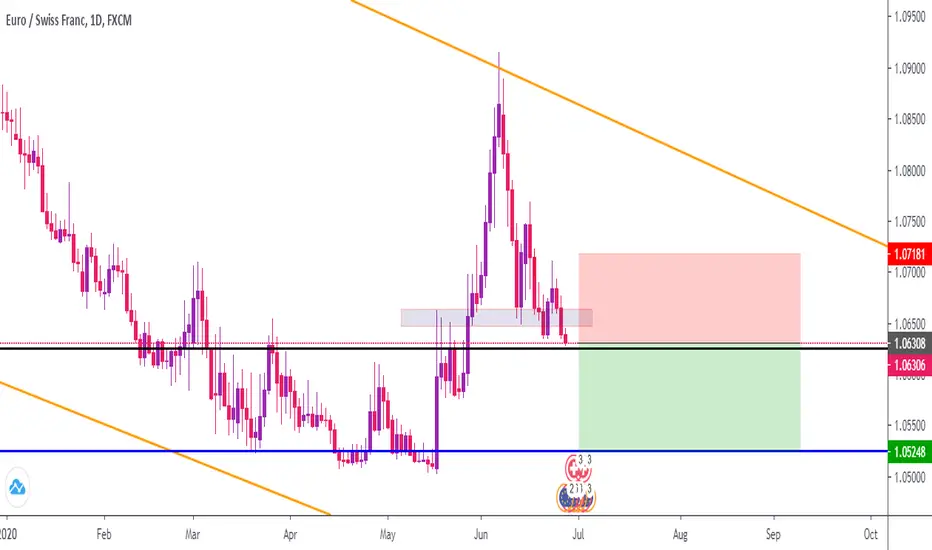
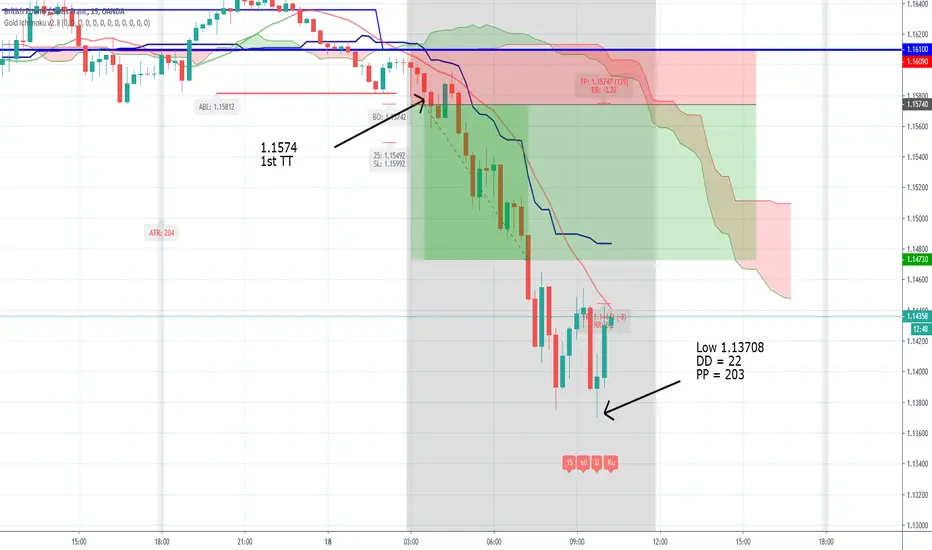
GBPCHF Documented Type 1 trade reached PT +101 PipsHere is today's GBPCHF trade which took a little to get going but then easily reached it's PT (+101 pips).
good Solid trade, all 4 horseman aligned :)
Allen
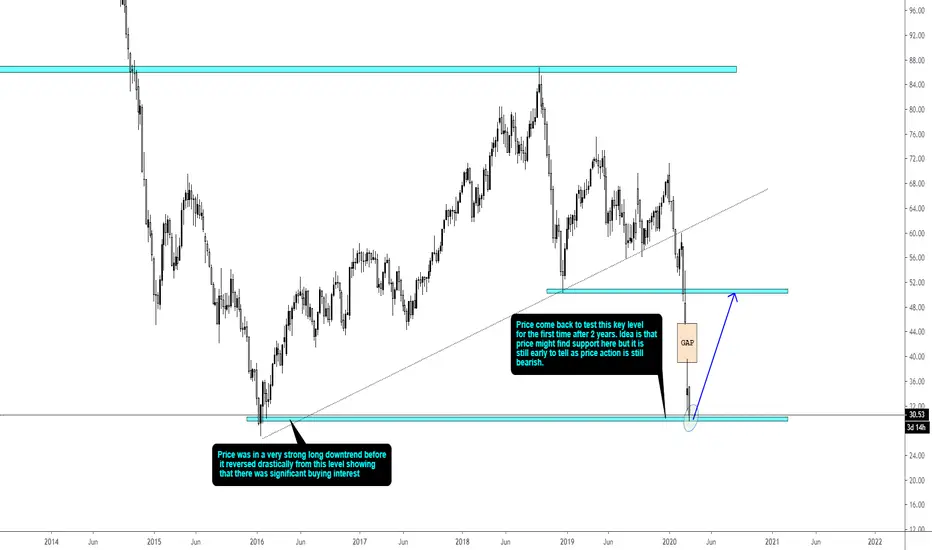
UKOIL PRE-SETUP Hello Traders
Price might find support here, if this [ b]dynamic support hold then i will be looking for long opportunity through Top-Down Analysis.
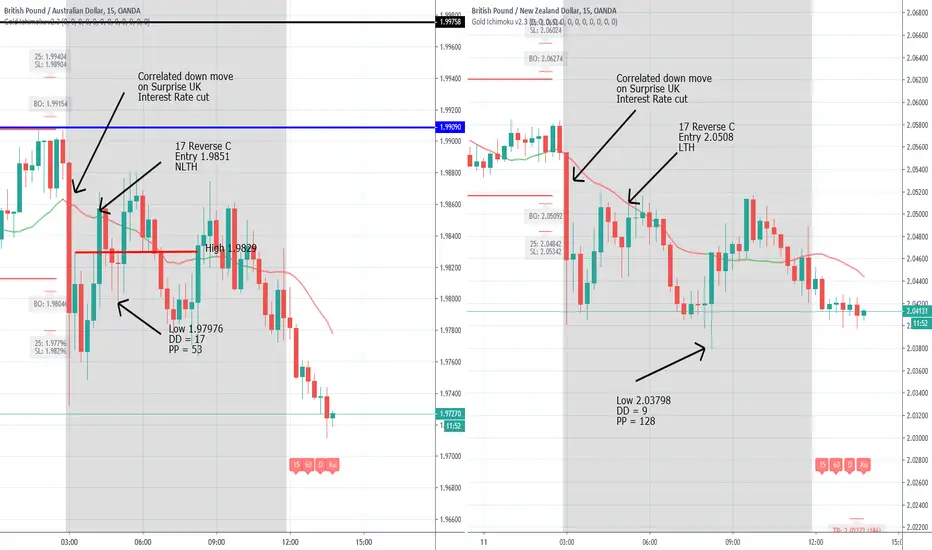
GBPAUD and GBPNZD Documneted 17 Reverse TradesToday we had a correlated down move in the GBP pairs as The Bank of England cut their interest rate.
This set up our 17 Reverse trades:
GBPAUD was the next to last to trigger and had a 17 pip draw down and was good for + 53 pips while
GBPNZD was the last to trigger (our preferred choice) and had a draw down of only 9 pips and was great for +128 Pips
Allen
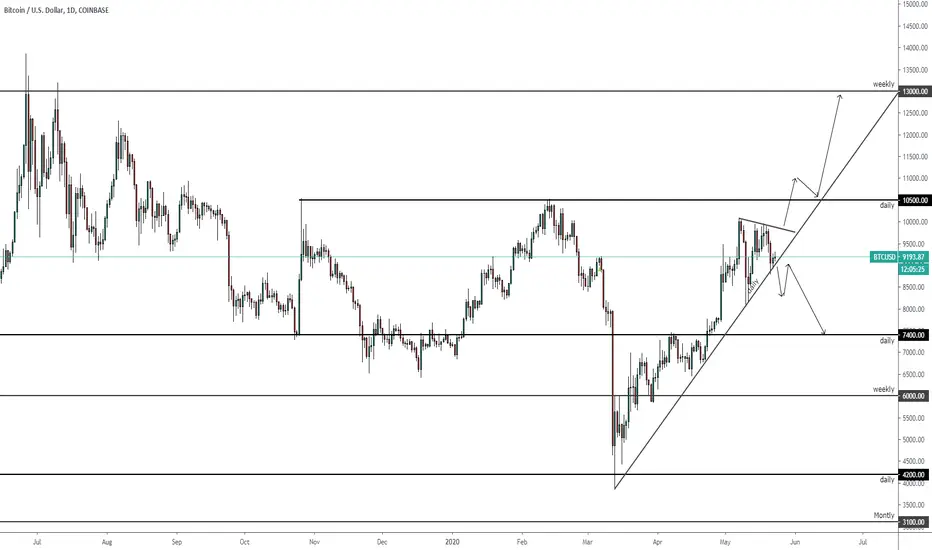
Why I stay away during systemic volatilityBig bars are the bane of my existence. I don't trade them with ANY of the set-ups I currently use. Do you? let me know your strategy below.

Introduction to the BEST All-In-One Oscillators with divergencesHello traders,
A unique indicator displaying many oscillators with a multi-timeframes and regular/hidden divergences options for all oscillators below
1. MACD
2. MACD ZERO LAG
3. RSI
4. DMI/ADX
5. ATR
6. STOCHASTIC RSI
7. TRUE STRENGTH INDEX
8. CANDLE MOMENTUM OSCILLATOR
9. VORTEX INDICATOR
10. COMMODITY CHANNEL INDEX
11. RATE OF CHANGE
☔ Safe crossing mode for RSI/STOCH RSI/CMO: Choose to get alerted whenever the oscillator enters or exits the Overbought/Oversold zone.
Wishing you all the BEST for your trading using it.
Dave

How to Do A Multi Time Frame Analysis in a reactive way!Hi Traders, here is the full Educational Video - How to do a Multi Time Frame Analysis in a Reactive way! .
Conditions -
1.Make Sure Structure Broken and closed below.
2.Wait For Confirmation (Price Action)
3.Use Risk Management + Follow A Trading Plan!
4.Always Be reactive & Not Predictive !
A like and a comment will create more Free Analysis & Forex Education.
Your Support is Appreciated!
See You in the next Educational Video / Analysis
Global Fx Education

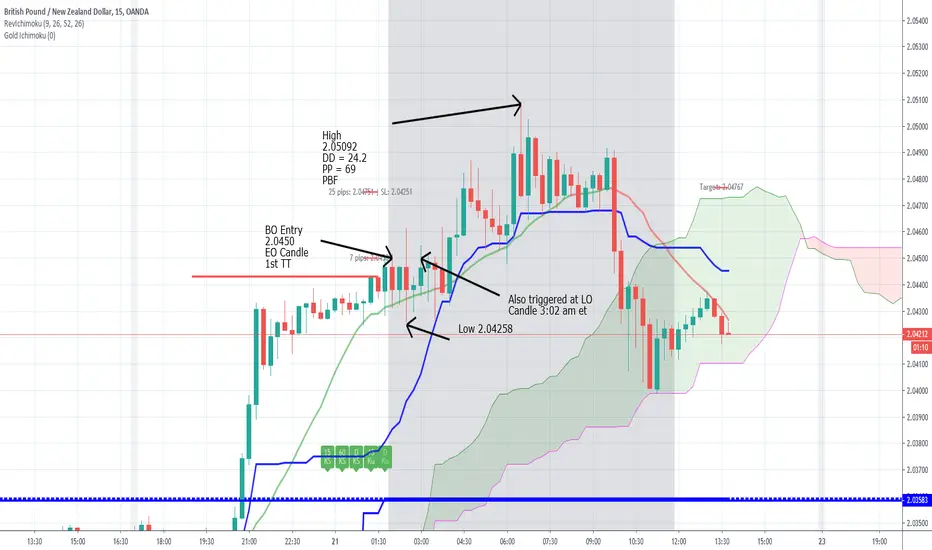
GBPNZD Documented Type 1 Trade + 69 Pip PotentialThe above is the documented Type 1 Trade on GBPNZD pursuant to the Gold Method Ichimoku:
We had all 4 Horseman aligned and it was a good solid trade to end the week.
Allen
Since I was sick last week and have not caught up with documenting those trades, I have not filled in the spreadsheet as it is POA to enter data out of order, and done a weekly review.
I anticipate being caught up by next week and will make the post accordingly.