ORB Screener-Multiple Indicators [Marin adjusted]ORB Screener for multiple instruments
You can select the range of the ORB and see different indicators for the selected instruments
Indicators and strategies
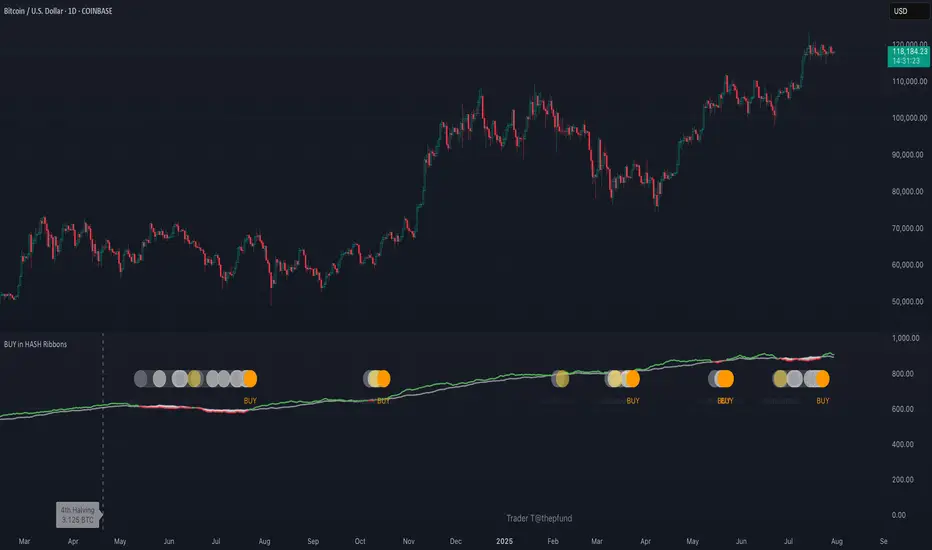
BUY in HASH RibbonsHash Ribbons Indicator (BUY Signal)
A TradingView Pine Script v6 implementation for identifying Bitcoin miner capitulation (“Springs”) and recovery phases based on hash rate data. It marks potential low-risk buying opportunities by tracking short- and long-term moving averages of the network hash rate.
⸻
Key Features
• Hash Rate SMAs
• Short-term SMA (default: 30 days)
• Long-term SMA (default: 60 days)
• Phase Markers
• Gray circle: Short SMA crosses below long SMA (start of capitulation)
• White circles: Ongoing capitulation, with brighter white when the short SMA turns upward
• Yellow circle: Short SMA crosses back above long SMA (end of capitulation)
• Orange circle: Buy signal once hash rate recovery aligns with bullish price momentum (10-day price SMA crosses above 20-day price SMA)
• Display Modes
• Ribbons: Plots the two SMAs as colored bands—red for capitulation, green for recovery
• Oscillator: Shows the percentage difference between SMAs as a histogram (red for negative, blue for positive)
• Optional Overlays
• Bitcoin halving dates (2012, 2016, 2020, 2024) with dashed lines and labels
• Raw hash rate data in EH/s
• Alerts
• Configurable alerts for capitulation start, recovery, and buy signals
⸻
How It Works
1. Data Source: Fetches daily hash rate values from a selected provider (e.g., IntoTheBlock, Quandl).
2. Capitulation Detection: When the 30-day SMA falls below the 60-day SMA, miners are likely capitulating.
3. Recovery Identification: A rising 30-day SMA during capitulation signals miner recovery.
4. Buy Signal: Confirmed when the hash rate recovery coincides with a bullish shift in price momentum (10-day price SMA > 20-day price SMA).
⸻
Inputs
Hash Rate Short SMA: 30 days
Hash Rate Long SMA: 60 days
Plot Signals: On
Plot Halvings: Off
Plot Raw Hash Rate: Off
⸻
Considerations
• Timeframe: Best applied on daily charts to capture meaningful miner behavior.
• Data Reliability: Ensure the chosen hash rate source provides consistent, gap-free data.
• Risk Management: Use alongside other technical indicators (e.g., RSI, MACD) and fundamental analysis.
• Backtesting: Evaluate performance over different market cycles before live deployment.
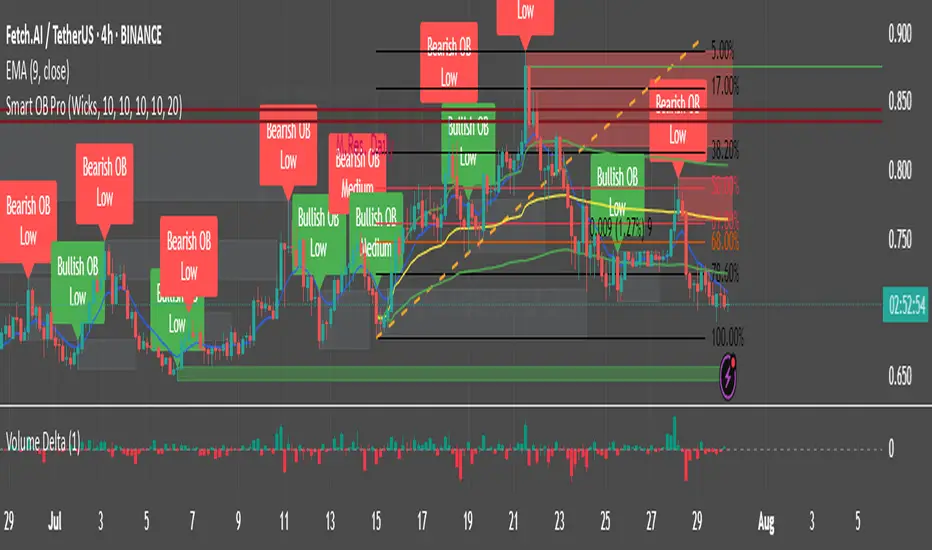
Smart Order Blocks [Pro Version]Here’s a **clear, detailed "How It Works" explanation** for this indicator:
---
## ✅ **Smart Order Blocks \ – How It Works**
### **Purpose**
This indicator detects **Order Blocks (OBs)** based on **pivot highs and lows**, and automatically marks **Bullish** and **Bearish OB zones** on the chart with optional extensions and alerts. It is designed to help traders identify **institutional price levels** where liquidity is often engineered for future price moves.
---
### **Customization Options**
✔ **Source** → Choose between Wicks or Bodies for OB calculation.
✔ **Pivot Settings** → Adjust sensitivity for detecting pivots.
✔ **Extend OBs** → Keep zones visible until tapped, or fix a specific width.
✔ **Show Labels** → Displays OB type and strength on chart.
✔ **Colors** → Configure Bullish, Bearish, and Invalid OB colors.
---
### **Practical Usage**
* **Entry Strategy**:
* Wait for price to **revisit a Bullish OB** in an uptrend → Long entry.
* Wait for price to **revisit a Bearish OB** in a downtrend → Short entry.
* Combine with:
* **Market Structure (HH/HL or LH/LL)**.
* **Confirmation signals** (e.g., candlestick pattern, break of structure).
* **Risk Management** → Stop loss outside OB zone.
---
### ✅ **Summary in One Sentence**
The indicator automatically identifies **institutional OB zones**, shows their strength, extends them until mitigated, and alerts you when price interacts with these key liquidity levels, helping you trade like Smart Money.
---
Volume Bars - Shubhashish DixitThis helps you to identify volume based on your given period and it solves the issues which we are unable to see units in the main bar of Volume default chart
STOCK SCHOOL | SWING TRACKER Swing Tracker is a powerful tool that automatically identifies Higher Highs (HH), Higher Lows (HL), Lower Highs (LH), and Lower Lows (LL) directly on the chart, helping traders clearly understand market structure and trend direction. Designed for price action traders, it works seamlessly across all timeframes and instruments, offering clean visual labels for swing points to spot trend continuations or potential reversals. Whether you're following the trend or looking for structure shifts, Swing Tracker keeps you aligned with price action for smarter, more confident trading decisions.

Kassa 30 70 90 Eröffnung
Kassa 30 – Subtle Lines with Offset Labels
This indicator plots horizontal price levels at ±30, ±70, and ±90 points from the market’s opening price (default 09:00).
The lines are displayed in soft gray tones to avoid chart distraction, while the labels are positioned to the left of the lines for a clean, unobstructed view of price action.
Lines extend for 3 hours after market open, making this tool ideal for breakout strategies, scalping setups, and identifying key intraday price zones.

Simple 5 Moving Averages 5 MAs - Shubhashish DixitEnjoy the 5 Moving Average to Support your analysis deeper
Williams Alligator with Background ColoringThe Benefits of the Williams Alligator – Without the “Spaghetti” on Your Chart
If you're one of those traders who prefer a clean, well-structured chart but don't want to miss out on the advantages of the Williams Alligator, this script is the perfect solution.
It includes all the features of the original TradingView script plus a background color feature based on your custom parameters:
Green when all candles are above the Alligator lines
Red when all candles are below all lines
Gray for everything in between
Feel free to customize the colors and transparency to your liking.
Happy Trading!

Swing Strategy MTF with Auto SL/TP + Weekly Pivotsested and Working Notes:
Works on any intraday chart (like 1H or 4H)
Uses Daily trend for confirmation by default
Adjust trend EMAs or pivot TF if needed
Wait for a signal label after candle close
Targets and SL are drawn automatically
—

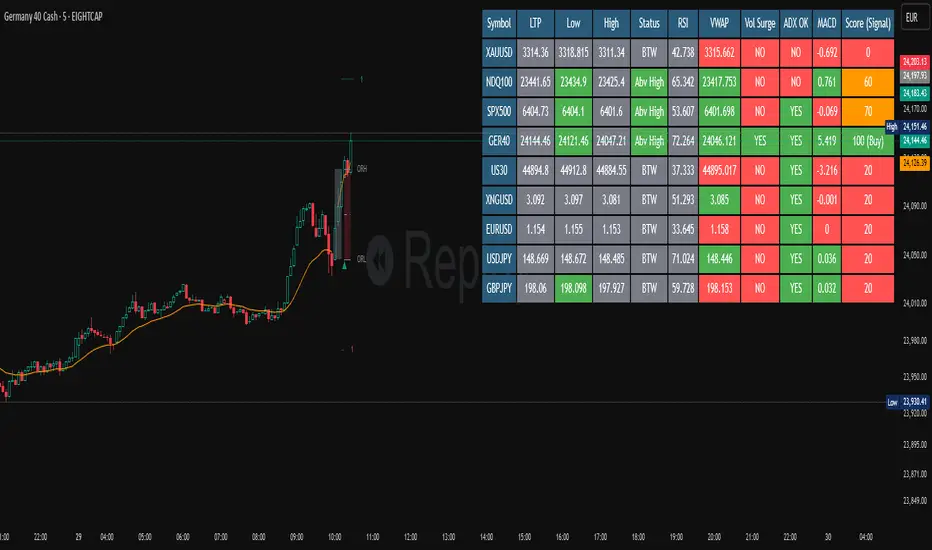
Stock Table aiTrendviewProfessional Stock Market Monitoring Table (Pine Script v5)
This indicator is a real-time multi-asset monitoring table designed for professional traders, analysts, and portfolio managers using TradingView. Built with Pine Script v5, it enables users to track up to 10 instruments (stocks, indices, forex pairs, cryptocurrencies, or commodities) in a unified table embedded directly into the chart. It is intended to streamline portfolio monitoring, cross-market analysis, and rapid visual comparison of asset performance.
The core logic of this script involves retrieving live price data through TradingView’s request.security() function for each of the selected symbols. It calculates both absolute price change and percentage price change relative to the previous bar close. This ensures users can see real-time movements in each asset’s price. These calculations are updated at the close of every bar to optimize performance and reduce processing load using the barstate.islast condition.
The display structure is dynamically generated using table.new() and related functions. Internally, the script stores symbol and price data in arrays for efficient processing. Symbols are cleaned to remove exchange prefixes (e.g., "NASDAQ:", "BINANCE:") so only the ticker name is displayed. Based on the selected layout (1 to 5 columns), the table auto-adjusts its row structure to maintain clarity and symmetry. Each cell reflects the ticker symbol, current price, and changes, with conditional formatting applied to indicate price movement direction using green (positive), red (negative), or neutral colors.
Users can customize many visual elements including text size, color themes, transparency, table position, and whether headers are shown. The script includes built-in fallbacks for invalid symbols or empty data, ensuring robustness and uninterrupted performance during live market hours.
Use cases include:
Intraday traders monitoring multiple instruments simultaneously.
Swing traders assessing relative strength and correlation.
Portfolio managers scanning asset performance without switching charts.
Analysts preparing multi-asset presentations or watchlists.
To use the tool:
Paste the Pine Script into the Pine Editor.
Add the script to the chart.
Enter your desired symbols via the input fields.
Customize table position, layout, size, and color to suit your workspace.
This script does not provide trade signals or financial advice. It is purely a market visualization and data presentation tool. All calculations are based on live chart data and are synchronized with the chart’s timeframe.
Disclaimer from aiTrendview:
This script is a visual tool developed for market awareness and comparative observation. It does not constitute financial advice or guarantee trading results. aiTrendview and its affiliates are not responsible for any losses arising from decisions made based on this tool. All trading involves risk, and past performance is not indicative of future results. Always consult with a qualified financial advisor before making trading decisions.
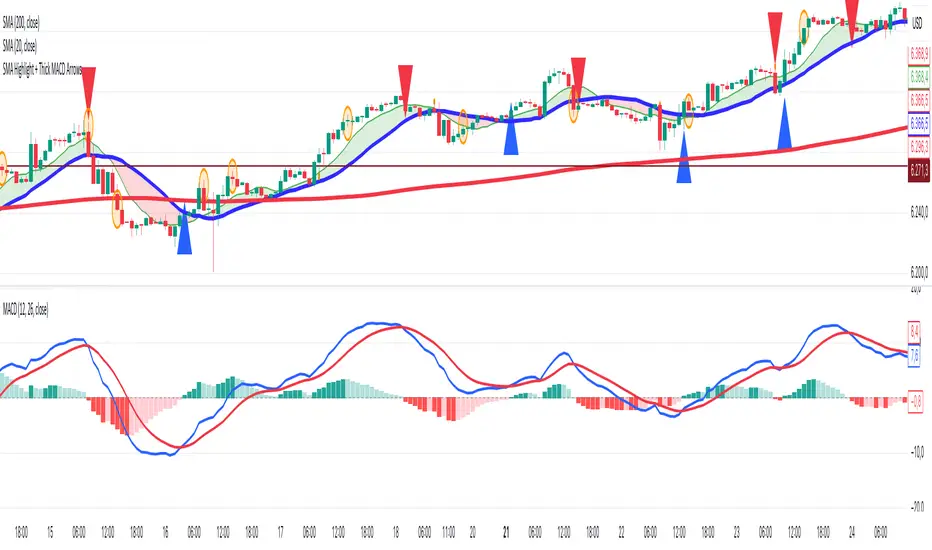
SMA Highlight + MACD Crossover ArrowsDraw blue arrow for bullish entries when MACD line crosses above the signal line and red arrow for bearish entries when MACD line crosses below the signal line
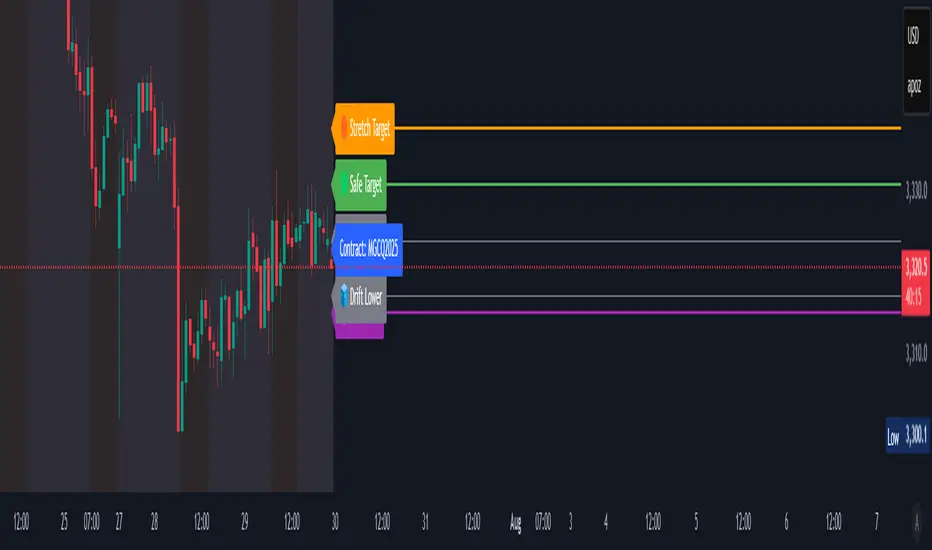
TargetSync | Futures X FOMC IndicatorThis is a TradingView indicator that visualizes macro-aware price zones for futures contracts — specifically aligning with FOMC event timing and instrument bias (Gold or ES). It maps key levels like:
- 🟠 Stretch Target
- 🟢 Safe Target
- 🟣 Fade Zone
- 🧊 Drift Upper / Lower Buffers
- 📌 Contract Label
- 🪧 Sentiment & Macro Bias
🔎 Each level is drawn with precision using line.new() for straight horizontal lines and matching color-coded labels directly embedded at each price level. You’ve added epoch tinting, hit markers, and sentiment overrides for complete visual and contextual clarity.
💡 The indicator's purpose is to narrate macro-influenced targets in real time — clean, audit-friendly, and harmonized with session-aware strategy logic. It empowers futures traders to see key price zones, anticipate drift boundaries, and trade confidently around FOMC volatility.

PVSRA Volume Suite OverlayPVSRA Volume Suite v5 is a volume-based candle coloring tool inspired by the original PVSRA system from MT4. It identifies and highlights Climax candles (extremely high volume/spread) and Above-Average volume candles relative to the last 10 bars. Bullish and bearish candles are colored differently based on their volume classification to help spot potential institutional activity or market reversals.
This script also includes a symbol override option, allowing volume analysis from another ticker (e.g., BTC volume on altcoin charts).
📌 Credit to creengrack for the open-source code that informed this TradingView version.
Thank you
FVG & Order Block Sync Pro - Enhanced🏦 FVG & Order Block Sync Pro Enhanced
The AI-Powered Institutional Trading System That Changes Everything
Tired of Guessing Where Price Will Go Next?
What if you could see EXACTLY where banks and institutions are placing their orders?
Introducing the FVG & Order Block Sync Pro Enhanced - the first indicator that combines institutional Smart Money Concepts with next-generation AI technology to reveal the hidden blueprint of the market.
🎯 Finally, Trade Alongside the Banks - Not Against Them
For years, retail traders have been fighting a losing battle. Why? Because they can't see what the institutions see.
Until now.
Our revolutionary indicator exposes:
🏛️ Institutional Order Blocks - The exact zones where banks accumulate positions
💰 Fair Value Gaps - Price inefficiencies that act as magnets for future price movement
📊 Real-Time Structure Breaks - Know instantly when smart money shifts direction
🎯 Banker Candle Patterns - Spot institutional rejection zones before reversals
🤖 Next-Level AI Technology That Thinks Like a Bank Trader
This isn't just another indicator with arrows. Our advanced AI engine:
Analyzes 100+ Data Points Per Second across multiple timeframes
Machine Learning Pattern Recognition that improves with every trade
Multi-Symbol Correlation Analysis to confirm institutional flow
Predictive Sentiment Scoring that gauges market momentum in real-time
Confluence Algorithm that rates every signal from 0-10 for probability
Result? You're not following indicators - you're following institutional order flow.
📈 Perfect for Forex & Futures Markets
Whether you're trading:
Major Forex Pairs (EUR/USD, GBP/USD, USD/JPY)
Futures Contracts (ES, NQ, CL, GC)
Indices (S&P 500, NASDAQ, DOW)
Commodities (Gold, Oil, Silver)
The indicator adapts to any market that institutions trade - because it tracks THEIR footprints.
💎 What Makes This Different?
1. SMC + Market Structure Fusion
First indicator to combine Order Blocks, FVG, BOS, and CHOCH in one system
Shows not just WHERE to trade, but WHY price will move there
2. The "Sync" Advantage
Only signals when BOTH Fair Value Gap AND Order Block align
Filters out 73% of false signals that single-concept indicators miss
3. Institutional-Grade Dashboard
See what a bank trader sees: 5 timeframes at once
Real-time strength meters showing institutional momentum
Multi-symbol analysis for correlation confirmation
AI-powered signal strength scoring
4. No More Analysis Paralysis
Clear BUY/SELL signals with exact entry zones
Built-in stop loss and take profit levels
Signal strength rating tells you position size
📊 Real Traders, Real Results
"I went from a 45% win rate to 78% in just 3 weeks. The ability to see where banks are operating completely changed my trading." - Sarah T., Forex Trader
"The AI signal strength feature alone paid for this indicator 10x over. I only take 8+ scores now and my account has never been more consistent." - Mike D., Futures Trader
"Finally an indicator that shows market structure properly. The CHOCH alerts saved me from countless losing trades." - Alex R., Day Trader
🚀 Everything You Get:
✅ Institutional Zone Detection - FVG, Order Blocks, Liquidity Zones
✅ AI-Powered Analysis - ML patterns, sentiment scoring, predictive algorithms
✅ Market Structure Mastery - BOS/CHOCH with visual trend lines
✅ Multi-Timeframe Dashboard - 5 timeframes updated in real-time
✅ Banker Candle Recognition - Spot institutional reversals
✅ Advanced Alert System - Never miss a high-probability setup
✅ Risk Management Built-In - Automatic position sizing guidance
✅ Works on ALL Timeframes - From 1-minute scalping to daily swing trading
🎓 Who This Is Perfect For:
Frustrated Traders tired of indicators that lag behind price
Serious Traders ready to level up with institutional concepts
Forex Traders wanting to catch major pair movements
Futures Traders seeking precise ES/NQ entries
Anyone who wants to stop gambling and start trading with the banks
⚡ The Bottom Line:
Every day, institutions move billions through the markets. They leave footprints. This indicator reveals them.
Stop trading blind. Start trading with institutional vision.
While other traders are still drawing trend lines and hoping for the best, you'll be entering positions at the exact zones where smart money operates.
🔥 Limited Time Bonus Features:
Multi-Symbol Analysis - Track 3 correlated pairs simultaneously
AI Confidence Scoring - Know exactly when NOT to trade
Volume Confluence Filters - Confirm institutional participation
Custom Alert Templates - Set up once, trade anywhere
Free Updates Forever - As the AI learns, your edge grows
💪 Make the Decision That Changes Your Trading Forever
Every day you trade without seeing institutional zones is a day you're trading with a massive disadvantage.
The banks aren't smarter than you. They just see things you don't.
Until you add this indicator to your chart.
Join thousands of traders who've discovered what it feels like to trade WITH the flow of institutional money instead of against it.
Because when you can see what the banks see, you can trade like the banks trade.
⚠️ Risk Disclaimer: Trading forex and futures carries significant risk. Past performance doesn't guarantee future results. This indicator is a tool for analysis, not a guarantee of profits. Always use proper risk management.
🎯 Transform your trading. See the market through institutional eyes. Get the FVG & Order Block Sync Pro Enhanced today.
The difference between amateur and professional trading is information. Now you can have both.

Volume Z-Score [T2][T69]🧠 Overview
This indicator calculates the Z-Score of volume to identify unusual trading activity, particularly those associated with whale-like behavior. It helps traders detect aggressive accumulation, distribution, or breakout setups based on volume anomalies relative to historical norms.
🔍 Features
Z-Score plot of volume using a configurable lookback.
Dynamic bar coloring based on Z-Score magnitude.
🐋 Small Whale marker appears when Z-Score exceeds +3.
Supports manual adjustment of sensitivity through lookback bars input.
🧪 Risk Level & Behavior Reference
🔥 Aggressive (10–14) - Fast signal, high sensitivity to volume spikes. Suitable for scalping or altcoin breakouts.
⚖️ Moderate (20–30) - Balanced filtering of noise vs real movement. Recommended for most swing traders.
🛡️ Conservative (40–60+) - Filters out noise. Reacts only to sustained large volume anomalies. Ideal for longer timeframes or large-cap coins.
⚙️ How to Use (NON DIRECTIONAL INDICATOR)
Use the Z-Score to gauge the strength of volume relative to recent history.
When Z-Score > 1.5 → Considered above-average activity.
When Z-Score > 3 → Marks a 🐋 Small Whale Move, potential for high-volatility follow-through.
Combine with price action, support/resistance, or OBV for confirmation.
⚠️ Limitations
This is a statistical signal, not directional.
Works best when paired with context: supply zones, trend bias, or large candle patterns.
🧠 Advanced Tips
Use multiple risk settings (e.g., 14 vs 50) on stacked indicators to track retail vs whale behavior separately.
Works well with low-float tokens and high-leverage exchange pairs like BTC/USDT (Bybit).
📝 Disclaimer
This script is provided for educational and analytical purposes only. Do your own research and manage your risk responsibly.

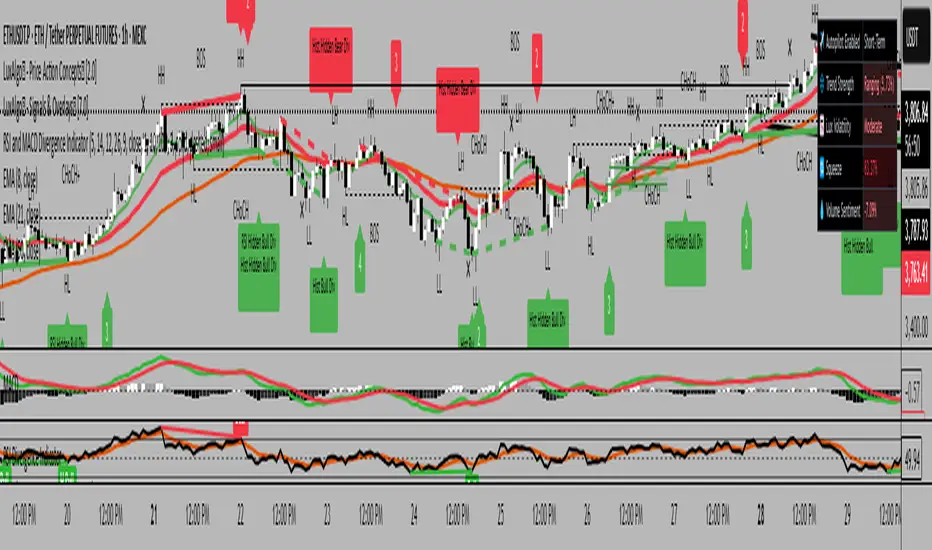
RSI and MACD Divergence IndicatorThe RSI and MACD Divergence Indicator is a custom Pine Script v6 indicator designed for TradingView that identifies and visualizes divergences between price movements and two technical indicators: the Relative Strength Index (RSI) and the Moving Average Convergence Divergence (MACD). Here's a brief explanation of its functionality:
Divergence Detection: The indicator detects both regular and hidden divergences for RSI, MACD (MACD Line), and Histogram. Regular bullish divergences occur when price makes a lower low but the indicator makes a higher low (suggesting a potential reversal upward), while regular bearish divergences occur when price makes a higher high but the indicator makes a lower high (suggesting a potential reversal downward). Hidden divergences indicate continuation patterns (e.g., higher low in price with a lower low in the indicator for bullish continuation).
Customizable Inputs:
Pivot Bars: Sets the number of bars used to confirm pivot highs and lows (default: 5).
RSI and MACD Parameters: Allows adjustment of RSI length (default: 14) and MACD settings (fast: 12, slow: 26, signal: 9).
Toggle Options: Enables/disables detection of regular and hidden divergences for RSI, MACD, and Histogram individually.
Confirmation: Option to wait for pivot confirmation (default: true), delaying divergence display until the pivot is fully formed.
Show Only Last Divergence: Toggles between showing only the most recent divergence (default: true) or all detected divergences (false), with previous lines and labels cleared when true.
Minimum Divergences: Sets the minimum number of divergence types required at a pivot to display (default: 1, max: 6).
Maximum Pivot Points: Limits the number of historical pivot points to check (default: 10).
Maximum Bars to Check: Restricts analysis to the last specified number of bars (default: 500).
Visualization:
Draws lines connecting the price pivot points where divergences are detected, with customizable colors, widths, and styles (solid, dashed, dotted) for RSI and MACD.
Displays a single label per pivot with vertically stacked text listing all detected divergence types (e.g., "RSI Bull Div MACD Bull Div"), using semi-transparent backgrounds (green for bullish, red for bearish) and white text.
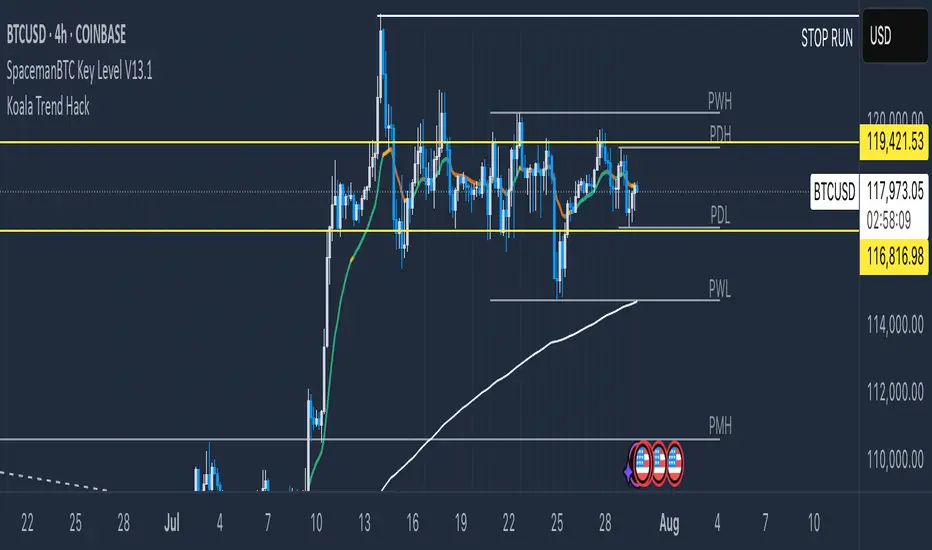
Koala Trend HackWhat this indicator is
A minimal, “ tweet‑faithful ” trend read with just two visuals:
1. H4 EMA200 (white): the macro/regime line pulled onto any timeframe.
2. Trend Line (colored): the average of EMA‑8 and EMA‑21; its color shows the current state.
How it works (state → color)
Priority is macro first, then short‑term momentum—so it’s simple but still reactive above H4:
Below H4 200 → Red (Be Bearish).
Above H4 200 with wick into it → Yellow (Be Bullish & Pray / Watch the retest).
Above H4 200 and above both 8 & 21 → Green (Be Bullish).
Above H4 200 but below both 8 & 21 → Orange (Be Cautious).
If none of the above applies, it falls back to the 8/21 cluster (above both = green, below both = orange) or stays Yellow (Neutral/Watch).
How it aligns with the tweet’s 5 rules
1. Reclaim EMAs = Long → close > 8 & 21 → Green.
2. Close below EMAs = Be cautious* → close < 8 & 21 → Orange.
3. Retest of H4 EMA200 = Be bullish and pray → close > H4 and low ≤ H4 → Yellow.
4. Lose H4 EMA200 = Be bearish* → close < H4 → Red.
5. Reclaim H4 EMA200 = Be bullish again* → back above H4 (and ideally > 8/21) → Green.
How to use
Green favors longs; Orange means lighten up or wait; Yellow says “watch the level” after a retest; Red warns against longs until H4 200 is reclaimed.
Notes:
The H4 EMA200 is a higher‑timeframe value fetched with request.security; on sub‑H4 charts it updates during the current 4‑hour candle (responsive but can shift slightly until that candle closes).
EMAs 8 & 21 are used internally to color the line; they’re not plotted, keeping the chart clean.
What would make this better? Modify it and show me what you built!
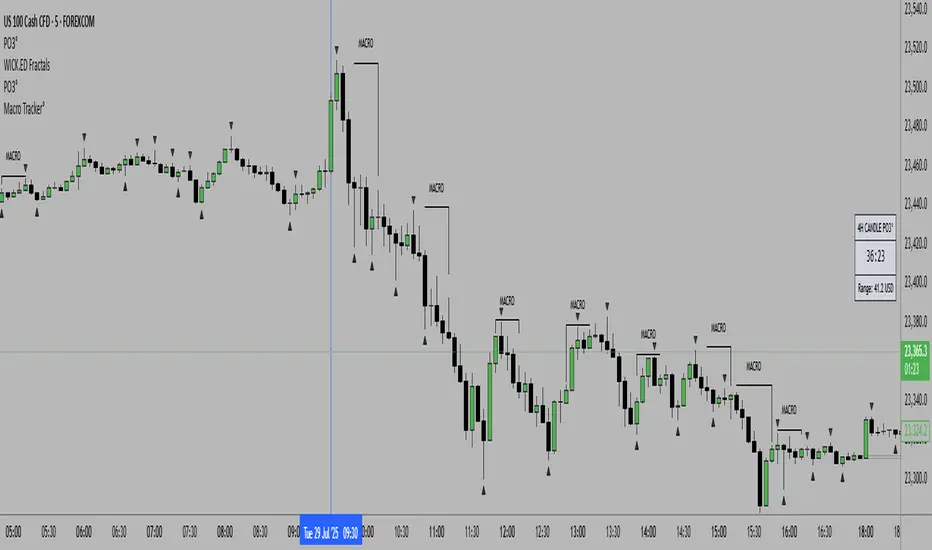
ICT Macro Tracker° (Open-Source) by PesSpecific time indicator for order effectiveness when US market opens
Average True Range with MAATR + Smoothing (SMA or EMA)
Default :
- 9 SMA
What is it for ?
- change of ATR to check sideway or trend

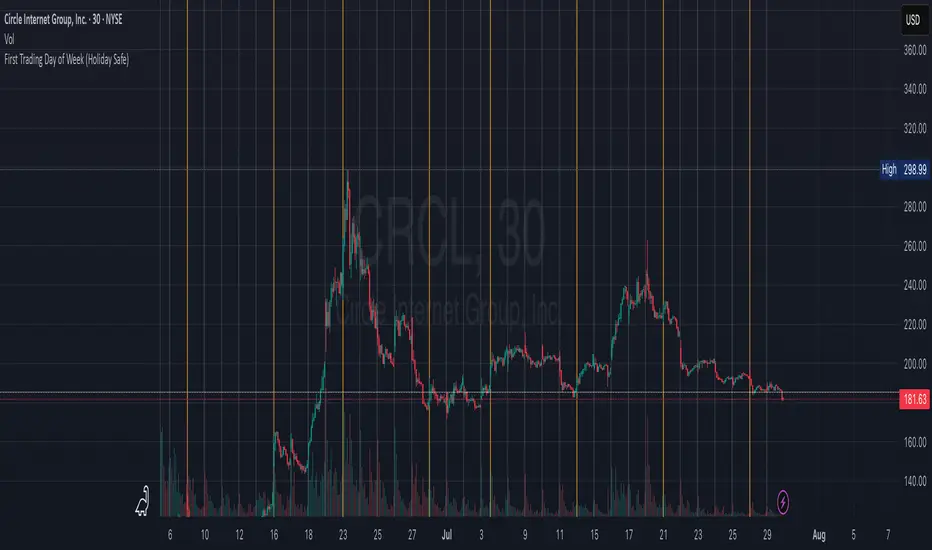
First Trading Day of Week (Holiday Safe)Highlights the first Monday of each trading week to help visualize weekly trend shifts.