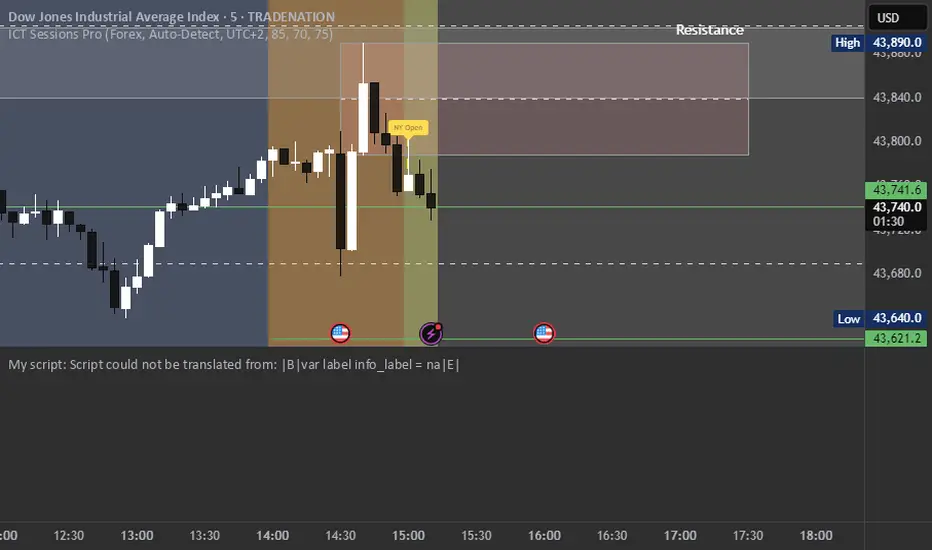
H1/L1 Trap MarkerH1 L1 Trap Marker based on Al Brooks PA
You can use it to detect trap traders and help determine your trade.
Indicators and strategies

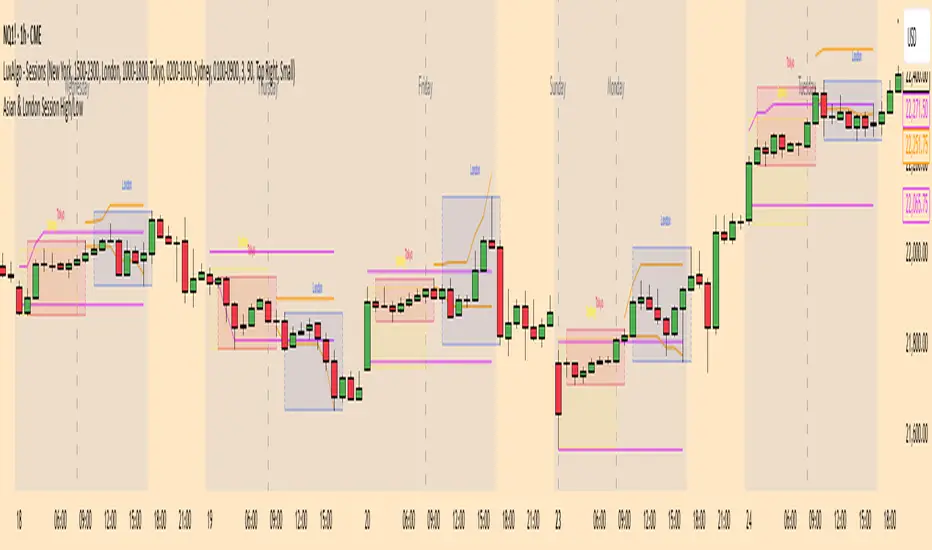
Asian & London Session High/LowThis Pine Script v6 indicator plots the high and low of the Asian and London trading sessions on the chart before the New York session opens.
Asian session is defined from 00:00 to 08:00 (Europe/Sofia time).
London session is defined from 09:00 to 16:30 (Europe/Sofia time).
The session highs and lows are tracked live and updated as new candles form within the session time ranges.
At 16:30, when the New York session opens, all high/low values are reset to na to prepare for the next day.
Horizontal lines are plotted using plot.style_linebr to extend the lines until the next candle.
This tool helps traders identify key support/resistance zones formed during the most active pre-New York hours.
Power candle addPower candle add++++Power candle add++++Power candle add++++Power candle add++++Power candle add++++Power candle add++++Power candle add++++Power candle add++++Power candle add++++Power candle add++++Power candle add++++Power candle add++++Power candle add++++
CnagdaCnagda Indicator ek comprehensive trading tool hai jo multiple technical analysis concepts ko combine karta hai:
special thanks to - tradingview.sweetlogin.com because its modify version of Breaks and Retests with Volatility Stop
Support & Resistance Detection - Dynamic pivot-based levels
Breakout & Retest System - Precise entry/exit signals
Anchored VWAP - Volume-weighted average price from swing points
Volatility Stop - Trend-following mechanism
Moving Average Crossovers - EMA/WMA signals
Smart Alerts - Real-time notifications
🔧 Key Features
Support & Resistance System
Lookback Range: 20 bars (customizable) se pivot points detect karta hai
Dynamic Boxes: Support/resistance levels ko visual boxes ke saath display
Auto-Extension: Levels ko future bars tak extend kar sakta hai
Color Coding: Support (Red) aur Resistance (Green) ke liye alag colors
Anchored VWAP System
Swing High/Low Anchoring: Major swing points se VWAP calculate karta hai
Volume Integration: Price aur volume dono consider karta hai
Dynamic Updates: Har naye swing point par reset hota hai
Visual Markers: Anchor points ko clearly mark karta hai
Breakout Detection
Real-time Alerts: Support/resistance break hone par instant notification
Confirmation Options: Candle close confirmation ya high/low based
Repainting Control: 3 modes - On/Off with different confirmation methods
📈 Entry/Exit Strategy Guide
BUY SIGNALS (Long Entry)
Primary Entry Conditions:
Support Retest Confirmed + Price Above Anchored VWAP
Entry: Support level ka successful retest
Stop Loss: Support level ke neeche 5-10 pips
Target: Next resistance level ya 1:2 Risk-Reward
Bullish MA Crossover + Above Volatility Stop (Green)
Entry: EMA(20) crosses above WMA(50)
Stop Loss: Volatility stop level
Target: Next resistance ya swing high
Resistance Breakout + Volume Confirmation
Entry: Clean breakout above resistance box
Stop Loss: Resistance level (ab support ban gaya)
Target: Measured move ya next major level
Confirmation Filters:
✅ Anchored VWAP upward trending
✅ Volatility Stop showing green (uptrend)
✅ Price above both moving averages
✅ Volume increase during breakout
SELL SIGNALS (Short Entry)
Primary Entry Conditions:
Resistance Retest Confirmed + Price Below Anchored VWAP
Entry: Resistance level ka successful retest
Stop Loss: Resistance level ke upar 5-10 pips
Target: Next support level ya 1:2 Risk-Reward
Bearish MA Crossover + Below Volatility Stop (Red)
Entry: EMA(20) crosses below WMA(50)
Stop Loss: Volatility stop level
Target: Next support ya swing low
Support Breakout + Volume Confirmation
Entry: Clean breakdown below support box
Stop Loss: Support level (ab resistance ban gaya)
Target: Measured move ya next major level
Confirmation Filters:
✅ Anchored VWAP downward trending
✅ Volatility Stop showing red (downtrend)
✅ Price below both moving averages
✅ Volume increase during breakdown
⚠️ Risk Management Rules
Position Sizing
Maximum Risk: 1-2% per trade
Stop Loss: Always mandatory
Position Size: Calculate based on stop distance
Exit Strategy
Profit Targets:
Target 1: 1:1 Risk-Reward (book 50%)
Target 2: 1:2 Risk-Reward (book remaining)
Trailing Stops:
Use Volatility Stop as trailing mechanism
Move stop to breakeven after 1:1 achieved
Time-based Exit:
Exit if no momentum within 5-10 bars
Avoid holding overnight without clear trend
🚨 Alert System
Available Alerts:
New Support/Resistance Levels
Breakout Confirmations
Retest Signals (Potential + Confirmed)
MA Crossovers (Bullish/Bearish)
Anchored VWAP Crosses
Volatility Stop Changes
Alert Messages (Hindi):
"EMA/WMA Bullish crossover hua hai, BUY!"
"EMA/WMA Bearish crossover hua hai, SELL!"
"Price Anchored VWAP ke upar break kar gaya!"
"Naya Anchored VWAP anchor point set hua hai!"
⚙️ Customization Options
Visual Settings:
Label Types: Full descriptions ya Simple (Br, Re, P.Re)
Label Sizes: Tiny to Huge
Colors: Fully customizable for all elements
Line Styles: Dotted, Dashed, Solid
Extensions: None, Right, Left, Both
Technical Parameters:
Lookback Range: 1-100 bars
Retest Detection: 1-20 bars
MA Lengths: Customizable EMA/WMA periods
Volatility Stop: Length aur multiplier adjustable
VWAP Anchoring: Swing detection sensitivity
📋 Best Timeframes
Recommended Usage:
Scalping: 1M, 5M (quick signals)
Day Trading: 15M, 30M, 1H (balanced approach)
Swing Trading: 4H, 1D (major levels)
Market Conditions:
Trending Markets: Excellent for breakout trades
Range-bound: Perfect for retest strategies
High Volatility: Volatility stop works best
Low Volume: Wait for volume confirmation
🎯 Performance Tips
Multi-timeframe Analysis: Higher timeframe trend + lower timeframe entry
Volume Confirmation: Always check volume during breakouts
Market Context: Consider overall market sentiment
News Events: Avoid trading during major announcements
Backtesting: Test on historical data before live trading

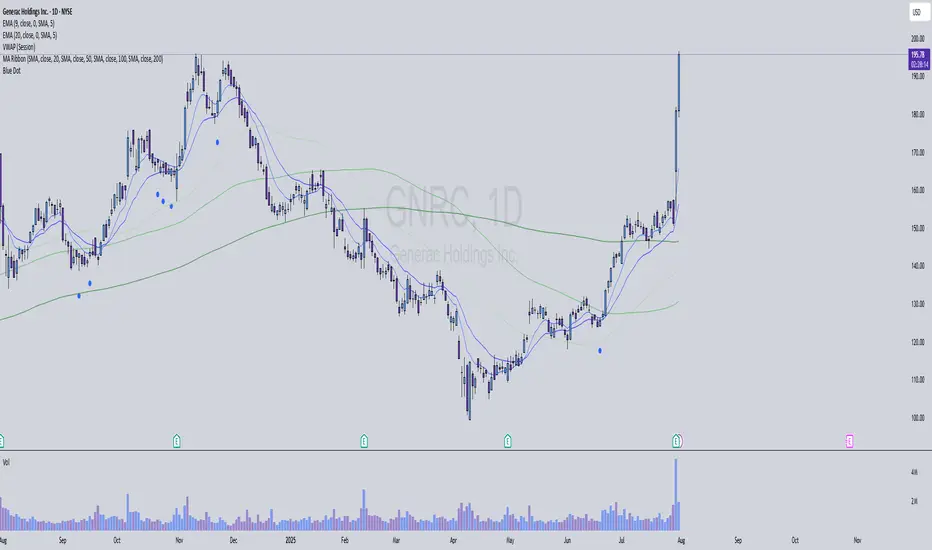
Blue DotThis indicator identifies high-probability long entry signals by combining stochastic momentum analysis with moving average trend confirmation. It's designed to catch oversold bounces in stocks that are already in established uptrends.
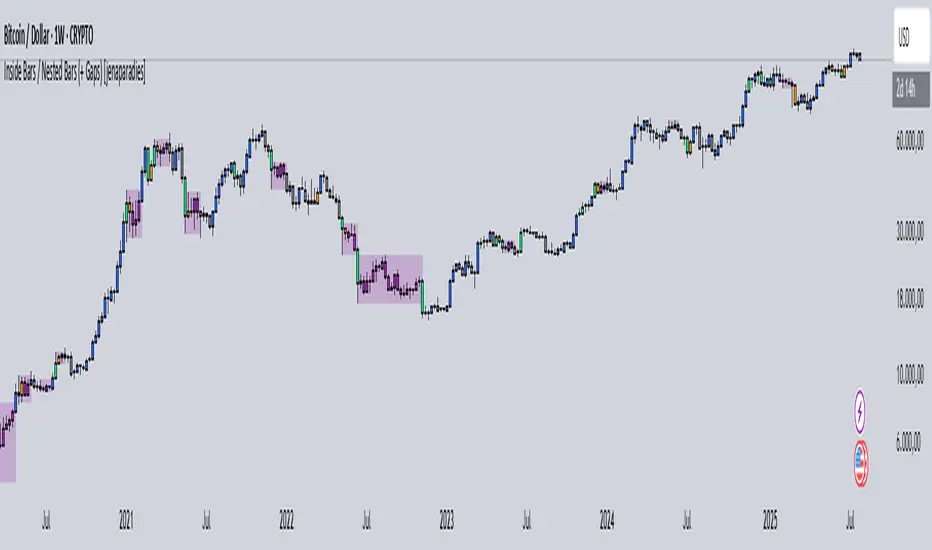
Inside Bars / Nested Bars (+ Gaps) [jenaparadies]📌 Features
Highlight inside bars
Highlight bars that remain within the range of a mother bar (called nested bars )
Highlight the mother bar (optional)
Highlight consecutive nested bars using a visual box (optional)
Enable no-gap candle logic (optional, see below)
Show no-gap candles on the chart (optional)
Fully customizable colors and appearance
📌 Method
An inside bar is any candle whose high is lower than or equal to the previous candle's high, and whose low is higher than or equal to the previous candle's low. In other words, the entire price action of the inside bar remains within the range of the previous candle without exceeding it. The preceding candle is referred to as the mother bar .
Occasionally, the candle following the inside bar may break above or below the inside bar's range, while still remaining fully within the high and low of the mother bar. These candles are referred to as nested bars and are highlighted in a different color.
Optionally, sequences of consecutive nested bars can be enclosed within a box to emphasize consolidation zones.
📌 No-Gap Candles (Optional)
This feature adjusts each candle’s opening price so that it matches the closing price of the previous candle. It is particularly useful for assets that frequently experience large gaps between candles.
By extending each candle's effective range to include the previous candle's close, the indicator maintains structural consistency over timeframes, especially when the open price deviates significantly from the prior close. Inside bars are then identified relative to the extended range of the mother bar.
Optionally, the adjusted no-gap candles can be visualized directly on the chart for better clarity.
🎁 Bonus
Activating the "Show No-Gap Candles" option transforms any line chart into a gap-free bar chart ‒ ideal for visualizing economic data such as inflation rates.
Midnight OpenMidnight Opening Price because there wasn't a single indicator that was specifically marking this.

Gracias mi Dios Sammy IndicadorNASDAQ:QQQ //@version=5
indicator("Gracias mi Dios Sammy Indicador", overlay=true, max_labels_count=500)
// Cálculo de condiciones de velas
isBullish = close > open
isBearish = close < open
prevBullish = close > open
prevBearish = close < open
// Patrón Alcista (A): vela verde envuelve completamente a la roja previa
bullishEngulfing = isBullish and prevBearish and close > open and open < close
// Patrón Bajista (B): vela roja envuelve completamente a la verde previa
bearishEngulfing = isBearish and prevBullish and close < open and open > close
// Marcar con “A” (alcista) y “B” (bajista)
plotshape(bullishEngulfing, title="Alcista", style=shape.labelup, color=color.green, text="A", size=size.tiny, location=location.belowbar, textcolor=color.white)
plotshape(bearishEngulfing, title="Bajista", style=shape.labeldown, color=color.red, text="B", size=size.tiny, location=location.abovebar, textcolor=color.white)
// Alertas
alertcondition(bullishEngulfing, title="Alerta Alcista", message="Patrón Alcista (A) detectado")
alertcondition(bearishEngulfing, title="Alerta Bajista", message="Patrón Bajista (B) detectado")

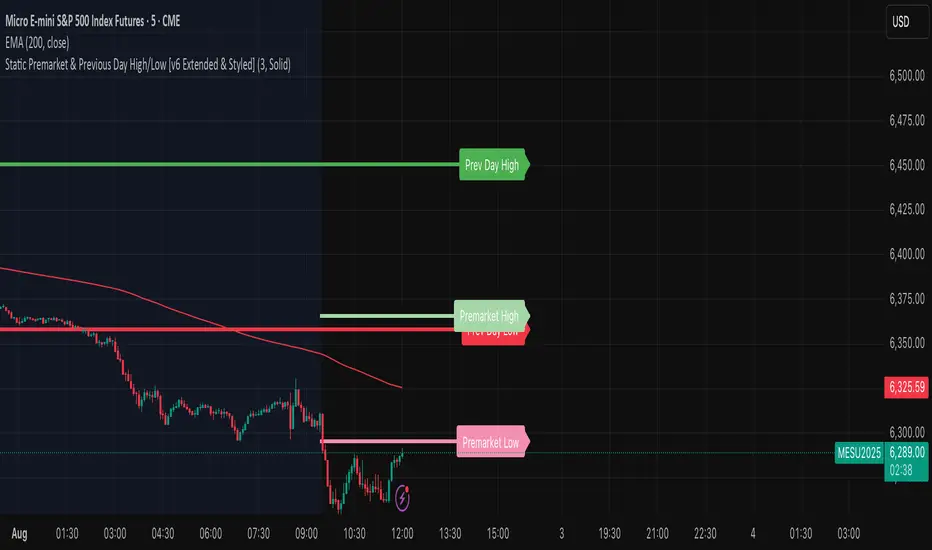
High/Low Premarket & Previous Day This scripts adds lines for previous day and premarket high/low with labels that you can toggle on and off. The lines extend through current premarket and trading session
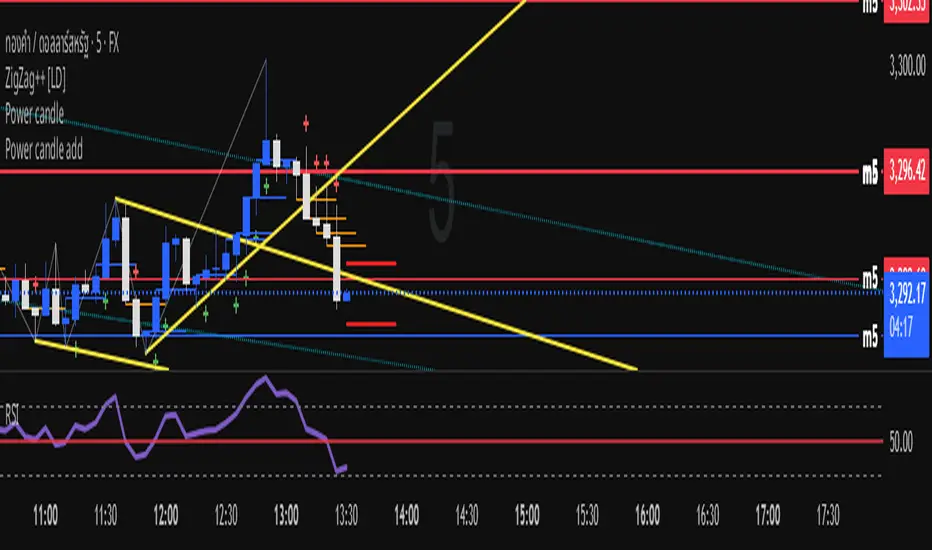
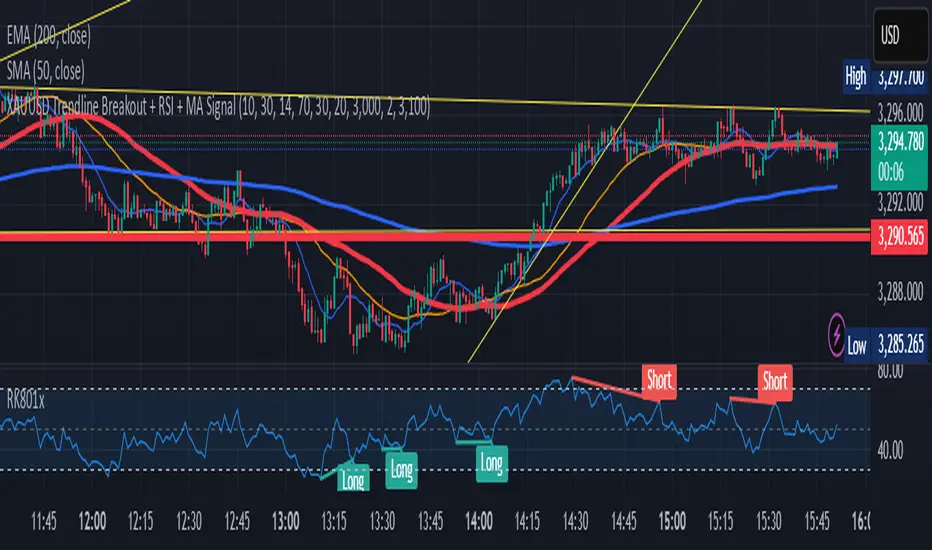
XAUUSD Trendline Breakout + RSI + MA Signal//@version=5
indicator("XAUUSD Trendline Breakout + RSI + MA Signal", overlay=true)
// --- Inputs ---
lengthFast = input.int(10, title="Fast MA Length")
lengthSlow = input.int(30, title="Slow MA Length")
rsiLength = input.int(14, title="RSI Length")
rsiOverbought = input.int(70, title="RSI Overbought Level")
rsiOversold = input.int(30, title="RSI Oversold Level")
// --- Moving Averages ---
fastMA = ta.sma(close, lengthFast)
slowMA = ta.sma(close, lengthSlow)
// --- RSI ---
rsi = ta.rsi(close, rsiLength)
// --- Trendline (Manual input) ---
// Use fixed default price values here, change manually based on your chart.
trend_x1 = input.int(20, title="Trendline Point 1 X (bars ago)")
trend_y1 = input.float(3000.0, title="Trendline Point 1 Y (price)") // constant default
trend_x2 = input.int(2, title="Trendline Point 2 X (bars ago)")
trend_y2 = input.float(3100.0, title="Trendline Point 2 Y (price)") // constant default
bar_idx1 = bar_index - trend_x1
bar_idx2 = bar_index - trend_x2
trendline_y_value(bar) =>
m = (trend_y2 - trend_y1) / (bar_idx2 - bar_idx1)
c = trend_y1 - m * bar_idx1
m * bar + c
trend_y_curr = trendline_y_value(bar_index)
trend_y_prev = trendline_y_value(bar_index - 1)
// --- Signals ---
// Trendline breakout
buyBreakout = (close < trend_y_prev) and (close > trend_y_curr)
sellBreakout = (close > trend_y_prev) and (close < trend_y_curr)
// MA crossover
maBuy = ta.crossover(fastMA, slowMA)
maSell = ta.crossunder(fastMA, slowMA)
// RSI confirmation
rsiBuy = rsi < rsiOversold
rsiSell = rsi > rsiOverbought
// Final buy/sell signal with all conditions
buySignal = buyBreakout and maBuy and rsiBuy
sellSignal = sellBreakout and maSell and rsiSell
// --- Plot ---
plot(fastMA, color=color.blue, title="Fast MA")
plot(slowMA, color=color.orange, title="Slow MA")
plotshape(buySignal, title="Buy Signal", location=location.belowbar, color=color.green, style=shape.labelup, text="BUY")
plotshape(sellSignal, title="Sell Signal", location=location.abovebar, color=color.red, style=shape.labeldown, text="SELL")
// Plot trendline
var line trendLine = na
if barstate.islast
if na(trendLine)
trendLine := line.new(bar_idx1, trend_y1, bar_idx2, trend_y2, color=color.yellow, width=2)
else
line.set_xy1(trendLine, bar_idx1, trend_y1)
line.set_xy2(trendLine, bar_idx2, trend_y2)
// --- Alerts ---
alertcondition(buySignal, title="Buy Alert", message="XAUUSD Buy Signal")
alertcondition(sellSignal, title="Sell Alert", message="XAUUSD Sell Signal")

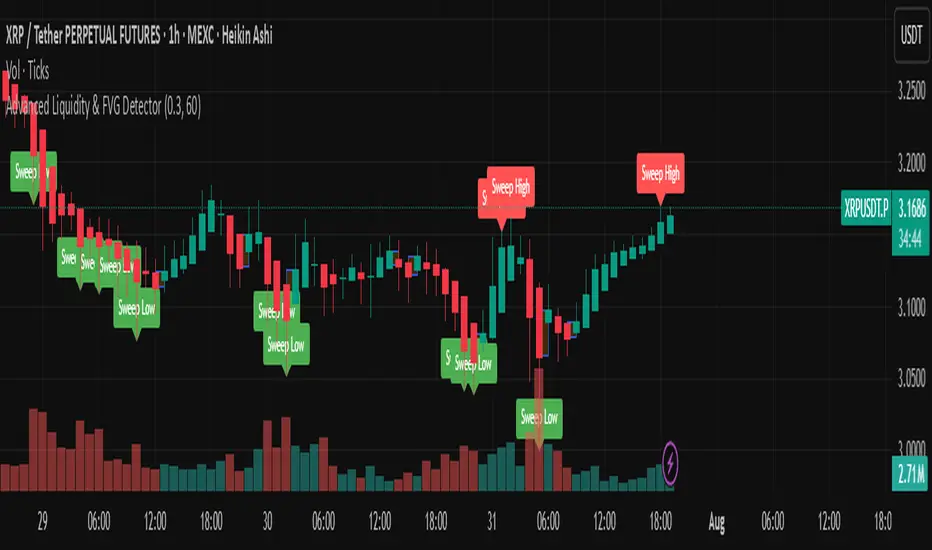
Advanced Liquidity & FVG Detector With Entry/Exit SignalsThe Advanced Liquidity & FVG Detector is more than just an indicator—it's a complete trading system that brings institutional-grade market analysis to individual traders. By combining liquidity detection, fair value gap analysis, sweep/grab pattern recognition, and intelligent risk management, this indicator provides everything needed for sophisticated market analysis and high-probability trading opportunities.
Whether you're a day trader, swing trader, or position trader, this indicator adapts to your style and timeframe, providing the insights needed to make informed trading decisions with confidence. The Pine Script v6 compatibility ensures future-proof performance and seamless integration with the latest TradingView features.
Transform your trading experience with professional-grade market structure analysis—tradable insights delivered in real-time, right on your chart.
EMA 8 & 21 crossover change EMA 8 & 21 crossover change Indicator This custom TradingView indicator highlights trend shifts by changing candle colors when the 8 EMA crosses the 21 EMA. Bullish crossovers turn candles different color, while bearish crossovers turns different as well—making it easy to visually identify emerging trends and momentum shifts in real time.

BTC Fractal Momentum ExtremesDescription – BTC Fractal Momentum Extremes (BTCFME)
BTC Fractal Momentum Extremes (BTCFME) is a multi-factor, multi-method technical indicator designed to detect potential top and bottom reversal points in Bitcoin price action by integrating a confluence of unconventional signals. It combines fractals, adaptive momentum, volume dynamics, price velocity convergence, and market structure shifts — all filtered through real-time volatility and contextualized by temporal market conditions.
This tool is best used by traders looking to spot high-confidence turning points on intraday or swing timeframes, and works particularly well in volatile, momentum-driven environments.
Key Components & Methodology
BTCFME utilizes five independent signal-generation methods:
1. Fractal Volume Divergence
Detects reversal fractals in price (5-bar patterns) and validates them with volume anomalies:
Volume spikes (e.g., climax moves) or
Volume exhaustion (e.g., waning participation)
2. Adaptive Momentum Oscillator
Calculates momentum normalized by ATR-adjusted volatility, filtering out noise in choppy markets. It spots directional shifts when momentum inflects from extreme levels.
3. Market Structure Breaks
Identifies dynamic support and resistance using a configurable lookback, and flags potential breakouts or breakdowns from those levels.
4. Price Velocity Convergence
Analyzes the rate of change (velocity) and its acceleration. When both compress within a narrow volatility range, it signals a potential inflection zone.
5. Temporal Confluence Filter
Signals are only considered valid during active market hours (9 AM – 4 PM, excluding weekends) to reduce false positives during illiquid or inefficient trading periods.
Signal Logic & Sensitivity
Signals are generated when at least 3 out of 4 core methods agree, controlled by the Signal Sensitivity setting:
1 (High Sensitivity) = Trigger signals with fewer confirmations
5 (Low Sensitivity) = Require stronger multi-factor confluence
🔹 Buy (Bottom) Signals trigger when:
Bullish fractals appear
Momentum is deeply negative but improving
Price tests structure support
Velocity compresses below average
🔺 Sell (Top) Signals trigger when:
Bearish fractals with volume spikes appear
Momentum peaks and starts to decline
Price tests resistance
Velocity compresses near highs
Visual Features
Arrows: Buy signals = green arrow below candle. Sell signals = red arrow above candle.
Background Color: Indicates overall momentum regime (green = bullish bias, red = bearish, gray = neutral).
Dynamic Support & Resistance Lines: Based on recent swing highs/lows.
Signal Table (top-right): Shows real-time stats on:
Momentum value
Volatility factor
Volume strength (vs. 20-SMA)
Market structure status
Alerts
You can set alerts using the built-in conditions:
BTC Bottom Alert → Fires on potential market bottoms.
BTC Top Alert → Fires on potential market tops.
These alerts are filtered to avoid whipsaw conditions, by checking that opposite signals did not trigger in the last 2 candles.
How to Use
Timeframes: Best suited for 1H–4H and Daily BTC charts, but adaptable to others with parameter tuning.
Confirm with Price Action: Use BTCFME signals in conjunction with candlestick patterns or S/R zones for best results.
Adjust Sensitivity: Lower values catch more signals (good for scalping), higher values filter for stronger reversals (ideal for swing trades).
Use in Trending or Reversing Markets: BTCFME performs best during trending environments or volatile reversals — avoid during prolonged flat/ranging zones.
Notes & Recommendations
BTCFME is not a standalone buy/sell signal; combine it with risk management and trend confirmation tools.
Avoid using it during extremely low-volume sessions (e.g., late weekends).
Adjust parameters based on BTC's evolving volatility and your trading style.

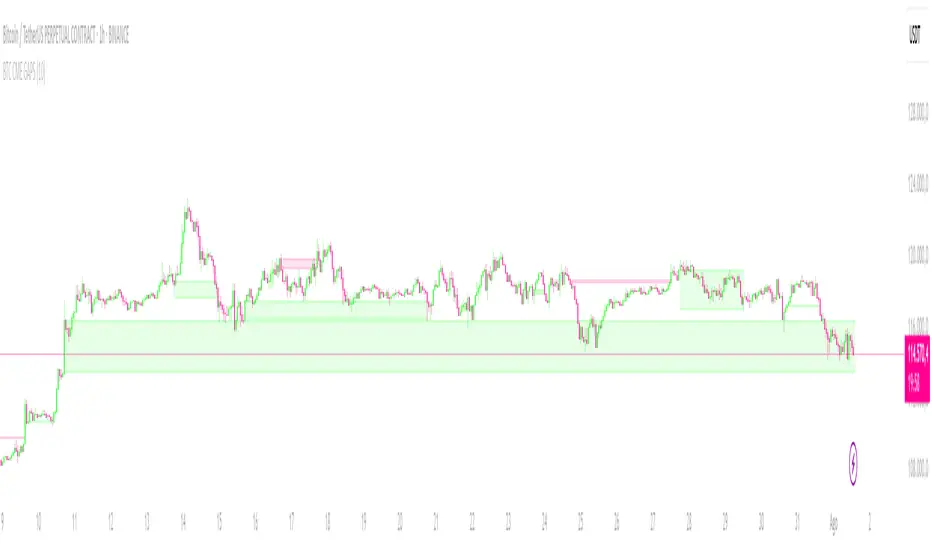
CRYPTO CME GAPS- Can be used in any crypto symbol of any exchange, (not necessarily the CME exchange)
- Displays the CME gaps with the colors green or red depending on the sentiment of the gap
- Extends the gaps displayed until they are filled.
- In the end of the code there are the boolean values 'filled_bull' and 'filled_bear' that can be used to create a strategy script.
TrailingPE//@version=6
indicator("TrailingPE", shorttitle="TPE", overlay=true)
// === USER INPUTS ===
pos_x = input.string("Right", "Horizontal Position", options= )
pos_y = input.string("Top", "Vertical Position", options= )
text_color = input.color(color.white, "Text Color")
bg_color = input.color(color.new(color.blue, 80), "Background Color")
text_size = input.string("Normal", "Font Size", options= )
// === POSITION MAPPING ===
get_position_y() =>
switch pos_y
"Top" =>
switch pos_x
"Left" => position.top_left
"Center" => position.top_center
"Right" => position.top_right
"Middle" =>
switch pos_x
"Left" => position.middle_left
"Center" => position.middle_center
"Right" => position.middle_right
"Bottom" =>
switch pos_x
"Left" => position.bottom_left
"Center" => position.bottom_center
"Right" => position.bottom_right
get_text_size() =>
switch text_size
"Tiny" => size.tiny
"Small" => size.small
"Normal" => size.normal
"Large" => size.large
"Huge" => size.huge
// === PE CALCULATION ===
eps_ttm = request.financial(syminfo.tickerid, "EARNINGS_PER_SHARE_DILUTED", "TTM")
if na(eps_ttm)
eps_ttm := request.financial(syminfo.tickerid, "EARNINGS_PER_SHARE_BASIC", "TTM")
current_price = close
pe_ratio = eps_ttm > 0 ? current_price / eps_ttm : na
is_data_valid = not na(pe_ratio) and eps_ttm > 0
// === COMPACT SINGLE-LINE DISPLAY ===
if barstate.islast
var table pe_table = table.new(get_position_y(), 1, 1,
bgcolor=bg_color,
border_width=1,
border_color=color.gray)
table.clear(pe_table, 0, 0, 0, 0)
if is_data_valid
// Single line: "PE : Value" - removed text_style parameter
pe_rounded = math.ceil(pe_ratio)
pe_text = "PE : " + str.tostring(pe_rounded)
table.cell(pe_table, 0, 0, pe_text,
text_color=text_color,
text_size=get_text_size(),
bgcolor=bg_color)
else
table.cell(pe_table, 0, 0, "PE : N/A",
text_color=color.red,
text_size=get_text_size(),
bgcolor=bg_color)

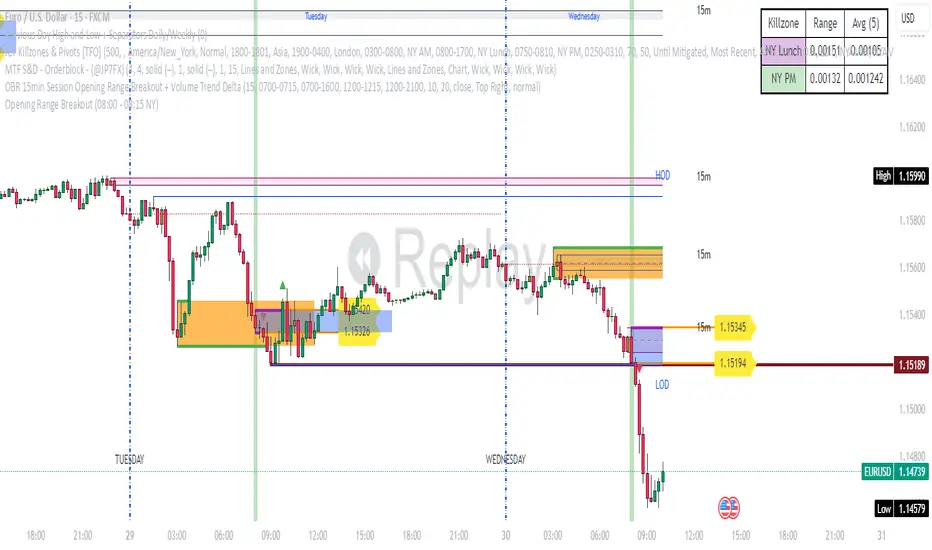
Opening Range Breakout (08:00 - 08:15 NY) - AAPNIndicador que marca la apertura de Forex en NY a 15 minitos, la primera vela
Fibonacci Kanalları Zaman DilimliI understand that you want to fetch moving Fibonacci levels from a different timeframe (fibTimeframe) in Pine Script and plot them on the chart.
Here is a simple example code that:
Takes the timeframe input from settings (fibTimeframe),
Uses request.security() to get data from the selected timeframe,
Calculates Fibonacci levels,
Uses plot() to display the levels on the chart.

Momentum Commitment Delta (MCD)What it is
M C D fuses five micro-structure clues into one 0-to-1 score that says, “how hard are traders actually leaning on this move?”
1. Body-Delta Momentum – average net candle body direction.
2. Volume Commitment – up-volume ÷ down-volume over the same window.
3. Wick Compression – shrinking upper/lower wicks = clean conviction.
4. Candle Sequencing – rewards orderly, staircase-style body growth.
5. Pin Ratio – where the close pins inside each candle’s range.
The five factors are multiplied, then auto-normalized so extremes always land near 0 / 1 on any symbol or timeframe.
I recommend tweaking the settings to fit your edge, the pre-loaded settings may not be suitable for most traders. The MCD works on all timeframes as well :)
⸻
How to read basic signals
• Fresh cross above 0.70 → often the birth of a real breakout.
• Cluster of > 0.70 bars → “commitment lock,” pull-backs usually shallow.
• Price makes new high while M C D doesn’t → beware...
• Cross back below 0.30 after a run → momentum is out of fuel.
⸻
Because M C D is multiplicative, it’s hard to hit the extremes—so when the bars light lime green, the print is usually telling the truth.
I personally use the MCD to identify the peak of a high-conviction range, NOT a breakout. If a bar prints over 0.70 (green) and then a range forms off of the bar which exceeded 0.70, the breakout has a high chance to be explosive, regardless of what MCD reads at the breakout inflection point.
Play around with it, im sure there are plenty of other patterns.
Disclaimer: The Momentum Commitment Delta (MCD) indicator is provided strictly for educational and informational purposes. It does not constitute financial or investment advice, nor is it a recommendation to buy or sell any security. Trading involves substantial risk, and you should always perform your own due diligence and consult a qualified financial professional before making any trading decisions. Past performance is not indicative of future results.
EMA X/Y🔍 EMA X/Y Indicator Description
This indicator combines two different EMA ( Exponential Moving Average ) values into a single script, allowing you to visualize both short-term and long-term trends on the same chart.
📌 X: First EMA length (typically for short-term trends)
📌 Y: Second EMA length (typically for long-term trends)
🎯 Purpose:
– Track overall trend direction and potential reversals
– Generate buy/sell signals based on EMA X and Y crossovers
– Analyze market momentum across timeframes
