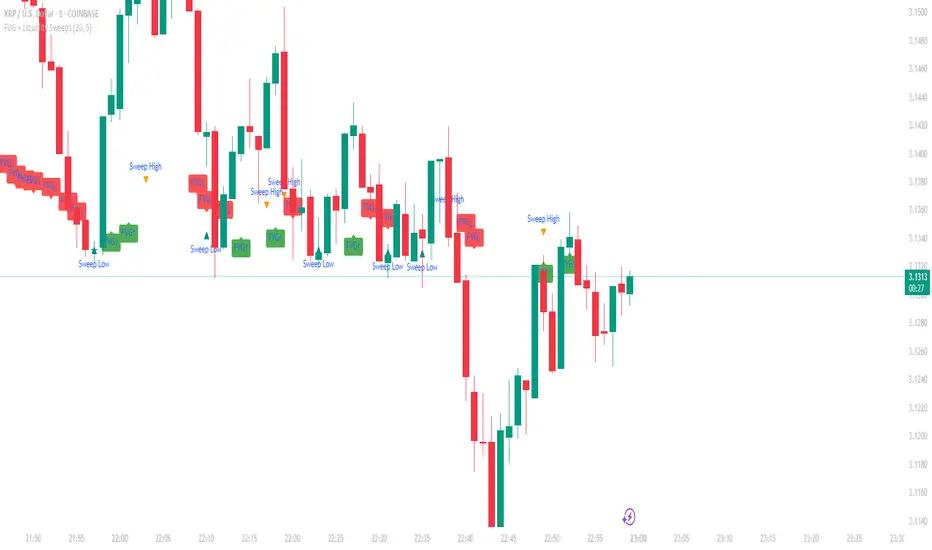
FVG + Liquidity Sweepsthis is a test and i don't know if it is gonna actually work but let me know if it does.
Indicators and strategies
Sessions (Blvck 5min Orb Range)Blvck 5min Orb + session indicator. Lays out the main sessions times with a background colour

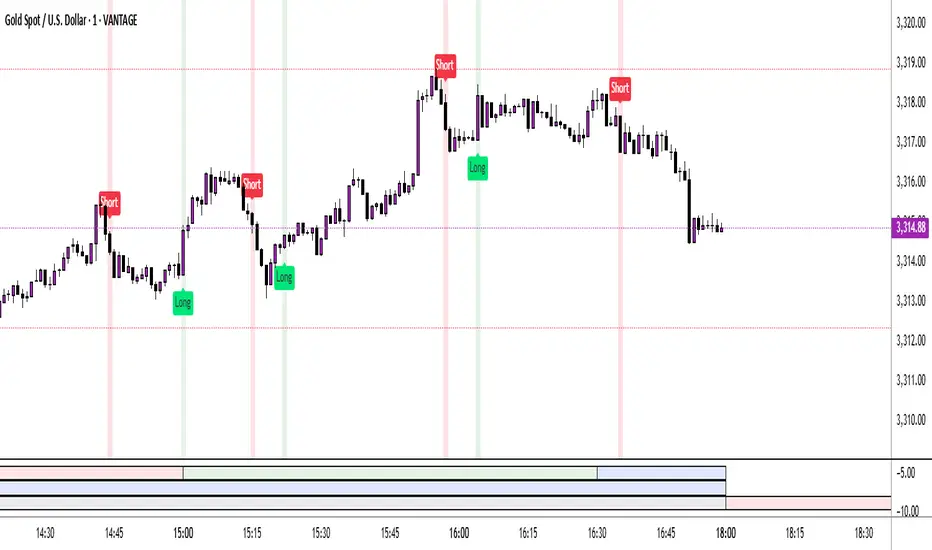
Twin Range Filter – Buy/Sell SignalsThe Twin Range Filter is a trend-following indicator that combines two adaptive volatility filters to identify potential market reversals and trend continuations. It uses two configurable smoothing periods (fast and slow) to calculate a dynamic range around price, filtering out market noise and highlighting meaningful shifts in direction.
This indicator plots BUY and SELL signals based on price action in relation to the range filter, as well as internal trend conditions.
✅ How It Works:
Long Signal (BUY) is triggered when:
Price is above the filtered range (showing strength), and
Short-term upward momentum is confirmed.
Short Signal (SELL) is triggered when:
Price is below the filtered range (showing weakness), and
Short-term downward momentum is confirmed.
The signals are highlighted using green "Long" and red "Short" labels on the chart.
Background colors reinforce the current directional bias.
🔔 Alerts:
Long Signal – A new BUY condition has been detected.
Short Signal – A new SELL condition has been detected.
📌 Use Cases:
Entry timing for swing or intraday trades
Trend confirmation filter
Signal generator in automated strategies (when paired with a strategy script)
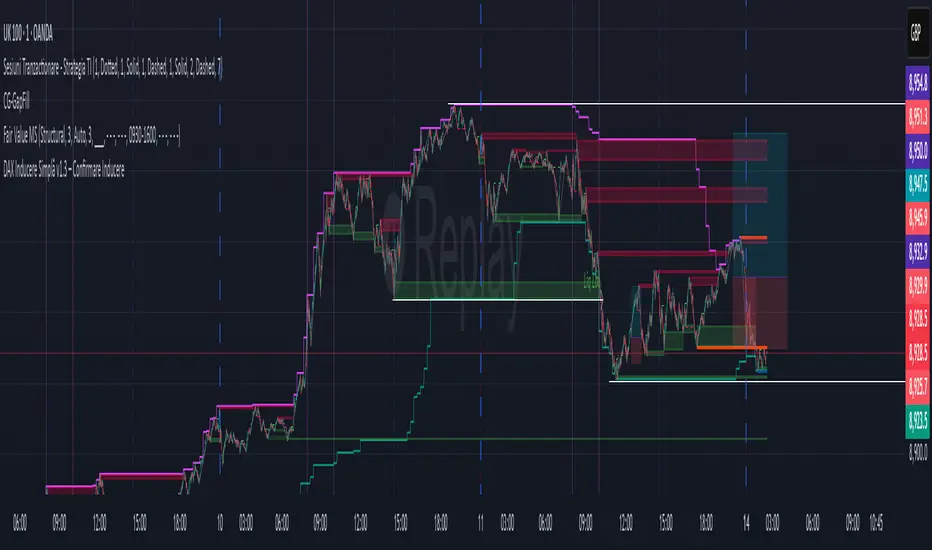
DAX Inducere Simplă v1.3 – Confirmare InducereDAX Inducere Simplă v1.3 – Confirmare Inducere ,signals before fvg mss and displacement
MACD-RSI Divergence OscillatorMACD-RSI Divergence Oscillator: Dual Confirmation with Momentum + Divergence Signals
This powerful oscillator combines MACD and RSI into a single normalized visual tool, enriched with automatic divergence detection and smart signal alerts. It’s designed to give traders advanced insights into momentum shifts and trend reversals.
Key Features:
• MACD + RSI Combo: Both indicators are scaled and merged into one oscillator for clearer interpretation.
• Automatic Divergence Detection:
• Bullish & Bearish divergences on both MACD and RSI
• Highlights strong divergences when both confirm
• Trading Signals:
• Detects MACD crossovers and RSI reversals
• Smart buy/sell signals based on momentum + divergence
• Custom Oscillator View:
• Plots MACD and RSI on the same scale
• Visual zero-line, overbought/oversold levels, and customizable colors
• Optional Dashboard Table:
• Displays live indicator values, signal states, and divergence status
Ideal For:
• Spotting early trend reversals
• Confirming trade entries/exits
• Avoiding false signals using dual indicator logic
Highly customizable and suitable for all timeframes and asset types.

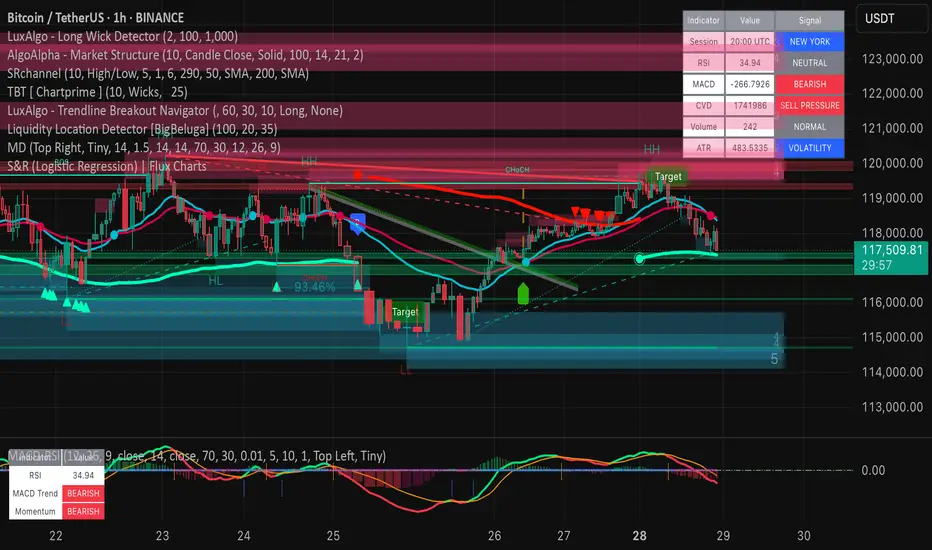
Market DashboardMarket Dashboard — All-in-One Technical Indicator Panel
The Market Dashboard is a powerful visual tool that consolidates key technical indicators into a single on-chart table, helping traders make faster and more informed decisions. This script includes:
RSI — Detects overbought and oversold market conditions
MACD — Shows trend momentum and crossover signals
CVD (Cumulative Volume Delta) — Highlights buyer vs. seller pressure
Volume Analysis — Flags unusually high volume
ATR (Average True Range) — Displays current market volatility
Session Detector — Automatically identifies ASIAN, LONDON, or NEW YORK sessions based on UTC time
Fully Customizable — Adjust table position and text size to fit your chart layout
Designed for traders who want a clean, real-time snapshot of market dynamics, directly on the chart.

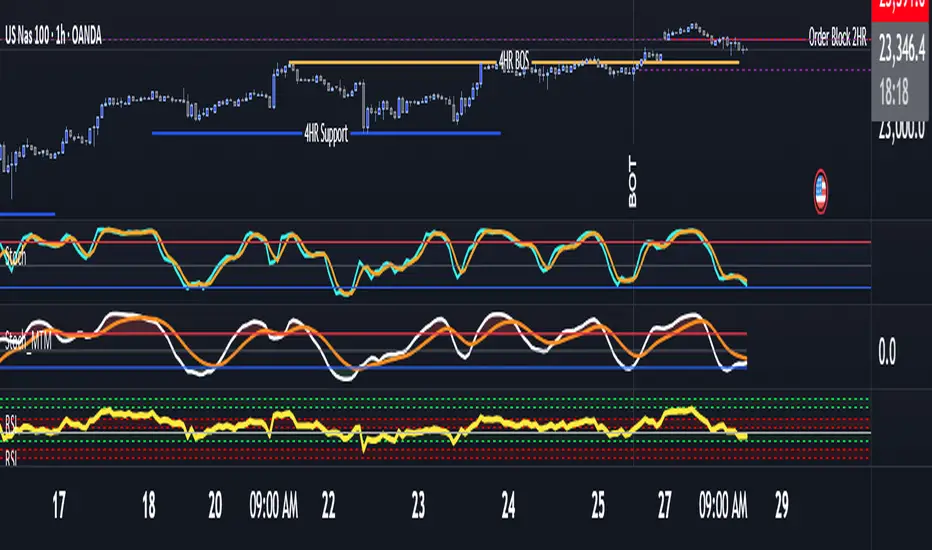
Stochastic Momentum Index_Middle Band AddedThis is an update to the current indicator Stochastic Momentum Index by: surjithctly
This video on YouTube Linked Under explains how to use this indicator along with another indicator: ema cloud 150
www.youtube.com
All that was improvised and added was a middle band a mid point to know where the middle of the indicator is. That is all.
Also Edit, Customize the indicator however you like, and if you don't want the mid point shown or want to alter to a line or a dotted line you can also do that as well.
Please enjoy, I provide these updates that I publish because I am passionate about trading and if this helps me, I know it will help you.

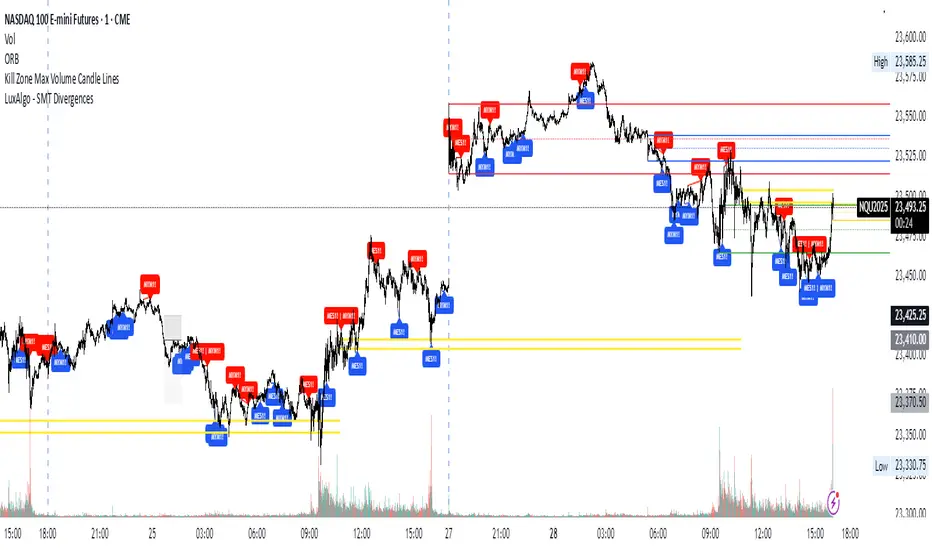
Kill Zone Max Volume Candle LinesThe Kill Zone Max Volume Lines indicator identifies the highest-volume candle within four key market sessions (Asia, London, NY AM, NY PM) and plots horizontal lines at its high, low, and midpoint levels, extended to the right.
Designed for traders targeting zones of heightened activity, this indicator highlights dynamic support and resistance levels based on volume—ideal for breakout or bounce strategies during highly volatile periods known as “kill zones.”
Perfect for indices such as Nasdaq (NQ), S&P 500 (SP), and Dow Jones (YM) on 15-minute or higher timeframes.
Stochastic Momentum Index_MiddleBandAddedSame Stochastic Momentum Index, but Middle Band added to know the mid point of this indictor.
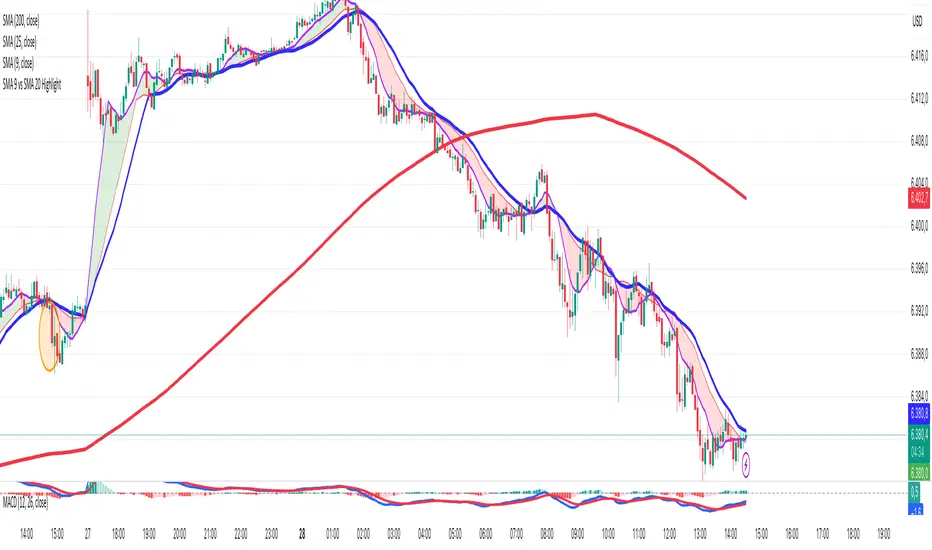
SMA 9 vs SMA 20 Highlight CrossoverHighlight in green the area in between the two SMA do that when the SMA cross above the SMA 20 periods the area is colored in green and when the SMA cross below the SMA 20 periods the area is colored in red
Ultimate Global Trading Hours📊 Global Markets Pro - Summary
What it does:
Shows real-time trading hours for 11 major stock markets worldwide
Displays countdown timers for when each market opens/closes
Includes Forex sessions and US extended hours (pre-market/after-hours)
Features advanced market sentiment analysis with Fear/Greed indicators
Key Features:
✅ Chronological market order (Sydney → Tokyo → London → NYSE, etc.)
✅ Customisable times for each market in HH:MM format
✅ Multi-factor sentiment (VIX, Bonds vs Stocks, Weekly trends, Volume)
✅ Clean interface with emoji indicators and colour coding
✅ Your timezone display with GMT+/- options
Perfect for:
Day traders tracking global market sessions
Swing traders gauging market sentiment
Anyone wanting to know when major markets are active
Result: One comprehensive dashboard showing when to trade and market mood across all time zones!

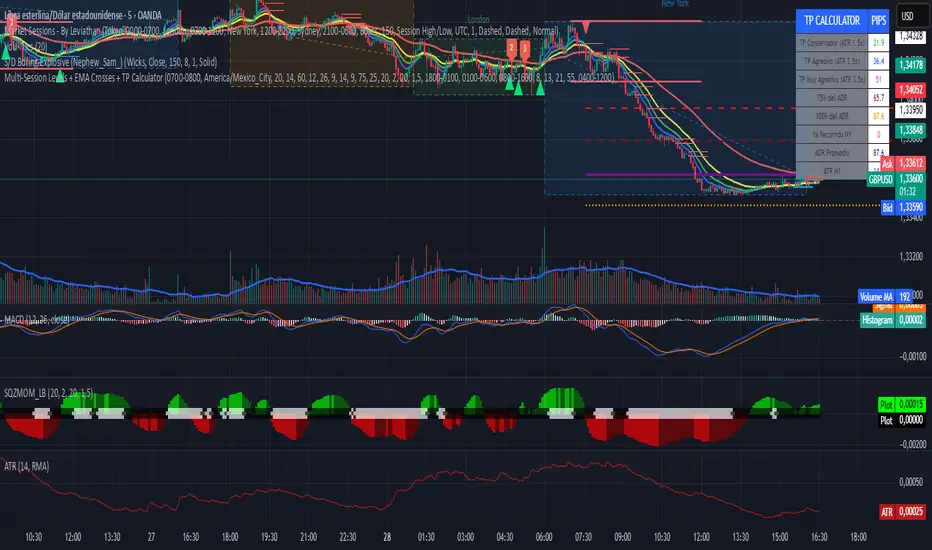
Multi-Session Levels + EMA Crosses + TP Calculator (GBP/USD)# Multi-Session Levels + EMA Crosses + TP Calculator
## 📋 Description
**Advanced trading indicator combining multi-session analysis, EMA cross validation, and automated Take Profit calculations for Forex markets.**
This comprehensive tool integrates session-based level analysis with validated EMA crossovers and intelligent TP calculations, designed specifically for serious traders who need precise entry signals with calculated exit strategies.
## 🎯 Key Features
### 📊 **Multi-Session Analysis**
- **Asian Session (6PM-1AM Mexico)**: Generates key support/resistance levels
- **London Session (1AM-6AM Mexico)**: Analyzes manipulation patterns
- **New York Session (8AM-4PM Mexico)**: Dynamic levels with trend confirmation
- **AMD Setup Detection**: Combines all sessions for high-probability setups
### 📈 **Advanced EMA System**
- **4 EMAs**: 8, 13, 21, and 55 periods with visual display
- **Validated Crossovers**: EMA 8 vs EMA 13 with multiple confirmations
- **Smart Filtering**: Only shows signals during optimal trading hours (6AM-12PM Mexico)
### ✅ **Triple Validation System**
- **MACD Confirmation**: Histogram strength + signal line position + momentum direction
- **RSI Filter**: Overbought/oversold levels with moving average confirmation
- **Squeeze Momentum**: Bollinger Bands vs Keltner Channels compression detection
### 💰 **Intelligent TP Calculator**
- **ADR-Based Targets**: Uses Average Daily Range for realistic profit expectations
- **ATR Multipliers**: Conservative (1.5x), Aggressive (2.5x), Very Aggressive (3.5x)
- **Session-Aware**: Considers already-traveled distance in NY session
- **Real-Time Table**: Live pip calculations for all TP levels
- **Visual Levels**: Automatic TP lines drawn on chart with color coding
### 🚨 **Smart Alert System**
- **Validated Signals Only**: Alerts trigger only when ALL confirmations align
- **TP Integration**: Alerts include suggested take profit levels
- **Non-Validated Tracking**: Shows basic crosses that don't meet full criteria
## 📐 **Technical Calculations**
### **ADR (Average Daily Range)**
- 20-period average of daily high-low ranges
- Converted to pips for easy interpretation
- Used for percentage-based TP targets (50%, 75%, 100% of ADR)
### **ATR (Average True Range)**
- 14-period ATR from H1 timeframe (configurable)
- Accounts for gaps and volatility
- Base for multiplier-based TP levels
### **Session Tracking**
- Real-time monitoring of NY session range
- Calculates remaining potential movement
- Optimizes TP placement based on session progress
## 🎨 **Visual Elements**
### **Chart Levels**
- **Orange Lines**: Asian and London session levels
- **White/Green/Red Lines**: NY session levels (color changes with trend direction)
- **TP Lines**: Color-coded take profit levels with different styles
### **EMA Display**
- **Blue**: EMA 8 (fastest)
- **Green**: EMA 13 (signal line)
- **Yellow**: EMA 21 (trend filter)
- **Red**: EMA 55 (major trend)
### **Signal Shapes**
- **Bright Triangles**: Fully validated signals
- **Faded Triangles**: Non-validated basic crosses
- **Size Variation**: Signal strength indication
## 📊 **Information Table**
Real-time display showing:
- **TP Levels**: All calculated take profit targets in pips
- **Session Data**: NY range already traveled vs average
- **Volatility Metrics**: Current ATR and ADR values
- **Clean Design**: Easy-to-read format with color coding
## ⚙️ **Customization Options**
### **Session Times**
- Fully configurable session times
- Mexico City timezone support
- Enable/disable individual session analysis
### **Validation Controls**
- Toggle MACD, RSI, Squeeze validation independently
- Adjust RSI overbought/oversold levels
- Customize MACD and Squeeze parameters
### **Display Options**
- Show/hide EMAs, crosses, TP levels, table
- Customize TP calculation periods (ADR, ATR)
- Choose ATR timeframe for calculations
## 🎯 **Ideal For**
- **Forex Day Traders**: Especially USD pairs during NY session
- **Session-Based Strategies**: Traders who respect market sessions
- **Risk Management Focus**: Those who need calculated exit strategies
- **Multi-Timeframe Analysis**: Traders using H1-H4 charts
## 📈 **Best Practices**
1. **Use during high-volume sessions** (London-NY overlap)
2. **Wait for full validation** before entering trades
3. **Consider session context** when setting TPs
4. **Combine with proper risk management** (1-2% per trade)
5. **Backtest thoroughly** before live trading
## ⚠️ **Important Notes**
- **Signals work best** during trending market conditions
- **AMD setups** provide highest probability entries
- **TP levels are suggestions** - adjust based on market context
- **Always use stop losses** (not included in this indicator)
- **Designed for Forex markets** - may need adjustment for other instruments
---
*This indicator combines proven technical analysis concepts with modern session-based trading approaches, providing both entry timing and exit planning in one comprehensive tool.*
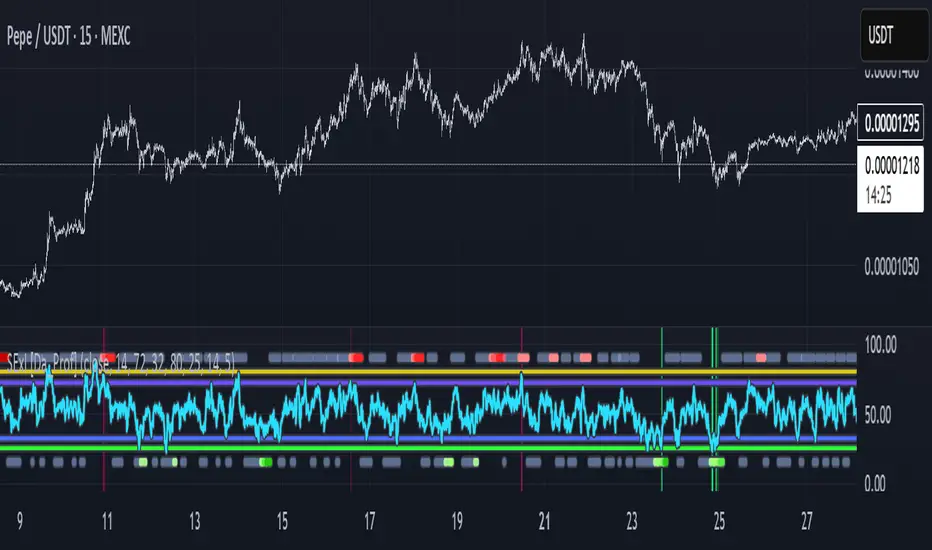
SExI - Super Exhaustion Indicator [Da_Prof]As we know, the RSI can remain at "overbought" or "oversold" levels for long periods of time while the price continues in that direction. The SExI (Super Exhaustion Indicator) is an indicator designed to help detect exhaustion of strong moves.
The SExI is a combination of the RSI and "upper" Aroon. For the indicator to trigger, the RSI has to be above or below a top/bottom trigger line when the Aroon has had a set number of drives up or down correspondingly. An Aroon top drive is defined as the Aroon hitting 100% on the current candle when the previous candle was below 100%. An Aroon bottom drive is defined as the Aroon hitting 0% on the current candle when the previous candle was above 0%. Consecutive top or bottom drives are counted and exhaustion triggers when these drives hit a setpoint (default is 5 drives = the Aroon exhaustion trigger). When Aroon exhaustion is triggered and the RSI is correspondingly above/below a trigger line, the overall indicator signals exhaustion.
The Aroon drives are visualized at the top and bottom of the indicator. The RSI is plotted as a line that crosses top and bottom trigger lines. There are extreme trigger values for both the bottom and top exhaustion triggers.
This indicator can be used with any asset on any timeframe. It nicely pairs with the Super Strength Indicator (invite-only).
Flying Submarine SincOrange Glowing Flying Submarine at Area 51. For Call Puts. Safety in SpaceForce.

Advanced Swing Breakout + RSI + EMA + Smart Volume SpikeThis indicator is designed to identify high-probability swing trade setups using a confluence of:
Swing High/Low Breakouts
RSI Trend Strength
EMA Directional Bias
Smart Volume Spike Confirmation
It combines key price action levels with volume and momentum filters to generate clean, actionable breakout alerts. It’s perfect for both intraday and swing traders looking to trade breakouts with confirmation from multiple technical layers.
⚙️ How It Works:
✅ Swing Detection:
Plots Swing Highs and Swing Lows based on the past N candles.
Highlights breakouts above highs or breakdowns below lows.
💪 RSI Filter:
Confirms whether the breakout is supported by RSI momentum.
Bullish breakout requires RSI > 50 and price above EMA.
Bearish breakdown requires RSI < 50 and price below EMA.
📈 EMA Trend Bias:
EMA (default 20-period) shows directional bias.
Used as a filter to confirm trade direction.
🔊 Smart Volume Spike:
Detects significant volume spikes above a moving average threshold.
Color-coded bars show whether volume is bullish, bearish, or neutral.
Ensures breakout is not on weak or average volume.
🚨 Alerts Included:
✅ Break Above Swing High: Only triggers when RSI, EMA, and Volume all confirm the move.
⚠️ Break Below Swing Low: Triggered only when bearish conditions are met.
📊 Visual Output:
Swing Highs: 🔴 Red Dots
Swing Lows: 🟢 Green Dots
EMA Line: 🟠 Orange Line
Volume Spike Bars: Appears in separate pane with dynamic color logic.
🧠 Best Use Cases:
Intraday Scalping (5m–15m timeframes)
Swing Trading (1H–4H)
Breakout Confirmation
Volume-Supported Entry Filtering

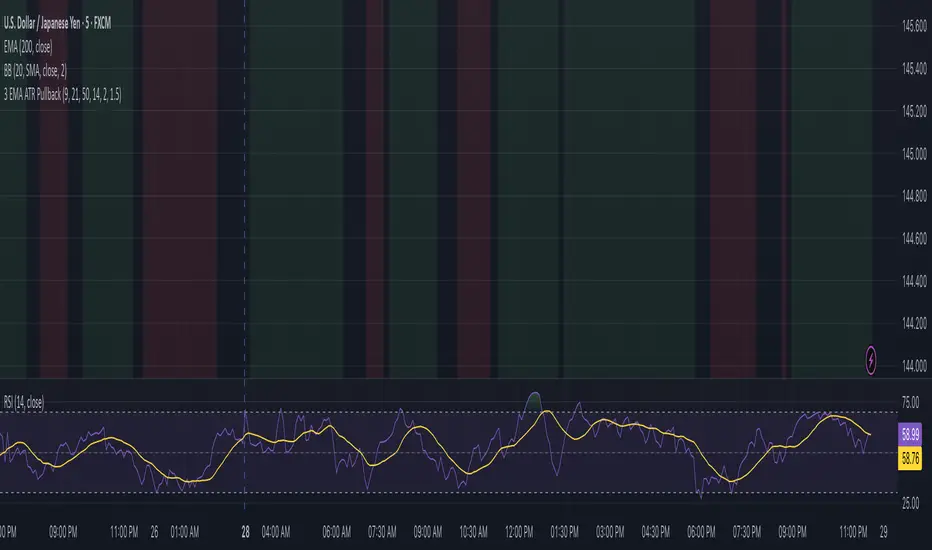
3 EMA Pullback Strategy with ATRThis script will not only plot the moving averages but also identify potential trade setups by highlighting trend conditions, marking entry points, and dynamically plotting the corresponding Stop Loss and Take Profit levels directly on your chart.
Here is the Pine Script code for your strategy.
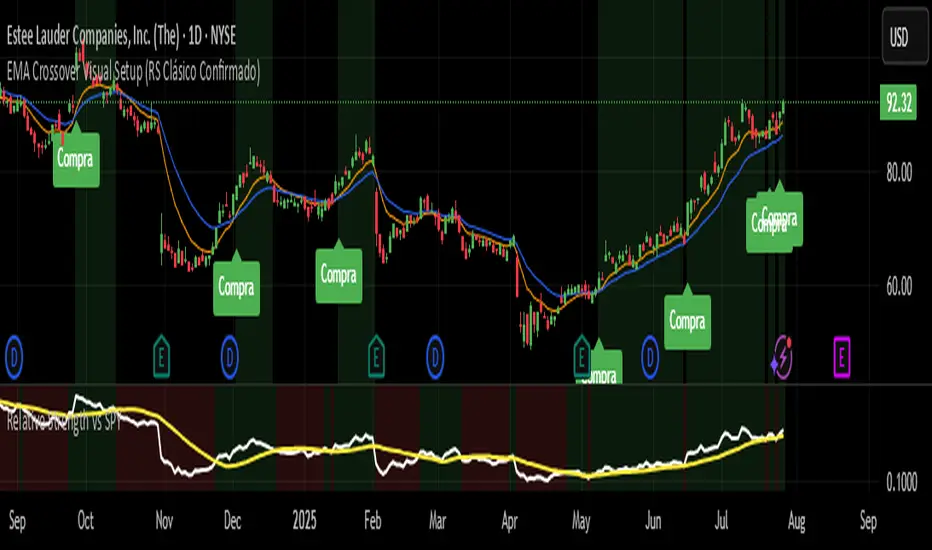
EMA Crossover Visual Setup (RS Clásico Confirmado)Overview
This script is designed to visually highlight classic swing trading setups based on the crossover of exponential moving averages (EMAs), with additional confirmation using Relative Strength (RS) compared to a benchmark asset (e.g., SPY).
The goal is to identify bullish momentum shifts that align both with technical structure (EMA crossover) and relative outperformance, helping traders focus on strong stocks in strong markets.
Logic
A signal is triggered when the following conditions are met:
The fast EMA (e.g., 10) crosses above the slow EMA (e.g., 20).
The closing price is above a third EMA (e.g., 50) to confirm bullish structure.
The asset's Relative Strength (RS) versus a benchmark is confirmed manually, based on an RSI comparison (not calculated inside the script).
The script is meant to be used alongside manual RS confirmation, using a secondary chart or overlay of the RS ratio.
Features
Visual labels and markers for clean charting of valid entry setups
Fully customizable EMA lengths
Optional highlighting of candle patterns near entry
Ideal for use with top-down analysis and watchlist filtering
Suggested Use
Works best on daily and 4H charts for swing trading setups
Combine with volume and price action analysis for higher probability trades
Use manual RS validation: confirm that the RSI of the selected stock is stronger than the RSI of SPY (or any benchmark of your choice)
Notes
This script does not execute trades or include stop loss/take profit logic, as it is intended for discretionary traders who want to visually scan for opportunities.
It also does not calculate RS internally, allowing flexibility in how you define strength (RS line, RSI comparison, or price ratio).
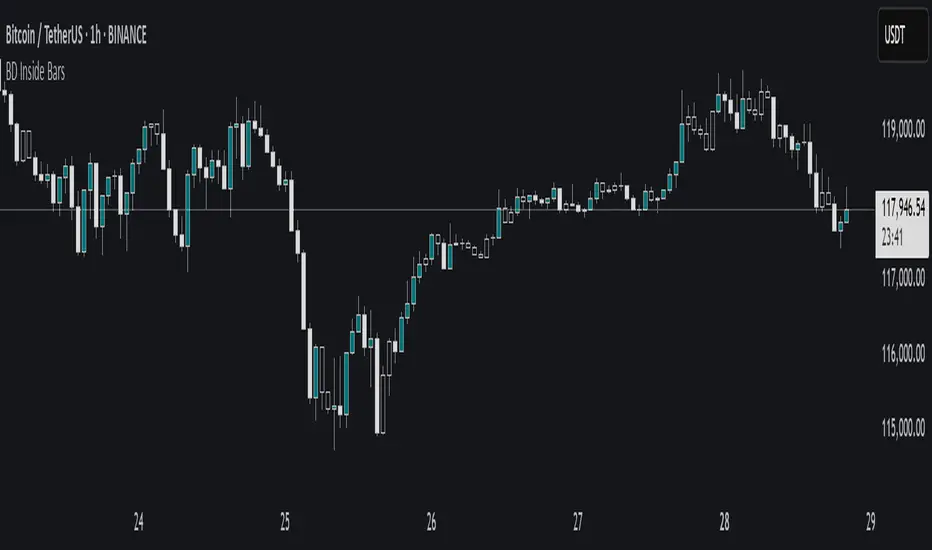
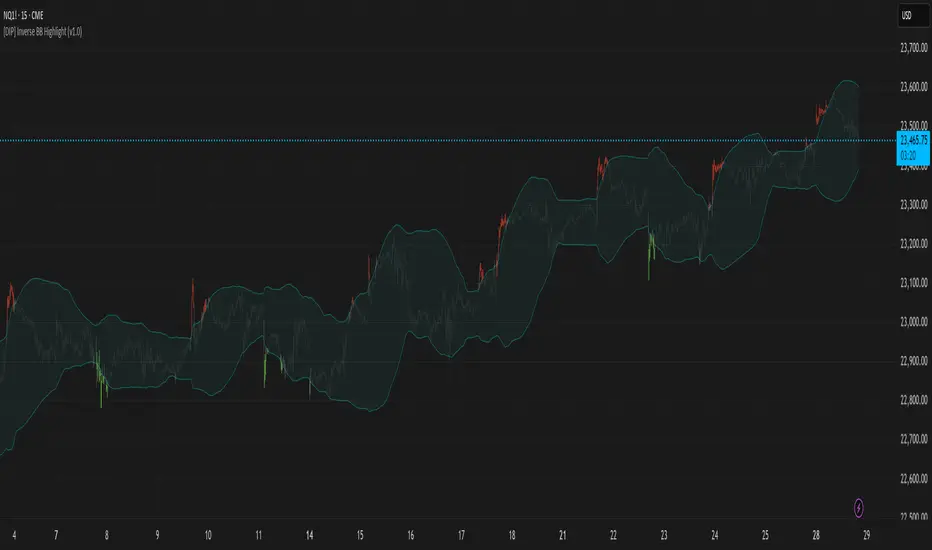
[DIP] Inverse BB HighlightThis indicator allows you to highlight the area outside of the Bollinger Bands in order to draw more attention to it. This is especially useful for those who only trade when we are outside of the bands.
Keep in mind this indicator only works on bars, not on candles.
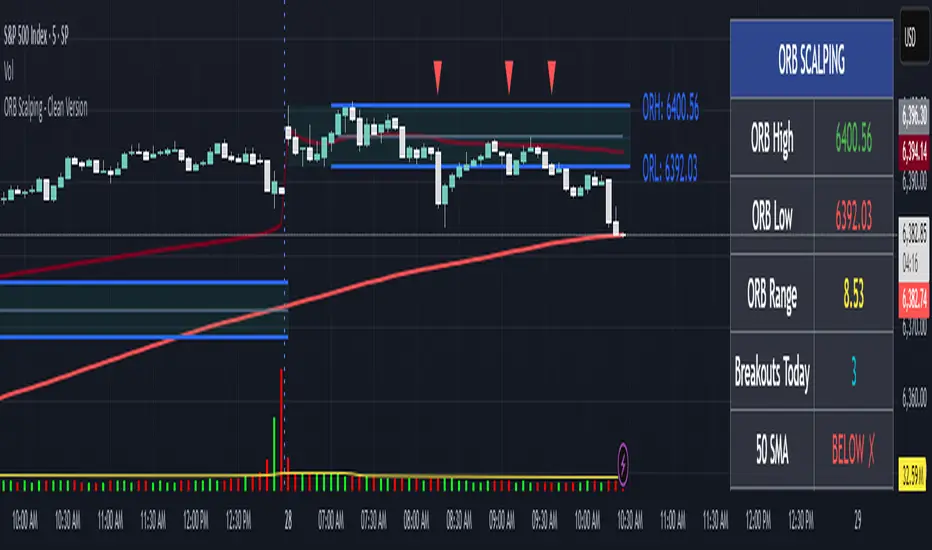
ORB Scalping## Key Features 🎯
Customizable Opening Range: Define the ORB using a specific timeframe (e.g., the first 15, 30, or 60 minutes) or a custom time session (e.g., '09:30-10:00'), making it adaptable to any market (Forex, Crypto, Stocks, Indices).
Clear Visualizations: The opening range is highlighted with a colored box. The high, low, and midline are automatically drawn and extended throughout the trading day, acting as key support and resistance levels.
Real-time Breakout Signals: The script plots a '▲' for a bullish breakout (close crosses above the ORB high) and a '▼' for a bearish breakout (close crosses below the ORB low). The appearance and position of these signals are fully customizable.
ORB Bias Indicator: The ORB box is automatically colored to indicate market sentiment.
Bullish (Green): The current ORB midline is higher than the previous day's midline, suggesting upward momentum.
Bearish (Red): The current ORB midline is lower than the previous day's midline, suggesting downward momentum.
Neutral (Blue): The midline is unchanged or it's the first session on the chart.
Comprehensive Dashboard: An elegant, on-screen table provides all critical information at a glance, including:
ORB High, Low, and Range values.
A count of breakouts for the current day.
The current price's position relative to key moving averages (50, 100, 200 SMA) and VWAP.
The current price and its status relative to the ORB levels.
The daily ORB Bias (Bullish/Bearish).
Built-in Alerts: Never miss a trading opportunity. You can set up alerts that will trigger whenever the price breaks above the ORB high or below the ORB low.
## How to Use 📈
Setup the Opening Range: Go to the indicator settings.
For time-based ORB: Choose the ORB Timeframe (e.g., '30' for the first 30 minutes). Ensure Use ORB Session Time is unchecked.
For session-based ORB: Check Use ORB Session Time and enter your desired ORB Session Time (e.g., 0930-1000). This is ideal for markets with specific opening hours like the NYSE or NSE.
Wait for the Range to Form: The script will draw the ORB box and levels after the defined opening period ends. No trades should be taken while the range is still forming.
Identify a Trading Opportunity:
Long Entry: Look for a bullish breakout signal (▲) when the price closes decisively above the ORB High. For higher probability, check the dashboard for confluence: Is the price also above the VWAP and key SMAs? Is the ORB Bias bullish?
Short Entry: Look for a bearish breakout signal (▼) when the price closes decisively below the ORB Low. For higher probability, check if the price is below the VWAP/SMAs and if the ORB Bias is bearish.
Manage Your Risk:
The ORB levels themselves are excellent reference points for risk management.
For a long trade, a stop-loss could be placed below the breakout candle, at the ORB High line, or at the ORB Midline, depending on your risk tolerance.
For a short trade, a stop-loss could be placed above the breakout candle, at the ORB Low line, or at the ORB Midline.
## Settings Overview
ORB Settings: This is the most important section. Configure your ORB period here. You can also toggle the visibility of the ORB Box, High/Low lines, and the Midline.
Triangle Settings: Customize the size, color, and position of the breakout signals. The 'On ORB Lines' position offers a cleaner, LuxAlgo-inspired visual style.
Visual Settings: Change the colors of the ORB lines and box fills to match your personal chart theme.
Dashboard: Toggle the dashboard on/off, change its position on the screen, and adjust the font size for better readability.
Historical Display: Choose whether to keep previous days' ORB visuals on the chart for historical context or to only display the current day's ORB.
Disclaimer: This indicator is a tool to aid in technical analysis and should not be considered financial advice. Trading involves substantial risk. Always use proper risk management and combine this tool with your own trading strategy and analysis.