Scalping Indicator v6This Script Show You Recent Scalping Trades u can get instantly we have use the knowledge we gain across the time we might be right or wrong do your own research and use this indicator on ur own risk
Indicators and strategies

Support/Resistance MTF Merge ZonesIndicator Introduction
Support/Resistance MTF Merge Zones is an advanced technical analysis tool that automatically identifies and merges key support/resistance zones by analyzing highs and lows from multiple timeframes (15M, 1H, 4H, Daily).
Key Features
Multi-Timeframe Analysis: Integrates data from 15M, 1H, 4H, and Daily charts
Smart Zone Merging: Automatically consolidates levels within a specified percentage range into unified zones
Dynamic Color System: Distinguishes support/resistance zones based on position relative to current price
Strength Indication: Highlights zones where multiple levels converge as strong zones
Usage Guide
Configuration Parameters
Lookback Period (10): Period for calculating highs/lows
Adjustable range: 5-30
Higher values detect more long-term levels
Zone Merge % (0.5): Percentage threshold for zone merging
Range: 0.1-2.0%
Higher values merge levels across wider price ranges
Min Levels for Zone (2): Minimum number of levels required to form a zone
Range: 2-5 levels
Higher values display only more confirmed zones
Box Opacity (7): Transparency level of zone boxes
Range: 0-100%
Color Scheme
Red: Resistance zones above current price
Blue: Support zones below current price
Orange: Strong zones (3+ merged levels)

Twin Tower Levels – Hopi Method (Old)This is the previous version of the Twin Tower script, which is based on the ADR (Average Daily Range) method.
It is not a full implementation of Hopiplaka’s original Twin Tower strategy — the levels are calculated using ADR instead of official CME circuit breaker price limits.
Note:
For the most accurate and official Twin Tower levels on CME indices (NQ, ES, etc.), please use the latest script version with circuit breaker inputs as described by Hopiplaka.
Zone Shift [ChartPrime]⯁ OVERVIEW
Zone Shift is a dynamic trend detection tool that uses EMA/HMA-based bands to determine trend shifts and plot key reaction levels. It highlights trend direction through colored candles and marks important retests with visual cues to help traders stay aligned with momentum.
⯁ KEY FEATURES
Dynamic EMA-HMA Band:
Creates a three-line channel using the average of an EMA and HMA for the midline, and expands it using average candle range to form upper and lower bounds. This band visually adapts to market volatility.
float ema = ta.ema(close, length)
float hma = ta.hma(close, length-40)
float dist = ta.sma(high-low, 200)
float mid = math.avg(ema, hma)
float top = mid + dist
float bot = mid - dist
Trend Detection (Band Cross Logic):
Detects an uptrend when the Low crosses above the top band.
Detects a downtrend when the High crosses below the bottom band.
Bars change color to lime for uptrends and blue for downtrends.
Trend Initiation Level:
At the start of a new trend, the indicator locks in the extreme point (low for uptrend, high for downtrend) and plots a dashed horizontal level, serving as a potential retest zone.
Trend Retest Signal:
If price crosses back over the Trend Initiation level in the direction of the trend, a diamond label (⯁) is plotted at the retest point — confirming that price is revisiting a key shift level.
Visual Band Layout:
Midline: Dashed line shows the average of EMA and HMA.
Top/Bottom: Solid lines showing dynamic thresholds above/below the midline.
These help visualize compression, expansion, and possible breakout zones.
Color-Based Candle Plotting:
Candles are recolored in real time according to the current trend, allowing instant visual alignment with the market’s directional bias.
Noise-Filtered Retests:
To avoid repetitive signals, retests are only marked if they occur more than 5 bars after the previous one — filtering out minor fluctuations.
⯁ USAGE
Use colored candles to align trades with the dominant trend.
Treat dashed trendStart levels as important support/resistance zones.
Watch for ⯁ diamond labels as confirmation of retests for continuation or entry.
Use band boundaries to assess trend strength and volatility expansion.
Combine with your existing setups to validate momentum and zone shifts.
⯁ CONCLUSION
Zone Shift helps traders visually capture trend changes and key reaction points with precision. By combining band breakouts with real-time retest signals and trend-colored candles, this tool simplifies the process of reading market structure shifts and identifying high-confluence entry areas.

ATR%The time period can be customized, which is suitable for finding short-term high-volatility trading pairs, and may be suitable for finding grid trading.

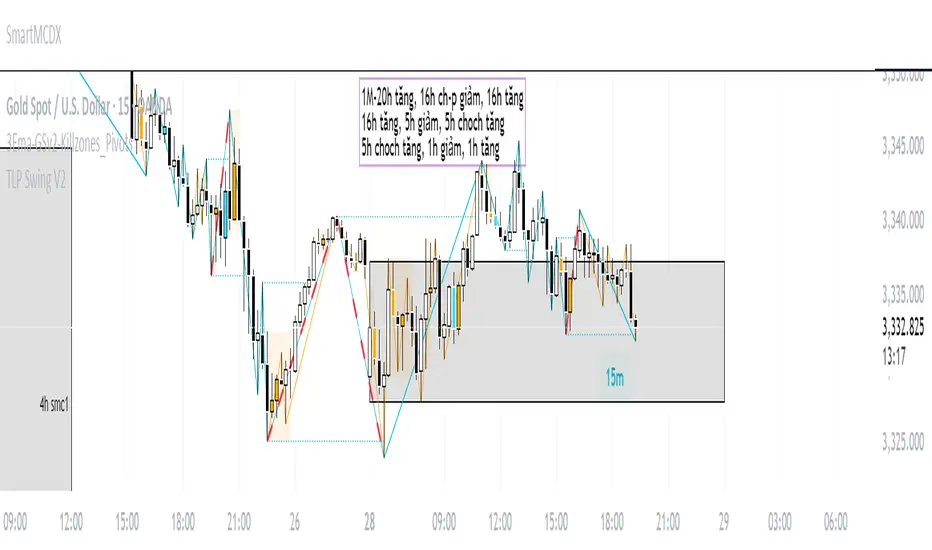
TLP Swing Chart V2thanks
// This source code is subject to the terms of the Mozilla Public License 2.0 at mozilla.org
// Sửa đổi trên code gốc của © meomeo105
// © meomeo105
//@version=5
indicator('TLP Swing Chart V2', shorttitle='TLP Swing V2', overlay=true, max_lines_count=500)
//-----Input-------
customTF = input.timeframe(defval="",title = "Show Other TimeFrame")
showTLP = input.bool(false, 'Show TLP', inline = "TLP1")
colorTLP = input.color(color.aqua, '', inline = "TLP1")
showSTLP = input.bool(true, 'Show TLP Swing', inline = "Swing1")
colorSTLP = input.color(color.aqua, '', inline = "Swing1")
showLabel = input.bool(true, 'Show Label TimeFrame')
lineSTLP = input.string(title="",options= ,defval="(─)", inline = "Swing1")
lineStyleSTLP = lineSTLP == "(┈)" ? line.style_dotted : lineSTLP == "(╌)" ? line.style_dashed : line.style_solid
//IOSB
IOSB = "TLPInOutSideBarSetting"
ISB = input(true,group =IOSB, title="showISB")
colorISB = input.color(color.rgb(250, 171, 0), inline = "ISB")
OSB = input(true,group =IOSB, title="showOSB")
colorOSB = input.color(color.rgb(56, 219, 255), inline = "OSB")
ZoneColor = input(defval = color.new(color.orange, 90),group =IOSB, title = "Background Color")
BorderColor = input(defval = color.new(color.orange, 100),group =IOSB, title = "Border Color")
/////////////////
var aCZ = array.new_float(0)
float highest = high
float lowest = low
if (array.size(aCZ) > 0)
highest := array.get(aCZ, 0)
lowest := array.get(aCZ, 1)
insideBarCondtion = low >= lowest and low <= highest and high >= lowest and high <= highest
if ( insideBarCondtion == true )
array.push(aCZ, high )
array.push(aCZ, low )
if( array.size(aCZ) >= 2 and insideBarCondtion == false )
float maxCZ = array.max(aCZ)
float minCZ = array.min(aCZ)
box.new(bar_index - (array.size(aCZ) / 2) - 1, maxCZ, bar_index - 1, minCZ, bgcolor = ZoneColor, border_color = BorderColor)
array.clear(aCZ)
//////////////////////////Global//////////////////////////
var arrayLineTemp = array.new_line()
// Funtion
f_resInMinutes() =>
_resInMinutes = timeframe.multiplier * (
timeframe.isseconds ? 1. / 60. :
timeframe.isminutes ? 1. :
timeframe.isdaily ? 1440. :
timeframe.isweekly ? 10080. :
timeframe.ismonthly ? 43800. : na)
// Converts a resolution expressed in minutes into a string usable by "security()"
f_resFromMinutes(_minutes) =>
_minutes < 1 ? str.tostring(math.round(_minutes*60)) + "S" :
_minutes < 60 ? str.tostring(math.round(_minutes)) + "m" :
_minutes < 1440 ? str.tostring(math.round(_minutes/60)) + "H" :
_minutes < 10080 ? str.tostring(math.round(math.min(_minutes / 1440, 7))) + "D" :
_minutes < 43800 ? str.tostring(math.round(math.min(_minutes / 10080, 4))) + "W" :
str.tostring(math.round(math.min(_minutes / 43800, 12))) + "M"
f_tfRes(_res,_exp) =>
request.security(syminfo.tickerid,_res,_exp,lookahead=barmerge.lookahead_on)
var label labelError = label.new(bar_index, high, text = "", color = #00000000, textcolor = color.white,textalign = text.align_left)
sendError(_mmessage) =>
label.set_xy(labelError, bar_index + 3, close )
label.set_text(labelError, _mmessage)
var arrayLineChoCh = array.new_line()
var label labelTF = label.new(time, close, text = "",color = color.new(showSTLP ? colorSTLP : colorTLP,95), textcolor = showSTLP ? colorSTLP : colorTLP,xloc = xloc.bar_time, textalign = text.align_left)
//////////////////////////TLP//////////////////////////
var arrayXTLP = array.new_int(5,time)
var arrayYTLP = array.new_float(5,close)
var arrayLineTLP = array.new_line()
int drawLineTLP = 0
_high = high
_low = low
_close = close
_open = open
if(customTF != timeframe.period)
_high := f_tfRes(customTF,high)
_low := f_tfRes(customTF,low)
_close := f_tfRes(customTF,close)
_open := f_tfRes(customTF,open)
highPrev = _high
lowPrev = _low
// drawLineTLP => 2:Tiếp tục 1:Đảo chiều; // Outsidebar 2:Tiếp tục 3:Tiếp tục và Đảo chiều 4 : Đảo chiều 2 lần
drawLineTLP := 0
if(_high > highPrev and _low > lowPrev )
if(array.get(arrayYTLP,0) > array.get(arrayYTLP,1))
if(_high <= high)
array.set(arrayXTLP, 0, time)
array.set(arrayYTLP, 0, _high )
drawLineTLP := 2
else
array.unshift(arrayXTLP,time)
array.unshift(arrayYTLP,_high )
drawLineTLP := 1
else if(_high < highPrev and _low < lowPrev )
if(array.get(arrayYTLP,0) > array.get(arrayYTLP,1))
array.unshift(arrayXTLP,time)
array.unshift(arrayYTLP,_low )
drawLineTLP := 1
else
if(_low >= low)
array.set(arrayXTLP, 0, time)
array.set(arrayYTLP, 0, _low )
drawLineTLP := 2
else if(_high >= highPrev and _low < lowPrev or _high > highPrev and _low <= lowPrev )
if(array.get(arrayYTLP,0) > array.get(arrayYTLP,1))
if(_high >= array.get(arrayYTLP,0) and array.get(arrayYTLP,1) < _low )
if(_high <= high)
array.set(arrayXTLP, 0, time)
array.set(arrayYTLP, 0, _high )
drawLineTLP := 2
else if(_high >= array.get(arrayYTLP,0) and array.get(arrayYTLP,1) > _low )
if(_close < _open)
if(_high <= high)
array.set(arrayXTLP, 0, time)
array.set(arrayYTLP, 0, _high )
array.unshift(arrayXTLP,time)
array.unshift(arrayYTLP,_low )
drawLineTLP := 3
else
array.unshift(arrayXTLP,time)
array.unshift(arrayYTLP,_low )
array.unshift(arrayXTLP,time)
array.unshift(arrayYTLP,_high )
drawLineTLP := 4
else if(array.get(arrayYTLP,0) < array.get(arrayYTLP,1))
if(_low <= array.get(arrayYTLP,0) and _high < array.get(arrayYTLP,1))
if(_low >= low)
array.set(arrayXTLP, 0, time)
array.set(arrayYTLP, 0, _low )
drawLineTLP := 2
else if(_low <= array.get(arrayYTLP,0) and _high > array.get(arrayYTLP,1))
if(_close > _open)
if(_low >= low)
array.set(arrayXTLP, 0, time)
array.set(arrayYTLP, 0, _low )
array.unshift(arrayXTLP,time)
array.unshift(arrayYTLP,_high )
drawLineTLP := 3
else
array.unshift(arrayXTLP,time)
array.unshift(arrayYTLP,_high )
array.unshift(arrayXTLP,time)
array.unshift(arrayYTLP,_low )
drawLineTLP := 4
else if((_high <= highPrev and _low >= lowPrev ))
highPrev := highPrev
lowPrev := lowPrev
if(f_resInMinutes() < f_tfRes(customTF,f_resInMinutes()) and drawLineTLP == 0)
if(array.get(arrayYTLP,0) > array.get(arrayYTLP,1))
if(array.get(arrayYTLP,0) <= high)
array.set(arrayXTLP, 0, time)
drawLineTLP := 2
else
if(array.get(arrayYTLP,0) >= low)
array.set(arrayXTLP, 0, time)
drawLineTLP := 2
if((showSTLP or showTLP) and f_resInMinutes() <= f_tfRes(customTF,f_resInMinutes()))
if(drawLineTLP == 2)
if(array.size(arrayLineTLP) >0)
line.set_xy2(array.get(arrayLineTLP,0),array.get(arrayXTLP,0),array.get(arrayYTLP,0))
else
array.unshift(arrayLineTLP,line.new(array.get(arrayXTLP,1),array.get(arrayYTLP,1),array.get(arrayXTLP,0),array.get(arrayYTLP,0), color = colorTLP,xloc = xloc.bar_time, style = lineStyleSTLP))
else if(drawLineTLP == 1)
array.unshift(arrayLineTLP,line.new(array.get(arrayXTLP,1),array.get(arrayYTLP,1),array.get(arrayXTLP,0),array.get(arrayYTLP,0), color = colorTLP,xloc = xloc.bar_time, style = lineStyleSTLP))
else if(drawLineTLP == 3)
if(array.size(arrayLineTLP) >0)
line.set_xy2(array.get(arrayLineTLP,0),array.get(arrayXTLP,1),array.get(arrayYTLP,1))
else
array.unshift(arrayLineTLP,line.new(array.get(arrayXTLP,2),array.get(arrayYTLP,2),array.get(arrayXTLP,1),array.get(arrayYTLP,1), color = colorTLP,xloc = xloc.bar_time, style = lineStyleSTLP))
array.unshift(arrayLineTLP,line.new(array.get(arrayXTLP,1),array.get(arrayYTLP,1),array.get(arrayXTLP,0),array.get(arrayYTLP,0), color = colorTLP,xloc = xloc.bar_time, style = lineStyleSTLP))
else if(drawLineTLP == 4)
array.unshift(arrayLineTLP,line.new(array.get(arrayXTLP,2),array.get(arrayYTLP,2),array.get(arrayXTLP,1),array.get(arrayYTLP,1), color = colorTLP,xloc = xloc.bar_time, style = lineStyleSTLP))
array.unshift(arrayLineTLP,line.new(array.get(arrayXTLP,1),array.get(arrayYTLP,1),array.get(arrayXTLP,0),array.get(arrayYTLP,0), color = colorTLP,xloc = xloc.bar_time, style = lineStyleSTLP))
//////////////////////////Swing TLP//////////////////////////
var arrayXSTLP = array.new_int(5,time)
var arrayYSTLP = array.new_float(5,close)
var arrayLineSTLP = array.new_line()
int drawLineSTLP = 0
int drawLineSTLP1 = 0
if(showSTLP)
if(math.max(array.get(arrayYSTLP,0),array.get(arrayYSTLP,1)) < math.min(array.get(arrayYTLP,0),array.get(arrayYTLP,1)) or math.min(array.get(arrayYSTLP,0),array.get(arrayYSTLP,1)) > math.max(array.get(arrayYTLP,0),array.get(arrayYTLP,1)))
//Khởi tạo bắt đầu
drawLineSTLP1 := 5
array.set(arrayXSTLP, 0, array.get(arrayXTLP,1))
array.set(arrayYSTLP, 0, array.get(arrayYTLP,1))
array.unshift(arrayXSTLP,array.get(arrayXTLP,0))
array.unshift(arrayYSTLP,array.get(arrayYTLP,0))
// drawLineSTLP kiểm tra điểm 1 => 13:Tiếp tục có sóng hồi // 12|19(reDraw):Tiếp tục không có sóng hồi // 14:Đảo chiều
if(array.get(arrayXTLP,0) == array.get(arrayXTLP,1))
if(array.get(arrayXSTLP,0) >= array.get(arrayXTLP,2) and array.get(arrayYSTLP,0) != array.get(arrayYTLP,1) and ((array.get(arrayYTLP,1) > array.get(arrayYTLP,2) and array.get(arrayYSTLP,0) > array.get(arrayYSTLP,1)) or (array.get(arrayYTLP,1) < array.get(arrayYTLP,2) and array.get(arrayYSTLP,0) < array.get(arrayYSTLP,1))))
drawLineSTLP1 := 12
array.set(arrayXSTLP, 0, array.get(arrayXTLP,1))
array.set(arrayYSTLP, 0, array.get(arrayYTLP,1))
else if(array.get(arrayXSTLP,0) <= array.get(arrayXTLP,2))
if((array.get(arrayYSTLP,0) > array.get(arrayYSTLP,1) and array.get(arrayYTLP,1) < array.get(arrayYSTLP,1)) or (array.get(arrayYSTLP,0) < array.get(arrayYSTLP,1) and array.get(arrayYTLP,1) > array.get(arrayYSTLP,1)))
drawLineSTLP1 := 14
array.unshift(arrayXSTLP,array.get(arrayXTLP,1))
array.unshift(arrayYSTLP,array.get(arrayYTLP,1))
else if((array.get(arrayYSTLP,0) > array.get(arrayYSTLP,1) and array.get(arrayYTLP,1) > array.get(arrayYSTLP,0)) or (array.get(arrayYSTLP,0) < array.get(arrayYSTLP,1) and array.get(arrayYTLP,1) < array.get(arrayYSTLP,0)))
drawLineSTLP1 := 13
_max = math.min(array.get(arrayYSTLP,0),array.get(arrayYSTLP,1))
_min = math.max(array.get(arrayYSTLP,0),array.get(arrayYSTLP,1))
_max_idx = 0
_min_idx = 0
for i = 2 to array.size(arrayXTLP)
if(array.get(arrayXSTLP,0) >= array.get(arrayXTLP,i))
break
if(_min > array.get(arrayYTLP,i))
_min := array.get(arrayYTLP,i)
_min_idx := array.get(arrayXTLP,i)
if(_max < array.get(arrayYTLP,i))
_max := array.get(arrayYTLP,i)
_max_idx := array.get(arrayXTLP,i)
if(array.get(arrayYSTLP,0) > array.get(arrayYSTLP,1))
array.unshift(arrayXSTLP,_min_idx)
array.unshift(arrayYSTLP,_min)
else if(array.get(arrayYSTLP,0) < array.get(arrayYSTLP,1))
array.unshift(arrayXSTLP,_max_idx)
array.unshift(arrayYSTLP,_max)
array.unshift(arrayXSTLP,array.get(arrayXTLP,1))
array.unshift(arrayYSTLP,array.get(arrayYTLP,1))
if(f_resInMinutes() < f_tfRes(customTF,f_resInMinutes()))
if(array.get(arrayYSTLP,0) == array.get(arrayYTLP,1) and array.get(arrayXSTLP,0) != array.get(arrayXTLP,1))
array.set(arrayXSTLP, 0, array.get(arrayXTLP,1))
drawLineSTLP1 := 19
if(f_resInMinutes() <= f_tfRes(customTF,f_resInMinutes()))
if(drawLineSTLP1 == 12 or drawLineSTLP1 == 19)
if(array.size(arrayLineSTLP) >0)
line.set_xy2(array.get(arrayLineSTLP,0),array.get(arrayXSTLP,0),array.get(arrayYSTLP,0))
else
array.unshift(arrayLineSTLP,line.new(array.get(arrayXSTLP,1),array.get(arrayYSTLP,1),array.get(arrayXSTLP,0),array.get(arrayYSTLP,0), color = colorSTLP,xloc = xloc.bar_time))
else if(drawLineSTLP1 == 14)
array.unshift(arrayLineSTLP,line.new(array.get(arrayXSTLP,1),array.get(arrayYSTLP,1),array.get(arrayXSTLP,0),array.get(arrayYSTLP,0), color = colorSTLP,xloc = xloc.bar_time))
else if(drawLineSTLP1 == 13)
array.unshift(arrayLineSTLP,line.new(array.get(arrayXSTLP,2),array.get(arrayYSTLP,2),array.get(arrayXSTLP,1),array.get(arrayYSTLP,1), color = colorSTLP,xloc = xloc.bar_time))
array.unshift(arrayLineSTLP,line.new(array.get(arrayXSTLP,1),array.get(arrayYSTLP,1),array.get(arrayXSTLP,0),array.get(arrayYSTLP,0), color = colorSTLP,xloc = xloc.bar_time))
else if(drawLineSTLP1 == 15)
if(array.size(arrayLineSTLP) >0)
line.set_xy2(array.get(arrayLineSTLP,0),array.get(arrayXSTLP,1),array.get(arrayYSTLP,1))
else
array.unshift(arrayLineSTLP,line.new(array.get(arrayXSTLP,2),array.get(arrayYSTLP,2),array.get(arrayXSTLP,1),array.get(arrayYSTLP,1), color = colorSTLP,xloc = xloc.bar_time))
array.unshift(arrayLineSTLP,line.new(array.get(arrayXSTLP,1),array.get(arrayYSTLP,1),array.get(arrayXSTLP,0),array.get(arrayYSTLP,0), color = colorSTLP,xloc = xloc.bar_time))
// drawLineSTLP kiểm tra điểm 0 => 3:Tiếp tục có sóng hồi // 2|9(reDraw):Tiếp tục không có sóng hồi // 4:Đảo chiều
if(array.get(arrayXSTLP,0) >= array.get(arrayXTLP,1) and array.get(arrayYSTLP,0) != array.get(arrayYTLP,0) and ((array.get(arrayYTLP,0) > array.get(arrayYTLP,1) and array.get(arrayYSTLP,0) > array.get(arrayYSTLP,1)) or (array.get(arrayYTLP,0) < array.get(arrayYTLP,1) and array.get(arrayYSTLP,0) < array.get(arrayYSTLP,1))))
drawLineSTLP := 2
array.set(arrayXSTLP, 0, array.get(arrayXTLP,0))
array.set(arrayYSTLP, 0, array.get(arrayYTLP,0))
else if(array.get(arrayXSTLP,0) <= array.get(arrayXTLP,1))
if((array.get(arrayYSTLP,0) > array.get(arrayYSTLP,1) and array.get(arrayYTLP,0) < array.get(arrayYSTLP,1)) or (array.get(arrayYSTLP,0) < array.get(arrayYSTLP,1) and array.get(arrayYTLP,0) > array.get(arrayYSTLP,1)))
drawLineSTLP := 4
array.unshift(arrayXSTLP,array.get(arrayXTLP,0))
array.unshift(arrayYSTLP,array.get(arrayYTLP,0))
else if((array.get(arrayYSTLP,0) > array.get(arrayYSTLP,1) and array.get(arrayYTLP,0) > array.get(arrayYSTLP,0)) or (array.get(arrayYSTLP,0) < array.get(arrayYSTLP,1) and array.get(arrayYTLP,0) < array.get(arrayYSTLP,0)))
drawLineSTLP := 3
_max = math.min(array.get(arrayYSTLP,0),array.get(arrayYSTLP,1))
_min = math.max(array.get(arrayYSTLP,0),array.get(arrayYSTLP,1))
_max_idx = 0
_min_idx = 0
for i = 1 to array.size(arrayXTLP)
if(array.get(arrayXSTLP,0) >= array.get(arrayXTLP,i))
break
if(_min > array.get(arrayYTLP,i))
_min := array.get(arrayYTLP,i)
_min_idx := array.get(arrayXTLP,i)
if(_max < array.get(arrayYTLP,i))
_max := array.get(arrayYTLP,i)
_max_idx := array.get(arrayXTLP,i)
if(array.get(arrayYSTLP,0) > array.get(arrayYSTLP,1))
array.unshift(arrayXSTLP,_min_idx)
array.unshift(arrayYSTLP,_min)
else if(array.get(arrayYSTLP,0) < array.get(arrayYSTLP,1))
array.unshift(arrayXSTLP,_max_idx)
array.unshift(arrayYSTLP,_max)
array.unshift(arrayXSTLP,array.get(arrayXTLP,0))
array.unshift(arrayYSTLP,array.get(arrayYTLP,0))
if(f_resInMinutes() < f_tfRes(customTF,f_resInMinutes()))
if(array.get(arrayYSTLP,0) == array.get(arrayYTLP,0) and array.get(arrayXSTLP,0) != array.get(arrayXTLP,0))
array.set(arrayXSTLP, 0, array.get(arrayXTLP,0))
drawLineSTLP := 9
if(f_resInMinutes() <= f_tfRes(customTF,f_resInMinutes()))
if(drawLineSTLP == 2 or drawLineSTLP == 9)
if(array.size(arrayLineSTLP) >0)
line.set_xy2(array.get(arrayLineSTLP,0),array.get(arrayXSTLP,0),array.get(arrayYSTLP,0))
else
array.unshift(arrayLineSTLP,line.new(array.get(arrayXSTLP,1),array.get(arrayYSTLP,1),array.get(arrayXSTLP,0),array.get(arrayYSTLP,0), color = colorSTLP,xloc = xloc.bar_time))
else if(drawLineSTLP == 4)
array.unshift(arrayLineSTLP,line.new(array.get(arrayXSTLP,1),array.get(arrayYSTLP,1),array.get(arrayXSTLP,0),array.get(arrayYSTLP,0), color = colorSTLP,xloc = xloc.bar_time))
else if(drawLineSTLP == 3)
array.unshift(arrayLineSTLP,line.new(array.get(arrayXSTLP,2),array.get(arrayYSTLP,2),array.get(arrayXSTLP,1),array.get(arrayYSTLP,1), color = colorSTLP,xloc = xloc.bar_time))
array.unshift(arrayLineSTLP,line.new(array.get(arrayXSTLP,1),array.get(arrayYSTLP,1),array.get(arrayXSTLP,0),array.get(arrayYSTLP,0), color = colorSTLP,xloc = xloc.bar_time))
else if(drawLineSTLP == 5)
if(array.size(arrayLineSTLP) >0)
line.set_xy2(array.get(arrayLineSTLP,0),array.get(arrayXSTLP,1),array.get(arrayYSTLP,1))
else
array.unshift(arrayLineSTLP,line.new(array.get(arrayXSTLP,2),array.get(arrayYSTLP,2),array.get(arrayXSTLP,1),array.get(arrayYSTLP,1), color = colorSTLP,xloc = xloc.bar_time))
array.unshift(arrayLineSTLP,line.new(array.get(arrayXSTLP,1),array.get(arrayYSTLP,1),array.get(arrayXSTLP,0),array.get(arrayYSTLP,0), color = colorSTLP,xloc = xloc.bar_time))
///////////////////////Other//////////////////////////////////
if(f_resInMinutes() <= f_tfRes(customTF,f_resInMinutes()))
if(showSTLP)
if(showLabel and (barstate.islast or barstate.islastconfirmedhistory))
texLabel = f_resInMinutes() == f_tfRes(customTF,f_resInMinutes()) ? f_resFromMinutes(f_resInMinutes()) : f_resFromMinutes(f_tfRes(customTF,f_resInMinutes()))
label.set_xy(labelTF,array.get(arrayXSTLP,0),array.get(arrayYSTLP,0))
label.set_text(labelTF,texLabel)
label.set_style(labelTF,array.get(arrayYSTLP,0) < array.get(arrayYSTLP,1) ? label.style_label_upper_right : label.style_label_lower_right)
if(not showTLP)
arrayLineTemp := array.copy(arrayLineTLP)
for itemArray in arrayLineTemp
if(line.get_x1(itemArray) < array.get(arrayXSTLP,0))
line.delete(itemArray)
array.remove(arrayLineTLP,array.indexof(arrayLineTLP, itemArray))
//Inside Bars - Outside Bars
insideBar() => ISB and high <= high and low >= low ? 1 : 0
outsideBar() => OSB and (high > high and low < low ) ? 1 : 0
//Inside and Outside Bars
barcolor(insideBar() ? color.new(colorISB,0) : na )
barcolor(outsideBar() ? color.new(colorOSB,0) : na )
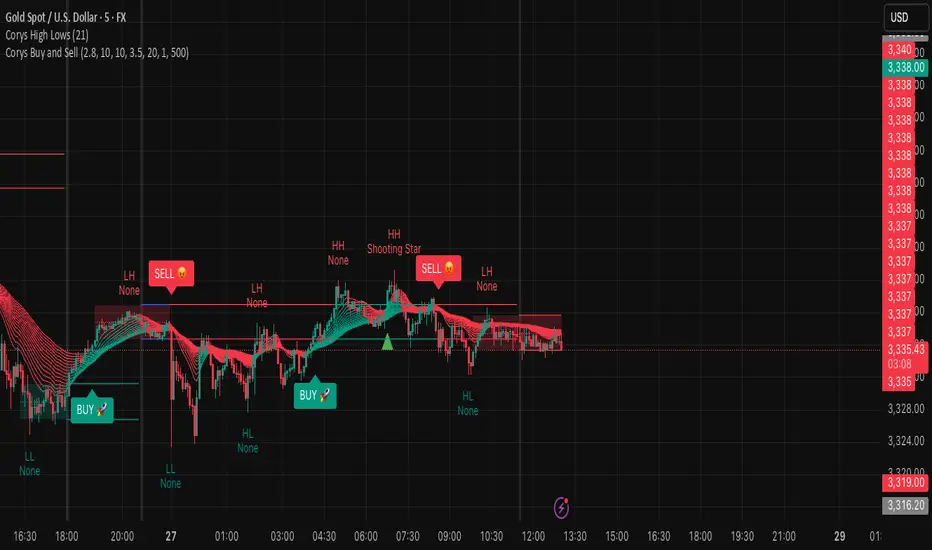
Corys Buy and SellThe Cory’s Buy and Sell indicator is an advanced, all-in-one trading toolkit that combines dynamic trend detection, volatility breakout alerts, and visual EMA strength to help traders confidently identify high-probability buy and sell opportunities.
🔍 Key Features:
Adaptive Supertrend Engine
Powered by a modified Keltner Channel, this trend-following algorithm generates timely BUY 🚀 and SELL 😡 signals based on market momentum and volatility, with adjustable sensitivity and factor settings for full control.
EMA Energy Bands (Optional)
A cascade of 15 EMAs (from 9 to 51 periods) visually maps market energy. Colours shift from green (bullish) to red (bearish), showing short- to medium-term trend strength at a glance.
Trend Catcher Overlay
Highlights major shifts in trend using a fast/slow EMA crossover (10 vs 20 EMA). Bars are coloured to reflect bullish reversals for added confidence.
Pullback Signal Detection
Identifies bullish pullback opportunities when price reclaims key EMA levels after a crossover, marked with a green triangle for entry timing.
Built-in Range Detection System
Automatically highlights price consolidation zones using ATR-based logic. When price breaks above or below the detected range, the zone changes colour (green for breakout up, red for breakdown), helping traders spot breakout opportunities.
Smart Labels & Alerts
Instant BUY/SELL labels on the chart and built-in alert conditions make this indicator suitable for both discretionary and automated trading strategies.
⚙️ Customisable Inputs:
Sensitivity (for trend signals)
EMA Energy toggle
Keltner & ATR Lengths
Range Detection parameters and styling
Best For: Trend traders, breakout traders, and swing traders looking for a clean, powerful overlay that combines momentum, structure, and volatility in one tool.
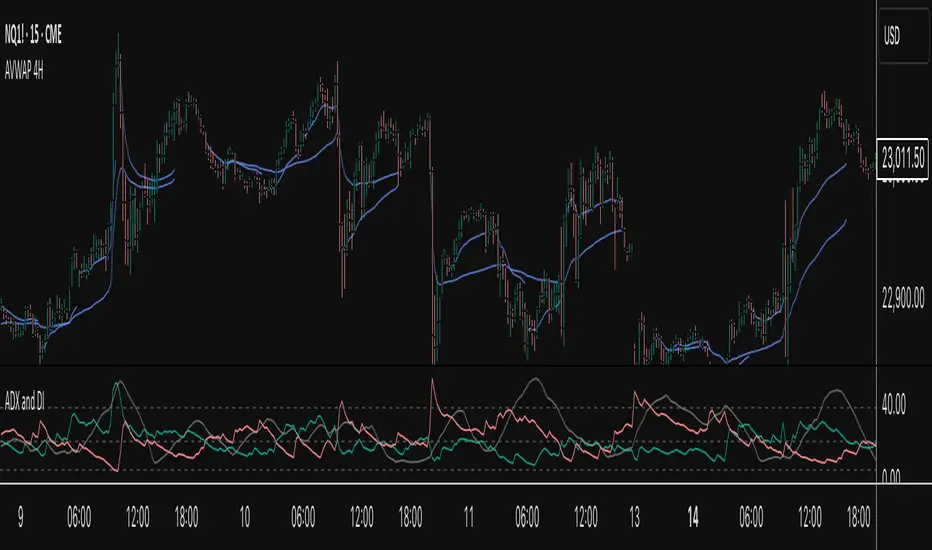
AVWAP 4HThe AVWAP 4H indicator is a multi-session Anchored Volume-Weighted Average Price (AVWAP) tool designed for intraday precision and institutional-grade insight. It plots session-specific AVWAP lines based on a series of key UTC-based time anchors, allowing traders to monitor value zones and dynamic support/resistance across global trading hours.
This script calculates and displays AVWAP lines anchored from five distinct UTC times:
8:00 PM (ETH Open)
10:00 PM
2:00 AM
6:00 AM
10:00 AM
Each line is calculated using ohlc4 as the price source and resets at its respective session start time. Traders can enable or disable any AVWAP anchor individually, as well as customize line color and width for better visual distinction.
The indicator is ideal for identifying volume-weighted equilibrium levels across overlapping global market sessions, particularly useful for short-term mean-reversion, breakout, and institutional order flow strategies.
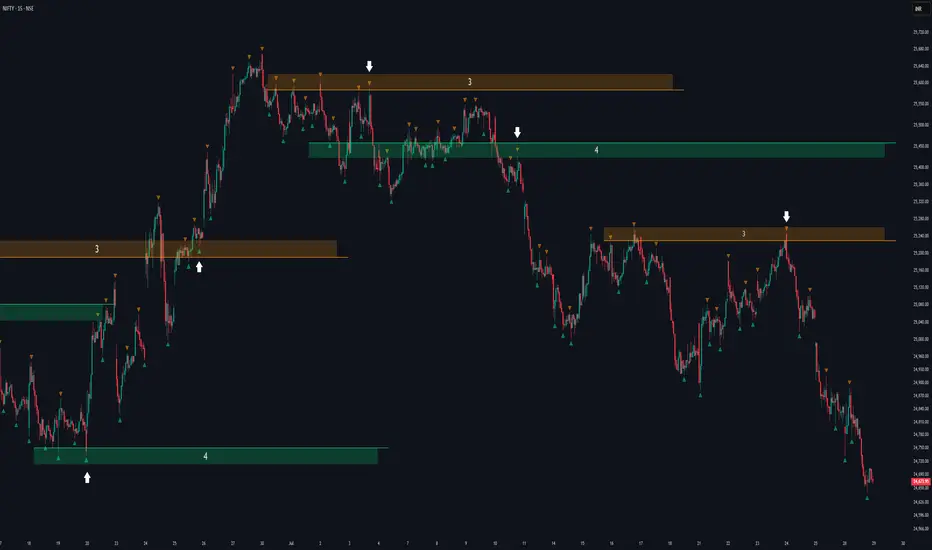
Fractal Support and Resistance [BigBeluga]🔵 OVERVIEW
The Fractal Support and Resistance indicator automatically identifies high-probability support and resistance zones based on repeated fractal touches. When a defined number of fractal highs or lows cluster around the same price zone, the indicator plots a clean horizontal level and shaded zone, helping traders visualize structurally important areas where price may react.
🔵 CONCEPTS
Fractal Points: Swing highs and lows based on user-defined left and right range (length). A valid fractal forms only when the center candle is higher or lower than its neighbors.
Zone Validation: A level is only confirmed when the price has printed the specified number of fractals (e.g., 3) within a narrow ATR-defined range.
Dynamic Zone Calculation: The plotted level can be based on the average of clustered fractals or on the extreme value (min or max), depending on the user’s choice.
Support/Resistance Zones: Once a zone is validated, a horizontal line and shaded box are drawn and automatically extended into the future until new valid clusters form.
Auto-Clean & Reactivity: Each zone persists until replaced by a new fractal cluster, ensuring the chart remains uncluttered and adaptive.
🔵 FEATURES
Detects swing fractals using adjustable left/right range.
Confirms zones when a defined number of fractals occur near the same price.
Plots horizontal level and shaded box for visual clarity.
Choice between average or min/max logic for level calculation.
Distinct color inputs for support (green) and resistance (orange) zones.
Adaptive auto-extension keeps valid zones projected into the future.
Displays optional triangle markers above/below bars where fractals form.
Clean design optimized for structural S/R analysis.
🔵 HOW TO USE
Use support zones (from low fractals) to look for potential long entries or bounce points .
Use resistance zones (from high fractals) to look for short setups or rejections .
Adjust the Fractals Qty to make zones more or less strict—e.g., 3 for higher reliability, 2 for quicker responsiveness.
Combine with liquidity indicators or break/retest logic to validate zone strength.
Toggle between average and min/max mode to fit your style (average for balance, extremes for aggression).
🔵 CONCLUSION
Fractal Support and Resistance offers a robust way to identify hidden levels that the market respects repeatedly. By requiring multiple fractal confirmations within a zone, it filters out noise and highlights clean structural areas of interest. This tool is ideal for traders who want automatic, adaptive, and reliable S/R levels grounded in raw market structure.
Ultra Algo//@version=5
indicator("ترند + دعم", overlay=true)
length = input.int(20, title="عدد الشموع للتحليل")
lookback = input.int(50, title="عدد الشموع للترند")
// حساب أعلى وأدنى سعر لخط الدعم
lowestLow = ta.lowest(low, length)
// إيجاد قاعين (لرسم ترند صاعد) أو قمتين (لرسم ترند هابط)
var float trendLineStart = na
var float trendLineEnd = na
var int trendStartBar = na
var int trendEndBar = na
// ترند صاعد: نبحث عن قاعين
for i = 1 to lookback
if low < low and low < low
if na(trendLineStart)
trendLineStart := low
trendStartBar := bar_index
else
trendLineEnd := low
trendEndBar := bar_index
break
// ترند هابط: نبحث عن قمتين
var float downTrendStart = na
var float downTrendEnd = na
var int downStartBar = na
var int downEndBar = na
for i = 1 to lookback
if high > high and high > high
if na(downTrendStart)
downTrendStart := high
downStartBar := bar_index
else
downTrendEnd := high
downEndBar := bar_index
break
// رسم خط الترند الصاعد
if not na(trendLineStart) and not na(trendLineEnd)
line.new(x1=trendStartBar, y1=trendLineStart, x2=trendEndBar, y2=trendLineEnd, color=color.green, width=2, extend=extend.right)
// رسم خط الترند الهابط
if not na(downTrendStart) and not na(downTrendEnd)
line.new(x1=downStartBar, y1=downTrendStart, x2=downEndBar, y2=downTrendEnd, color=color.red, width=2, extend=extend.right)
// دعم
plot(lowestLow, title="خط الدعم", color=color.blue, linewidth=2)

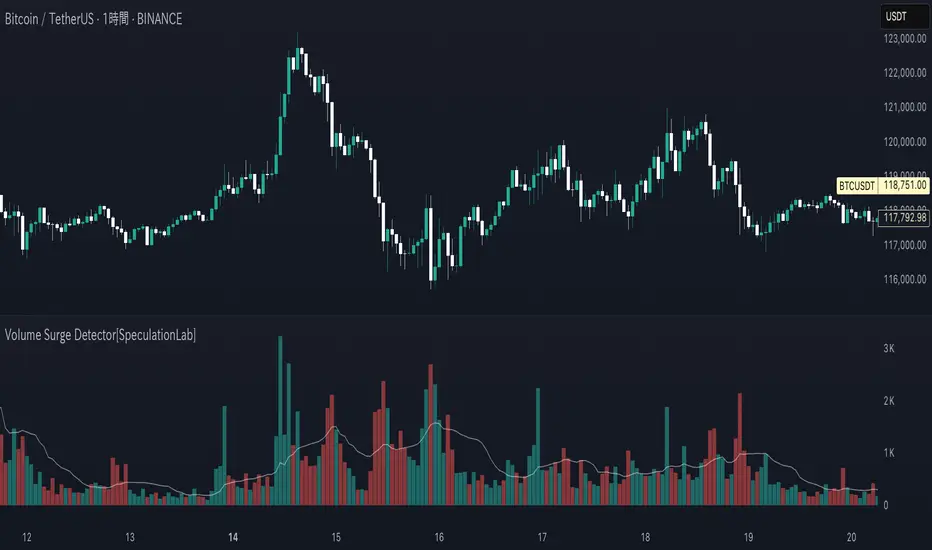
Volume Surge Detector[SpeculationLab]Volume Surge Detector
This tool is especially useful for spotting early signs of breakouts, news-driven spikes, or institutional activity that are often preceded by abnormal surges in volume.
For better chart readability, the volume bar colors are based on TradingView’s original Volume indicator, while all other code is fully original by Speculation Lab.
You can customize both the SMA line and the volume bar colors to fit your style.
The logic compares the current volume against its SMA (default length: 14, fully adjustable).
The script comes with two surge levels:
Surge Level 1 (default = 5) → When volume is more than 5× the SMA, the bar turns aqua.
Surge Level 2 (default = 10) → When volume is more than 10× the SMA, the bar turns yellow.
It also includes built-in alerts, so you’ll be notified instantly whenever a surge is detected.
This makes it easier to spot potential breakout moves or large market participation in real time.
Disclaimer: This script is for educational purposes only. It does not provide financial advice.
这是一个用于探测 成交量爆发 的指标。
为了图表美观,成交量柱的颜色借鉴了 TradingView 原始 Volume 指标,其余代码均为 Speculation Lab 原创。
用户可以自由调整成交量柱和其对应的 SMA 均线的颜色。
指标通过对比成交量和其 SMA(默认长度为14,可自定义长度和颜色)的比例来检测放量。
默认设置了两个放量级别:
Surge Level 1(默认=5):当成交量超过均量的 5 倍时,量柱变为水蓝色。
Surge Level 2(默认=10):当成交量超过均量的 10 倍时,量柱变为黄色。
脚本还设置了 内置警报功能,方便交易者在出现放量时实时收到通知。
Trading Panel with EMA Crossovers## Trading Panel with EMA Crossovers - Description
**What it does:**
This indicator creates a comprehensive trading dashboard that monitors 6 key technical indicators and displays them in an easy-to-read table at the bottom right of your chart. It analyzes market conditions in real-time and provides clear buy/sell signals based on multiple confirmation factors.
**Key Features:**
1. **EMA Crossover Tracking (7/21 & 50/200)**
- Shows whether fast EMAs are above (CROSSOVER/BULL) or below (CROSSUNDER/BEAR) slow EMAs
- Helps identify trend direction and potential entry/exit points
- The 7/21 catches short-term momentum shifts
- The 50/200 confirms longer-term trend strength
2. **Momentum Indicators**
- **RSI**: Identifies overbought (>70) and oversold (<30) conditions
- **MFI**: Similar to RSI but includes volume, making it more reliable
- **MACD**: Confirms trend direction and momentum shifts
3. **Volume Analysis**
- **OBV (On Balance Volume)**: Shows whether smart money is accumulating or distributing
- Helps confirm if price moves are supported by volume
4. **Overall Signal System**
- Counts bullish vs bearish signals from all indicators
- Provides clear BUY/SELL/STRONG BUY/STRONG SELL recommendations
- When both EMAs align (both bull or both bear), it triggers the strongest signals
**Why it's helpful:**
1. **All-in-One View**: Instead of cluttering your chart with multiple indicators, everything is condensed into one clean table
2. **Multiple Confirmation**: Combines trend (EMAs), momentum (RSI/MFI/MACD), and volume (OBV) for more reliable signals
3. **Visual Clarity**: Color-coded signals (green for bullish, red for bearish) make it easy to assess market conditions at a glance
4. **Reduces False Signals**: By requiring multiple indicators to align, it filters out weak trades
5. **Time-Saving**: No need to check multiple indicators manually - the "OVERALL" row gives you an instant market assessment
**Best Use Cases:**
- Trend following: Enter when overall signal shows BUY/STRONG BUY in an uptrend
- Reversal spotting: Watch for divergences between price and indicators
- Risk management: Avoid trades when signals are mixed or neutral
- Confirmation tool: Use alongside your existing strategy for extra confidence
This indicator is particularly effective for swing traders and position traders who want a quick, comprehensive view of market conditions before making trading decisions.

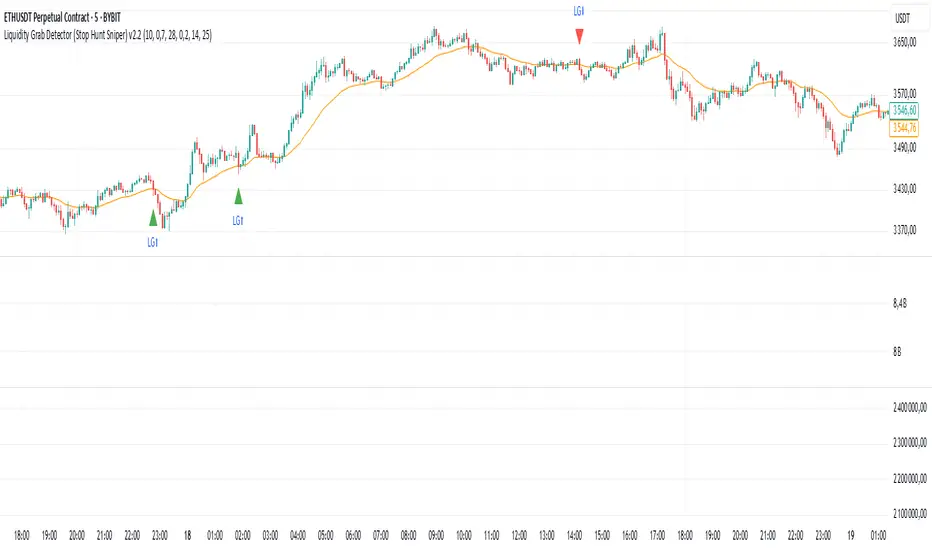
Liquidity Grab Detector (Stop Hunt Sniper) v2.2📌 Purpose
This indicator detects Stop Hunts (Liquidity Grabs) — false breakouts above/below recent highs or lows — filtered by trend direction, volatility, and volume conditions.
It is designed for scalpers and intraday traders who want to identify high-probability reversal zones.
🧠 How It Works
1. Key Logic
Detects previous swing high / swing low over the Lookback Bars.
Marks a false breakout when price moves beyond the level and closes back inside.
Requires a volume spike on the breakout to confirm liquidity sweep.
2. Trend Filter (EMA 50)
Bullish signals only if price is above EMA 50.
Bearish signals only if price is below EMA 50.
This removes most counter-trend stop hunts.
3. ADX Filter
Signals appear only when ADX < Max ADX (low-trend conditions).
This avoids false signals in strong trending markets.
📈 How to Use
Green Arrows: Bullish stop hunt (potential long entry).
Red Arrows: Bearish stop hunt (potential short entry).
Works best in range conditions, liquidity zones, or near session highs/lows.
Combine with order flow, volume profile, or price action for extra confirmation.
Recommended Timeframes: 1m–15m for scalping; 30m–1h for intraday.
Markets: Crypto, Forex, Indices.
⚙️ Inputs
Lookback Bars — swing detection
Volume Spike Multiplier
EMA Length (trend filter)
Min Retrace — how much price must return inside range
Max ADX — trend filter sensitivity
⚠️ Disclaimer
This script is for educational purposes only and does not constitute financial advice.
Always test thoroughly before live trading.
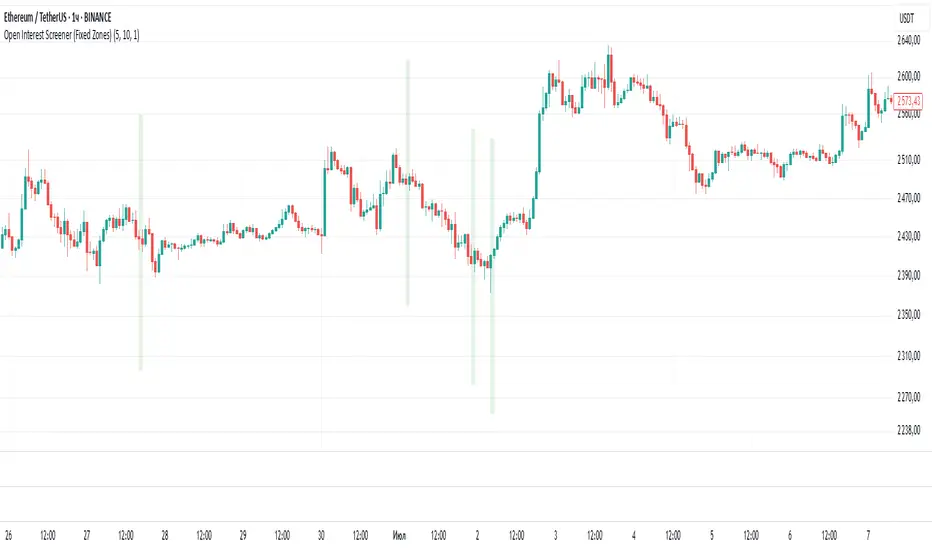
Open Interest Screener (Fixed Zones)📌 Purpose
This indicator scans Open Interest (OI) changes across selected exchanges and highlights significant spikes or drops directly on the chart using dynamic shaded zones.
It is designed to help traders detect unusual market positioning changes that may precede volatility events.
🧠 How It Works
1. Data Sources
Supports multiple exchanges: BitMEX USD, BitMEX USDT, Kraken USD (toggle on/off in settings).
Automatically adapts symbol prefix based on the chart’s base asset.
2. Spike / Drop Detection
OI % Change is calculated over a configurable lookback (Bars to look back).
Spike Up: OI increases by more than Threshold %.
Spike Down: OI decreases by more than Threshold %.
3. Dynamic Zones
When a spike occurs, a green zone (increase) or red zone (decrease) is drawn on the chart.
Zone height is dynamic, based on price high/low ± 5%, preventing chart distortion.
Minimum spacing (Zone Spacing) prevents clustering.
📈 How to Use
Green Zones: Large OI increase can signal fresh positioning (possible breakout setups).
Red Zones: Large OI decrease can signal liquidation events or position unwinds.
Combine with price action, funding rates, or volatility measures for higher confidence.
Recommended Timeframes: Works best on 15m, 1h, 4h.
Markets: Crypto derivatives (OI data available).
⚙️ Inputs
Bars to Look Back
OI % Change Threshold
Zone Width
Exchange toggles (BitMEX USD/USDT, Kraken USD)
⚠️ Disclaimer
This script is for educational purposes only and does not constitute financial advice.
Always test thoroughly before live trading.
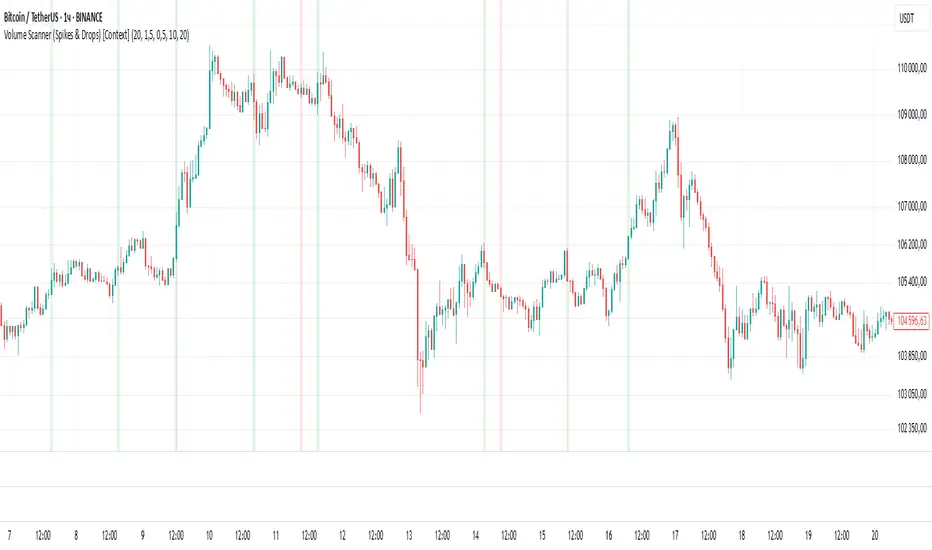
Volume Scanner (Spikes & Drops) [Context]📌 Purpose
This indicator detects significant volume spikes or drops and optionally filters them by price context (local highs/lows).
It helps identify potential breakout or exhaustion points with improved signal quality compared to raw volume alerts.
🧠 How It Works
1. Volume Spike / Drop Detection
SMA Volume over N bars is calculated as baseline.
Volume Spike: Volume > SMA × Spike Multiplier (default 1.5×).
Volume Drop: Volume < SMA × Drop Multiplier (default 0.5×).
2. Context Filter (optional)
When Use Context = ON:
Bullish Context: Volume spike at/near local price high (last Lookback bars).
Bearish Context: Volume drop at/near local price low (last Lookback bars).
3. Signal Gap
Minimum spacing between signals (Min Gap Bars) prevents excessive clustering.
4. Visuals
Background shading:
Green = Volume Spike in bullish context.
Red = Volume Drop in bearish context.
Alerts can be configured for both conditions.
📈 How to Use
Volume Spikes near highs can indicate breakouts or exhaustion tops.
Volume Drops near lows can signal liquidity dry-up or potential reversals.
Combine with price action or support/resistance for confirmation.
Recommended Timeframes: Works on all timeframes; more reliable on 15m, 1h, 4h.
Markets: Crypto, Forex, Stocks.
⚙️ Inputs
Volume SMA Length
Spike Multiplier / Drop Multiplier
Use Context (High/Low filter)
Min Gap Bars (avoid clustered signals)
⚠️ Disclaimer
This script is for educational purposes only. It does not constitute financial advice.
Always test thoroughly before live trading.
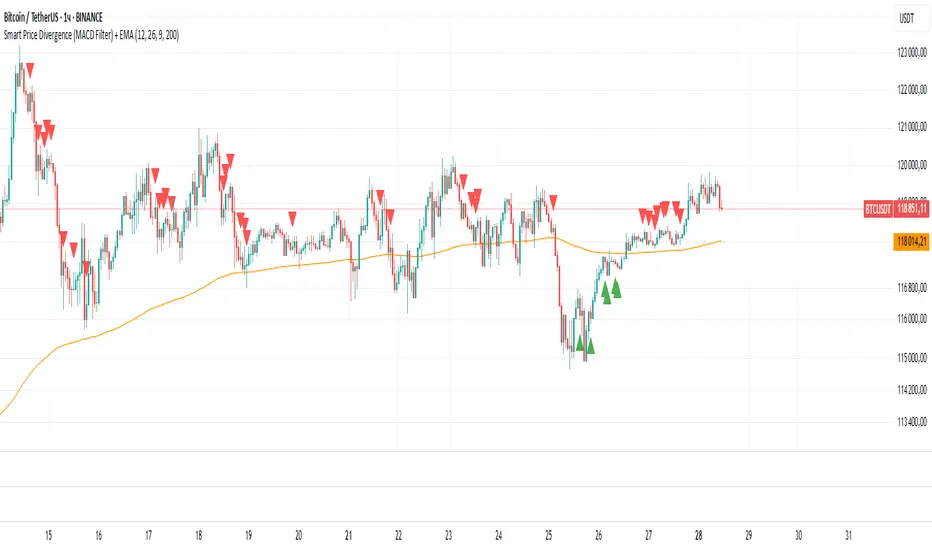
Smart Price Divergence (MACD Filter) + EMA📌 Purpose
This indicator detects Price Divergences with MACD filtered by a 200 EMA trend condition.
It helps identify high-probability reversal zones aligned with market trend context.
🧠 How It Works
1. MACD Divergence Logic
Bearish Divergence:
Price makes a higher high.
MACD makes a lower high.
Price is above EMA (indicating possible exhaustion in bullish trend).
Bullish Divergence:
Price makes a lower low.
MACD makes a higher low.
Price is below EMA (indicating possible exhaustion in bearish trend).
2. EMA Trend Filter
EMA(200) is used as a directional filter:
Bearish divergences considered above EMA (extended bullish conditions).
Bullish divergences considered below EMA (extended bearish conditions).
3. Visual & Alerts
EMA(200) plotted on chart in orange.
Red triangles for Bearish Divergence.
Green triangles for Bullish Divergence.
Alerts fire for both divergence types.
📈 How to Use
Look for divergence signals as potential reversal alerts.
Combine with support/resistance or price action for confirmation.
EMA ensures signals occur in extended zones, increasing reliability.
Recommended Timeframes: 1h, 4h, D.
Markets: Forex, Crypto, Stocks.
⚙️ Inputs
MACD Fast / Slow / Signal Length
EMA Length (default 200)
⚠️ Disclaimer
This script is for educational purposes only. It does not constitute financial advice.
Always test thoroughly before live trading.
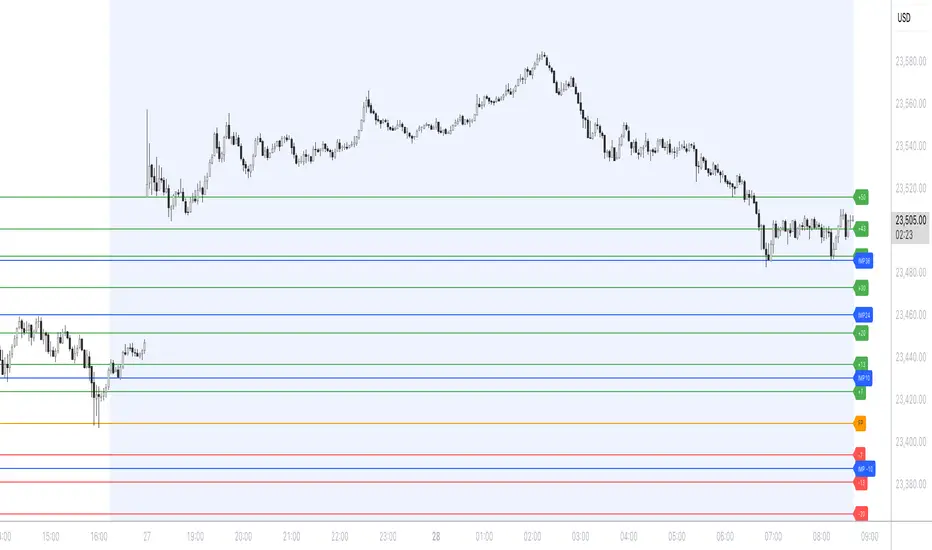
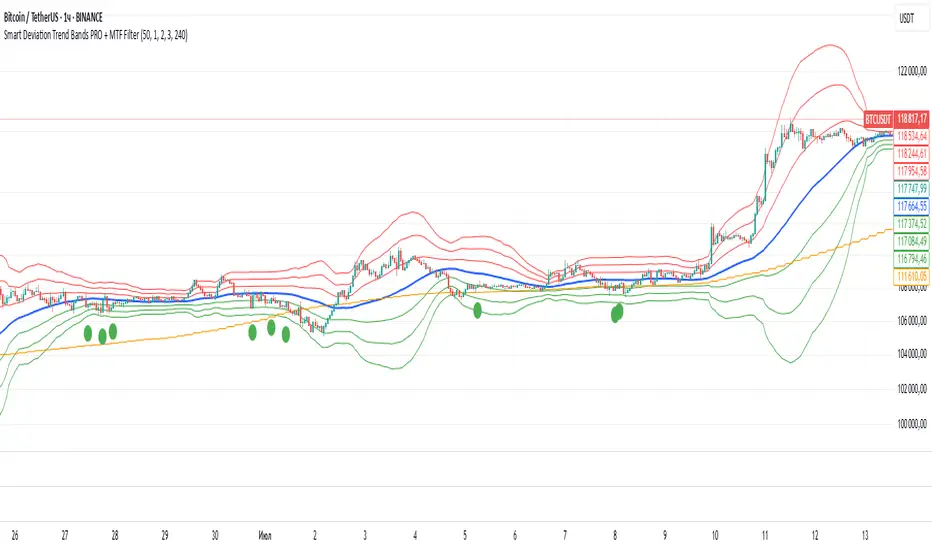
Smart Deviation Trend Bands PRO + MTF Filter📌 Purpose
This indicator combines multi-level Deviation Bands (±1, ±2, ±3 standard deviations from SMA) with a Higher Timeframe (HTF) Trend Filter.
It helps traders identify potential bounce and breakout setups aligned with the dominant market trend.
🧠 How It Works
1. Deviation Bands
SMA(Length) is calculated as the centerline.
Standard deviations (±1, ±2, ±3) define multiple dynamic support and resistance zones.
Outer bands (±3) often mark overextended zones; inner bands (±1, ±2) show active trading areas.
2. HTF Trend Filter
A higher timeframe SMA (HTF SMA) acts as a trend confirmation tool.
Default filter timeframe: 1 Day.
Trend Up: Price > HTF SMA
Trend Down: Price < HTF SMA
3. Entry Signals
Long Signal: Price crosses above lower deviation band (+1) when HTF trend is UP.
Short Signal: Price crosses below upper deviation band (−1) when HTF trend is DOWN.
4. Visuals & Alerts
Bands plotted in red (upper) and green (lower).
Centerline = SMA in blue.
HTF SMA in orange.
Circles on chart mark entry points; alerts trigger automatically.
📈 How to Use
In trending markets: Trade with the HTF direction, using band touches for entries.
In mean-reversion setups: Outer bands can be used to spot potential overbought/oversold zones.
Combine with volume or price action for confirmation.
Recommended Timeframes: 1h, 4h, D.
Markets: Forex, Crypto, Stocks.
⚙️ Inputs
SMA Length
StdDev Multiplier 1 / 2 / 3
HTF Timeframe (default: D1)
⚠️ Disclaimer
This script is for educational purposes only. It does not constitute financial advice.
Always test thoroughly before live trading.
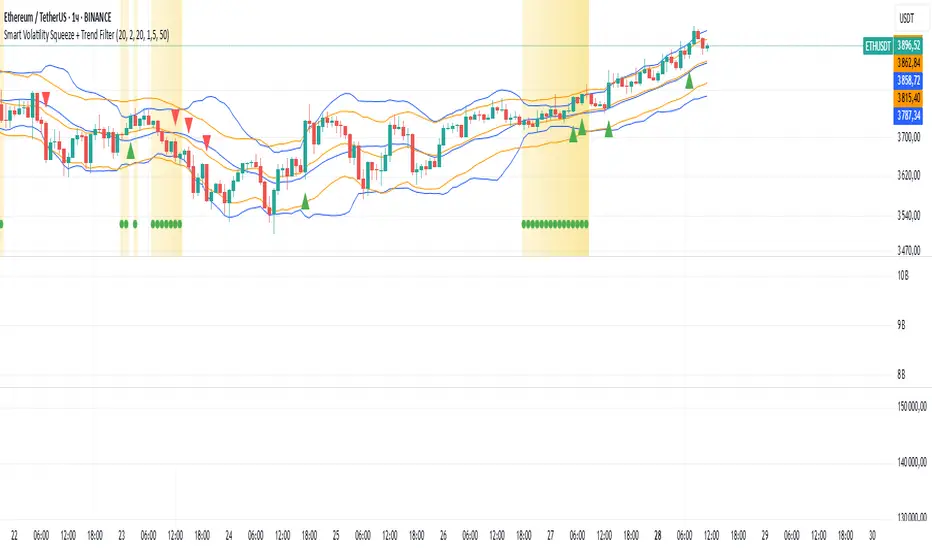
Smart Volatility Squeeze + Trend Filter📌 Purpose
This indicator detects volatility squeeze conditions when Bollinger Bands contract inside Keltner Channels and signals potential breakout opportunities.
It also includes an optional EMA-based trend filter to align signals with the dominant market direction.
🧠 How It Works
1. Squeeze Condition
Bollinger Bands (BB): Length = 20, StdDev = 2.0 (default)
Keltner Channels (KC): EMA Length = 20, ATR Multiplier = 1.5 (default)
Squeeze ON: Occurs when BB Upper < KC Upper and BB Lower > KC Lower (low volatility zone).
2. Breakout Signals
Long Breakout: Price crosses above BB Upper after squeeze.
Short Breakout: Price crosses below BB Lower after squeeze.
3. Trend Filter (optional)
EMA(50) used to confirm breakout direction:
Long signals allowed only if price > EMA(50)
Short signals allowed only if price < EMA(50)
Toggle Use Trend Filter to enable/disable.
4. Visual & Alerts
Green circle at chart bottom indicates Squeeze ON.
Green/Red triangles mark breakouts.
Background gradually brightens during squeeze buildup.
Alerts available for long and short breakouts.
📈 How to Use
Look for Squeeze ON → then wait for breakout arrows.
Trade in breakout direction, preferably with trend filter ON.
Works best on higher timeframes (1h, 4h, D) and trending markets.
Markets: Crypto, Forex, Stocks — effective in volatile assets.
⚙️ Inputs
BB Length / StdDev
KC EMA Length / ATR Multiplier
Use Trend Filter
Trend EMA Length
⚠️ Disclaimer
This script is for educational purposes only. It does not constitute financial advice.
Always test thoroughly before live trading.
Smart RSI Divergence PRO | Auto Lines + Alerts📌 Purpose
This indicator automatically detects Regular and Hidden RSI Divergences between price action and the RSI oscillator.
It plots divergence lines directly on the chart, labels signals, and includes alerts for automated monitoring.
🧠 How It Works
1. RSI Calculation
RSI is calculated using the selected Source (default: Close) and RSI Length (default: 14).
2. Divergence Detection via Fractals
Swing points on both price and RSI are detected using fractal logic (5-bar patterns).
Regular Divergence:
Bearish: Price forms a higher high, RSI forms a lower high.
Bullish: Price forms a lower low, RSI forms a higher low.
Hidden Divergence:
Bearish: Price forms a lower high, RSI forms a higher high.
Bullish: Price forms a higher low, RSI forms a lower low.
3. Auto Drawing Lines
Lines are drawn automatically between divergence points:
Red = Regular Bearish
Green = Regular Bullish
Orange = Hidden Bearish
Blue = Hidden Bullish
Line width and transparency are adjustable.
4. Labels and Alerts
Labels mark divergence points with up/down arrows.
Alerts trigger for each divergence type.
📈 How to Use
Use Regular Divergences to anticipate trend reversals.
Use Hidden Divergences to confirm trend continuation.
Combine with support/resistance, trendlines, or volume for higher probability setups.
Recommended Timeframes: Works on all timeframes; more reliable on 1h, 4h, and Daily.
Markets: Forex, Crypto, Stocks.
⚙️ Inputs
Source (Close, HL2, etc.)
RSI Length
Toggle Regular / Hidden Divergence visibility
Toggle Lines / Labels
Line Width & Line Transparency
⚠️ Disclaimer
This script is for educational purposes only. It does not constitute financial advice.
Always test thoroughly before using in live trading.

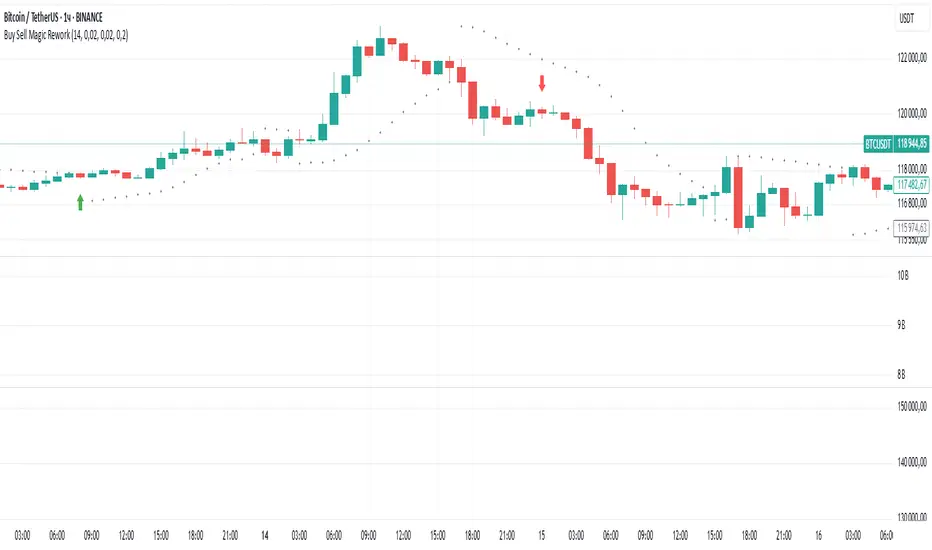
Buy Sell Magic Rework📌 Purpose
This script is a reworked version of the Parabolic SAR strategy, with an optional ZigZag filter to confirm reversal points.
It helps traders identify potential trend reversals with reduced noise compared to the standard SAR.
🧠 How It Works
1. Parabolic SAR Flip Signals
Buy Signal: Triggered when SAR flips from above price to below price.
Sell Signal: Triggered when SAR flips from below price to above price.
(Default SAR parameters: Start = 0.02, Increment = 0.02, Max = 0.2)
2. ZigZag Filter (Optional)
When Use ZigZag Filter = true:
The script confirms reversals only at significant pivots (swing highs/lows) detected by the ZigZag algorithm over the selected ZigZag Period (default = 14 bars).
Buy Signal: Appears only when a new pivot low is detected.
Sell Signal: Appears only when a new pivot high is detected.
3. Trade-Off
Without ZigZag: More signals, more noise.
With ZigZag: Fewer signals, but stronger confirmation and reduced false entries.
📈 How to Use
Signals appear as green arrows for buy and red arrows for sell.
Works well for:
Trend reversal detection.
Swing trading confirmation.
Filtering entries for other systems.
Recommended Timeframes: 15m, 1h, 4h.
Markets: Forex, Crypto, Stocks.
⚙️ Inputs
ZigZag Period (bars for pivot detection)
SAR Start / Increment / Max (SAR parameters)
Use ZigZag Filter (toggle for confirmation)
⚠️ Disclaimer
This script is for educational purposes only. It does not constitute financial advice.
Always test thoroughly before live trading.
Smart Impulse Exhaustion Finder (ATR + ADX Filter)📌 Purpose
This indicator detects potential exhaustion of strong bullish or bearish impulses at fresh swing highs/lows by combining multiple price action and volatility-based filters.
🧠 How It Works
A signal is triggered only when all core conditions are satisfied:
1. Swing High/Low Detection
Current high (or low) must be the highest (or lowest) over the last Extremum Lookback bars (default: 50).
This ensures the move is significant relative to recent price action.
2. Impulse Confirmation
Price must extend by at least 1 × ATR from the previous swing point.
This filters out minor fluctuations.
3. Exhaustion Conditions (at least 2 out of 3 must be met)
RSI Extreme: RSI > Overbought Level (default: 80) for bearish signals, RSI < Oversold Level (default: 20) for bullish signals.
Volume Spike: Volume > SMA(Volume, Volume SMA Length) × Volume Spike Multiplier.
Candle Wick Rejection: Upper wick ≥ Wick Threshold % for bearish setups, Lower wick ≥ Wick Threshold % for bullish setups.
4. Trend Filter
ADX > ADX Threshold ensures the market is trending and filters out sideways conditions.
5. Candle Body Filter
Candle body must be ≥ Body Size ATR Factor × ATR.
This avoids weak signals from small candles or doji formations.
📈 How to Use
Bearish Signal:
Appears at fresh swing highs with exhaustion conditions met. Useful for tightening stops, taking partial profits, or counter-trend shorts.
Bullish Signal:
Appears at fresh swing lows with exhaustion conditions met. Useful for trailing stops, profit-taking, or counter-trend longs.
Recommended Timeframes: Works best on 1h, 4h, and Daily charts.
Markets: Crypto, Forex, Stocks — wherever volatility and trends are present.
⚙️ Inputs
RSI Length / Overbought / Oversold
Volume SMA Length & Volume Spike Multiplier
Wick Threshold %
Extremum Lookback (bars for highs/lows)
ADX Length & Threshold
Body Size ATR Factor
⚠️ Disclaimer
This script is for educational purposes only and does not constitute financial advice.
Always test thoroughly and apply proper risk management before live trading.
💡 Tip: Combine this tool with your own market context and confluence factors for higher probability setups.

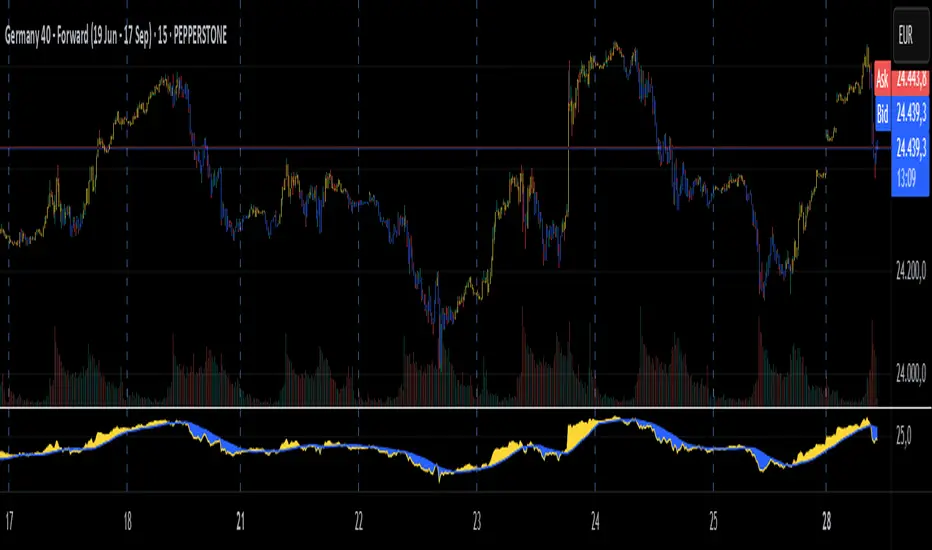
JHW Volume Based Buy and Sell MomentumThe JHW Volume-Based Buy and Sell Momentum indicator is a custom momentum oscillator designed to capture market sentiment based on volume dynamics and price rate of change (ROC). It aims to identify bullish or bearish momentum by analyzing how price reacts to increasing or decreasing trading volume.
Core Logic:
The indicator calculates the Rate of Change (ROC) of the closing price.
It then accumulates this ROC separately based on whether the current volume is lower or higher than the previous bar:
If volume decreases, the ROC is added to a "negative volume index" accumulator.
If volume increases, the ROC is added to a "positive volume index" accumulator.
These two accumulators are combined to form a net momentum line.
Smoothing:
A Simple Moving Average (SMA) is applied to both accumulators over a user-defined period (default: 25 bars).
The sum of these smoothed values forms the signal line.
Visualization:
The indicator plots:
The net momentum line (yellow).
The smoothed signal line (blue).
The area between the two lines is filled with color:
Yellow when momentum is above the signal (bullish).
Blue when momentum is below the signal (bearish).
Bar colors are also adjusted to reflect the current momentum state.
Use Case:
This indicator helps traders:
Detect volume-driven momentum shifts.
Identify potential buy or sell zones based on volume behavior.
Confirm trends or spot early reversals.