CBC Flip with Volume [Pt]█ CBC Flip with Volume
A price-action based indicator that detects real-time control flips between bulls and bears, enhanced with volume filtering and Pine Screener compatibility.
This tool tracks when the market shifts from bear control to bull control or vice versa, using candle structure and volume behavior. It highlights key reversal points, filters low-conviction moves, and provides two screener-ready outputs for directional monitoring.
█ What It Detects
This script identifies when control flips between buyers and sellers on a candle-by-candle basis. A flip is confirmed only when both price structure and volume meet strict criteria. The indicator uses an internal state to track who is in control and updates when a flip occurs.
█ Flip Conditions
Bull Flip
• Previous bar was under bear control
• Current candle closes above the previous high
• Candle is bullish (close is above open)
• Volume is greater than the previous bar
Bear Flip
• Previous bar was under bull control
• Current candle closes below the previous low
• Candle is bearish (close is below open)
• Volume is greater than the previous bar
When a flip occurs, the indicator updates the control state and records the open price of the flip candle.
█ Strong Flip Detection
A flip is considered strong when volume is also greater than the average volume over a set number of candles (default is 50). Strong flips are visually emphasized using larger markers and darker background shading. This helps filter out moves that lack follow-through volume.
█ Visual Elements on Chart
• Bull Flip (Normal): Small teal triangle below the candle
• Bull Flip (Strong): Larger green triangle below the candle
• Bear Flip (Normal): Small salmon triangle above the candle
• Bear Flip (Strong): Larger red triangle above the candle
• Background Color:
– Green shades for bull flips
– Red shades for bear flips
– Darker color when flip is strong
These visual elements appear only on the candle where a flip is detected. No markers are shown on continuation candles.
█ Inputs
• Volume MA Lookback : Sets the moving average length used for determining whether volume is high enough for a strong flip (default: 50)
█ Alerts
• Bull Flip – Notifies when bulls take control
• Bear Flip – Notifies when bears take control
Alerts are triggered at candle close.
█ Pine Screener Support
This script includes two output columns for TradingView’s Pine Screener:
• Bull in Control (% gain) : Shows the percentage gain from the bull flip’s open to the current close. Resets to 0 when bulls lose control.
• Bear in Control (% gain) : Shows the percentage drop from the bear flip’s open to the current close (as a positive number). Resets to 0 when bears lose control.
These outputs allow you to filter for active moves. For example:
• Bull in Control (% gain) > 2.0 to find strong uptrends
• Bear in Control (% gain) > 1.5 to find sharp breakdowns
█ Use Cases
• Confirm breakouts using volume-backed flips
• Spot short-term reversals at key zones
• Filter out low-volume chop
• Combine screener results with trend or volatility filters
• Build entries around control flips and follow-through strength
Inspired by MapleStax’s original CBC method.
Indicators and strategies

Smart Elliott Wave [The_lurker]🔷 Smart Elliott Wave – موجات إليوت الذكية
A professional indicator for automatically detecting and analyzing Elliott Wave patterns on the chart. Built on classical Elliott Wave theory, it enhances accuracy with dynamic Fibonacci validation and geometric logic—solving the most common issues traders face when applying Elliott Wave manually: complexity, subjectivity, and misinterpretation of corrections.
🎯 Key Features
Smart Elliott Wave offers a layered intelligent system that:
- Automatically detects impulsive and corrective wave structures
- Validates wave formations using Fibonacci rules
- Highlights potential reversal zones (PRZ)
- Sends instant alerts for newly detected patterns
- Supports both bullish and bearish trends
- Includes fully customizable user settings
🧠 Core Concept
The indicator analyzes price movement over time using pivot points (discovered via `ta.pivothigh` and `ta.pivotlow`) to detect wave structures that conform to Elliott Wave sequencing:
- Impulse Wave: 0-1-2-3-4-5
- Simple Correction: ABC
- Complex Correction: WXY
Each structure is validated through a strict set of logical rules combined with Fibonacci ratio checks to ensure pattern integrity and reduce false signals.
🧩 Wave Structure Components
1️⃣ Impulse Waves
- Wave 3 is not the shortest
- Wave 4 does not overlap Wave 1
- Waves 1, 3, and 5 are impulsive; Waves 2 and 4 are corrective
- Fibonacci validation can be applied to Waves 2 and 4 if enabled
2️⃣ Simple Corrections (ABC)
- Wave B partially retraces Wave A
- Wave C completes the structure without invalid overlap
- Fibonacci ratios validate the symmetry of A, B, and C (if enabled)
3️⃣ Complex Corrections (WXY)
- Only used if ABC structure is insufficient
- Requires 6 sequential pivot points: W, X, Y
- W and Y are corrective; X is a linking wave
- Follows both structural and ratio-based validations
📏 Dynamic Fibonacci Validation
When Enable Fibonacci Rules is active:
- Validates against common ratios:
`38.2%`, `50%`, `61.8%`, `78.6%`, `127.2%`, `161.8%`
- Adjustable **Fibonacci Tolerance** allows for controlled deviation
- Patterns are ignored if ratios fall outside the accepted range
🔮 Potential Reversal Zones (PRZ)
- Calculated from the most recent completed impulse wave
- Uses Fibonacci extensions to project PRZ ahead of price
- Customizable visibility and color for each ratio
- Used as dynamic take-profit or stop-loss zones
🖍️ Dual Trend Detection & Wave Coloring
- Supports both bullish and bearish patterns
- Automatic wave coloring for quick visual recognition:
- 🟦 Blue: Bullish waves
- 🟥 Red: Bearish waves
- Optional fill color for correction zones
🔔 Smart Alert System
Instant alerts are triggered when a valid wave pattern is confirmed:
- New impulse wave detected
- ABC correction appears
- Complex WXY correction formed
> Alerts are triggered only after the bar closes to prevent repainting.
⚙️ Indicator Settings
📌 Wave Detection Settings
- Pivot Left Strength: Bars to the left used for pivot detection
- Pivot Right Strength: Bars to the right for confirmation (0 = real-time)
- Enable Fibonacci Rules: Toggle Fibonacci ratio validation
- Fibonacci Tolerance: Allowed deviation in percentage
🎨 Display Settings
- Show Previous Patterns: Toggle between all patterns or only the latest
- Fill correction zones with color
- Customize wave and PRZ color schemes
📉 PRZ Settings
- Show/hide specific Fibonacci ratios
- Customize each PRZ color
- Set maximum bar extension for PRZ display
🔕 Alert Settings
- Enable or disable alerts for each type of pattern
📚 Practical Use Cases
- Daily or intraday price structure analysis
- Combine with RSI, MACD, or momentum indicators
- Filter weak signals using Fibonacci-based pattern validation
- Use PRZ zones as dynamic entry/exit targets
- Learn and reinforce Elliott Wave theory through real-time examples
📝 Important Notes
- Setting `Pivot Right = 0` allows for real-time pattern previews (may repaint)
- Disabling Fibonacci validation increases pattern count but reduces accuracy
- TradingView limits to 500 visual objects (labels, boxes, lines); older patterns may be removed
- PRZ extends up to 100 bars or 0.618 of the previous impulse duration by default
⚠️ Disclaimer:
This indicator is for educational and analytical purposes only. It does not constitute financial, investment, or trading advice. Use it in conjunction with your own strategy and risk management. Neither TradingView nor the developer is liable for any financial decisions or losses.
🔷 Smart Elliott Wave – موجات إليوت الذكية
مؤشر احترافي لرصد وتحليل أنماط موجات إليوت تلقائيًا على الرسم البياني، يعتمد على المبادئ الكلاسيكية للنظرية مع تعزيزها بالتحقق الرياضي والهندسي، ويهدف إلى تجاوز العقبات التي يواجهها معظم المتداولين عند تطبيق موجات إليوت يدويًا، مثل صعوبة التحديد، التقديرات الذاتية، وتشويش التصحيحات.
🎯 ما الذي يميز هذا المؤشر؟
يُقدّم Smart Elliott Wave نظامًا تراكبيًا ذكيًا يقوم بـ:
رصد تلقائي للموجات (الدافعة والتصحيحية)
التحقق من صحة النموذج باستخدام قواعد فيبوناتشي
عرض مناطق الانعكاس المحتملة (PRZ)
توليد تنبيهات لحظية عند تشكّل أنماط جديدة
دعم الاتجاهين (الصاعد والهابط)
واجهة إعدادات مرنة قابلة للتخصيص الكامل
🧠 الفكرة الأساسية
يعتمد المؤشر على تحليل حركة السعر عبر تسلسل زمني من النقاط المحورية (Pivots)، والتي تُكتشف باستخدام دوال مدمجة مثل ta.pivothigh وta.pivotlow. ثم يُبني فوق هذه النقاط نماذج هندسية متوافقة مع تسلسل موجات إليوت:
الموجة الدافعة (Impulse): تسلسل 0-1-2-3-4-5
التصحيح البسيط (ABC)
التصحيح المعقد (WXY)
ويتم التحقق من كل نموذج اعتمادًا على قواعد إليوت + نسب فيبوناتشي، ما يضمن موضوعية التصنيف، ودقة التحديد.
🧩 مكوّنات التحليل:
1️⃣ الموجات الدافعة (Impulse Waves):
يُشترط أن تكون الموجة الثالثة غير الأقصر.
لا تتداخل الموجة الرابعة مع نطاق الموجة الأولى.
تأكيد أن الموجات 1 و3 و5 دافعة، و2 و4 تصحيحية.
يتم التحقق من نسب تصحيح الموجتين 2 و4 حسب قواعد فيبوناتشي عند تفعيلها.
2️⃣ التصحيح البسيط (ABC):
B تصحيح جزئي للموجة A.
C تُكمل الهيكل بدون تداخل مع A.
يتم التحقق من أطوال الموجات وفق نسب فيبوناتشي لضمان التناسق.
3️⃣ التصحيح المعقد (WXY):
لا يتم تفعيله إلا عند فشل ABC في تفسير النمط.
يتطلب 6 نقاط محورية متسلسلة: W, X, Y.
W وY تصحيحيتان، وX رابط مركزي.
يخضع أيضًا لقواعد النسب والتماثل البنائي.
📏 التحقق باستخدام نسب فيبوناتشي:
عند تفعيل خاصية Enable Fibonacci Rules، يتم التحقق الصارم من نسب تصحيح الموجات:
النسب المعتمدة:
38.2%, 50%, 61.8%, 78.6%, 127.2%, 161.8%
إذا لم تكن الموجة ضمن نطاق النسبة + نسبة التسامح (Tolerance)، يتم تجاهل النموذج.
يُستخدم هذا التحقق أيضًا لرسم مناطق الانعكاس المحتملة (PRZ).
🔮 مناطق الانعكاس المحتملة (PRZ)
تُحسب PRZ باستخدام نسب فيبوناتشي انطلاقًا من نهاية آخر موجة دافعة.
تُعرض بشكل مستطيلات شفافة أو ملونة.
يمكن تخصيص كل نسبة لونًا وشكلًا خاصًا.
تُستخدم PRZ كأداة توقع للموجة التالية أو لتحديد أهداف وقف الخسارة وجني الأرباح ديناميكيًا.
🖍️ دعم الاتجاهين وتلوين الموجات:
يدعم المؤشر النماذج الصاعدة والهابطة بشكل تلقائي.
يتم استخدام تلوين بصري لتسهيل التمييز:
الأزرق: للموجات الصاعدة
الأحمر: للموجات الهابطة
لون تعبئة مخصص لمناطق التصحيح
🔔 نظام التنبيهات الذكية
يحتوي المؤشر على تنبيهات تلقائية يتم تفعيلها عند اكتمال أي نمط جديد.
يدعم التنبيهات التالية:
موجة دافعة جديدة
تصحيح بسيط ABC
تصحيح معقد WXY
التنبيهات تُطلق بعد إغلاق الشمعة التي تحقق فيها النموذج (غير فوري Repainting-safe)
⚙️ إعدادات المؤشر
📌 إعدادات تحليل الموجة:
Pivot Left Strength: عدد الأعمدة (bars) إلى اليسار لتحديد الانعكاس
Pivot Right Strength: الأعمدة إلى اليمين لتأكيد الانعكاس (0 يعني تنبؤ لحظي)
Enable Fibonacci Rules: تفعيل/تعطيل التحقق من فيبوناتشي
Fibonacci Tolerance: نسبة التفاوت المقبولة بالنسب المئوية
🎨 إعدادات العرض:
Show Previous Patterns: إظهار كل الأنماط المكتشفة أو آخر نمط فقط
PRZ Settings:
إظهار أو إخفاء نسب معينة
تخصيص الألوان
تحديد امتداد مربع PRZ زمنيًا (Max Bars)
🔕 إعدادات التنبيهات:
تفعيل/تعطيل تنبيه عند كل نمط جديد
📚 حالات الاستخدام العملية:
تحليل الحركة السعرية في بداية كل جلسة
دمج المؤشر مع أدوات مثل RSI أو MACD للحصول على إشارات مركّبة
مراقبة الموجات التوسعية والتصحيحية على فواصل 4H / Daily
استخدام PRZ كأداة لتحديد الأهداف أو وقف الخسارة
التعلم العملي لنظرية إليوت من خلال أمثلة حية
📝 ملاحظات مهمة:
تعيين Pivot Right = 0 يعني نقاط فورية (قد يعاد رسمها لاحقًا)
تعطيل فيبوناتشي يزيد عدد النماذج، لكن قد يُضعف دقتها
TradingView يحد عدد الكائنات المرسومة (Labels, Boxes, Lines) إلى 500، مما قد يؤدي إلى حذف الأنماط الأقدم تلقائيًا
PRZ يمتد افتراضيًا حتى 100 شمعة، أو 0.618 من مدة الموجة الدافعة السابقة
⚠️ إخلاء مسؤولية:
هذا المؤشر لأغراض تعليمية وتحليلية فقط. لا يُمثل نصيحة مالية أو استثمارية أو تداولية. استخدمه بالتزامن مع استراتيجيتك الخاصة وإدارة المخاطر. لا يتحمل TradingView ولا المطور مسؤولية أي قرارات مالية أو خسائر.

Time Range Marker By BCB ElevateThe Time Range Marker is a simple yet powerful visual tool for traders who want to focus on specific time intervals within the trading day. This indicator highlights a custom time range on your chart using a background color, helping you visually isolate key trading sessions or event windows such as:
Market open/close hours
News release periods
High-volatility trading zones
Personal strategy testing windows
⚙️ Key Features:
Customizable start and end time (hour & minute)
Works across all intraday timeframes
Adjustable highlight color to match your chart theme
Built using Pine Script v5 for speed and flexibility
🔧 Settings:
Start Hour / Minute – Set the beginning of the time range (in 24-hour format)
End Hour / Minute – Define when the range ends
Highlight Color – Choose the background color for better visibility
🕒 Timezone Note:
The indicator uses UTC time by default to ensure accuracy across markets. If your broker uses a different timezone (like EST, IST, etc.), the script can be adjusted to reflect your local market hours.
✅ How to Use the Time Range Marker Indicator
This indicator is used to visually highlight a specific time window each trading day, such as:
Market open or close sessions (e.g., NYSE, London, Tokyo)
High-impact news release periods
Custom time slots for strategy testing or scalping
🛠️ Installation Steps
Open TradingView and go to any chart.
Click on Pine Editor at the bottom of the screen.
Copy and paste the full Pine Script (shared above) into the editor.
Click the “Add to Chart” ▶️ button.
The indicator will appear on the chart with a highlighted background during the time range you set.
⚙️ How to Customize the Time Range
After adding the indicator:
Click the gear icon ⚙️ next to the indicator’s name on the chart.
Adjust the following settings:
Start Hour / Start Minute: The beginning of your time range (in 24-hour format).
End Hour / End Minute: When the highlight should stop.
Highlight Color: Pick a color and transparency for visual clarity.
Click OK to apply changes.
🕒 Timezone Consideration
By default, the indicator uses UTC (Coordinated Universal Time).
To match your broker’s timezone (e.g., EST, IST, etc.), you'll need to adjust the script by changing:
sessStart = timestamp("Etc/UTC", ...)
sessEnd = timestamp("Etc/UTC", ...)
to your correct timezone, like "Asia/Kolkata" for IST or "America/New_York" for EST.
Let me know your broker or local timezone, and I’ll update it for you.
📈 Tips for Traders
Combine this with volume, price action, or breakout indicators to focus your strategy on high-probability time windows.
Use multiple versions of this script if you want to highlight more than one time range in a day.

HTF CandlesFull credit to cdikici71 - this is a stripped down version of cd_sweep&cisd_Cx to provide a clean higher timeframe (HTF) candle overlay. Choose colors for candles & font along with timeframe to overlay the HTF on any other timeframe.
Simple and Clean!

Stop Order Entry with Filters and Line📌 名称: Stop Order Entry with Filters (挂单入场辅助工具)
🧠 作者: Kuixi Zhu
🛠️ 功能简介:
本指标用于识别高质量的 Bull/Bear bar,并在其上方(或下方)自动绘制挂单入场线,帮助你基于 Price Action 策略设置 **buy stop / sell stop** 挂单。
✅ 特性:
- Bull bar:收盘靠近 high,且 bar 波动大于平均(ABR) → 在 high+1tick 画绿线(buy stop)
- Bear bar:收盘靠近 low,且 bar 波动大于平均 → 在 low-1tick 画红线(sell stop)
- 支持自定义线条长度、ABR周期、强度过滤标准
🔍 核心逻辑:
- `(close - low) / (high - low)` 衡量收盘靠近 high 的程度
- `barRange > avg(barRange)` 控制有效波动性
- 使用 `line.new` 动态画出可视化入场价格
📊 应用场景:
- 趋势交易中的顺势挂单策略
- price action 高质量 bar 的识别辅助
- 多头突破、空头反转结构的自动提示
⚙️ 参数可调:
- 最低收盘位置比例(default: 0.9)
- 最小 bar 波动倍数(相对 ABR)
- 横线绘制长度(default: 5 bars)
---

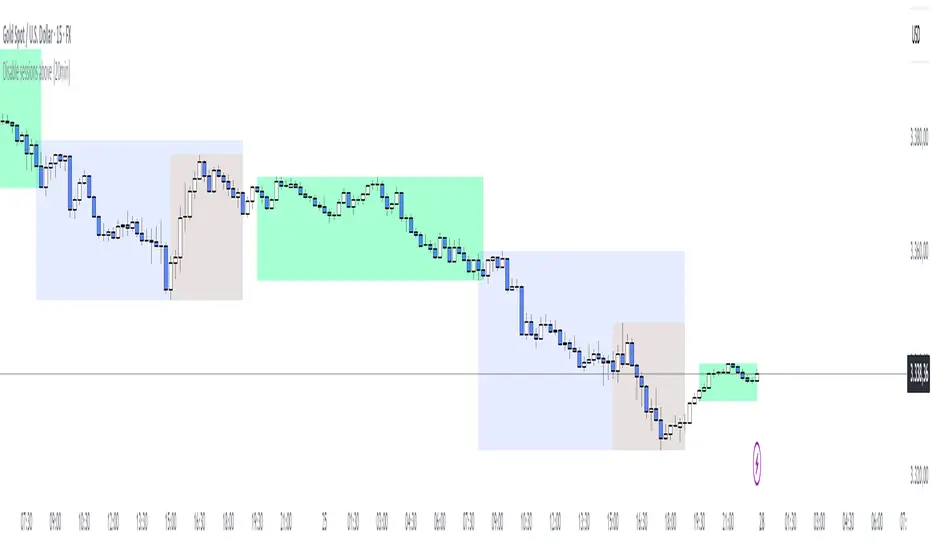
Trading Sessions Pro [By TradingNexus]🔍 **Trading Sessions Pro – Institutional Timing Zones **
This premium script highlights all key trading session times (New York, London, Asia), professional high-volatility trading zones, and visualizes institutional market timing with precision.
### 🕒 SESSION OVERVIEW:
• NY, London, and Asia sessions — shown with real-time background color overlays
• Session open/close markers on the chart (arrows below/above bars)
• Live session table showing current status (ACTIVE / INACTIVE)
### 💹 PROFESSIONAL TRADE ZONES:
• NY Trade Zone (08:00–11:00 EST)
• London Trade Zone (03:00–06:00 EST)
• Asia Trade Zone (18:00–21:00 EST)
• Overlap Zone (08:00–12:00 EST) – highest liquidity
• Visualized with color-coded backgrounds and labels like "NY TRADE", "HIGH LIQUIDITY"
### 🚫 NO-TRADE ZONES:
• Gray background marks low-probability zones when no trade zones are active
• Helps traders avoid sideways markets, low volume, and choppy sessions
• Based on session presence without overlapping trade zone activity
### 📈 SIGNALS:
• Volatility-based BUY and SELL signals (ATR-filtered)
• Buy = green candle + high volatility in trade zone
• Sell = red candle + high volatility in trade zone
• Arrow markers (↑ BUY, ↓ SELL) plotted on chart in real time
• Sensitivity control (Low / Medium / High) via settings
• Alerts supported for signal triggers
### 🧾 LIVE DASHBOARDS:
• Top-right session status table (NY / London / Asia)
• Bottom-right trade zone dashboard with:
- Real-time trade zone status
- ATR-based volatility value
- Summary of market condition: TRADE / WAIT
### 🔔 ALERTS SYSTEM:
• Alerts for:
- Session starts
- Trade zone activations
- Buy/Sell signal triggers
• Plug directly into TradingView alert system
---
✅ Compatible with any asset (Forex, Crypto, Indices)
✅ Designed for intraday + session-based institutional traders
✅ Clean Pine Script v6 coding
✅ Fully customizable and beginner-friendly
📊 Created by: **TradingNexus**
🌐 Website: (tradingnx.com)
📲 Telegram: @TradingNXClub
🐦 Twitter: @TradingNX

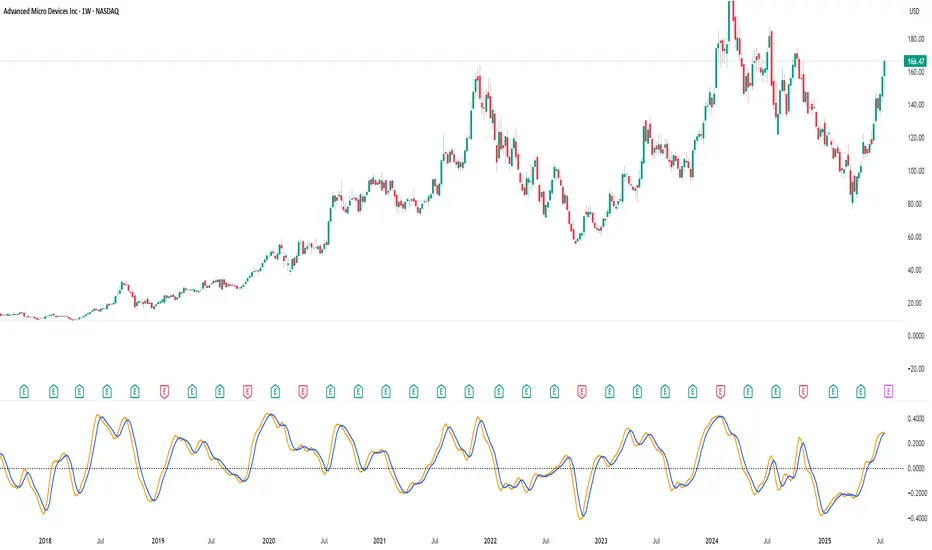
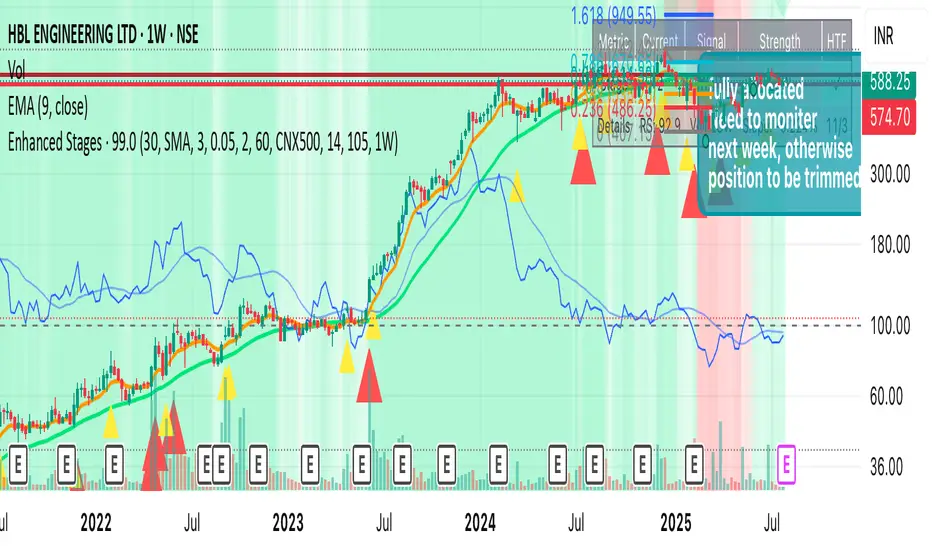
Improved Weinstein Stage AnalysisThe code provides an actionable, disciplined, and visually informative implementation of the “Stage Analysis” approach pioneered by Stan Weinstein, with enhancements to modernize, automate, and clarify the methodology for today’s traders using TradingView. It faithfully follows the workflow recommended: identify long-term cycles, confirm with volume and relative strength, and only engage aggressively with the market during the advancing (bullish) stage with all “clues” aligned.
Sessions with timeframe filter🕒 Smart Timeframe Filtering
This session indicator includes an automatic filter that disables all session boxes when the chart timeframe is greater than the user-defined input. This helps keep higher-timeframe charts clean and focused by hiding intraday sessions when they’re no longer relevant — especially helpful for multi-timeframe traders.
🔍 Features:
📦 Draws up to 3 customizable session boxes with dynamic high/low tracking.
⏱️ Auto-disables on higher timeframes (Smart Timeframe Filter).
🌍 Fully customizable session times, box colors, and time zone (GMT-based).
⚡ Optimized for performance using lightweight, non-overlapping box logic.
👨🍳 UI is organized like a chef’s kitchen: clean, intuitive, and easy to navigate. Settings are grouped and filtered to avoid clutter.
✅ Best Use:
This indicator is most useful for intraday traders on 1m–15m charts.
It’s designed to keep your workspace clean on 30m+ charts or whatever threshold you define.
Date Marker GPTDate Marker GPT
By Jimmy Dimos (corrected by ChatGPT-o3)
Description
This overlay indicator automatically plots vertical lines at each weekly option-expiration timestamp (Friday at 3 PM CST) for both historical and upcoming periods, helping you visualize key expiration dates alongside your price action and regression tools. Shown is my Date Maker GPT vertical blue Lines, Linear Regression Channel(not part of my script) and zigzag++ also not part of my script.
⸻
Key Features
• Past Expirations: Draws 12 past Friday markers at 3 PM CST
• Future Expirations: Projects 12 upcoming Friday markers at 3 PM CST
• Timezone Handling: Uses UTC internally (21:00 UTC = 3 PM CST)
• Customizable: num_fridays_past and num_fridays_future inputs let you adjust how many weeks to display
⸻
How It Works
1. Timestamp Calculation
• Uses Pine Script’s dayofweek() and timestamp() functions to find each Friday at the target hour.
• Two helper functions, get_previous_friday() and get_next_friday(), compute offsets in days/weeks based on the current bar’s date.
2. Drawing Lines
• Loops through the specified number of weeks in the past and future.
• Calls line.new() for each expiration timestamp, extending lines across the entire chart.
⸻
Usage Tips
• Overlay this script on any OHLC chart to see how price tends to cluster around option expirations.
• Combine with a linear regression or trend-channel indicator to anticipate likely trading ranges leading into expiration.
• Tweak the num_fridays_past and num_fridays_future parameters to focus on shorter or longer horizons.
⸻
Disclaimer: This tool is provided for educational and analytical purposes only. It is not financial advice. Always conduct your own research and risk management.

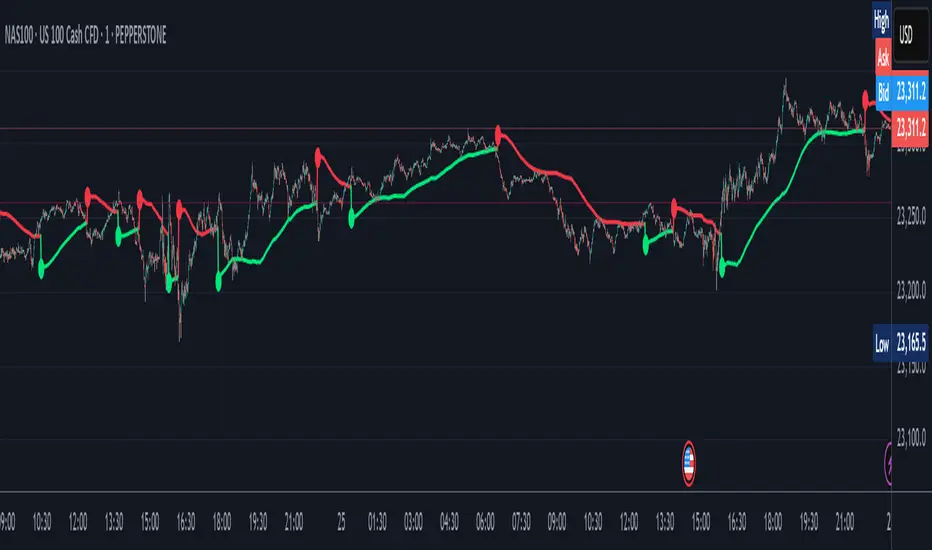
Step-OMA with SignalsThe Step-OMA with Signals is a sophisticated trend-following indicator that combines Loxx's Optimized Moving Average (OMA) algorithm with an advanced step function to create a highly responsive yet smooth trend detection system. This indicator excels at identifying trend changes early while minimizing false signals through its adaptive filtering mechanism.
Core Algorithm Components
1. Optimized Moving Average (OMA) Foundation
Based on Loxx's advanced OMA implementation
Uses a 6-stage exponential smoothing process
Incorporates adaptive period calculation based on market noise
Employs Jurik-style smoothing techniques for superior signal quality
2. Step Function Integration
Implements a step-based trend detection mechanism
Uses ATR-based dynamic threshold calculation
Maintains trend consistency through threshold memory
Provides clear trend change identification
3. Adaptive Noise Filtering
Automatically adjusts to market volatility
Calculates optimal averaging periods based on price noise
Reduces false signals in choppy market conditions
Speed (Default: 3.0, Range: -1.5 to unlimited)
This is the most critical parameter affecting indicator behavior:
Positive Speed Values (0 to 10.0+):
Creates faster, more responsive signals
Higher values increase sensitivity to recent price action
Negative Speed Values (-1.5 to -0.1):
Produces smoother, more conservative signals
Reduces noise and false breakouts
Creates delayed but more reliable trend confirmations
Adaptive (Default: True)
When enabled: Automatically adjusts averaging period based on market noise
When disabled: Uses fixed length parameter
Recommendation: Keep enabled for most market conditions
Sensitivity Factor (Default: 3.0)
Controls the threshold distance for trend change detection
Lower values: More frequent signals, higher sensitivity
Higher values: Fewer but more reliable signals
Optimal range: 2.0-5.0 depending on market volatility
Step Size Period (Default: 50)
Determines the ATR calculation period for dynamic thresholds
Affects the indicator's adaptation to volatility changes
Lower values: More reactive to recent volatility
Higher values: More stable threshold calculation
For a trading application, Step-OMA is a suitable base filter to complement other types of signaling indicators (oscillators, momentum indicators).
Disclaimer: This indicator is a technical analysis tool and should be used in conjunction with proper risk management and comprehensive market analysis. Past performance does not guarantee future results.
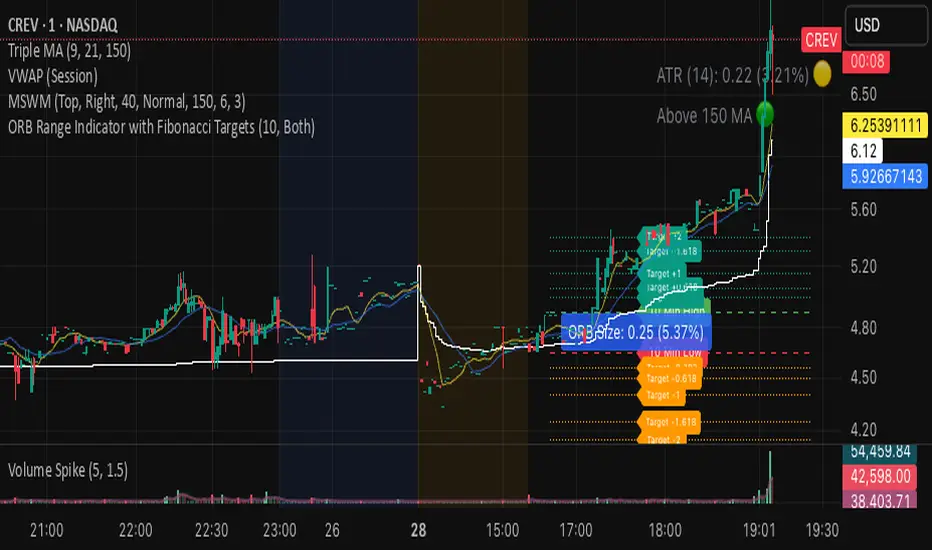
ORB Range Indicator with Fibonacci Targets
This script plots the Opening Range (ORB) high and low based on a configurable time window (5–45 minutes from the U.S. session open at 9:30 AM EST).
Once the ORB window closes, the indicator draws horizontal lines marking:
ORB High and Low
The size of the range in price and %
Fibonacci-based price targets above and below the range (0.382, 0.618, 1.000, 1.618, 2.000)
You can control:
Which Fibonacci levels to display
Whether to show long targets, short targets, or both
All drawings are automatically cleared at the start of each trading day.
Ideal for breakout traders using ORB and Fibonacci extensions for target planning.
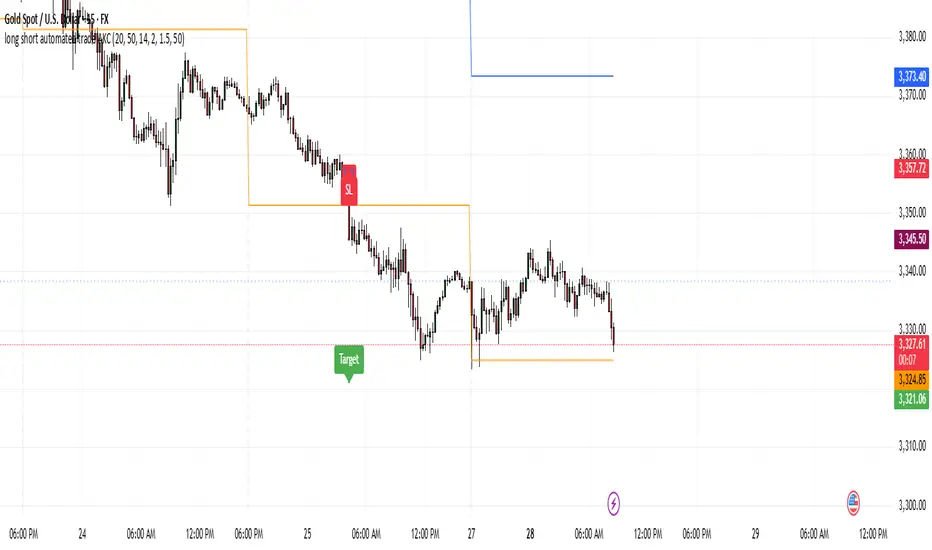
Momentum Reversal StrategyBEST USE IN 15MIN TIME FRAME EURUSD / XAUSUD
1. Strategy Overview
This strategy hunts short-term momentum reversals at key levels during high-liquidity sessions.
Timeframes: 5-minute for entries; 15-minute for trend context
Sessions: London for EUR/USD & GBP/USD; New York for XAU/USD
Pairs: EUR/USD, GBP/USD, XAU/USD
Indicators (3 max):
EMA(20) and EMA(50) (close)
MACD (12, 26, 9) histogram
Optional: RSI(14) (for divergence filter)
2. Entry Rules
Trend Filter (15 min):
Long only if EMA20 > EMA50; short only if EMA20 < EMA50.
Price-Action Zone (5 min):
Identify recent swing high/low within past 20 bars.
Draw horizontal support (for longs) or resistance (for shorts).
Indicator Alignment (5 min):
MACD histogram crossing from negative to positive for longs, positive to negative for shorts.
Candle close beyond EMA20 in direction of trade.
Candle Confirmation:
Bullish engulfing or hammer at support for longs; bearish engulfing or shooting star at resistance for shorts.
Entry Execution:
Place market order on candle close that meets all above.
3. Exit Rules
Stop-Loss (SL):
Long: 1.5× ATR(14) below entry candle low.
Short: 1.5× ATR(14) above entry candle high.
Take-Profit (TP):
Set at 2× SL distance (RR 1:2).
Trailing SL:
After price moves 1× SL in profit, trail SL to breakeven.
Partial Booking:
Close 50% at 1× SL (50% of TP), move SL to entry.
Close remaining at full TP.
4. Trade Management
False Signal Filter: Skip trades when RSI(14) > 70 for longs or < 30 for shorts (avoids overbought/oversold extremes).
One Trade at a Time: No multiple positions on same pair.
Session Cutoff: Close any open trade 15 minutes before session end.
5. Risk Parameters
Risk per Trade: 1% of account equity.
Reward Target: ≥2% (1:2 RR) per trade.
Win-Rate Expectancy: ≥75% based on indicator confluence and price-action confirmation.
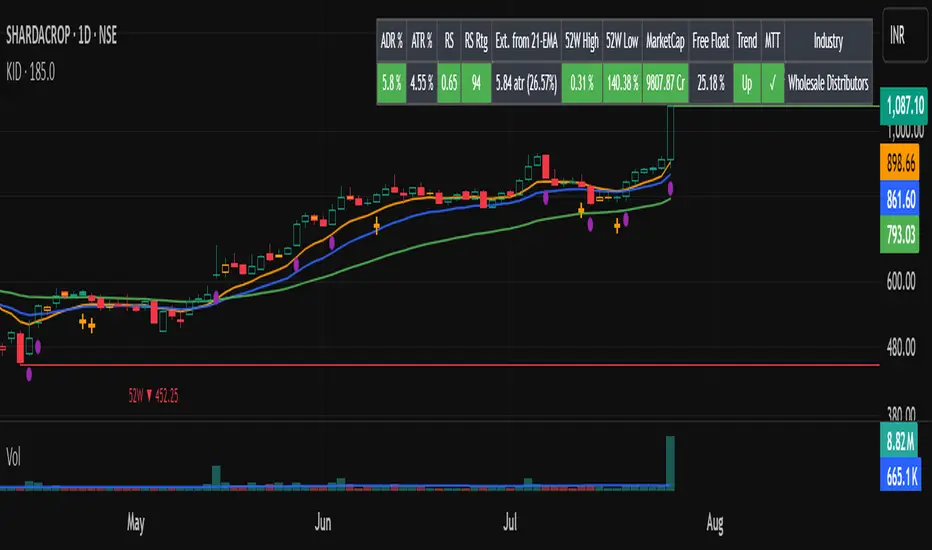
Key Indicators Dashboard (KID)📌 Overview
Key Indicators Dashboard (KID) is a comprehensive all-in-one technical analysis tool designed for discretionary, systematic, and quantitative traders. It brings together multiple essential trading metrics into a highly customizable, interactive dashboard that overlays directly on your TradingView chart.
🎯 What Does KID Do?
KID consolidates all vital market metrics into a single, glanceable dashboard—saving screen space and analysis time. Whether you are screening equities or monitoring open positions, the KID panel updates dynamically, highlighting actionable signals and market conditions based on your own thresholds and trading style.
🛠 Key Features
⦿ Volatility and Range Metrics
ADR (Average Daily Range, % and Value): Quantifies average price movement over a defined period, with threshold-based color highlights.
ATR (Average True Range, % and Value): Measures volatility as both value and percentage of price.
⦿ Relative Strength and Trend Metrics
Relative Strength (RS) vs. Benchmark: Dynamically calculated using a customizable comparative symbol (default: NSE:NIFTYMIDSML400).
IBD-style RS Rating: Weighted average of price changes over several periods (3, 6, 9, and 12 months).
Trend Detection: Uses Supertrend indicator to visually identify up/down market trends.
⦿ Liquidity and Volume Analysis
Relative Volume (RVol): Comparison of current volume to moving average volume.
Turnover (in Cr): Average turnover calculation to assess liquidity.
Market Cap & Free Float: Real-time computation using price and outstanding/floating shares.
⦿ Trend Strength and Structure
MA Extensions: Compares price extension from a selected moving average, depicted as ATR multiples and percentages.
Moving Averages (MAs): Choice of EMA/SMA with customizable lengths, including up to four plotted MAs and detection of MA crossovers.
⦿ Breakout and Tightness Detectors
52-Week High/Low: Calculates and optionally marks the highest and lowest prices over 252 trading days, including percentage distance from current price.
Minervini Trend Template: The Trend Template is a set of technical criteria designed to identify stocks in strong uptrends.
• Price > 50-DMA > 150-DMA > 200-DMA
• 200-DMA is trending up for at least 1 month
• Price ≥ 52-week high proximity
• Price is at least 30% above its 52-week low.
• Price is within at least 25 percent of its 52-week high
• Table highlights when a stock meets all above criteria.
Tightness Indicator: Highlights periods with compressed price action relative to historical ranges.
⦿ Candlestick Patterns and Power Bars
Inside Bar Detection: Color- and shape-based highlighting of "inside bars" for pattern traders.
PowerBar (Purple Dot): Flags bars with strong price movement paired with high volume, using ROC and volume thresholds.
⦿ Sector/Industry
Automatically reflects symbol sector and industry if available from trading platform data.
⚙️ Customizable Visualization
Switchable between vertical or horizontal layout.
Works in dark/light mode
User-configurable to toggle any indicator ON or OFF.
User-configurable Moving (EMA/SMA), Period/Lengths and thresholds.
🔔 Built-in Alerts
Supports automatic alert creation for:
ADR%, ATR/ATR %, RS, RS Rating, Turnover
Moving Average Crossover (Bullish/Bearish)
52-Week High/Low
Inside Bars (Bullish/Bearish)
Tightness
Minervini Trend Template
⏳PineScreener Capabilities
The indicator’s alert conditions act as filters for PineScreener.
Available Screener Filters & Alerts:
Price Filters: Minimum and maximum price cutoffs.
Daily Change Filters: Minimum and maximum daily percent move.
Volatility Filters: ADR% and ATR% thresholds met or exceeded.
Liquidity Filters: Minimum average turnover and relative volume cutoffs.
Momentum/Trend Filters:
• Strong RS/RS Rating
• Uptrend/Downtrend state (Supertrend-based)
• Price extensions (detect overbought/oversold situations quickly)
• Breakout proximity via 52-week high/low alerts
Pattern and Setup Detection:
• Minervini Trend Template
• Inside Bar
• Tightness (compressed/volatility contraction setups)
• PowerBar (High ROC + high volume bars)
• MA crossover or above/below specific MAs
⦿ (Optional) : For horizontal table orientation increase Top Margin to 16% in Chart (Canvas) settings to avoid chart overlapping with table.
⚡ Add this script to your chart and start making smarter trade decisions today! 🚀
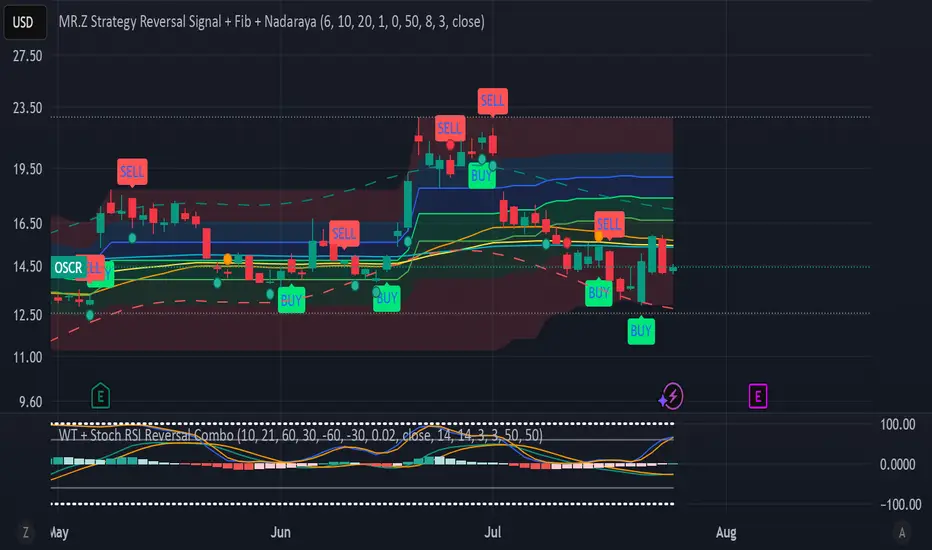
WT + Stoch RSI Reversal Combo📊MR.Z RSI : WT + Stochastic RSI Reversal Combo
This custom indicator combines WaveTrend oscillator and Stochastic RSI to detect high-confidence market reversal points, filtering signals so they only appear when both indicators align.
🔍 Core Components:
✅ WaveTrend Oscillator
Based on smoothed deviation from EMA (similar to TCI logic)
Plots:
WT1 (main line)
WT2 (signal line = SMA of WT1)
Uses overbought/oversold thresholds (default: ±53) to filter signals
✅ Stochastic RSI
Momentum oscillator based on RSI's stochastic value
Plots:
%K: smoothed Stoch of RSI
%D: smoothed version of %K
Adjustable oversold/overbought thresholds (default: 20/80)
🔁 Combined Reversal Signal Logic:
🔼 Buy Signal
WT1 crosses above WT2 below WT oversold level (e.g., -53)
%K crosses above %D below Stoch RSI oversold level (e.g., 20)
🔽 Sell Signal
WT1 crosses below WT2 above WT overbought level (e.g., 53)
%K crosses below %D above Stoch RSI overbought level (e.g., 80)
🔔 Signals are only plotted and alerted if both conditions are true.
📌 Features:
Toggle on/off:
WaveTrend lines and histogram
Stochastic RSI
Combined Buy/Sell signals
Horizontal reference lines (±100, OB/OS)
Fully customizable smoothing lengths and thresholds
Signal plots:
✅ Green up-triangle = Combo Buy
✅ Red down-triangle = Combo Sell
Optional: Circle/cross markers for WT-only and Stoch-only signals
🔔 Built-in alerts for Buy/Sell signals
📈 Use Cases:
Reversal Trading: Wait for both indicators to confirm momentum shift
Entry Filter: Use in combination with trend indicators (like EMA)
Scalping or Swing: Works on intraday and higher timeframes
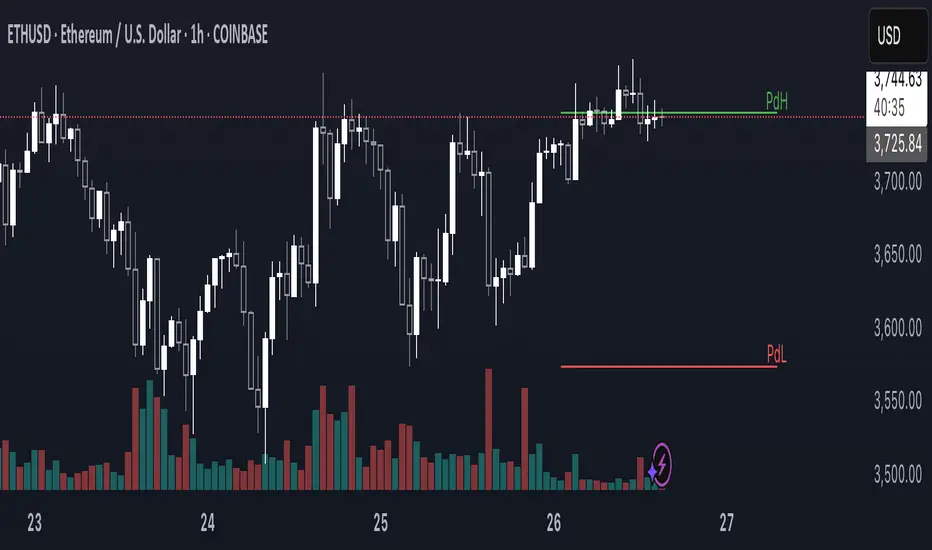
PdH e PdL (Dia Anterior)Simple line that shows with labels the Previous day high and previous day low.
Bias Dashboard + All Open Lines (M/W/D/H4/H1/15min)What does the script do?
This script displays a dashboard that shows the current market bias relative to the open prices of multiple timeframes:
Monthly
Weekly
Daily
4H
1H
15min
Additionally, it plots horizontal lines at each of these open levels on the chart.
How it works
Fetch Open Prices:
The script uses request.security() to get the open prices for each timeframe.
Determine Bias:
Compares the current close price to each open:
If close > open, then "Bullish"
If close < open, then "Bearish"
Display Dashboard:
A visual dashboard shows:
The timeframe label
Whether the current price is above (bullish) or below (bearish) that level
Plot Lines:
Colored horizontal lines are drawn on the chart to indicate each timeframe’s open level.

SulLaLuna PO3 Acceleration Tracker### 🚀 **Power of 3 Acceleration Script | Enter the Cave of Wonder 🧙♂️**
> *“When we find the God Candle, we don’t just ride it—we ritualize it.”*
> — The Calzolaio Way
🌕 The **SulLaLuna PO3 Acceleration Tracker** is a tool born from Smart Money theory, built with surgical logic, and forged to ride the **acceleration phase** with confluence and confidence.
Inspired by the teachings of (youtu.be), this indicator captures the moment of explosive expansion—the candle after the manipulation wick, the price action spark that ignites the trend.
---
### ⚔️ The PO3 Framework (ICT)
* **Accumulation** – Compression, trap laid
* **Manipulation** – Liquidity taken, fakeouts triggered
* **Expansion** – God Candle. This is where we enter.
This script automatically detects that exact **post-manipulation acceleration** candle and plots:
* ✅ TP/SL based on risk-reward
* ✅ Dynamic trend dashboard (15m to 1D)
* ✅ Long/Short trade markers
* ✅ Custom alerts and dashboard positioning
---
### 🔁 **Use Confluence**
> ⚠️ *No entry should ever be made on one signal alone.*
For optimal precision, pair this script with a **trend-strength and momentum filter**.
I personally use (), a brilliant tool that dynamically adapts to volatility and momentum changes using a responsive EMA and wave strength logic. It's CC BY-NC-SA 4.0 licensed and adds serious edge in distinguishing true trends from false breaks.
💡 Look for PO3 entries that align with:
* ✅ Bullish dominance in trend speed
* ✅ Dynamic EMA slope support
* ✅ MTF Trend agreement on the SulLaLuna dashboard
---
### ✨ The Cave of Wonder
This is more than just a script—this is your **map**.
The Cave of Wonder isn’t a place, it’s a **process**. Each PO3 entry is a torch lighting the path deeper into the vaults of financial freedom.
When you use this with **discipline**, **data**, and **divine timing**, you don't just take trades.
You take **territory**.
---
### 🔗 Try It. Trade It. Ritualize It.
🛠️ Built by @Calzolaio
🎓 Based on PO3 by @TheMovingAverage
📊 Powered by trend confluence from @Zeiierman
> “Capture the Acceleration. Honor the Trend. Trade with the Moon.” 🌕

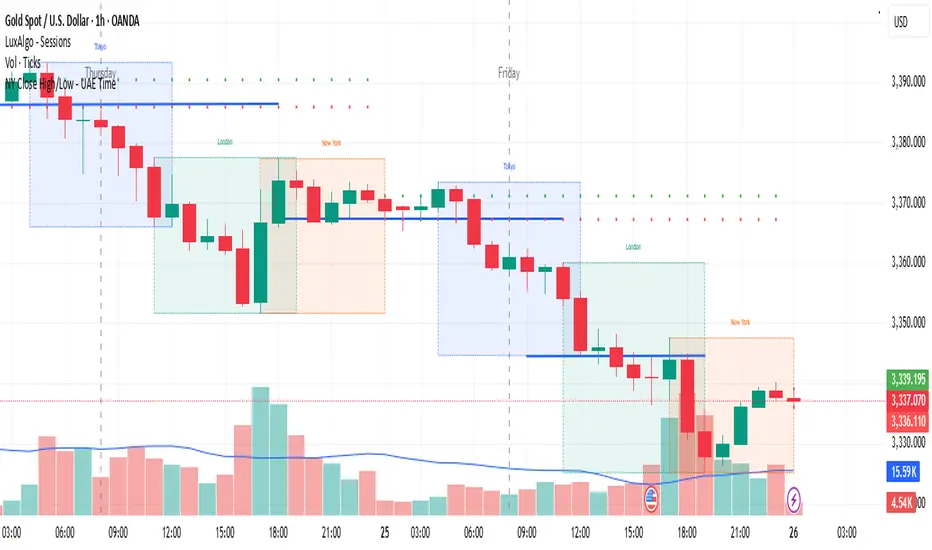
NY Close High/Low - UAE Time📌 Indicator Name:
New York Session Close High/Low – UAE Time
📄 Description:
This indicator automatically marks the high and low of the New York trading session closing candle, based on UAE local time (Asia/Dubai).
🕒 Time Logic:
The New York session closes at 5:00 PM EST, which corresponds to 1:00 AM UAE time (next day).
The indicator captures the 12:00 AM to 1:00 AM UAE time candle, which represents the final hour of the New York session.
✅ Features:
Marks the high and low of the NY close candle.
Updates dynamically each day.
Lines are plotted using UAE local time (Asia/Dubai).
Works on most timeframes (recommended: 1H or higher).
📈 Use Cases:
Identify key liquidity zones at the NY session close.
Use as support/resistance or breakout reference.
Combine with your existing trading strategy for precision entries.
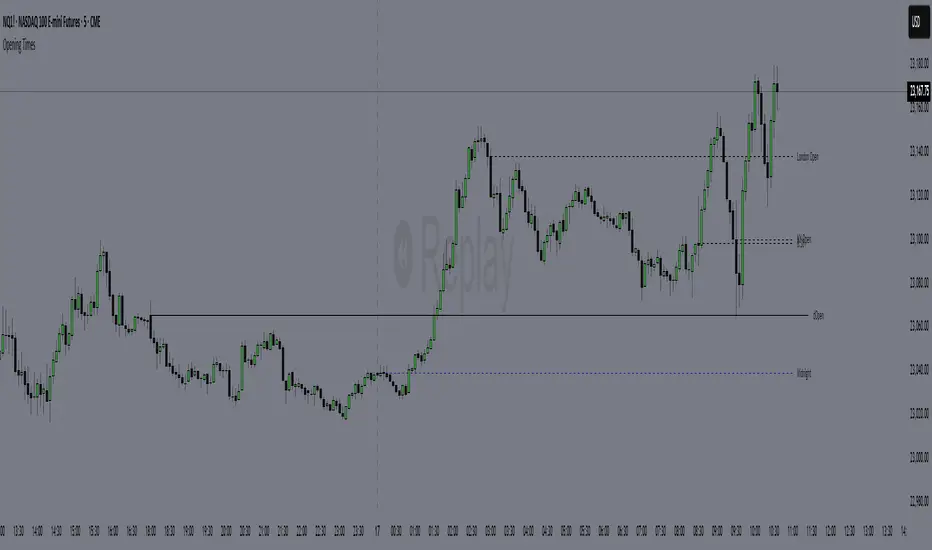
Custom Opening TimesThis indicator displays custom opening levels on your chart. Define multiple opening times, each with its own customizable style. Display these levels as horizontal lines at the opening price, or as vertical lines to mark the opening time.
Custom Opening Times
4 Independent Groups with 4 custom opening levels each
Set any custom opening time (displayed in New York Local Time)
Choose between Opening Price lines, Vertical time markers, or Both
Cutoff Times: Stop extending lines after specified times
Higher Timeframe Levels
5 Configurable HTF levels supporting any timeframe
Display opening prices from Daily, Weekly, Monthly, Quarterly, and custom timeframes
Show Previous High/Low levels from higher timeframes
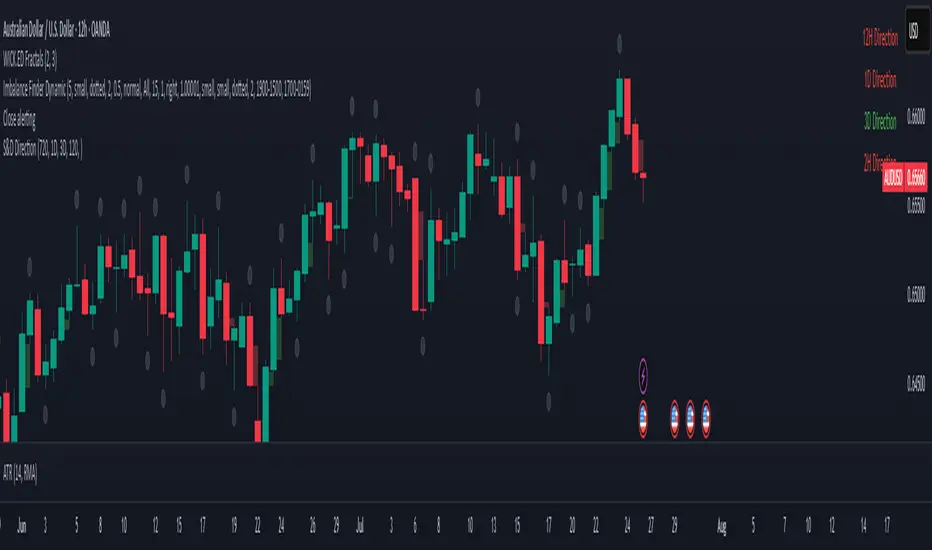
S&D DirectionThis indicator displays the most recent candle close direction for up to five custom timeframes, as selected in the settings. For each chosen timeframe, it shows whether the last confirmed candle close was bullish (close above the previous high) or bearish (close below the previous low). The indicator labels each timeframe in the top right corner, using green text for bullish closes and red for bearish closes. The displayed timeframes can be customized, and the direction (long/short) is clearly shown after each label.
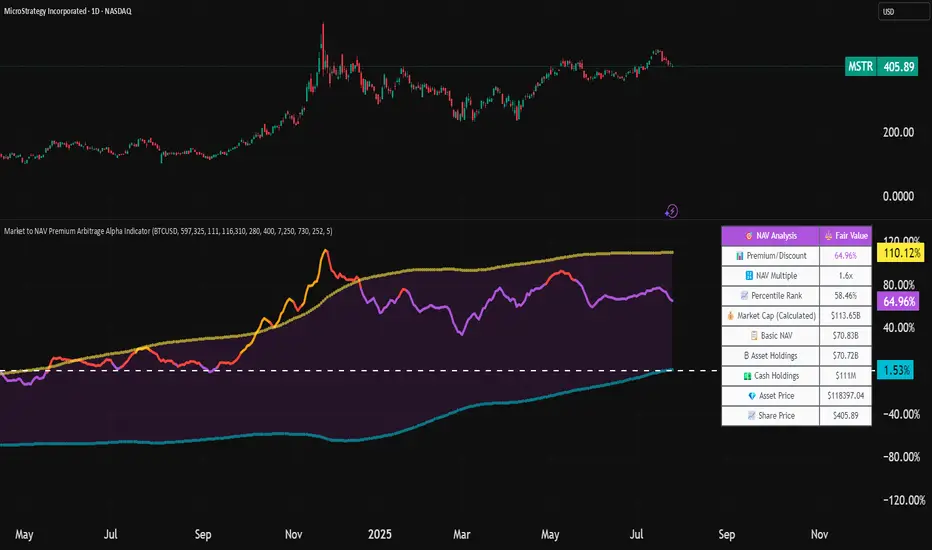
Market to NAV Premium Arbitrage Alpha IndicatorBitcoin treasury companies such as Microstrategy are known for trading at significant premiums. but how big exactly is the premium? And how can we measure it in real time?
I developed this quantitative tool to identify statistical mispricings between market capitalization and net asset value (NAV), specifically designed for arbitrage strategies and alpha generation in Bitcoin-holding companies, such as MicroStrategy or Sharplink Gaming, or SPACs used primarily to hold cryptocurrencies, Bitcoin ETFs, and other NAV-based instruments. It can probably also be used in certain spin-offs.
KEY FEATURES:
✅ Real-time Premium/Discount Calculation
• Automatically retrieves market cap data from TradingView
• Calculates precise NAV based on underlying asset holdings (for example Bitcoin)
• Formula: (Market Cap - NAV) / NAV × 100
✅ Statistical Analysis
• Historical percentile rankings (customizable lookback period)
• Standard deviation bands (2σ) for extreme value detection (close to these values might be seen as interesting points to short or go long)
• Smoothing period to reduce noise
✅ Multi-Source Market Cap Detection
• You can add the ticker of the NAV asset, but if necessary, you can also put it manually. Priority system: TradingView data → Calculated → Manual override
✅ Advanced NAV Modeling
• Basic NAV: Asset holdings + cash.
• Adjusted NAV: Includes software business value, debt, preferred shares. If the company has a lot of this kind of intrinsic value, put it in the "cash" field
• Support for any underlying asset (BTC, ETH, etc.)
TRADING APPLICATIONS:
🎯 Pairs Trading Signals
• Long/Short opportunities when premium reaches statistical extremes
• Mean reversion strategies based on historical ranges
• Risk-adjusted position sizing using percentile ranks
🎯 Arbitrage Detection
• Identifies when market pricing significantly deviates from fair value
• Quantifies the magnitude of mispricing for profit potential
• Historical context for timing entry/exit points
CONFIGURATION OPTIONS:
• Underlying Asset: Any symbol (default: COINBASE:BTCUSD) NEEDS MANUAL INPUT
• Asset Quantity: Precise holdings amount (for example, how much BTC does the company currently hold). NEEDS MANUAL INPUT
• Cash Holdings: Additional liquid assets. NEEDS MANUAL INPUT
• Market Cap Mode: Auto-detect, calculated, or manual
• Advanced Adjustments: Business value, debt, preferred shares
• Display Settings: Lookback period, smoothing, custom colors
IT CAN BE USED BY:
• Quantitative traders focused on statistical arbitrage
• Institutional investors monitoring NAV-based instruments
• Bitcoin ETF and MSTR traders seeking alpha generation
• Risk managers tracking premium/discount exposures
• Academic researchers studying market efficiency (as you can see, markets are not efficient 😉)
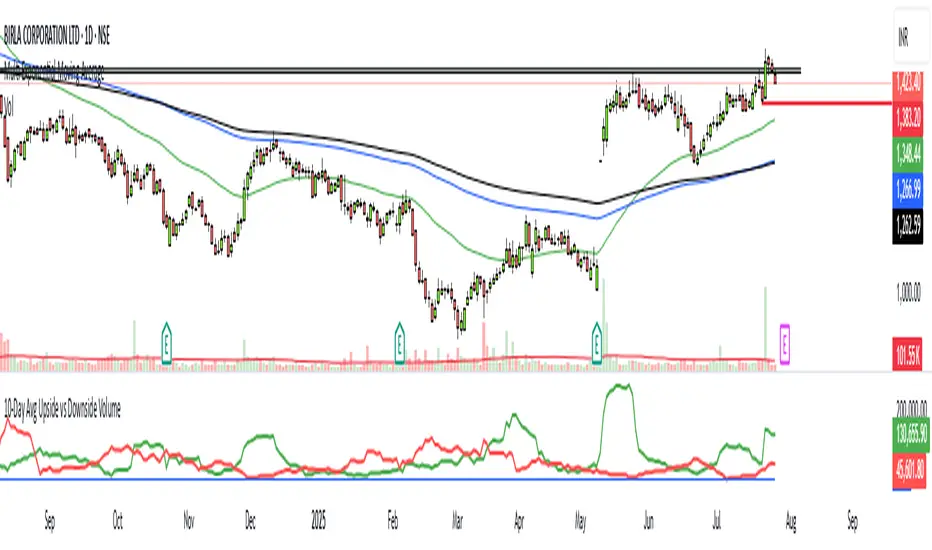
10-Day Avg Upside vs Downside VolumeUpside Volume: The total volume on days when the stock closes higher than the previous day.
Downside Volume: The total volume on days when the stock closes lower than the previous day.
It calculates the 10-day simple moving average of both upside and downside volumes.
An optional ratio line is included to visualize relative buying vs selling pressure.
RV Indicator This Pine Script defines a custom Relative Volatility (RV) Indicator, which measures the ratio of directional price movement to volatility over a specified number of bars. Below is a full explanation of what this script does.
Title:
RV Indicator — Relative Volatility Oscillator
Purpose:
This indicator measures how aggressively price is moving compared to recent volatility, and smooths the result with a signal line. It can be used to gauge momentum shifts and trend strength.
How It Works – Step by Step
1. Measuring Price Momentum (v1)
It calculates the difference between the close and open prices of the last 4 candles.
A weighted average is applied:
The current candle and the one 3 bars ago get weight 1.
The two middle candles (1 and 2 bars ago) get weight 2.
This creates a smoothed momentum measure:
If close > open (bullish), v1 is positive.
If close < open (bearish), v1 is negative.
2. Measuring Volatility (v2)
Similarly, it calculates the high-low range for the last 4 candles.
The same weighting (1, 2, 2, 1) is applied.
This gives a smoothed volatility measure.
3. Combining Momentum and Volatility (RV Ratio)
For the past ti bars (default: 10), it sums up:
All v1 values (momentum sum)
All v2 values (volatility sum)
Then it divides them:
𝑅𝑉= sum of price momentum % sum of volatility
This produces the RV value:
RV > 0: Momentum is bullish (price is generally moving up relative to its volatility).
RV < 0: Momentum is bearish (price is moving down relative to its volatility).
4. Smoothed Signal Line (rvsig)
A smoothed version of the RV is created using a weighted average of the latest 4 RV values.
This acts like a signal line, similar to how MACD uses a signal line.
Crossovers between RV and this signal line can be used to detect shifts in momentum.
5. Visual Output
Orange Line (RV): Shows the raw momentum/volatility ratio.
Blue Line (Signal): A smoother line that follows RV more slowly.
Zero Line: Divides bullish vs. bearish momentum.
How to Use It in Trading
1. Look for Crossovers:
If RV crosses above its signal line → Possible buy signal (momentum turning bullish).
If RV crosses below its signal line → Possible sell signal (momentum turning bearish).
2. Check the Zero Line:
If both RV and Signal are above zero, momentum is bullish.
If both are below zero, momentum is bearish.
3. Filter False Signals:
Combine RV with a trend filter (like a 50 or 200 EMA) to avoid trading against the main trend.
Disclaimer: This script is for informational and educational purposes only. It does not constitute financial advice or a recommendation to buy or sell any asset. All trading decisions are solely your responsibility. Use at your own risk.