Intraday Volume Pulse GSK-VIZAG-AP-INDIA📊 Intraday Volume Pulse — by GSK-VIZAG-AP-INDIA
Overview:
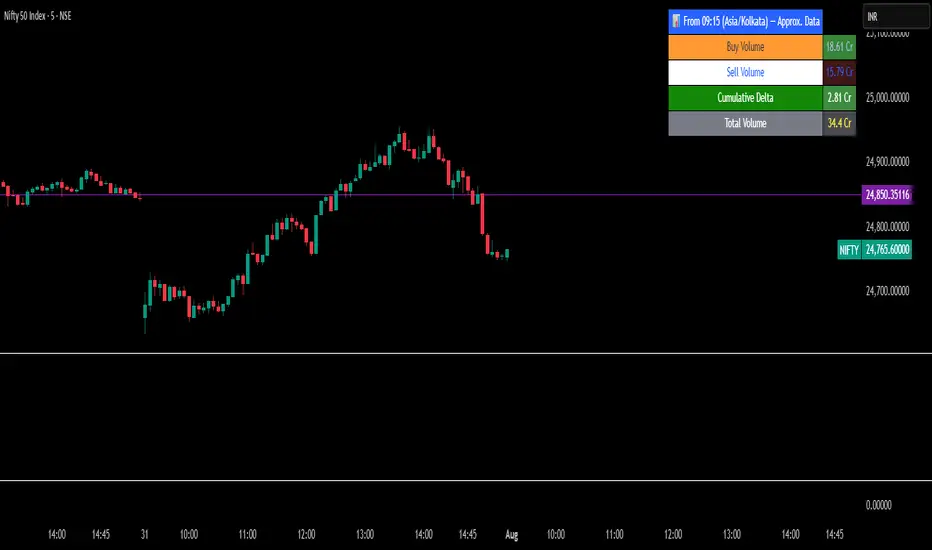
This indicator displays a simple and effective intraday volume summary in table format, starting from a user-defined session time. It provides an approximate breakdown of buy volume, sell volume, cumulative delta, and total volume — all updated in real-time.
🧠 Key Features
✅ Session Start Control
Choose the session start hour and minute (default is 09:15 for NSE).
🌐 Timezone Selector
View volume data in your preferred timezone: IST, GMT, EST, CST, etc.
📈 Buy/Sell Volume Estimation Logic
Buy Volume: When candle closes above open
Sell Volume: When candle closes below open
Equal: Volume split equally if Open == Close
🔄 Daily Auto-Reset
All volume metrics reset at the start of a new trading day.
🎨 Color-Coded Volume Insights
Buy Volume: Green shade if positive
Sell Volume: Red shade if positive
Cumulative Delta: Dynamic red/green based on net pressure
Total Volume: Neutral gray with emphasis text
🧾 Readable Number Formatting
Volumes are displayed in "K", "L", and "Cr" units for easier readability.
📌 Table Positioning
Choose from top/bottom corners to best fit your layout.
⚠️ Note
All data shown is approximate and based on candle structure — it does not reflect actual order book or tick-level data. This is a visual estimation tool to guide real-time intraday decisions.
✍️ Signature
GSK-VIZAG-AP-INDIA
Creator of practical TradingView tools focused on volume dynamics and trader psychology.
Indicators and strategies
EMA Trend Confirmation with Alerts此脚本是基于EMA 200周期 50周期 20周期加以合并并进行改进的一个脚本指标,主要作用是用于观察趋势走向,其中有上升下降和震荡趋势,经过多数测试,此指标适用于短线交易,推荐周期为20或15,大周期和长线交易详见RSI+EMA结合指标
This script is an improved script indicator based on the EMA 200 period, 50 period, and 20 period. Its main function is to observe the trend direction, including up, down, and oscillating trends. After many tests, this indicator is suitable for short-term trading, and the recommended period is 20 or 15. For large-cycle and long-term trading, please refer to the RSI+EMA combination indicator.

Market Energy – Trend vs RetestShows who is in control of the market. The red lines are sellers in control and the green are the buyers in control
Fraktály a Trendovkyal shlash dlka sklhsda hasd klnasdnlkcalknacs 654 as64asd 65ads 156as 13ads 32asd 165as

DEMACROSSOVA BY FLACODouble EMAs for entry signals
ATR Bands for stoploss
Fibonacci bollinger bands for early exit confirmation

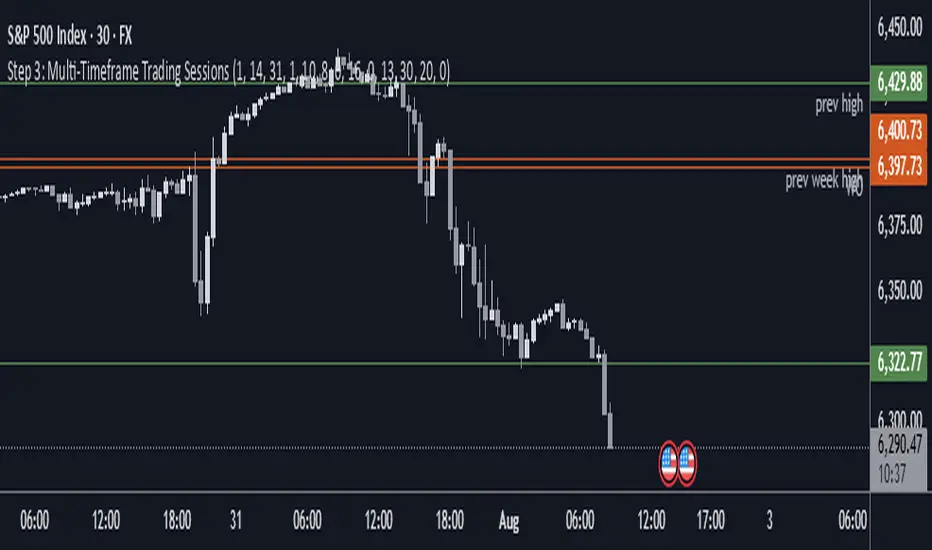
Step 3: Multi-Timeframe Trading SessionsFor editing purposes,
This is for editing purposes for developer to edit it before publishing.
Reversal Hunter X - Private v2//@version=5
indicator("Reversal Hunter X - Private v2", overlay=true)
// === INPUTS ===
rsiSource = input.source(close, "RSI Source")
rsiLen = input.int(14, "RSI Length")
rsiOB = input.int(70, "Overbought Level")
rsiOS = input.int(30, "Oversold Level")
vwapLookback = input.int(50, "VWAP Lookback for Deviation")
vwapDeviation = input.float(2.5, "VWAP Deviation Threshold (%)")
bollLen = input.int(20, "Volatility Band Length")
bollMult = input.float(2.5, "Volatility Band Multiplier")
volAvgLen = input.int(20, "Volume Average Length")
volSpikeRatio = input.float(1.3, "Volume Spike Threshold (1.3 = 30%+)")
showSignals = input.bool(true, "Show Top/Bottom Signals")
// === CALCULATIONS ===
// RSI and divergence
rsi = ta.rsi(rsiSource, rsiLen)
rsiHigh = ta.pivothigh(rsi, 3, 3)
rsiLow = ta.pivotlow(rsi, 3, 3)
priceHigh = ta.pivothigh(high, 3, 3)
priceLow = ta.pivotlow(low, 3, 3)
bearDiv = (not na(rsiHigh) and not na(priceHigh)) and rsiHigh < rsi and priceHigh > high
bullDiv = (not na(rsiLow) and not na(priceLow)) and rsiLow > rsi and priceLow < low
// VWAP Deviation
vwap = ta.vwap
vwapDev = ((close - vwap) / vwap) * 100
vwapOver = vwapDev > vwapDeviation
vwapUnder = vwapDev < -vwapDeviation
// Volatility Bands (like Bollinger Bands)
basis = ta.sma(close, bollLen)
dev = bollMult * ta.stdev(close, bollLen)
upperBand = basis + dev
lowerBand = basis - dev
// SFP trap detection
sfpTop = high > ta.highest(high, 20) and close < open and close < high
sfpBottom = low < ta.lowest(low, 20) and close > open and close > low
// === Trend Filter ===
ema200 = ta.ema(close, 200)
bullTrend = close > ema200
bearTrend = close < ema200
// === Volume Filter ===
volAvg = ta.sma(volume, volAvgLen)
volSpike = volume > (volAvg * volSpikeRatio)
// === FINAL SIGNAL CONDITIONS ===
topSignal = bearDiv and vwapOver and close > upperBand and sfpTop and bearTrend and volSpike
bottomSignal = bullDiv and vwapUnder and close < lowerBand and sfpBottom and bullTrend and volSpike
// === PLOTS ===
plotshape(showSignals and topSignal, title="Top Signal", location=location.abovebar, color=color.red, style=shape.labeldown, text="TOP")
plotshape(showSignals and bottomSignal, title="Bottom Signal", location=location.belowbar, color=color.green, style=shape.labelup, text="BOTTOM")
plot(ema200, title="EMA 200", color=color.orange)
// === ALERTS ===
alertcondition(topSignal, title="Top Signal Alert", message="Reversal Hunter X: TOP Signal")
alertcondition(bottomSignal, title="Bottom Signal Alert", message="Reversal Hunter X: BOTTOM Signal")

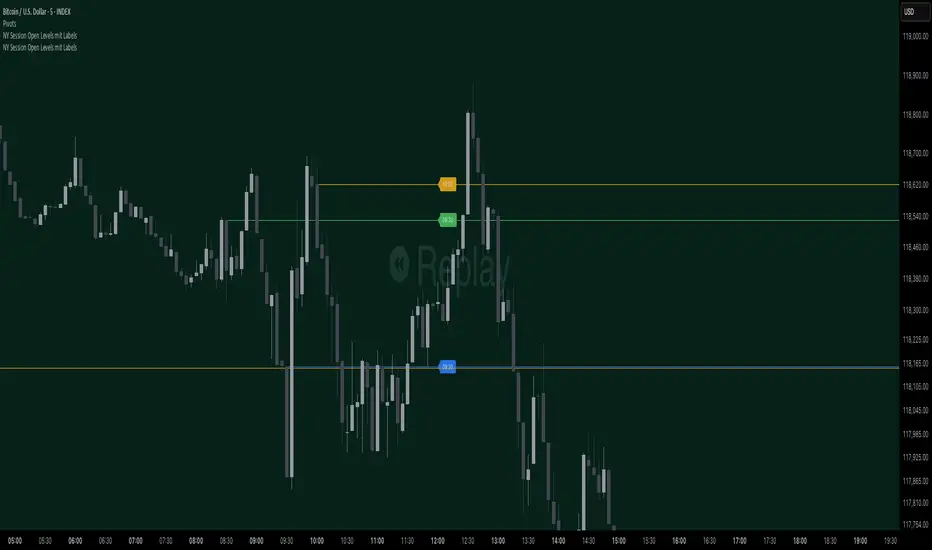
NY Session Open Levels This indicator automatically draws horizontal lines at the opening prices of the New York trading session at 08:30, 09:30, and 10:00 AM NY time. Each line is labeled and extended to the right, providing clear reference points for key intraday levels. The lines and labels reset daily and are ideal for identifying reaction zones during the early U.S. trading hours.

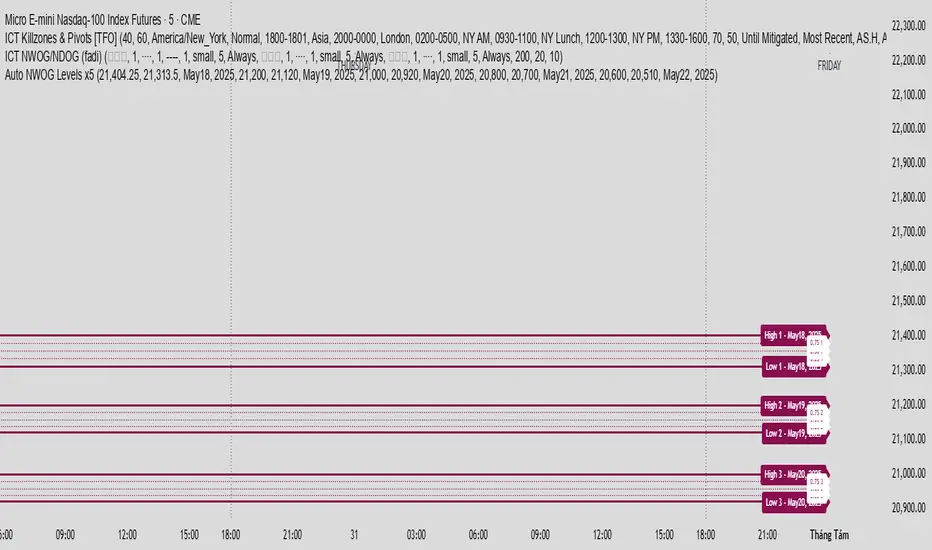
Auto NWOG Levels x5Indicator Name: Auto NWOG Levels with Labels
Description:
This indicator automatically plots the NWOG (Naked Weekly Open Gap) price levels on your chart. It includes:
NWOG High & Low: Solid maroon lines representing the high and low boundaries of the NWOG zone.
Intermediate Levels: Dotted maroon lines at 25%, 50%, and 75% levels within the NWOG range, providing visual guidance for possible support/resistance zones.
Labels: Each level is labeled on the right side of the chart, including a customizable date label for context.
Extendable Lines: All lines extend horizontally for a customizable number of bars (default: 500 bars) for better visibility over time.
Inputs:
NWOG High: Price level of the NWOG high.
NWOG Low: Price level of the NWOG low.
Date Label: Text to be displayed on the labels (e.g., the week of the NWOG).
This tool is useful for traders who monitor weekly price gaps and want clear, persistent levels drawn automatically on their charts.
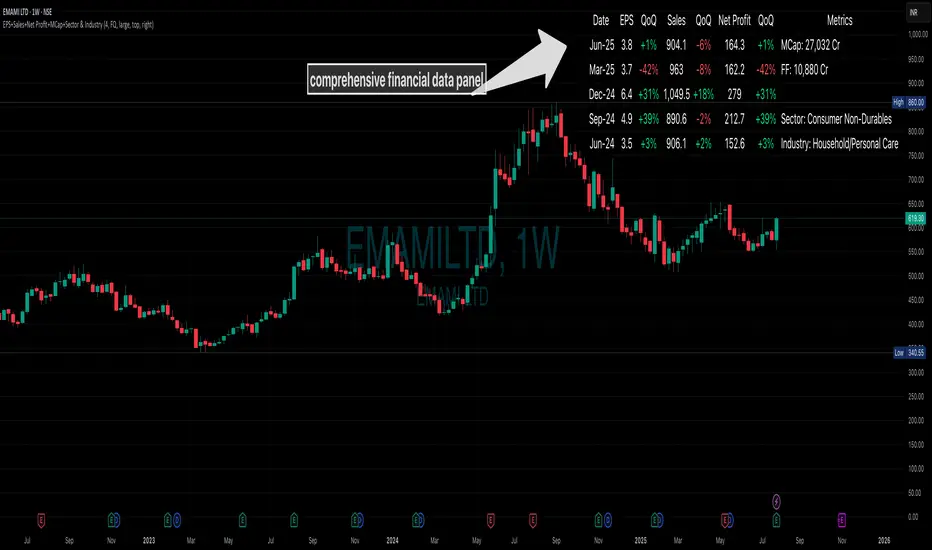
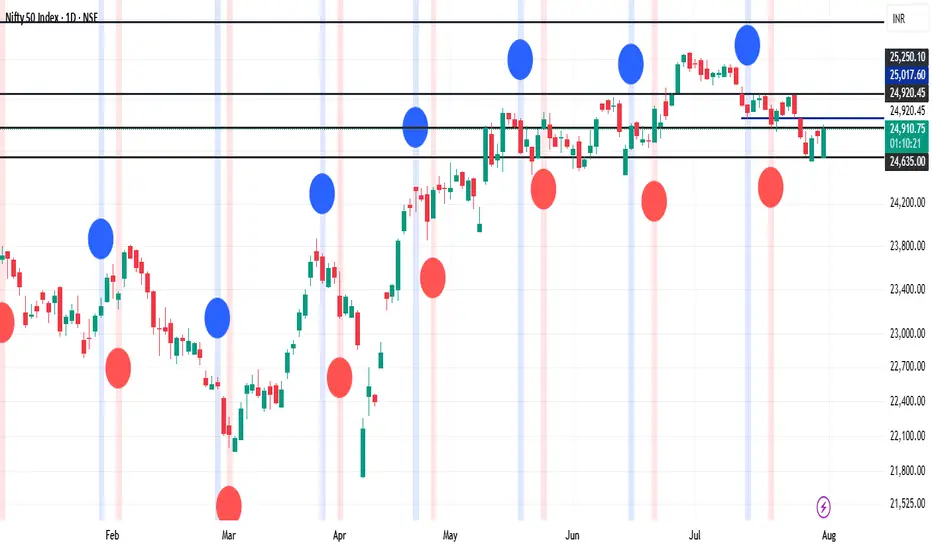
EPS+Sales+Net Profit+MCap+Sector & Industry📄 Full Description
This script displays a comprehensive financial data panel directly on your TradingView chart, helping long-term investors and swing traders make informed decisions based on fundamental trends. It consolidates key financial metrics and business classification data into a single, visually clear table.
🔍 Key Features:
🧾 Financial Metrics (Auto-Fetched via request.financial):
EPS (Earnings Per Share) – Displayed with trend direction (QoQ or YoY).
Sales / Revenue – In ₹ Crores (for Indian stocks), trend change also included.
Net Profit – Also in ₹ Crores, along with percentage change.
Market Cap – Automatically calculated using outstanding shares × price, shown in ₹ Cr.
Free Float Market Cap – Based on float shares × price, also in ₹ Cr.
🏷️ Sector & Industry Info:
Automatically identifies and displays the Sector and Industry of the stock using syminfo.sector and syminfo.industry.
Displayed inline with metrics, making it easy to know what business the stock belongs to.
📊 Table View:
Compact and responsive table shown on your chart.
Columns: Date | EPS | QoQ | Sales | QoQ | Net Profit | QoQ | Metrics
Metrics column dynamically shows:
Market Cap
Free Float
Sector (Row 4)
Industry (Row 5)
🌗 Appearance:
Supports Dark Mode and Mini Mode toggle.
You can also customize:
Number of data points (last 4+ quarters or years)
Table position and size
🎯 Use Case:
This script is ideal for:
Fundamental-focused traders who use EPS/Sales trends to identify momentum.
Swing traders who combine price action with fundamental tailwinds.
Portfolio builders who want to see sector/industry alignment quickly.
It works best with fundamentally sound stocks where earnings and profitability are a major factor in price movements.
✅ Important Notes:
Script uses request.financial which only works with supported symbols (mostly stocks).
Market Cap and Free Float are calculated in ₹ Crores.
All financial values are rounded and formatted for readability (e.g., 1,234 Cr).
🙏 Credits:
Developed and published by Sameer Thorappa
Built with a clean, minimalist approach for high readability and functionality.
Moving Average RibbonMoving Averages creating a what I call internally a "ribbon". Rename as see fit.

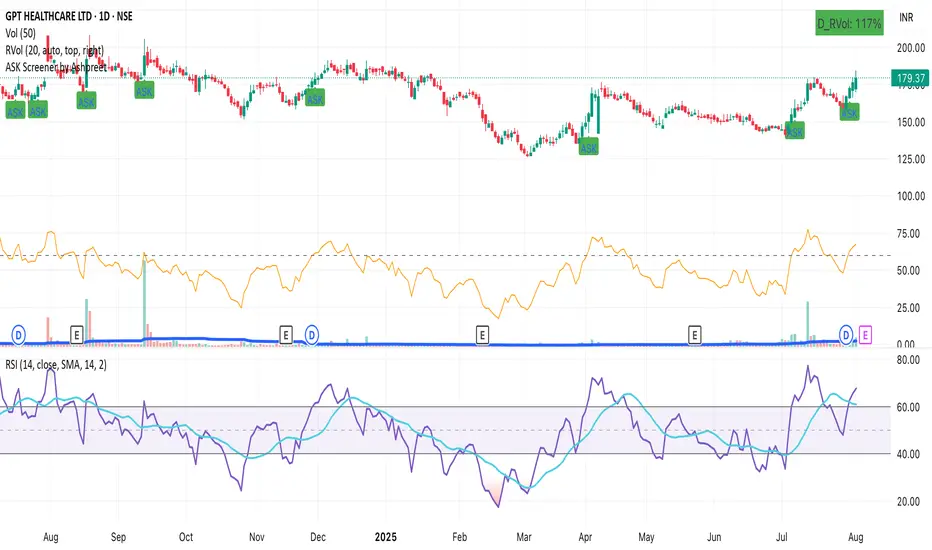
ASK Screener by AshpreetThe ASK Indicator is a custom-built breakout and trend continuation system designed for swing traders seeking high-probability entries with strong risk-reward ratios. Built using a combination of moving averages, momentum filters, volume confirmation, and price structure, this indicator helps identify stocks poised for explosive moves.
It uses three key moving averages: the 44-period SMA (medium trend), 20-period DEMA (short-term strength, custom-coded), and 50-period WEMA (institutional trendline). Trades are only triggered when the price is above 50 WEMA, and the 20 DEMA is above the 44 SMA.
Momentum is confirmed using RSI(14) within a healthy zone of 40–60, ensuring the stock is not overbought or oversold. To focus on breakout candidates, the stock must be trading within 10% of its 52-week high, and the weekly candle range must be under 10%, signaling compression before expansion.
A valid ASK Signal occurs when these conditions are met along with a breakout above the previous day’s high and volume exceeding 1.5× the 20-day average. Once triggered, the indicator auto-plots the stop-loss (1× ATR) and two profit targets: 1:2 (TP1) and 1:4 (TP2).
Additionally, the system detects a narrow range setup, where the last 3 daily candles are inside the previous 3-day range — a powerful consolidation signal. Alerts for both ASK entries and narrow ranges are included.
This system is ideal for positional and short-term swing traders who want to combine structure, momentum, and volume in one powerful tool.
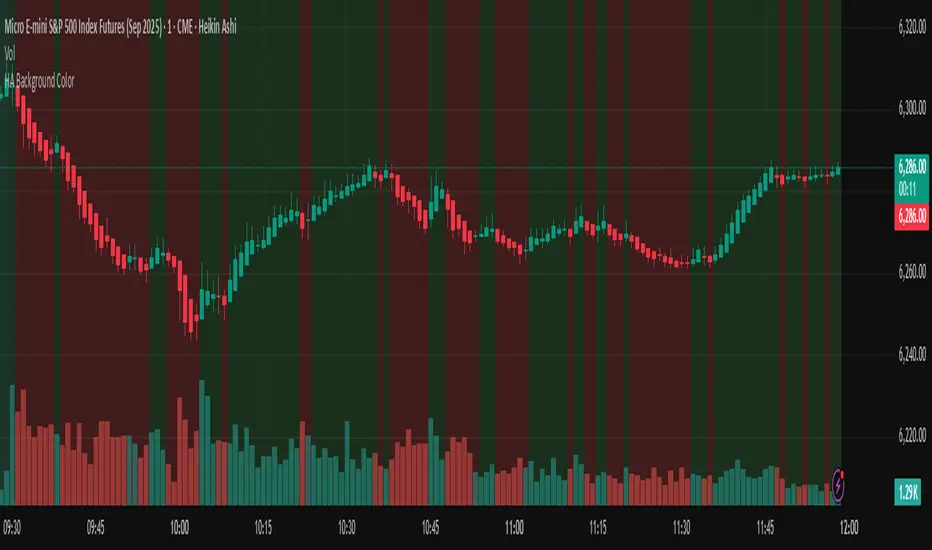
HA Background ColorThis indicator colors the entire chart background based on the current Heikin Ashi candle direction:
🟩 Green background = Bullish Heikin Ashi candle
🟥 Red background = Bearish Heikin Ashi candle
NY Session Open Levels mit LabelsThis indicator automatically draws horizontal lines at the opening prices of the New York trading session at 08:30, 09:30, and 10:00 AM NY time. Each line is labeled and extended to the right, providing clear reference points for key intraday levels. The lines and labels reset daily and are ideal for identifying reaction zones during the early U.S. trading hours.

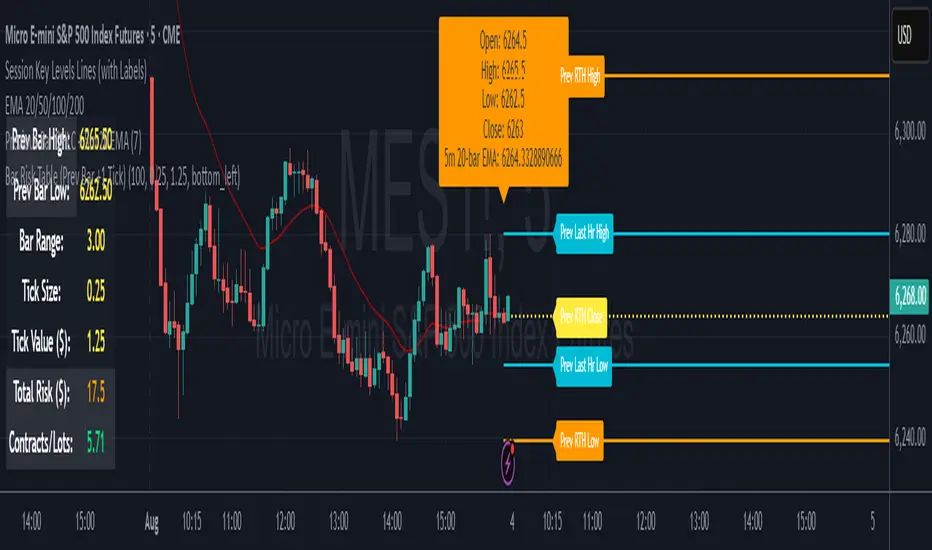
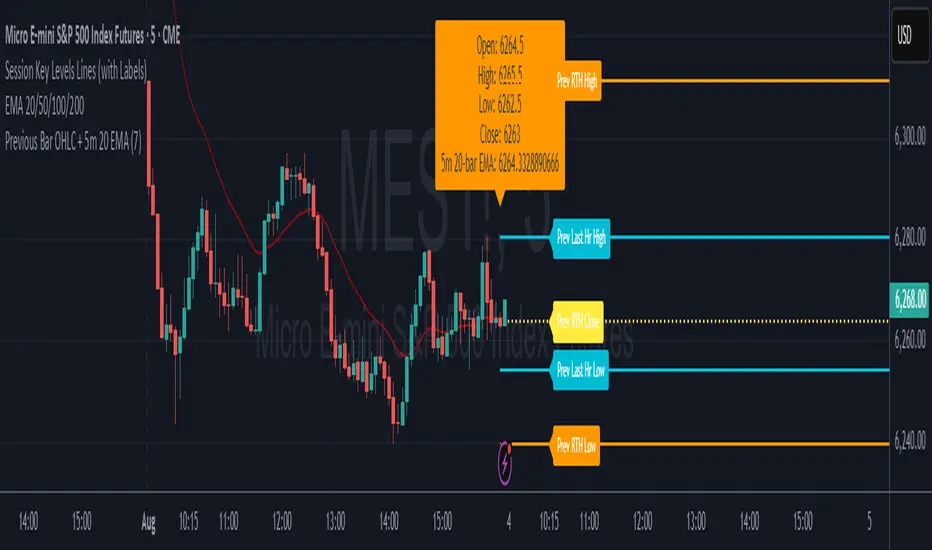
7* Previous Bar OHLC + 5m 20 EMAincreased label height for 7* Previous Bar OHLC + 5m 20 EMA. hope it helps :)
ALPHA 999This indicator is designed to provide traders with clear and reliable signals by combining essential technical tools into one simplified framework. Whether you’re trading crypto, stocks, or forex, this tool helps identify potential entry and exit points using . It is well-suited for both intraday and swing traders, offering customizable inputs, multi-timeframe compatibility, and real-time alerts. The indicator displays intuitive visual cues directly on the chart, making it easy to interpret market conditions and respond quickly. Ideal for traders who prefer clean charts with actionable signals, this tool enhances decision-making without overwhelming complexity. While powerful on its own, it can be paired with other indicators for greater confirmation and accuracy. Please note: this indicator is for educational purposes only and should be used with proper risk management and backtesting before applying to live trades.
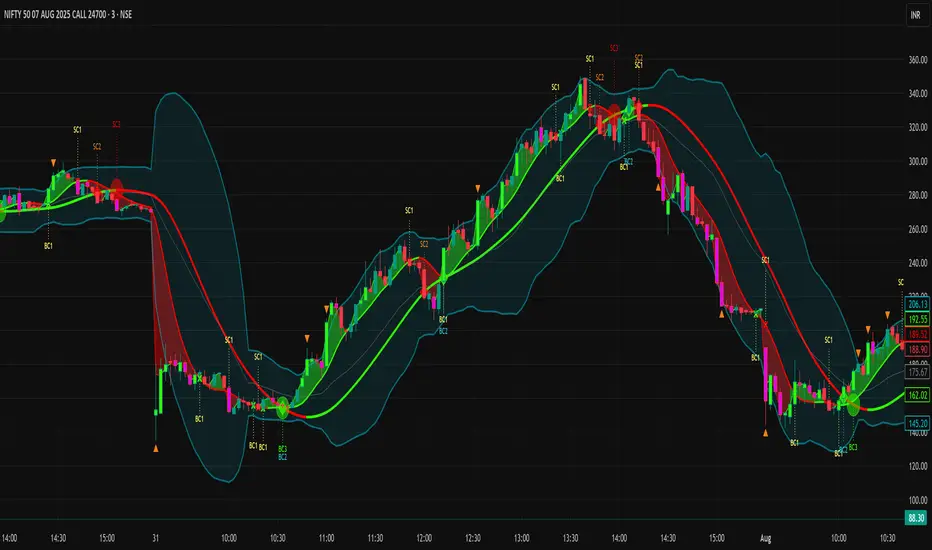
GCM Volatility-Adaptive Trend ChannelScript Description
Name: GCM Volatility-Adaptive Trend Channel (GCM VATC)
Overview
The GCM Volatility-Adaptive Trend Channel (VATC) is a comprehensive trading tool that merges the low-lag, smooth-trending capabilities of the Jurik Moving Average (JMA) with the classic volatility analysis of Bollinger Bands (BB).
By displaying both trend and volatility in a single, intuitive interface, this indicator aims to help traders see when a trend is stable versus when it's becoming volatile and might be poised for a change.
Core Components:
JMA Trend System: At its core are three dynamically colored JMA lines (Baseline, Fast, and Slow) that provide a clear view of trend direction. The lines change color based on their slope, offering immediate visual feedback on momentum. A colored ribbon between the Baseline and Fast JMA visualizes shorter-term momentum shifts.
Standard Bollinger Bands: Layered on top are standard Bollinger Bands. Calculated from the price, these bands serve as a classic measure of market volatility. They help identify periods where the market is expanding (high volatility) or contracting (low volatility).
How to Use It
By combining these two powerful concepts, this indicator provides a unified view of both trend and volatility. It can help traders to:
Identify the primary trend direction using the smooth JMA lines.
Gauge the strength and stability of that trend.
See when the market is becoming volatile (bands widening) or consolidating (bands contracting), which can often precede a significant price move or a change in trend.
A Note on Originality & House Rules Compliance
This indicator does not introduce a new mathematical formula. Instead, its strength lies in the thoughtful combination of two well-respected, publicly available concepts: the Jurik Moving Average and Bollinger Bands. The JMA implementation is a standard public version. The goal was to create a practical, all-in-one tool for trend and volatility analysis.
This script is published as fully open-source in compliance with TradingView's House Rules. It utilizes standard, publicly available algorithms and does not contain any protected or hidden code.
Settings
All lengths, sources, and colors for the JMA lines and Bollinger Bands are fully customizable in the settings menu, allowing you to tailor the indicator to your specific trading style and asset.
I hope with this indicator Traders even Beginner can can control their emotions which increase the probabilities of the winning rates and cutting the losing strength
Purposely I Didn't plant the High low or Buy Sell signals in the chart. Because everything is in the chart where volatility Signal with the Bollinger Band and Buy Sell Signal in the JMA Dynamic colors. and that's enough to decide when to take trade and when not to.
Thank You and Happy Trading
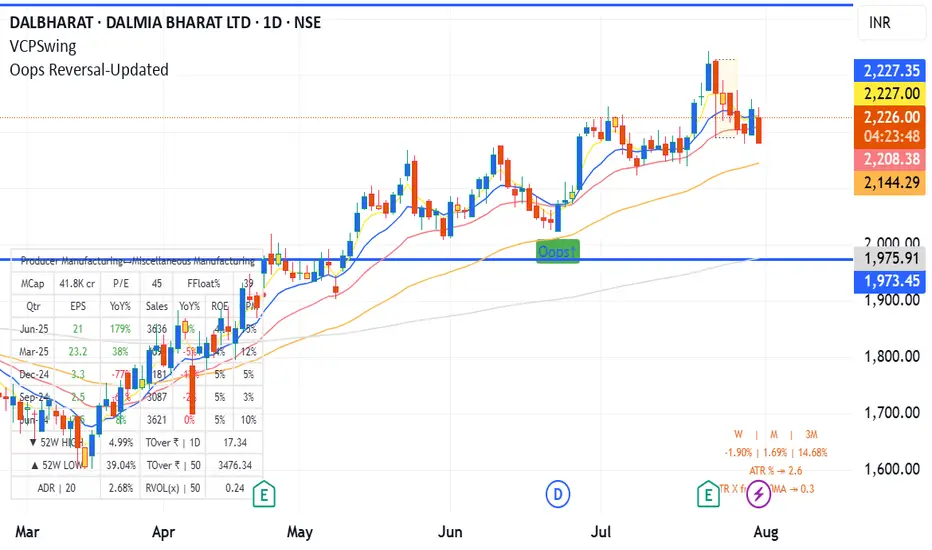
Oops Reversal-Updatedoops reversal - manas arora updated to cover only if it closes above previous day high
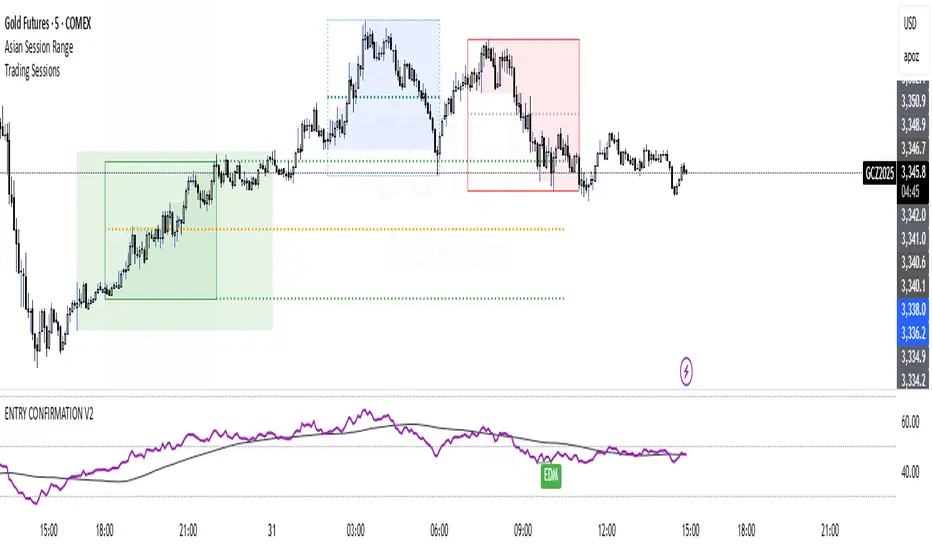
ENTRY CONFIRMATION V2An indicator from candle man. Helps determine whether supply and demand zone are truly supply or demand.