Indexrate Code SMIndexrate Code SM is an indicator and part of the Indexrate Code Set of Algorithm, which additionally includes the Indexrate Code A strategy and Indexrate Code B indicator.
The Indexrate Code Set of Algorithms can be used for any trading instruments and on any existing markets (Stock market, Forex, Cryptocurrency market, etc.).
Getting access to the Indexrate Code A strategy, you gain access to the whole set of Indexrate Code algorithms.
Indexrate Code SM is an indicator, based on the Smart Money concept. Smart money is large market participants with sufficient volumes to influence the price. This is a small group that includes banks and large funds. Their every move is controlled down to the smallest detail. In the modern world, this is done with the help of artificial intelligence and other complex algorithms that move the price to certain values. Unique programs that lower and raise the price are effective because they know the behavior of people, which will invariably be based on fear and greed.
On the other side are the majority of traders, including us - this is uninformed money. This group includes retail traders and small funds. Residents of this group believe that due to their numbers, they move the market. But in fact, the retail sector cannot have any influence on the price. This is due to low volumes: a large group in monetary terms is not as large as it may seem. Large volumes that can do this are in a small group - smart money. Retail traders are too small and make up only a small percentage of the money in circulation on the market (~5%), so the main target for smart capital is always funds.
Smart Money is following large market participants. With the help of this concept and its tools, you can identify and track the actions of smart money. As long as there is liquidity in the market, the concept will be effective in application.
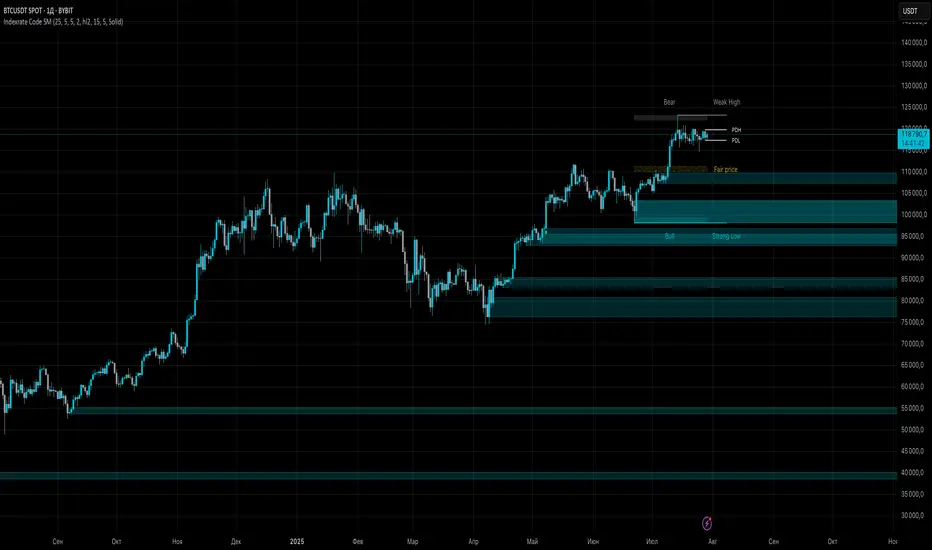
Indexrate Code SM consists of a set of signals displayed on the chart, configured in a unique way to interact with each other and allowing traders to comprehensively analyze the movement of the asset price.
The indicator displays the zones of interest of "bulls" and bears", which are highlighted with lines of the corresponding color. Where gray is the zone of "bears", and blue is the zone of "bulls". When these zones are broken, the indicator displays the corresponding signals to buy or sell.
The indicator also displays the zone of fair price, highlighting it in yellow. This zone acts as a conditional magnet in the event of a price rebound from the zones of interest.
In addition, the indicator displays the zone of the greatest local interest of buyers (storng high) and sellers (weak low). When the zone of fair price is broken, the asset often rushes to these local levels. From which a rebound often occurs, both during a reversal of movement and during a breakout.
The lines of the previous daily high (PDH) and the previous daily low (PDL) give traders an understanding of the intraday range of price movement.
The Indexrate Code SM integrates the Sequential and Trend HMA trend algorithms, known to us from the Indexrate Code A strategy. By default, these algorithms are not displayed on the chart (you can enable the display in the settings), since they are displayed in the strategy, but they continue to work inside the indicator to establish more accurate signals to buy or sell. The settings of these algorithms are identical to the settings displayed in the Indexrate Code A strategy.
The search for optimal signal settings includes the time structure, that is, the period for which the calculation and search for areas of interest are carried out. As well as the number of order blocks.
drive.google.com
The settings of the Sequential and Trend HMA trend algorithms are aimed at eliminating false signals as much as possible.
drive.google.com
The signals on the chart are displayed as green dots for buying and red dots for selling.
Provided that the Indexrate Code A strategy is configured most successfully, the appearance of a confirmation signal can provide the potential probability of the strongest price movement.
It is also worth considering that when working with the Heiken Ashi chart, for which the Indexrate Code Set of Algorithm works, you must install OHLC as shown in the screenshot below. Since this parameter allows you to take into account real exchange prices, without calculating average Heiken Ashi values, which can mislead the trader regarding the current state of the market. And also take into account the percentage of the exchange commission and the On bar close parameter.
telegra.ph
The Indexrate Code Set of Algorithms is suitable for conservative traders who evaluate their success in the long term, and not in short-term excess profits.
IT IS IMPORTANT TO KNOW that no indicator is capable of 100% predicting a successful trade.
The market is a collection of people. It is thanks to human psychology that shapes the forces of supply and demand that financial markets exist (Charles Dow Theory).
Forecasting based on the analysis of mathematical algorithms (indicators) uses data from past trading - the price of the previous period of time and the volume of previous trading. It is these two indicators that are used by modern technical analysis.
The Indexrate Code Set of Algorithm is based on algorithms that evaluate trends, prices and volume indicators. As well as human psychology, which requires an assessment of the exact preceding periods for a specific timeframe, and not an assessment of the entire period from the moment of listing of a trading instrument on a specific exchange. Since market indicators completely change throughout the trading period and the exchange trading volume also changes.
All updates to the Indexrate Code Set of Algorithm will be free.
Trading is trading on probabilities. Investing is trading on opportunity. Nobody knows the future - Always protect your profits!
Russian translation
Indexrate Code SM - это индикатор являющийся частью Комплекта алгоритмов Indexrate Code, включающего в себя дополнительно стратегию Indexrate Code А и индикатор Indexrate Code B.
Комплект алгоритмов Indexrate Code, может быть использован для любых торговых инструментов и на любых существующих рынках (Фондовый рынок, Форекс, Криптовалютный рынок и тд).
Получая доступ к индикатору Indexrate Code SM, вы получаете доступ ко всему комплекту алгоритмов Indexrate Code.
Indexrate Code SM это индикатор, основанный на концепции Smart Money. Умные деньги — это крупные участники рынка, имеющие достаточные объемы, чтобы оказывать влияние на цену. Это небольшая группа, в которую входят банки и крупные фонды. Каждое их движение, до мельчайших деталей контролируется. В современном мире это делается с помощью искусственного интеллекта и других сложных алгоритмов, которые двигают цену на определенные значения. Уникальные программы, которые опускают и поднимают цену, эффективны, потому что они знают поведение людей, которое неизменно будет основываться на страхе и жадности.
По другую сторону находится большинство трейдеров, включая нас – это не информированные деньги. В такую группу входят ритейл трейдеры и небольшие
фонды. Резиденты такой группы считают, что из-за их численности они двигают рынок. Но на самом деле розничный сектор не может оказывать никакого влияния на цену. Обуславливается это низкими объемами: большая группа в денежном эквиваленте не так уж велика, как может показаться. Крупные объемы, способные это делать, находятся в небольшой группе — умных денег. Ритейл трейдеры слишком малы и составляют только небольшой процент обращаемых денег на рынке (~5%), поэтому основной целью для умного капитала всегда выступают фонды.
Smart Money это следование за крупными участниками рынка. С помощью
этой концепции и ее инструментов, вы сможете идентифицировать и отслеживать действия умных денег. Пока на рынке будет ликвидность, до тех пор концепция будет эффективна в применении.
Indexrate Code SM состоит из совокупности отображаемых сигналов на графике, настроенных уникальным образом для взаимодействия между собой и позволяющих трейдерам комплексно анализировать движение цены актива.
Индикатор отображает зоны интереса «быков» и медведей», которые подсвечиваются линиями соответствующего цвета. Где серый это зона «медведей», а голубой это зона «быков». При прорыве этих зон, индикатор отображает соответствующие сигналы на покупку или на продажу.
Также индикатор отображает зону справедливой цены, подсвечивая ее желтым цветом. Данная зона выступает в качестве условного магнита, в случае отскока цены от зон интереса.
Дополнительно на индикаторе отображены зона наибольшего локального интереса покупателей (storng high) и продавцов (weak low). При прорыве зоны справедливой цены, актив чаще устремляется именно к этим локальным уровням. От которых зачастую происходит отскок, как и при развороте движения, так и при пробитии.
Линии предыдущего дневного хая (PDH) и предыдущего дневного лоя (PDL), дают трейдерам понимание внутридневного диапазона движения цены.
В Indexrate Code SM интегрированы трендовые алгоритмы Sequential и Trend HMA, известные нам по стратегии Indexrate Code A. По умолчанию данные алгоритмы не отображаются на графике (можно включит отображение в настройках), так как они отображены в стратегии, но продолжают работать внутри индикатора, для установления более точных сигналов на покупку или продажу. Настройки указанных алгоритмов идентичны, настройкам, отображаемым в стратегии Indexrate Code A.
Поиск оптимальных настроек сигналов, включает в себя структуру времени, то есть период, за который идет расчет и поиск зон интереса. А также количество ордер блоков.
drive.google.com
Настройки трендовых алгоритмов Sequential и Trend HMA, направлены для максимального исключения ложных сигналов.
drive.google.com
Сигналы на графике отображены точками зеленого цвета на покупку и красного цвета на продажу.
При условии наиболее удачной настройки стратегии Indexrate Code A, появление подтверждающего сигнала, может давать потенциальную вероятность наиболее сильного движения цены.
Стоит также учесть, что при работе с графиком Heiken Ashi, для которого работает Комплект алгоритмов Indexrate Code, необходимо устанавливать OHLC как показано ниже на скриншоте. Поскольку этот параметр позволяет учитывать реальные биржевые цены, без расчета усредненных значений Heiken Ashi, которые могут ввести трейдера в заблуждение относительно текущего состояния рынка. А также учитывать процент комиссии биржи и параметр On bar close.
telegra.ph
Комплект алгоритмов Indexrate Code, подходит консервативным трейдерам, оценивающим свой успех в долгосрочном перспективе, а не в краткосрочной сверх прибыли.
ВАЖНО ЗНАТЬ, что ни один индикатор не способен на 100% предсказать успешную сделку.
Рынок - это совокупность людей. Именно благодаря психологии людей, формирующей силы спроса и предложения, существуют финансовые рынки (Теория Чарльза Доу).
Прогнозирование на основе анализа математических алгоритмов (индикаторов), использует данные прошлых торгов - цену предыдущего периода времени и объем предыдущих торгов. Именно эти два показателя и используются современным техническим анализом.
В основе Комплекта алгоритмов Indexrate Code, лежат алгоритмы оценивающие тенденции, цены и показатели объема. А также психология людей, которая требует оценки точных предшествующих периодов для конкретного таймфрейма, а не оценка всего периода с момента листинга торгового инструмента на конкретной бирже. Так как показатели рынка полностью изменяются на всем торговом периоде и также меняется биржевой объем торгов.
Все обновления Комплекта алгоритмов Indexrate Code, будут бесплатны.
Трейдинг - это торговля на вероятностях. Инвестиции - это торговля на возможностях. Никто не знает будущего - Всегда защищайте свою прибыль.
Indicators and strategies
Pi Cycle | AlchimistOfCryptoPi Cycle Top Indicator - A Powerful Market Phase Detector
Developed by AlchimistOfCrypto
🧪 The Pi Cycle uses mathematical harmony to identify Bitcoin market cycle tops
with remarkable precision. Just as elements react at specific temperatures,
Bitcoin price behaves predictably when these two moving averages converge! 🧬
⚗️ The formula measures when the 111-day SMA crosses below the 350-day SMA × 2,
creating a perfect alchemical reaction that has successfully identified the
major cycle tops in 2013, 2017, and 2021.
🔬 Like the Golden Ratio in nature, this indicator reveals the hidden
mathematical structure within Bitcoin's chaotic price movements.
🧮 When the reaction occurs, prepare for molecular breakdown! 🔥

Keltner Channels MTFKeltner Channels MTF | Adapted 🌌
Navigate the market’s wild waves with these Keltner Channels, a sleek spin on AlchimistOfCrypto’s Bollinger Bands! This Pine Script v6 indicator tracks price action like a radar, highlighting trends with scientific precision. 🧪
Key Features:
Customizable Channels: Adjust period and multiplier to map market volatility, signaling potential reversals when prices hit the upper or lower bands. 📈
MA Options: Switch between Exponential or Simple Moving Average for trend clarity. ⚙️
Band Styles: Select Average True Range, True Range, or Range to define volatility edges. 📏
Glow Effect: Illuminate bands with 8 vibrant themes (Neon, Grayscale, etc.) for visual pop. ✨
Trend Signals: Spot bullish/bearish shifts with glowing circles, flagging momentum changes. 💡
Alerts: Catch price breakouts or trend reversals at band edges, warning of potential market U-turns. 🚨
Perfect for traders decoding market trends with a touch of cosmic style! 🌠

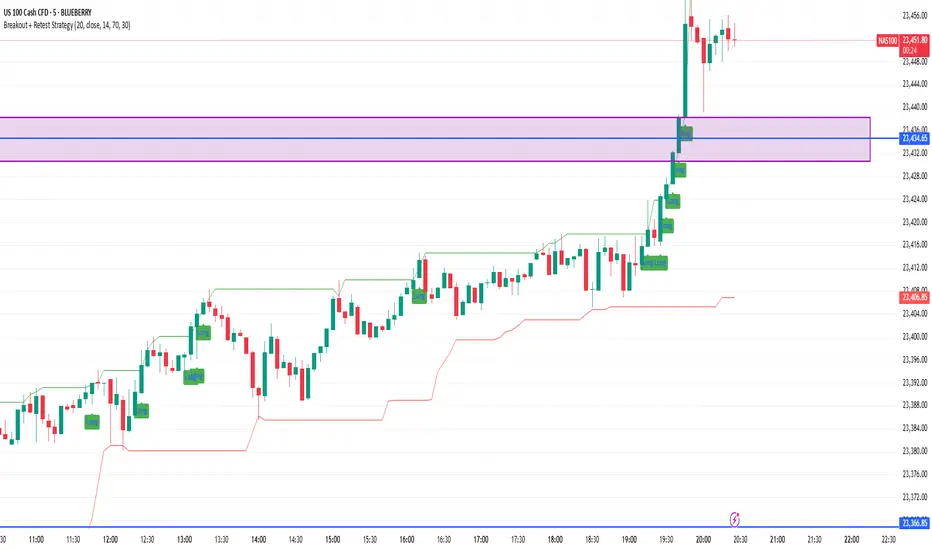
Breakout + Retest StrategyThe Breakout + Retest Strategy is a proven price action approach used by professional traders to catch high-probability market moves after key levels are broken. This strategy aims to enter the market after confirmation — reducing false breakouts and improving entry accuracy.
🔍 Strategy Logic:
Identify a Key Support or Resistance Level
These could be recent swing highs/lows, consolidation zones, or session highs.
Wait for a Clean Breakout
Price must decisively break above resistance or below support with strong momentum.
Watch for the Retest
After the breakout, wait for the price to pull back to the broken level (now flipped support/resistance).
Enter on Retest Confirmation
Look for signs like rejection wicks, bullish/bearish engulfing candles, or strong volume on the retest.
Set Risk-Managed Stops and Targets
Stop loss goes below (for long) or above (for short) the retested level.
Target is usually set at a 1:2 or higher risk-to-reward ratio, or based on structure.
✅ Why It Works:
Filters out fake breakouts
Uses market structure and liquidity traps to your advantage
Combines both momentum and confirmation
⚙️ Best Timeframes:
15-minute to 1-hour for intraday setups
4-hour and daily for swing trades
📊 Ideal for:
Futures (NQ, ES, Gold)
Forex pairs
Crypto
Stocks near key earnings or breakout zones
ZFT ClassicThis is the classic ZFT MAs that can be used by ZFT students to determine if a chart is in an uptrend, downtrend, or sideways movement within a short, medium, or long term timeframe.

Zeefreaks Predator Mask CryptoMade by Zeefreaks, for his dear students so when they see a chart, they can easily identify if it is a buy or sell within a minute.

2 Asset Optimal PortfolioThis script calculates and plots either the Sharpe Ratio or Sortino Ratio for a two-asset portfolio using historical price data, allowing users to analyse how different allocations affect portfolio performance over a specified lookback period.
Features:
Determine the weights of 2 assets and how they affect the the Sharpe or Sortino ratio.
Adjust timeframe to suit your personal investment timeframe.
User Inputs:
1. Asset 1 and Asset 2: Choose any two symbols to evaluate (default is BTCUSD for both).
2. Look Back Length: Number of past bars (days) to use for calculations (default is 365).
3. Source: Price source for returns (default is close).
4. Ratio: Select which ratio to plot — Sharpe or Sortino.
5. % of Asset 1: Portfolio weight (from 0 to 1) for Asset 1.

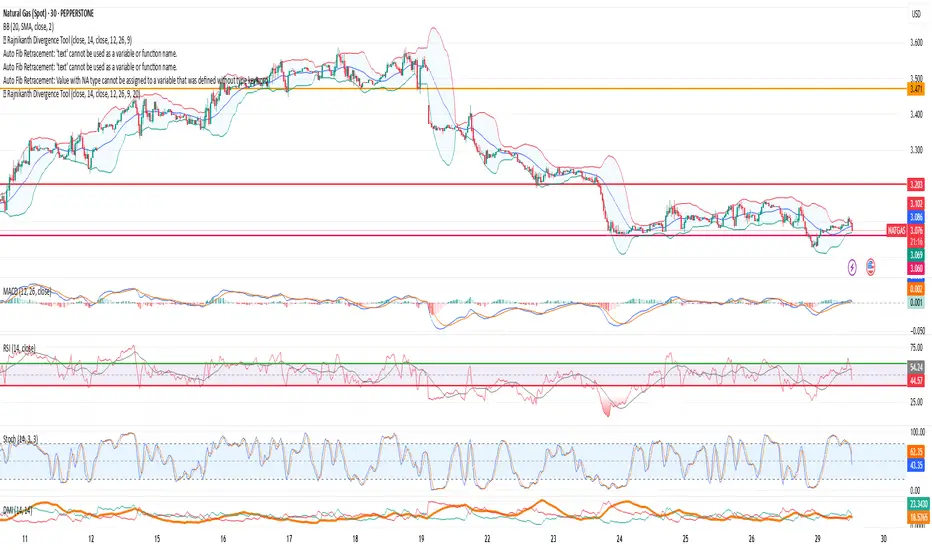
🕴 Rajnikanth Divergence Tool//@version=5
indicator("🕴 Rajnikanth Divergence Tool", overlay=true)
// === INPUTS ===
useRSI = input.bool(true, "Enable RSI Divergence")
useMACD = input.bool(true, "Enable MACD Divergence")
showLabels = input.bool(true, "Show Divergence Labels")
showHLines = input.bool(true, "Show Horizontal Lines")
showConnLines = input.bool(true, "Show Connecting Lines")
rsiSource = input.source(close, "RSI Source")
rsiLength = input.int(14, "RSI Length")
macdSrc = input.source(close, "MACD Source")
macdFast = input.int(12, "MACD Fast Length")
macdSlow = input.int(26, "MACD Slow Length")
macdSig = input.int(9, "MACD Signal Smoothing")
volFilter = input.bool(true, "Use Volume Filter")
volLen = input.int(20, "Volume MA Length")
// === CALCULATIONS ===
rsi = ta.rsi(rsiSource, rsiLength)
= ta.macd(macdSrc, macdFast, macdSlow, macdSig)
macdHist = macdLine - signalLine
volMA = ta.sma(volume, volLen)
volOk = not volFilter or volume > volMA
// === TRACKING VARIABLES (Fixed typing)
var float lastLowPrice = na
var float lastLowRSI = na
var float lastLowMACD = na
var int lastLowBar = na
var float lastHighPrice = na
var float lastHighRSI = na
var float lastHighMACD = na
var int lastHighBar = na
// === DIVERGENCE FLAGS ===
bullDivRSI = false
bearDivRSI = false
revBullDivRSI = false
revBearDivRSI = false
bullDivMACD = false
bearDivMACD = false
revBullDivMACD = false
revBearDivMACD = false
// === FUNCTION TO DRAW DIVERGENCES ===
plotDivergence(cond, labelText, location, color_, price, fromBar) =>
if cond and volOk
if showLabels
label.new(bar_index, price, labelText, style=label.style_label_left, textcolor=color.white, size=size.small, color=color_)
if showHLines
line.new(bar_index, price, bar_index + 5, price, color=color_, width=1)
if showConnLines and not na(fromBar)
line.new(fromBar, price, bar_index, price, color=color_, width=1)
// === DETECT BOTTOMS ===
if ta.lowestbars(low, 3) == 1
if useRSI and not na(lastLowRSI)
bullDivRSI := (low < lastLowPrice) and (rsi > lastLowRSI)
revBullDivRSI := (low > lastLowPrice) and (rsi < lastLowRSI)
if useMACD and not na(lastLowMACD)
bullDivMACD := (low < lastLowPrice) and (macdHist > lastLowMACD)
revBullDivMACD := (low > lastLowPrice) and (macdHist < lastLowMACD)
lastLowPrice := low
lastLowRSI := rsi
lastLowMACD := macdHist
lastLowBar := bar_index
// === DETECT TOPS ===
if ta.highestbars(high, 3) == 1
if useRSI and not na(lastHighRSI)
bearDivRSI := (high > lastHighPrice) and (rsi < lastHighRSI)
revBearDivRSI := (high < lastHighPrice) and (rsi > lastHighRSI)
if useMACD and not na(lastHighMACD)
bearDivMACD := (high > lastHighPrice) and (macdHist < lastHighMACD)
revBearDivMACD := (high < lastHighPrice) and (macdHist > lastHighMACD)
lastHighPrice := high
lastHighRSI := rsi
lastHighMACD := macdHist
lastHighBar := bar_index
// === PLOTS ===
plotDivergence(bullDivRSI, "RSI Bull Div", location.belowbar, color.green, low, lastLowBar)
plotDivergence(bearDivRSI, "RSI Bear Div", location.abovebar, color.red, high, lastHighBar)
plotDivergence(revBullDivRSI, "RSI RevBull", location.belowbar, color.lime, low, lastLowBar)
plotDivergence(revBearDivRSI, "RSI RevBear", location.abovebar, color.orange, high, lastHighBar)
plotDivergence(bullDivMACD, "MACD Bull Div", location.belowbar, color.navy, low, lastLowBar)
plotDivergence(bearDivMACD, "MACD Bear Div", location.abovebar, color.maroon, high, lastHighBar)
plotDivergence(revBullDivMACD, "MACD RevBull", location.belowbar, color.blue, low, lastLowBar)
plotDivergence(revBearDivMACD, "MACD RevBear", location.abovebar, color.purple, high, lastHighBar)
// === ALERT CONDITIONS ===
alertcondition(bullDivRSI, "RSI Bullish Divergence", "RSI Bullish Divergence detected")
alertcondition(bearDivRSI, "RSI Bearish Divergence", "RSI Bearish Divergence detected")
alertcondition(revBullDivRSI, "RSI Reverse Bullish", "RSI Reverse Bullish Divergence detected")
alertcondition(revBearDivRSI, "RSI Reverse Bearish", "RSI Reverse Bearish Divergence detected")
alertcondition(bullDivMACD, "MACD Bullish Divergence", "MACD Bullish Divergence detected")
alertcondition(bearDivMACD, "MACD Bearish Divergence", "MACD Bearish Divergence detected")
alertcondition(revBullDivMACD, "MACD Reverse Bullish", "MACD Reverse Bullish Divergence detected")
alertcondition(revBearDivMACD, "MACD Reverse Bearish", "MACD Reverse Bearish Divergence detected")
🕴 Rajnikanth Divergence Tool//@version=5
indicator("🕴 Rajnikanth Divergence Tool", overlay=true)
// === INPUTS ===
useRSI = input.bool(true, "Enable RSI Divergence")
useMACD = input.bool(true, "Enable MACD Divergence")
rsiSource = input.source(close, "RSI Source")
rsiLength = input.int(14, "RSI Length")
macdSrc = input.source(close, "MACD Source")
macdFast = input.int(12, "MACD Fast Length")
macdSlow = input.int(26, "MACD Slow Length")
macdSig = input.int(9, "MACD Signal Smoothing")
// === INDICATOR CALCULATIONS ===
rsi = ta.rsi(rsiSource, rsiLength)
= ta.macd(macdSrc, macdFast, macdSlow, macdSig)
macdHist = macdLine - signalLine
// === STORAGE ===
var float lastLowPrice = na
var float lastLowRSI = na
var float lastLowMACD = na
var float lastHighPrice = na
var float lastHighRSI = na
var float lastHighMACD = na
bullDivRSI = false
bearDivRSI = false
revBullDivRSI = false
revBearDivRSI = false
bullDivMACD = false
bearDivMACD = false
revBullDivMACD = false
revBearDivMACD = false
// === LINE STORAGE ===
var line lines = array.new_line()
// === DETECTION ===
// Detect Bottom (for bullish)
if ta.lowestbars(low, 3) == 1
if useRSI and not na(lastLowRSI)
bullDivRSI := (low < lastLowPrice) and (rsi > lastLowRSI)
revBullDivRSI := (low > lastLowPrice) and (rsi < lastLowRSI)
if useMACD and not na(lastLowMACD)
bullDivMACD := (low < lastLowPrice) and (macdHist > lastLowMACD)
revBullDivMACD := (low > lastLowPrice) and (macdHist < lastLowMACD)
lastLowPrice := low
lastLowRSI := rsi
lastLowMACD := macdHist
// Detect Top (for bearish)
if ta.highestbars(high, 3) == 1
if useRSI and not na(lastHighRSI)
bearDivRSI := (high > lastHighPrice) and (rsi < lastHighRSI)
revBearDivRSI := (high < lastHighPrice) and (rsi > lastHighRSI)
if useMACD and not na(lastHighMACD)
bearDivMACD := (high > lastHighPrice) and (macdHist < lastHighMACD)
revBearDivMACD := (high < lastHighPrice) and (macdHist > lastHighMACD)
lastHighPrice := high
lastHighRSI := rsi
lastHighMACD := macdHist
// === LABELS + HORIZONTAL LINES ===
plotLabel(cond, txt, loc, col) =>
if cond
label.new(bar_index, loc == location.abovebar ? high : low, txt,
style=label.style_label_left, textcolor=color.white, size=size.small, color=col)
line l = line.new(bar_index, loc == location.abovebar ? high : low, bar_index + 5, loc == location.abovebar ? high : low, color=col, width=1)
array.push(lines, l)
plotLabel(bullDivRSI, "RSI Bull Div", location.belowbar, color.green)
plotLabel(bearDivRSI, "RSI Bear Div", location.abovebar, color.red)
plotLabel(revBullDivRSI, "RSI RevBull", location.belowbar, color.lime)
plotLabel(revBearDivRSI, "RSI RevBear", location.abovebar, color.orange)
plotLabel(bullDivMACD, "MACD Bull Div", location.belowbar, color.navy)
plotLabel(bearDivMACD, "MACD Bear Div", location.abovebar, color.maroon)
plotLabel(revBullDivMACD, "MACD RevBull", location.belowbar, color.blue)
plotLabel(revBearDivMACD, "MACD RevBear", location.abovebar, color.purple)

🔁 Divergence Detector (RSI + MACD)//@version=5
indicator("🔁 Divergence Detector (RSI + MACD)", overlay=true)
// === INPUTS ===
useRSI = input.bool(true, "Enable RSI Divergence")
useMACD = input.bool(true, "Enable MACD Divergence")
rsiSource = input.source(close, "RSI Source")
rsiLength = input.int(14, "RSI Length")
macdSrc = input.source(close, "MACD Source")
macdFast = input.int(12, "MACD Fast Length")
macdSlow = input.int(26, "MACD Slow Length")
macdSig = input.int(9, "MACD Signal Smoothing")
lookback = input.int(20, "Lookback Range")
// === INDICATOR CALCULATIONS ===
rsi = ta.rsi(rsiSource, rsiLength)
= ta.macd(macdSrc, macdFast, macdSlow, macdSig)
macdHist = macdLine - signalLine
// === DIVERGENCE DETECTION ===
var float lastLowPrice = na
var float lastLowRSI = na
var float lastLowMACD = na
var float lastHighPrice = na
var float lastHighRSI = na
var float lastHighMACD = na
bullDivRSI = false
bearDivRSI = false
revBullDivRSI = false
revBearDivRSI = false
bullDivMACD = false
bearDivMACD = false
revBullDivMACD = false
revBearDivMACD = false
// Detect bottoms (for Bullish Divergences)
if ta.lowestbars(low, 3) == 1
// Store recent low
bullCondition = true
// RSI
if useRSI
if not na(lastLowRSI)
bullDivRSI := (low < lastLowPrice) and (rsi > lastLowRSI)
revBullDivRSI := (low > lastLowPrice) and (rsi < lastLowRSI)
lastLowPrice := low
lastLowRSI := rsi
// MACD
if useMACD
if not na(lastLowMACD)
bullDivMACD := (low < lastLowPrice) and (macdHist > lastLowMACD)
revBullDivMACD := (low > lastLowPrice) and (macdHist < lastLowMACD)
lastLowMACD := macdHist
// Detect tops (for Bearish Divergences)
if ta.highestbars(high, 3) == 1
// RSI
if useRSI
if not na(lastHighRSI)
bearDivRSI := (high > lastHighPrice) and (rsi < lastHighRSI)
revBearDivRSI := (high < lastHighPrice) and (rsi > lastHighRSI)
lastHighPrice := high
lastHighRSI := rsi
// MACD
if useMACD
if not na(lastHighMACD)
bearDivMACD := (high > lastHighPrice) and (macdHist < lastHighMACD)
revBearDivMACD := (high < lastHighPrice) and (macdHist > lastHighMACD)
lastHighMACD := macdHist
// === PLOTS ===
// RSI-based Divergences
plotshape(bullDivRSI, title="Bullish RSI Div", location=location.belowbar, color=color.green, style=shape.labelup, text="RSI Bull Div")
plotshape(bearDivRSI, title="Bearish RSI Div", location=location.abovebar, color=color.red, style=shape.labeldown, text="RSI Bear Div")
plotshape(revBullDivRSI, title="Rev Bull RSI", location=location.belowbar, color=color.lime, style=shape.triangleup, text="RSI RevBull")
plotshape(revBearDivRSI, title="Rev Bear RSI", location=location.abovebar, color=color.orange, style=shape.triangledown, text="RSI RevBear")
// MACD-based Divergences
plotshape(bullDivMACD, title="Bullish MACD Div", location=location.belowbar, color=color.navy, style=shape.labelup, text="MACD Bull Div")
plotshape(bearDivMACD, title="Bearish MACD Div", location=location.abovebar, color=color.maroon, style=shape.labeldown, text="MACD Bear Div")
plotshape(revBullDivMACD, title="Rev Bull MACD", location=location.belowbar, color=color.blue, style=shape.triangleup, text="MACD RevBull")
plotshape(revBearDivMACD, title="Rev Bear MACD", location=location.abovebar, color=color.purple, style=shape.triangledown, text="MACD RevBear")
FMX Trend Confirmation - No Reversals🔍 FMX Continuation Signal – No Reversals
Powered by the FMX Model (Fundamentals Meet Execution)
This indicator is designed to capture high-probability continuation trades only, avoiding risky reversals. It confirms buy or sell signals based on:
✅ 15-Minute Structure Shift Confirmation
✅ Liquidity Sweeps (stop hunts beyond recent highs/lows)
✅ Trend Validation using HTF SMA (default: 15min)
✅ Second Candle Close inside the sweep range — FMX-grade precision
📈 Green “Buy” labels appear when:
Liquidity is swept below recent lows
Price closes back inside the range
The higher timeframe trend is bullish
📉 Orange “Sell” labels appear when:
Liquidity is swept above recent highs
Price closes back inside the range
The higher timeframe trend is bearish
🛡️ No reversal signals are plotted. This tool is meant for traders who follow the trend with smart money logic, inspired by FMX principles.

SMAs Ghost in the Machine v3SMAs Ghost in the Machine v3
Created by: MecarderoAurum
Overview
The "SMAs Ghost in the Machine" is a powerful multi-timeframe analysis tool designed for traders who want to align their entries and exits with the trend on several different chart periods simultaneously. At its core, the indicator plots the 9-period and 20-period Simple Moving Averages (SMAs) from up to three user-defined timeframes directly onto your active chart.
Its most powerful feature is the Combined Crossover Signal, which allows you to create highly specific, custom trading setups by defining conditions that must occur at the same time across any of the enabled timeframes. This eliminates guesswork and helps you visually confirm when your precise market conditions are met.
Important Note on Line Drawing
This indicator allows you to see trends of other timeframes. A specific design choice was made not to smooth the moving average lines. This is to ensure that the crossover signals appear on the exact candle where the cross occurs in real-time. Smoothing the lines can cause a delay and shift the signal to a later candle.
The side effect of this accuracy is that the lines will appear "stepped." As new data comes in on your current chart, you may need to refresh the chart to keep the higher timeframe lines updated. We are working on a solution to this.
Capabilities
Multi-Timeframe Analysis: Plot the 9 and 20 SMAs from three different timeframes (e.g., 1-minute, 5-minute, and 30-minute) on a single chart.
Individual Crossover Signals: Automatically plots a green triangle (▲) for a "Golden Cross" (9 SMA crosses above 20) and a red triangle (▼) for a "Death Cross" (9 SMA crosses below 20) on each individual timeframe.
Combined Crossover Engine: Define a custom bullish or bearish signal by combining multiple events. The indicator will plot a green diamond (◆) for your bullish setup and a red diamond (◆) for your bearish setup when all specified conditions are met on the same candle.
Customizable Alerts: Create alerts for both the individual 9/20 SMA crosses and your custom Combined Crossover Signal to ensure you never miss a potential setup.
How to Use the Indicator
Basic Setup
Add the "SMAs Ghost in the Machine v3" indicator to your TradingView chart.
Open the indicator settings.
Under the Timeframe Settings, enable the timeframes you want to monitor and select the desired period for each (e.g., TF1: '1', TF2: '5', TF3: '30').
Configuring the Combined Crossover Signal
This is the core feature for defining your specific trading setups.
In the settings, go to the "Combined Crossover Signal" group and check the box to "Enable Combined Signal."
Decide if you are building a bullish (long) or bearish (short) setup.
Under the "Bullish Setup" or "Bearish Setup" sections, check the boxes for every event that must happen at the same time for your signal to trigger.
Example Bullish Setup:
Let's say your strategy is to go long when:
On the 1-minute chart (TF1), the price crosses above the 9 SMA.
AND, on the 5-minute chart (TF3), the price also crosses above its 9 SMA.
To configure this, you would check the following two boxes under the "Bullish Setup":
TF1: Price crosses above 9 SMA
TF3: Price crosses above 9 SMA
Now, a green diamond (◆) will only appear on your chart when both of those conditions are true on the exact same bar, giving you a precise entry signal.
Setting Up Alerts
Go to the "Alert Settings" tab in the indicator options.
Check the boxes for the alerts you want to enable (e.g., "Alert on TF1 SMA Cross," "Alert on Combined Signal").
Close the settings. Now, right-click on the chart and choose "Add alert."
In the "Condition" dropdown, select "SMA Ghosts v3."
A second dropdown will appear. Choose the specific event you want an alert for, such as Combined Bullish Signal or TF1 Golden Cross.
Configure the alert options as desired and click "Create."
Trading Strategies
Trend Confirmation: Use the indicator on a 1-minute chart with the 5-minute 9/20 SMA lines enabled to see the 5-minute trend. Only take 1-minute trades that are in the same direction as the 5-minute SMAs.
Multi-Flow Alignment: Keep track of bigger timeframes (like the 30-min or 4-hour) to also match your entries with longer-term market flows.
Avoid Flat Markets: Avoid taking trades when the SMA lines from multiple timeframes are flat or moving sideways, as this indicates a lack of clear trend.
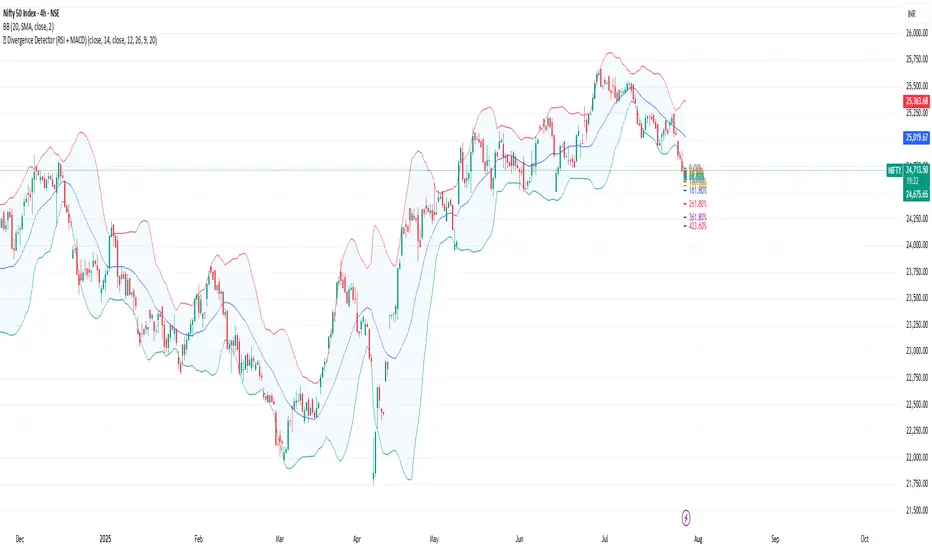
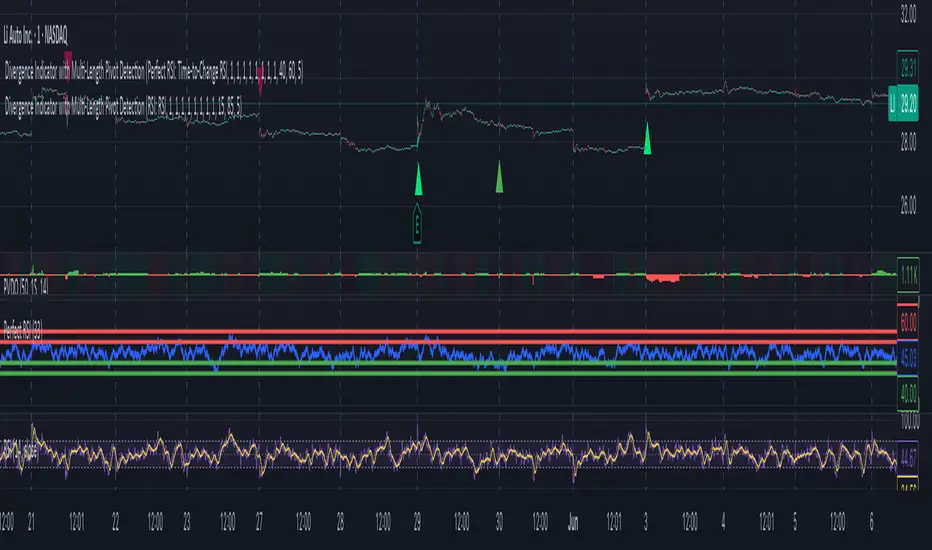
Divergence Indicator with Multi-Length Pivot DetectionThis Pine Script, titled “Divergence Indicator with Multi-Length Pivot Detection”, tool that detects both regular and hidden divergences between price action and an oscillator (defaulting to close, but configurable). It features multi-length pivot logic, angle-based validation, no-cross filtering, and OB/OS region filtering, making it a robust and precise divergence engine. Below is a detailed breakdown:
⸻
🔧 Inputs and Configuration
• osc_src: Oscillator source (e.g. close, RSI, MACD).
• show_hidden: Toggles detection of hidden divergences.
• min_*_angle settings: Control the minimum angle thresholds (in degrees) for confirming valid divergences (ensures momentum is strong enough).
• validate_no_cross: Ensures oscillator and price slopes don’t “cross” the actual values (i.e. filters out invalid or messy trends).
• oversold_level, overbought_level: Used when use_ob_os_filter is enabled to require oscillator to be in OS/OB zones for regular divergence.
• min_div_length: Minimum distance in bars between previous and current pivot points.
⸻
🔁 Internal Engine Mechanics
1. Pivot Detection Engine (Phase 1: Historical Memory)
• For all combinations of left1 and right1 in the range :
• Records all valid pivot lows and pivot highs.
• Stores their:
• bar index
• price value
• oscillator value
This forms a “memory buffer” of past pivots that future price pivots are compared against.
2. Current Pivot Detection (Phase 2: Scanning)
• Loops through larger pivot configurations (left2 ∈ , right2 = 1) to detect new current pivots.
• For each new pivot, it compares against the historical pivots from phase 1.
⸻
📐 Slope and Angle Calculation
For each matching pivot pair (historical vs current):
• Price and Oscillator Slopes are calculated via linear regression, producing:
• price_angle
• osc_angle
• These are converted using math.atan() and math.todegrees() to get proper angular direction and intensity of trend.
⸻
🧠 Divergence Logic
✅ Bullish Divergence
• Regular Bullish: Price makes a lower low, oscillator makes a higher low.
• Hidden Bullish: Price makes a higher low, oscillator makes a lower low.
• Conditions:
• Must meet minimum angle thresholds.
• Optional: Must be in oversold region (osc_src < oversold_level).
• If validate_no_cross is enabled, linearly interpolated slope must not be violated.
✅ Bearish Divergence
• Regular Bearish: Price makes a higher high, oscillator makes a lower high.
• Hidden Bearish: Price makes a lower high, oscillator makes a higher high.
• Conditions mirror the bullish case (with polarity reversed).
⸻
🖍️ Visualization
• Draws colored lines between pivots for visual clarity:
• Green: Regular Bullish
• Lime: Hidden Bullish
• Red: Regular Bearish
• Maroon: Hidden Bearish
• Uses plotshape() to mark divergence bars:
• Triangle-up for bullish
• Triangle-down for bearish
The lines and shapes help quickly identify divergence zones with strong momentum structure.
⸻
🧪 Filtering Enhancements
• No Cross Slope Filter: Checks that oscillator and price values stay above/below their respective slope lines throughout the interval.
• OB/OS Filter: Restricts divergence signals to occur only in oversold/overbought conditions for regular divergences.
• Signal Thinning: Keeps line count to 100 using array.shift() and line.delete().
⸻
🧬 Design Philosophy
• Built to mimic institutional-grade divergence detection, avoiding common false positives.
• Uses adaptive pivots, rigorous angle validation, and noise filtering.
Crypto Weighted 60 Day Return Index60 Day Return of Crypto Index (Volatility Adjusted) weightings based on Holdings
BTC
ETH
SOL
AAVE
XRP

Stochastic Ribbon & EMAsHere's a comprehensive description for publishing your indicator:
---
# **Stochastic Ribbon & EMAs**
A clean and powerful trading indicator that combines **Stochastic Support/Resistance levels** with **Essential Moving Averages** for comprehensive market analysis.
## **📊 What It Does**
This indicator provides **7 key reference lines** on your chart:
- **3 Stochastic levels** (20%, 50%, 80%) - Dynamic support/resistance zones
- **4 Essential EMAs** (20, 50, 100, 200) - Trend direction and momentum
## **🎯 Key Features**
### **Stochastic Ribbon (3 Yellow Lines)**
- **80% Line**: Dynamic resistance level - potential selling zone
- **50% Line**: Market equilibrium - trend direction reference
- **20% Line**: Dynamic support level - potential buying zone
- **Default 50-period lookback** for stable, reliable levels
- **All lines in yellow** for clean, consistent visualization
### **Essential EMAs (4 Colored Lines)**
- **20 EMA** (Purple): Short-term trend and entry timing
- **50 EMA** (Dark Cyan): Medium-term trend direction
- **100 EMA** (Rosy Brown): Long-term trend confirmation
- **200 EMA** (Brown): Major trend and institutional levels
## **📈 How to Use**
### **For Support & Resistance:**
- **Above 80% line**: Look for selling opportunities (overbought zone)
- **Between 50-80%**: Bullish bias, pullbacks to 50% line for entries
- **Around 50% line**: Key equilibrium - watch for direction
- **Between 20-50%**: Bearish bias, bounces to 50% line for exits
- **Below 20% line**: Look for buying opportunities (oversold zone)
### **For Trend Analysis:**
- **EMA Stack Order**: Higher timeframe EMAs above lower = uptrend
- **Price above all EMAs**: Strong bullish momentum
- **Price below all EMAs**: Strong bearish momentum
- **EMA as dynamic support/resistance**: Bounces and rejections
### **For Entry Signals:**
- **Confluence zones**: Where Stochastic levels meet EMA levels
- **Breakouts**: Price breaking through multiple levels simultaneously
- **Reversals**: Price rejection at extreme Stochastic levels with EMA confirmation
## **⚙️ Settings**
### **Stochastic Ribbon**
- **Show/Hide**: Toggle the 3 Stochastic lines
- **Length**: Period for high/low calculation (default: 50)
- **Start**: Multiplier for calculation (default: 1)
### **EMAs**
- **Individual toggles**: Show/hide each EMA separately
- **Custom periods**: Adjust each EMA length (defaults: 20, 50, 100, 200)
- **Custom colors**: Personalize each EMA color
## **🚀 Why This Indicator?**
✅ **Clean & Simple**: No cluttered charts - just essential levels
✅ **Multi-Timeframe**: Works on all timeframes from 1m to 1W
✅ **Versatile**: Suitable for scalping, day trading, and swing trading
✅ **Low Lag**: Dynamic levels that adapt to current market conditions
✅ **Proven Components**: Combines two well-established technical concepts
✅ **Customizable**: Adjust all parameters to fit your trading style
## **💡 Pro Tips**
- **Use multiple timeframes**: Check higher timeframe alignment for stronger signals
- **Combine with volume**: Look for volume confirmation at key levels
- **Watch for confluences**: Best signals occur where multiple levels align
- **Respect the 50% line**: Often acts as the most important level for trend direction
## **📋 Technical Details**
- **Version**: Pine Script v5
- **Overlay**: Yes (displays on main price chart)
- **Plots**: 7 total (well within Pine Script limits)
- **Performance**: Optimized for fast loading and smooth operation
---
**Perfect for traders who want clear, actionable levels without chart clutter. Whether you're a beginner learning support/resistance or an experienced trader looking for clean reference points, this indicator delivers exactly what you need.**
Engulfing DashboardThis is an indicator that detects candles based on the **Engulfing system** I’ve studied — from **wick to wick**.
It determines whether it’s a Buy or Sell based on the **opening price** and how the candle moves.
Anyone familiar with the Engulfing system will know how to use it.
It’s especially useful for people who use only **one screen** and can’t constantly monitor multiple timeframes.
And don’t forget:
**Trend is your friend.**

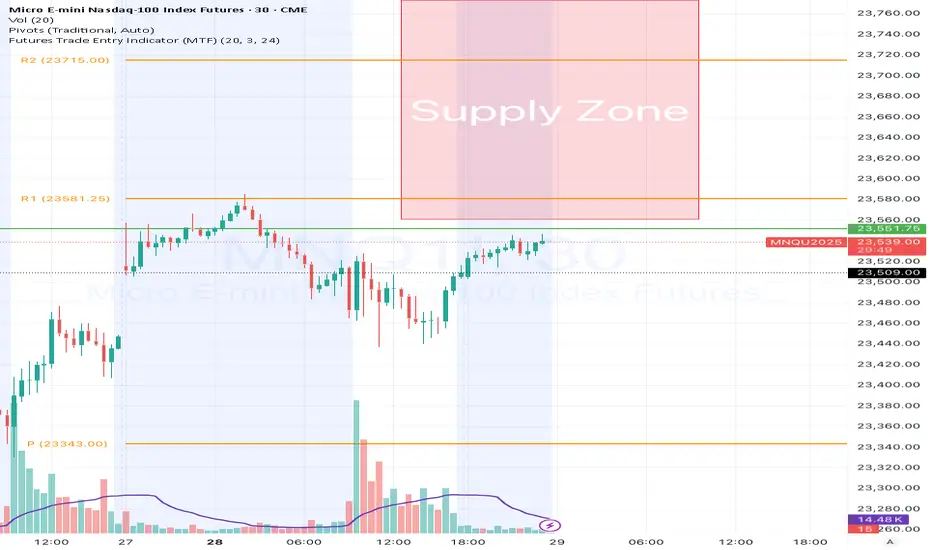
Futures Trade Entry Indicator (MTF)Work in Progress with the help of Claude. Not ready for active trading. Public for help improving. This will be a multi-timeframe futures trading indicator with supply/demand zones, Fair Value Gaps (FVGs), and sophisticated entry/exit logic.I've created a comprehensive Pine Script v6 indicator that matches all your specifications! Here's what the script includes:
## **Key Features Implemented:**
### **🔄 Multi-Timeframe Logic**
- **1H Chart Data**: Detects Supply Zones, Demand Zones, and Fair Value Gaps
- **Current Timeframe**: Monitors for re-entry and confirmation signals
### **📊 Zone Detection**
- **Supply Zones**: Identified using pivot highs with configurable strength
- **Demand Zones**: Identified using pivot lows with touch validation
- **Fair Value Gaps**: Both bullish and bearish FVGs detected automatically
- **Auto-Expiry**: Zones expire after 24 hours (configurable)
### **⚡ Entry Logic**
- **Dual Confirmation Required**:
- ✅ Engulfing candle pattern (bullish/bearish)
- ✅ Market structure shift (HH→LL or LL→HH)
- **Zone Re-entry**: Price must be within identified zones/FVGs
### **🎯 Probability System**
- **Smart Scoring**: Based on zone age, strength, and risk/reward ratio
- **Color-Coded**: Green (High), Yellow (Medium), Red (Low)
- **Real-time Calculation**: Updates with each potential entry
### **🎨 Visual Elements**
- **Colored Zones**: Supply (red), Demand (green), FVGs (blue/orange)
- **Entry Labels**: 🟩 LONG / 🟥 SHORT markers
- **Probability Labels**: Display confidence levels
- **Confirmation Shapes**: Triangle indicators for pattern completion
### **⚙️ Manual Controls**
All the requested toggles are available in the settings panel:
- Show/Hide Supply Zones
- Show/Hide Demand Zones
- Show/Hide FVGs
- Show/Hide Labels
- Show/Hide Probability
- Zone strength and expiry settings
- Custom colors for all elements
### **🔔 Alert System**
- Entry opportunity alerts
- Includes probability assessment
- Ticker symbol identification
## **Usage Instructions:**
1. **Apply to 15m chart** for active trading signals
2. **Configure settings** based on your preferences
3. **Set up alerts** for automated notifications
4. **Monitor probability levels** for trade quality assessment
The script automatically handles the complex multi-timeframe analysis while keeping the interface clean and user-friendly. All zones update dynamically and expire appropriately to avoid clutter.
Would you like me to adjust any specific parameters or add additional features?
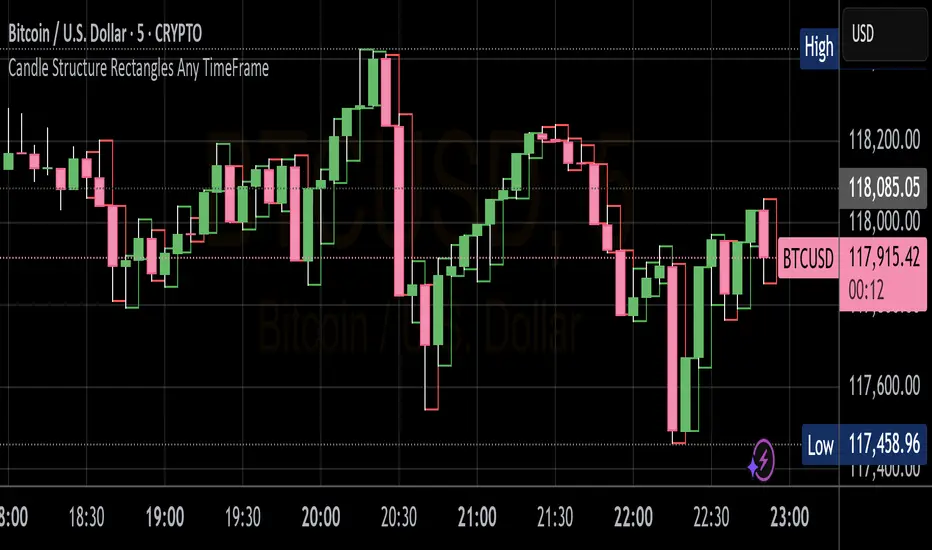
Candle Structure Rectangles Any TimeFrameThis indicator draws the rectangles around the candle wick based on the timeframe selected on the chart.
This will help analyze the candle structure with respect to previous candle and series of candles
Stochastics Momentum IndexV1.5This is an update to the current indicator Stochastic Momentum Index by: surjithctly
This video on YouTube Linked Under explains how to use this indicator along with another indicator: ema cloud 150
youtube.com/watch?v=bFY_M4BZmVU
All that was improvised and added was a middle band a mid point to know where the middle of the indicator is. That is all.
Also Edit, Customize the indicator however you like, and if you don't want the mid point shown or want to alter to a line or a dotted line you can also do that as well.
Please enjoy, I provide these updates that I publish because I am passionate about trading and if this helps me, I know it will help you.
7 minutes ago
Release Notes
This is an update to the current indicator Stochastic Momentum Index by: surjithctly
This video on YouTube Linked Under explains how to use this indicator along with another indicator: ema cloud 150
youtube.com/watch?v=bFY_M4BZmVU
All that was improvised and added was a middle band a mid point to know where the middle of the indicator is. That is all.
Also Edit, Customize the indicator however you like, and if you don't want the mid point shown or want to alter to a line or a dotted line you can also do that as well.
Please enjoy, I provide these updates that I publish because I am passionate about trading and if this helps me, I know it will help you.
P.s. I added the middle band exteded into the future just like the oversold/overbought levels but still at 0 , so it is still in the middle
If you see Writing of previous Indicator settings On Chart with Original User Text all in Yellow
Just click on the Window Text Etc. And delete all of the wording. That is all. You will be alright this happened to me, so just click and delete.
Everything will be fine after that. Thank you.

Vertical Time Marker Configurable (VTMC)# Vertical Time Marker Configurable (VTMC)
## Overview
The Vertical Time Marker Configurable (VTMC) is a powerful PineScript v6 indicator designed to help traders quickly identify key market times across their entire chart history. Instead of hovering over candles to check timestamps, VTMC draws clear vertical lines with customizable labels at your specified times, making it easy to spot important market sessions, news events, or personal trading windows at a glance.
## Key Features
### ⏰ Flexible Time Selection
- Set any time using an intuitive time picker (defaults to 8:30 AM Central Time)
- Automatically draws lines at your specified time across all historical data
- Perfect for marking market opens, closes, news releases, or personal trading times
### 🎨 Full Visual Customization
- **Line Color**: Choose any color (defaults to white for maximum visibility)
- **Line Style**: Solid, dashed, or dotted options
- **Line Width**: Adjustable from 1-10 pixels
- **Opacity Control**: Precise opacity slider (0-100%) for both line and text
### 🏷️ Smart Text Labels
- **Preset Options**: New York Open, New York Close, London Open, London Close, Asia Open, Asia Close
- **Custom Labels**: Enter any text for personalized marking (news events, trading windows, etc.)
- **Configurable Text**: Adjustable size (8-20px), color, and opacity
- **Smart Positioning**: Text appears just above the price action for clear visibility
### 📊 Professional Display
- Lines extend fully from top to bottom of chart
- Clean, non-intrusive design that doesn't clutter your analysis
- Works on any timeframe and market
- Historical lines persist across all chart data
## Perfect For
### Market Session Traders
- Mark key session opens and closes
- Identify overlap periods between major markets
- Track session-specific price behavior patterns
### News Traders
- Mark important economic releases (FOMC, NFP, etc.)
- Create visual reminders for scheduled events
- Track market reaction patterns around news times
### Institutional Flow Traders
- Identify key institutional activity times
- Mark order block formation periods
- Track smart money movement windows
### Personal Trading Systems
- Mark your optimal trading hours
- Create visual discipline for trading windows
- Track performance during specific time periods
## Why VTMC?
Unlike hardcoded session indicators that only work for specific markets, VTMC gives you complete flexibility to mark ANY time that matters to your trading strategy. Whether you're tracking "MY Trading Window" from 9:30-10:30 AM or marking custom news events, VTMC adapts to your specific needs.
The indicator eliminates the constant need to hover over candles to check times, instead providing instant visual reference points across your entire chart. This makes pattern recognition, backtesting, and trade timing significantly more efficient.
## Usage Tips
- Use multiple instances for different time zones or events
- Combine with other indicators for comprehensive market timing
- Customize colors to match your chart theme
- Use custom labels for personalized trading reminders
*Built with precision in PineScript v6 for reliable performance and modern TradingView compatibility.*
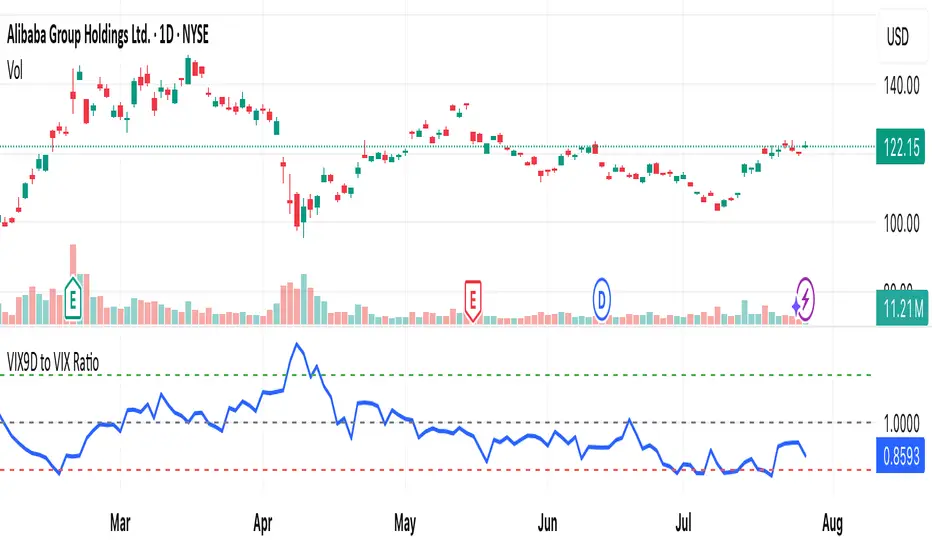
VIX9D to VIX RatioVIX9D to VIX Ratio
The ratio > 1 can signal near-term fear > long-term fear (potential short-term stress).
The ratio < 1 implies long-term implied volatility is higher — more typical in calm markets.
ADR Tracker Version 2Description
The **ADR Tracker** plots a customizable panel on your chart that monitors the Average Daily Range (ADR) and shows how today’s price action compares to that average. It calculates the daily high–low range for each of the past 14 days (can be adjusted) and then takes a simple moving average of those ranges to determine the ADR.
**Features:**
* **Current ADR value:** Shows the 14‑day ADR in price units.
* **ADR status:** Indicates whether today’s range has reached or exceeded the ADR.
* **Ticks remaining:** Calculates how many minimum price ticks remain before the ADR would be met.
* **Real‑time tracking:** Monitors the intraday high and low to update the range continuously.
* **Customizable panel:** Uses TradingView’s table object to display the information. You can set the table’s horizontal and vertical position (top/middle/bottom and left/centre/right) with inputs. The script also lets you change the text and background colours, as well as the width and height of each row. Table cells use explicit width and height percentages, which Pine supports in v6. Each call to `table.cell()` defines the text, colours and dimensions for its cell, so the panel resizes automatically based on your settings.
**Usage:**
Apply the indicator to any chart. For the most accurate real‑time tracking, use it on intraday timeframes (e.g. 5‑min or 1‑hour) so the current day’s range updates as new bars arrive. Adjust the inputs in the settings panel to reposition the list or change its appearance.
---
This description explains what the indicator does and highlights its customizable table display, referencing the Pine Script table features used.
