Indicators and strategies

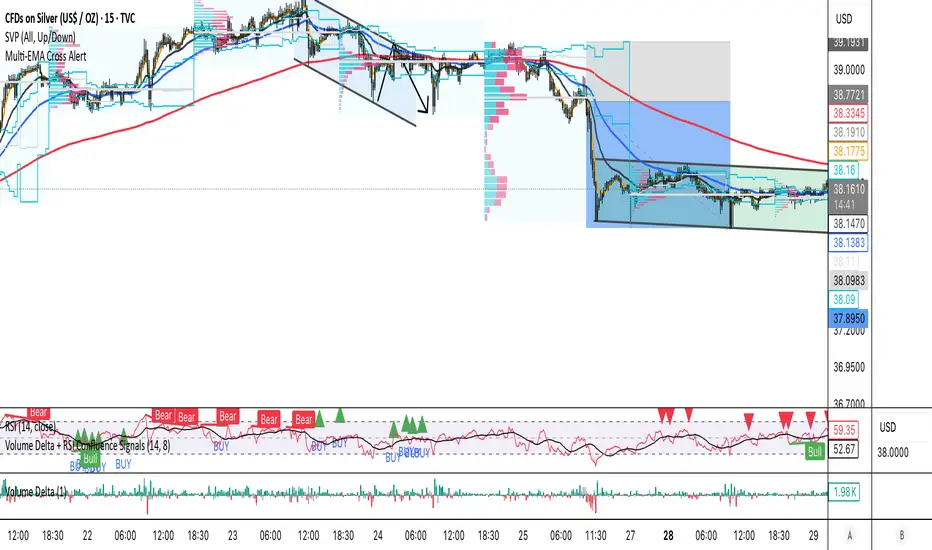
Volume Delta + RSI Confluence SignalsEfficient buy and sell signal scans for real trades using volume delta, rsi rejection and some more.
Daily ATR Stop Loss Buffer- Calculates Daily ATR: Uses the daily timeframe ATR (Average True Range) - a measure of price volatility
- Applies Your Buffer: Takes a percentage of that ATR that you set in the settings (e.g., 5% of daily ATR)
- Creates Stop Levels: Calculates where to place stop losses based on current price plus/minus your ATR buffer

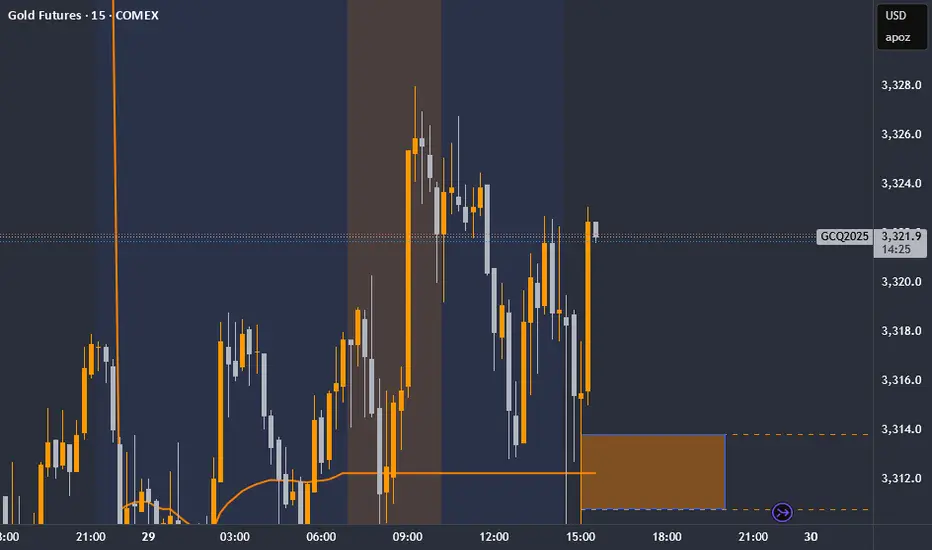
MJBFX-Strategy (Futures Optimized)The MJBFX-Strategy is a complete market mapping tool designed to give traders a clear view of liquidity, session dynamics, and premium/discount levels. It loads automatically on any chart, fully optimized for futures and forex trading.
🔑 Key Features
Asian Session Range
Highlights the previous Asian session with a shaded box
Fixed until London open for precise reference
VWAP from Asian Session
Plots the VWAP of the previous Asian session
Dynamic fair value benchmark for intraday trading
Liquidity Sweeps (Optimized)
Detects sweeps of the Asian session high/low
Shown only on 30m, 1h, and 4h charts to reduce noise
Clean, minimal labels for clarity
Automatic Fibonacci Zone
Draws a shaded retracement zone (38.2%–61.8%) of the Asian range
Transparent fill makes it easy to read price action
Killzones
Highlights London (07:00–10:00) and New York (13:00–16:00) killzones
Semi-opaque shading to keep charts clean
Auto Trade Box (Risk/Reward)
On sweep confirmation, plots a 2R target box
Auto stop loss and take profit levels based on futures tick size
🎯 Why Use It?
The MJBFX-Strategy removes the need for manual drawing.It automatically maps:
Session highs and lows
Liquidity sweeps
VWAP and fib retracement zones
Key killzones
Perfect for session-based intraday trading in both futures and forex.
⚡ No manual settings required.Just load it onto your chart for an instant institutional view of the market.
RSI SMA 7 Signal Strategy (No 50 Level)Script uses SMA 7 Perio and 14 Period RSI
If SMA crosses 40 RSI level from below consider it a buy zone or buy signal, if SMA crosses from below 60 RSI level, then super bullish, IF SMA crosses 60 RSI level from above its a profit taking time and Sell zone, if SMA crosses 40 level from above then super bearish sell signal.

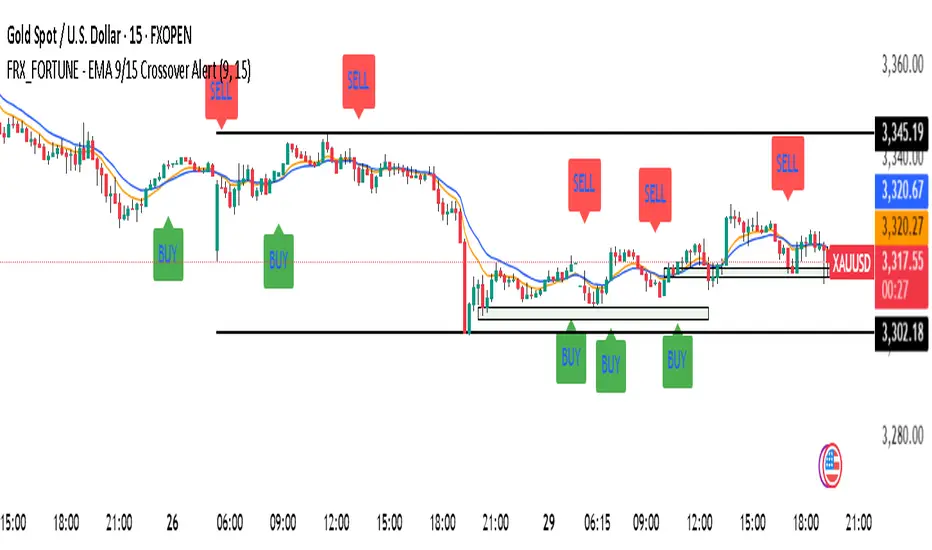
FRX_FORTUNE - EMA 9/15 Crossover Alert//@version=5
indicator("FRX_FORTUNE - EMA 9/15 Crossover Alert", overlay=true)
// === INPUTS ===
fastEmaLength = input.int(9, title="Fast EMA (9)")
slowEmaLength = input.int(15, title="Slow EMA (15)")
showArrows = input.bool(true, title="Show Buy/Sell Arrows")
enableAlerts = input.bool(true, title="Enable Alerts")
// === CALCULATIONS ===
fastEma = ta.ema(close, fastEmaLength)
slowEma = ta.ema(close, slowEmaLength)
bullishCross = ta.crossover(fastEma, slowEma)
bearishCross = ta.crossunder(fastEma, slowEma)
// === PLOT EMA ===
plot(fastEma, title="EMA 9", color=color.orange)
plot(slowEma, title="EMA 15", color=color.blue)
// === DRAW ARROWS ===
plotshape(bullishCross and showArrows, location=location.belowbar, color=color.green, style=shape.labelup, text="BUY", size=size.small)
plotshape(bearishCross and showArrows, location=location.abovebar, color=color.red, style=shape.labeldown, text="SELL", size=size.small)
// === ALERTS ===
alertcondition(bullishCross, title="Buy Alert", message="BUY: EMA 9 crossed above EMA 15")
alertcondition(bearishCross, title="Sell Alert", message="SELL: EMA 9 crossed below EMA 15")
LBB + RSI FX EditionLBB + RSI ForeX Edition (FX) — Version v6.4.8-fx
**Combine Log Bollinger Bands, multi-level RSI signals, optional trend & pin-bar filters, ATR-based optional TP/SL and a compact signal table — all in one overlay.**
### 1. Key Features
* **Logarithmic Bollinger Bands (LBB):**
* Uses log-price SMA and standard deviation to derive upper/lower bands
* Provides a more symmetrical response to percentage-based moves
* **RSI Multi-Level Entries:**
* Generates long signals when price closes below the lower LBB and RSI < 30 / 35 / 40
* Generates short signals when price closes above the upper LBB and RSI > 60 / 65 / 70
* Three “strength” tiers for both buys and sells
* **Signal Filters (optional):**
* **EMA Trend Filter:** only take longs above a 50-period EMA or shorts below it
* **Pin-Bar Filter:** require a clear wick-to-body ratio on the signal candle
* **Confirmed Candle:** wait for candle close before signaling
* **ATR Display (optional):** show current ATR on the signal table
* **Flexible TP/SL Settings:**
* **Static (pips) or Dynamic (ATR-based) TP/SL**
* Toggle between pips and ticks for FX precision
* Minimum pip/tick threshold to avoid overly tight stops
* Separate TP/SL controls for longs and shorts
* **Visuals & Alerts:**
* Color-coded shapes for each RSI tier (green/orange/yellow for buys; blue/purple/red for sells)
* Customizable display of Bollinger Bands, ATR, signal table and win-rate stats
* Built-in `alertcondition` for each tier with clear emoji & strength label
* **Compact Signal Table:**
* Shows 📈/📉 entry price, RSI, ATR (if enabled), pin-bar ✔/–, timestamp (with UTC offset) and win-rate placeholder
---
### 2. Inputs & Groups
| Group | Input | Default | Notes |
| ---------------------- | ------------------------------------------ | ------- | ------------------------------------- |
| **Indicator Settings** | LBB Period (`lbbLength`) | 20 | Length for log-price SMA |
| | LBB Multiplier (`lbbMult`) | 2.0 | Std dev multiplier |
| | RSI Period (`rsiLength`) | 14 | |
| | ATR Period (`atrLength`) | 14 | |
| | Show ATR (`showATR`) | true | Toggles ATR in table |
| | UTC Offset Hours (`timeOffsetHours`) | 0 | Adjust table time to your timezone |
| **Signal Filters** | Use EMA Trend Filter (`useTrendFilter`) | false | |
| | EMA Period (`emaPeriod`) | 50 | |
| | Use Pin-Bar Filter (`usePinBarFilter`) | false | |
| | Pin-Bar Ratio (`pinBarRatio`) | 2.0 | Wick-to-body minimum |
| | Only on Confirmed Candle (`onlyConfirmed`) | false | |
| **TP/SL Settings** | Show TP/SL for Long (`showLongTpSl`) | false | |
| | Show TP/SL for Short (`showShortTpSl`) | false | |
| | Use Dynamic TP/SL (`useDynamicTpSl`) | false | ATR × multiplier |
| | TP/SL in Ticks (`useTicks`) | false | Instead of pips |
| | Min TP/SL Threshold (`minTpSlThreshold`) | 10.0 | In pips |
| | TP Long (pips) (`tpLongPips`) | 20 | Static targets |
| | SL Long (pips) (`slLongPips`) | 10 | |
| | TP Short (pips) (`tpShortPips`) | 20 | |
| | SL Short (pips) (`slShortPips`) | 10 | |
| | ATR Multiplier for TP (`atrMultiplierTP`) | 1.5 | |
| | ATR Multiplier for SL (`atrMultiplierSL`) | 1.0 | |
| **Visual Settings** | Show Signal Shapes (`showShapes`) | true | |
| | Show Bollinger Bands (`showBands`) | true | |
| | Show Statistics (`showStats`) | true | Win-rate currently placeholder “NaN%” |
---
### 3. Calculation Overview
1. **Log Bollinger Bands**
```pinescript
logClose = math.log(close)
logBasis = ta.sma(logClose, lbbLength)
logDev = lbbMult * ta.stdev(logClose, lbbLength)
lowerBand = math.exp(logBasis - logDev)
upperBand = math.exp(logBasis + logDev)
basisBand = math.exp(logBasis)
```
2. **RSI & ATR**
```pinescript
rsi = ta.rsi(close, rsiLength)
atrVal = ta.atr(atrLength)
```
3. **Pin-Bar Detection**
```pinescript
body = math.abs(close - open)
upperWick = high - math.max(close, open)
lowerWick = math.min(close, open) - low
isPinBarBull = lowerWick > body * pinBarRatio and upperWick < body
isPinBarBear = upperWick > body * pinBarRatio and lowerWick < body
```
4. **Trend & Confirmation Filters**
```pinescript
emaTrend = ta.ema(close, emaPeriod)
trendLong = close > emaTrend
trendShort = close < emaTrend
trendOkLong = useTrendFilter ? trendLong : true
trendOkShort= useTrendFilter ? trendShort: true
signalOk = onlyConfirmed ? barstate.isconfirmed : true
```
5. **Entry Conditions**
* **Long**: `close < lowerBand` + RSI < {30, 35, 40} + filters
* **Short**: `close > upperBand` + RSI > {60, 65, 70} + filters
---
### 4. Signal Plotting & Alerts
* **Shapes on Chart**
* 📈 LONG signals plotted below bar in green/orange/yellow triangles, sized by strength
* 📉 SHORT signals plotted above bar in blue/purple/red inverted triangles
* **Alert Conditions**
```pinescript
alertcondition(cond_rsi30_long, title="LBB LONG RSI <30", message="📈 LONG signal | Strong Buy | {{ticker}} @ {{close}} | {{interval}}")
// … and similarly for other tiers
```
---
### 5. TP/SL Management
1. **Delta Calculation**
```pinescript
rawTP = atrVal * atrMultiplierTP * tfMultiplier
rawSL = atrVal * atrMultiplierSL * tfMultiplier
pip = syminfo.mintick
pipMult = pip == 0.00001 ? 10 : pip == 0.01 ? 1 : 100
unitMult = useTicks ? 1 : pipMult
minDelta = minTpSlThreshold * pip * tfMultiplier * unitMult
```
2. **Dynamic TP/SL Lines**
* Deletes old lines and draws new dashed lines at `entry ± max(rawΔ, minDelta)` when signaled and `useDynamicTpSl` is enabled.
3. **Manual TP/SL Labels**
* On each bar checks if price hit the TP or SL level and drops a permanent label “TP @ …” or “SL @ …”.
---
### 6. Compact Signal Table
Positioned in the top-right corner, updates on each new signal:
| Column | Content |
| ------ | ----------------------------------------- |
| 0 | 📈/📉 Entry price with color background |
| 1 | `RSI: XX` |
| 2 | `ATR: X.XXXXX` (if enabled) |
| 3 | `PinBar: ✔` or `–` |
| 4 | `Time: DD-MM-YY HH:mm` (with UTC offset) |
| 5 | `Win Rate: NaN%` (placeholder if enabled) |
---
### 7. Recommendations & Best Practices
* **Timeframe Selection:** works best on FX pairs; adjust `tfMultiplier` sensitivity by avoiding ultra-low minute charts unless needed.
* **Trend Filter:** enable `useTrendFilter` to align signals with broader trend, reducing noise.
* **Pin-Bar Filter:** turn on `usePinBarFilter` when you need higher-quality reversal candles.
* **Dynamic TP/SL:** use ATR-based exits (`useDynamicTpSl=true`) to adapt stop levels to changing volatility.
* **Ticks vs Pips:** for very tight markets (e.g. FX majors on low timeframes), switch to ticks.
* **Backtest Thoroughly:** before deploying alerts, test across multiple symbols/timeframes to tune multipliers and thresholds.
* **Alert Integration:** set up TradingView alerts using the built-in `alertcondition` names for fully automated notifications.
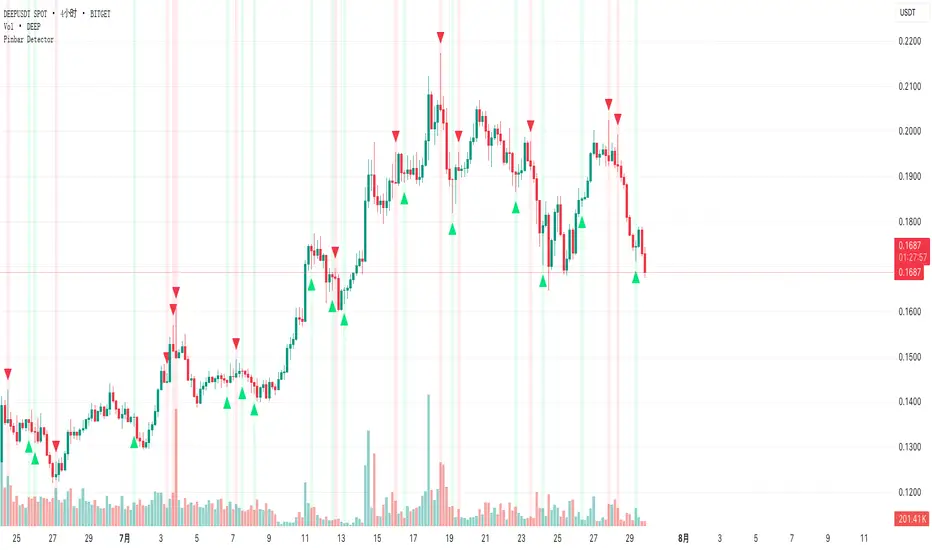
Pinbar DetectorPinbar Detector is original from Naked Candlestick Trading Method
Pinbar Definition: A candlestick where the dominant shadow exceeds 2/3 of the entire candle length
Key Features:
Bearish Pinbar: Red downward triangle when upper shadow exceeds 2/3 of total candle length
Bullish Pinbar: Green upward triangle when lower shadow exceeds 2/3 of total candle length
Background highlighting for easy identification
Alert conditions for both bullish and bearish pinbars
Original candlestick display preserved
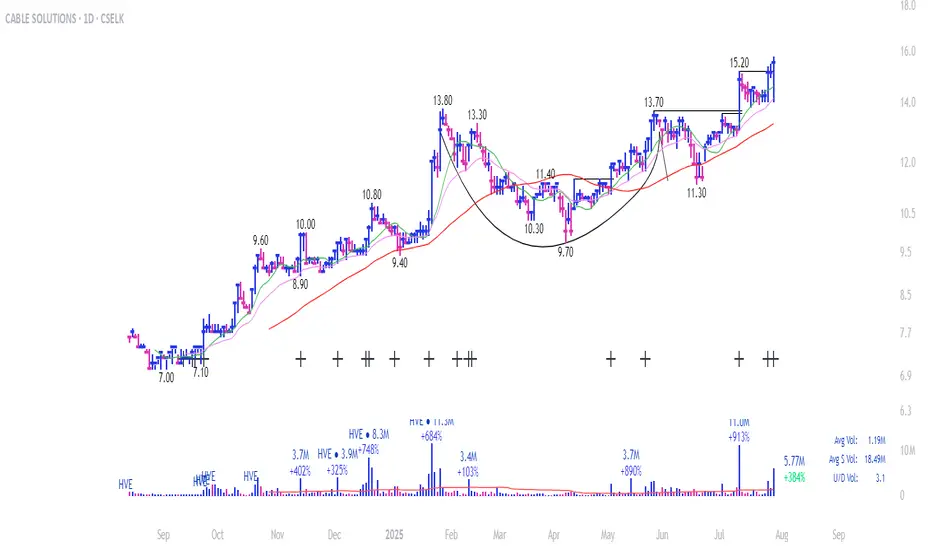
Sadi's Pocket Pivot Buy Signal (PP-B)Can be used to identify early entries within a basing period or later on as the stock breaks out and heads higher (continuation buy signals).
Helps in identifying low risk entries where the investor can pyramid into the stock and hence manage risk better.
Makes sure you get in when the trade in working in your favor and avoid putting good money after bad.
ALFA ATC LondonThis indicator is a data indicator focused on the algorithmic opening prices of stock exchanges and shows these areas. Bias can be obtained from these areas. Trades can be executed by taking advantage of the price's ability to test and hold these areas. The indicator, AS ATC5, includes opening information for the CM New York, London, Frankfurt, and Tokyo stock exchanges. This indicator is designed solely for London and Frankfurt.

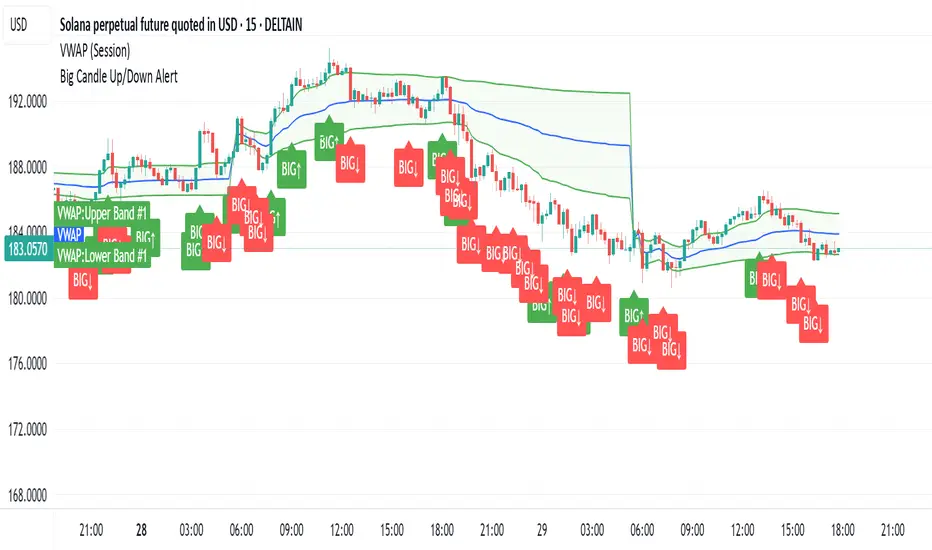
Big CandleBig Candles, most of the times, indicate actions by market makers . Also the candle high and low can be thought of as liquidity zones.
Weekly % Change Screener (5% Sell Threshold)This is a weekly screener for a 5% change in the stock value. If it increases by 5%, we sell and if it decreases by 5% we buy the stock. Good for stable high value stocks. Buy before testing.

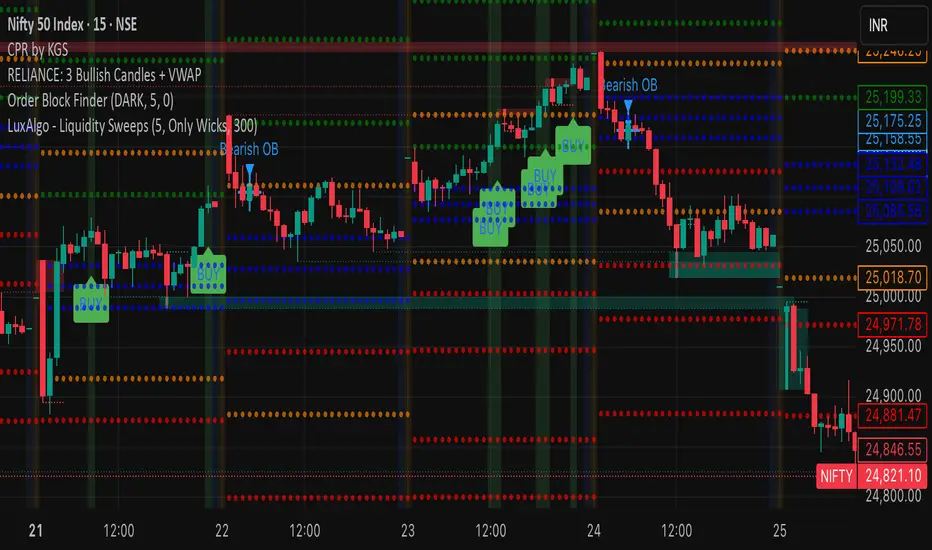
RELIANCE: 3 Bullish Candles + VWAPIts a script to track 3 consecutive candles of any stock. This helps understand the trends and makes up for buy signals. Please test before buying.
Trend Flow Oscillator (CMF + MFI) + ADX## Trend Flow Oscillator (TFO + ADX) Indicator Description
The Trend Flow Oscillator (TFO+ADX) combines two volume-based indicators, Money Flow Index (MFI) and Chaikin Money Flow (CMF), along with the Average Directional Index (ADX) into one comprehensive oscillator. This indicator provides traders with insights into momentum, volume flow, and trend strength, clearly indicating bullish or bearish market conditions.
### How the Indicator Works:
1. **Money Flow Index (MFI)**:
* Measures buying and selling pressure based on price and volume.
* Scaled from -1 to +1 (where positive values indicate buying pressure, negative values indicate selling pressure).
2. **Chaikin Money Flow (CMF)**:
* Evaluates money flow volume over a set period, reflecting institutional buying or selling.
* Also scaled from -1 to +1 (positive values suggest bullish accumulation, negative values bearish distribution).
3. **Average Directional Index (ADX)**:
* Measures trend strength, indicating whether a market is trending or ranging.
* Scaled from -1 to +1, with values above 0 suggesting strong trends, and values near or below 0 indicating weak trends or sideways markets.
* Specifically, an ADX value of 0 means neutral trend strength; positive values indicate a strong trend.
### Indicator Levels and Interpretation:
* **Zero Line (0)**: Indicates neutral conditions. When the oscillator crosses above zero, it signals increasing bullish momentum; crossing below zero indicates bearish momentum.
* **Extreme Zones (+/- 0.75)**:
* Oscillator values above +0.75 are considered overbought or highly bullish.
* Oscillator values below -0.75 are considered oversold or highly bearish.
* The indicator features subtle background shading to visually highlight these extreme momentum areas for quick identification.
* Shading when values above or below the +/-1.0 level.
* **Color Coding**:
* Bright blue indicates strengthening bullish momentum.
* Dark blue signals weakening bullish momentum.
* Bright red indicates strengthening bearish momentum.
* Dark maroon signals weakening bearish momentum.

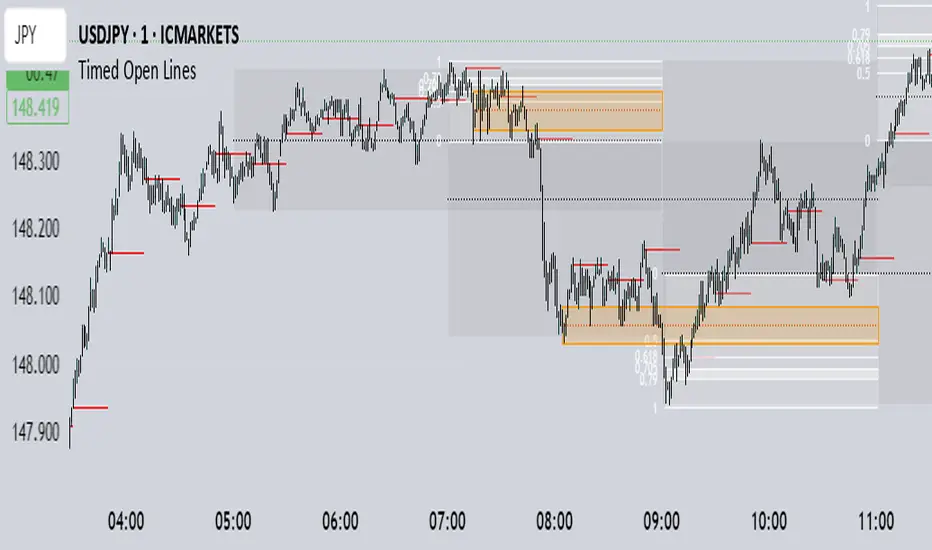
Bill Mensah - 10 / 30 / 50 Minute Open Lines Scientia maledictus sum.
Opening Macro lines extended, 10 / 30 / 50 Minute Open Lines

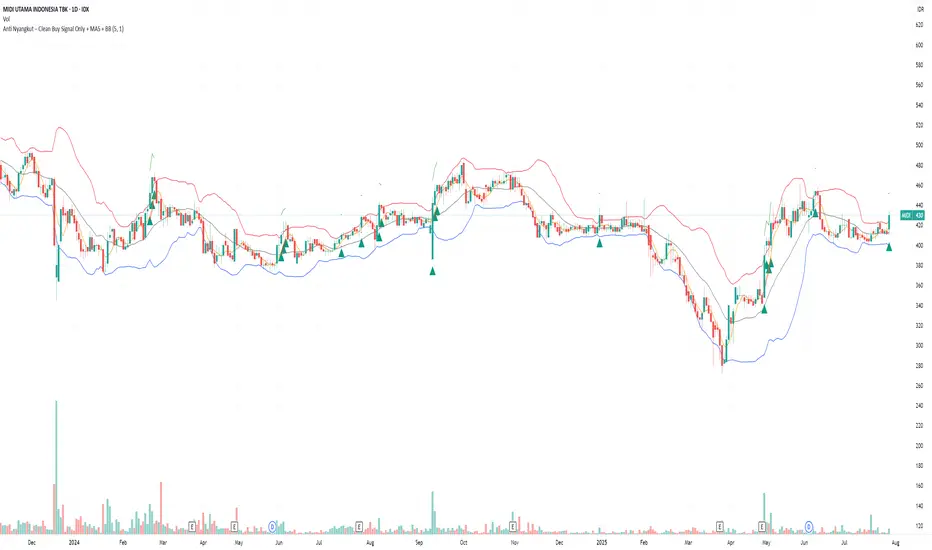
Anti Nyangkut – Indikator Karya Anak Bangsa Anti Nyangkut – Indikator Karya Anak Bangsa
Indikator ini khusus buat kamu yang sering beli di pucuk dan jual di support, lalu akhirnya jadi bahan backtest orang lain.
💡 Sinyal buy only - muncul kalau harga udah:
✅ Di atas MA5
✅ Di atas Bollinger Bands Upper
✅ Di atas VWAP (khusus 1H & 4H)
🟢 TP dan SL otomatis muncul — biar gak cuma "niat hold sampe hijau"
📊 Cocok buat scalping & swing di 1H / 4H / 1D
Gak ada sinyal jual. Exit di tangan masing-nasing, jangan lupa pasang SL.
—
100% gratis. Bayarnya pakai amal jariyah.
—
Anti Nyangkut – An Indicator by the People, for the People
This one's for you if you always buy the top, sell the bottom, and end up becoming someone else's backtest data.
💡 Buy-Only Signals — triggered when price is:
✅ Above MA5
✅ Above Bollinger Bands Upper
✅ Above VWAP (on 1H & 4H only)
🟢 Auto TP & SL lines — so you stop saying "I'll hold until it turns green"
📊 Perfect for scalping & swing trades on 1H / 4H / 1D
There’s no sell signal. Exits are your responsibility — just don’t skip the stop loss.
—
100% free. Just pay with good karma.
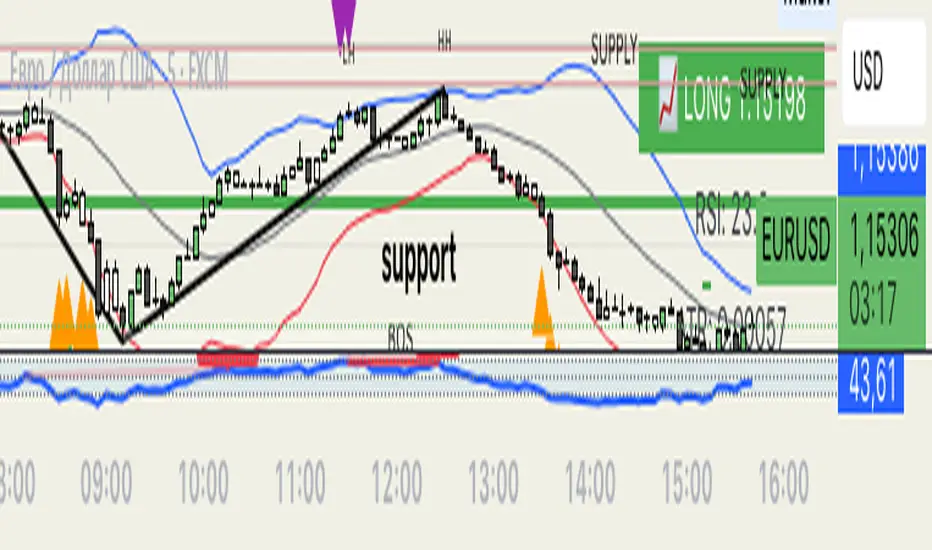
MJBFX VWAP WITH SIGNALSThe MJBFX VWAP Channel is a custom-built volume-weighted average price indicator designed around the MJBFX trading methodology.
This tool tracks multiple rolling VWAPs anchored to a user-defined timeframe (default: 1H), then calculates percentile levels (Max, Upper, Median, Lower, Min) to create a dynamic channel. These levels act as key support and resistance zones that adapt to market conditions.
🔶 Features:
Adjustable anchor period and VWAP count (up to 500 VWAPs)
Percentile-based VWAP levels (Max, Upper, Median, Lower, Min)
Customisable colours, widths, and line styles
Optional gradient channel fills
Anchor period highlights for session awareness
MJBFX Branded Signals:
🟠 Buy – Triggered when price crosses above the lower VWAP (MJBFX Orange)
⚪ Sell – Triggered when price crosses below the upper VWAP (MJBFX Grey)
Built-in alert conditions for automated trade notifications
🔶 How to Use:
The VWAP channel provides a dynamic structure for intraday trading.
Buy opportunities often occur when price sweeps below the lower band and reclaims it.
Sell opportunities often occur when price sweeps above the upper band and rejects.
Use in confluence with market structure, session timing, and your trading plan (e.g., MJB-FX Asian Sweep strategy).
Breakout Range Signal with Quality Analysis [Dova Lazarus]📌 Breakout Range Signal with Quality Analysis
🎓 Training-focused indicator for breakout logic, SL & TP behavior and signal quality assessment
🔷 PURPOSE
This tool identifies breakout candles from a calculated channel range and visually simulates entries, stop losses, and take profits, providing live and historical performance metrics.
⚙️ MAIN SETTINGS
1️⃣ Channel Setup
channel_length = 10 → how many candles are averaged to form channel boundaries
channel_multiplier = 0.0 → adds expansion above/below the base channel
channel_smoothing_type = SMA → smoothing method for high/low averaging
📊 The channel consists of two moving averages: one from highs, the other from lows. When expanded (via multiplier), it creates a buffer range for breakout validation.
2️⃣ Signal Detection
Body > Channel % = 50 → a breakout candle's body must exceed 150% of the channel width
Signal Mode:
• Weak → every valid breakout candle is highlighted
• Strong → only the first signal in a sequence is shown (helps reduce noise)
🟦 Bullish signals (blue):
• Candle opens inside the channel
• Closes above the channel
• Body is large enough
• Optional: confirms with trend (if enabled)
🟨 Bearish signals (yellow):
• Candle opens inside the channel
• Closes below the channel
• Body is large enough
• Optional: confirms with trend
3️⃣ Trend Filter (optional)
Enabled via checkbox
Uses a higher timeframe MA to filter signals
Bullish signals are allowed only if price is below the trend MA
Bearish signals only if price is above it
⏱️ trend_timeframe = 1D (typically set higher than the chart's timeframe)
🟢 Trend line is plotted if enabled
🎯 ENTRY, STOP LOSS & TAKE PROFIT LOGIC
SL and TP are based on channel width, not fixed pip/tick size:
📍 Entry Price = close of the breakout candle
🛑 Stop Loss:
• Bullish → below the lower channel border (minus offset)
• Bearish → above the upper channel border (plus offset)
🎯 Take Profit:
• Bullish → entry + channel width × profit multiplier
• Bearish → entry − channel width × profit multiplier
You can control:
Profit Target Multiplier (e.g., 1.0 → TP = 1×channel width)
Stop Loss Target Multiplier (e.g., 0.5 → SL = 0.5×channel width)
Signals to Show = how many historical SL/TP setups to display
📈 Lines and labels ("TP", "SL") are drawn on the chart for clarity.
🧪 QUALITY ANALYSIS MODULE
If enabled, the indicator will:
Track each new signal (entry, SL, TP)
Analyze outcomes:
• Win = TP hit before SL
• Loss = SL hit before TP
• Expired = signal unresolved after N bars
Display statistics in a table (top-right corner):
📋 Table fields:
✅ Overall win rate
📈 Bullish win rate
📉 Bearish win rate
🔢 Total signals
🕓 Pending (still active trades)
Maximum bars to wait for outcome is customizable (max_bars_to_analyze).
📐 VISUALIZATION TOOLS
TP / SL lines per signal
Labels “TP” and “SL”
Optional channel lines and trendline for better context
Colored bars for valid signals (blue/yellow)
📌 BEST USE CASES
Understand how breakout signals are formed
Learn SL/TP logic based on dynamic range
Test how volatility affects trade outcomes
Use as a visual simulation of trade behavior over time


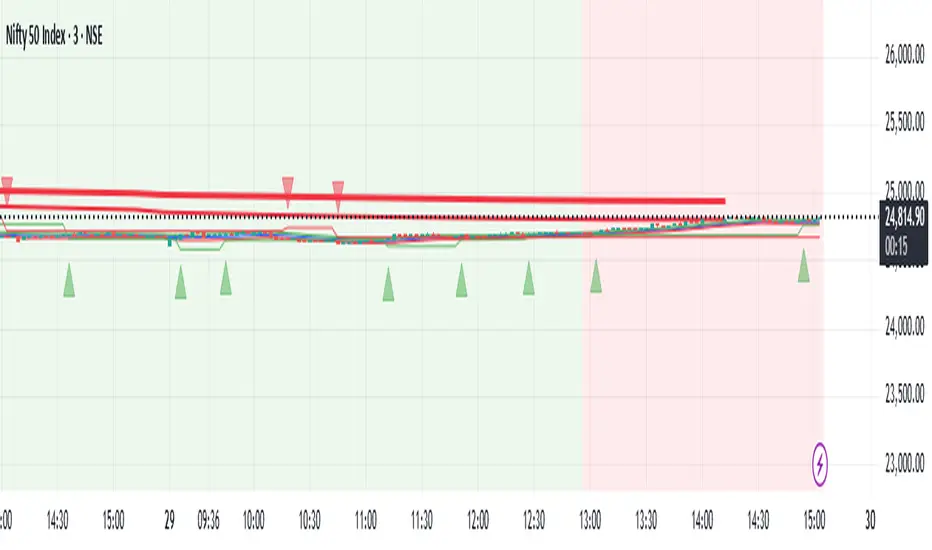
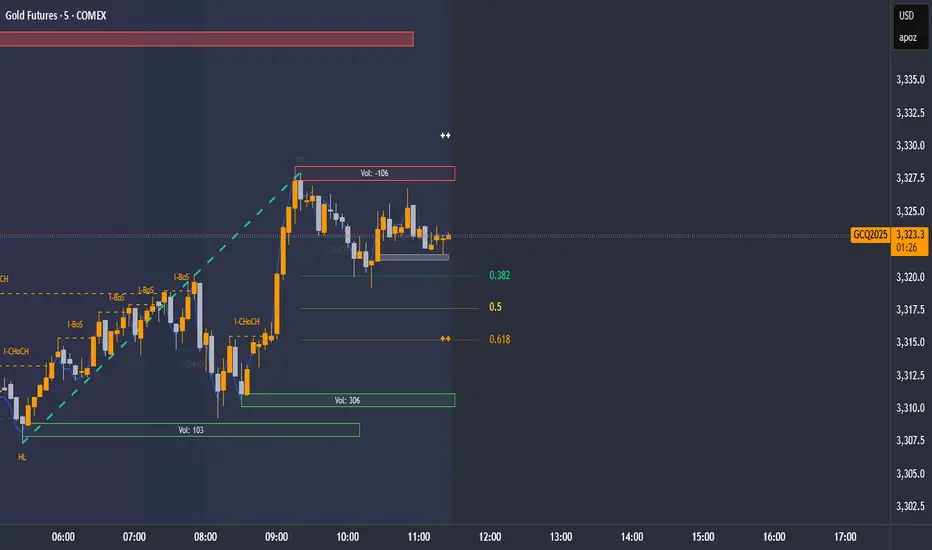
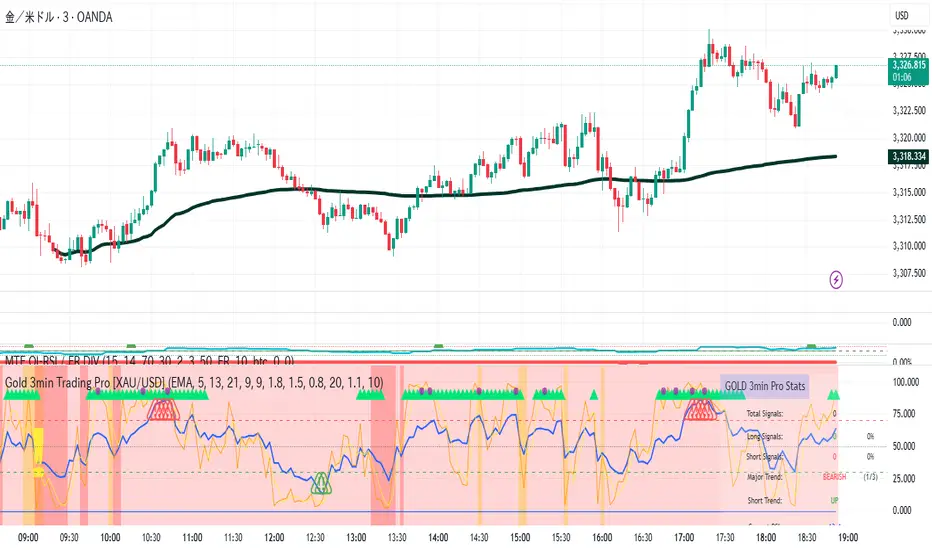
Gold 3min Trading Pro [XAU/USD]# Gold 3min Trading Pro - User Guide
## Overview
This is a professional scalping indicator specifically designed for Gold (XAU/USD) trading on 3-minute timeframes. It combines multiple technical analysis methods to provide high-probability entry signals for short-term trading.
## Key Features
### 1. Multi-Timeframe Trend Analysis
- **Major Trend**: Analyzes 15min, 1H, and 4H timeframes using moving averages
- **Short-term Trend**: Focuses on 3-minute price action and moving average alignment
- **Trend Strength**: Rated from 1-3 based on timeframe agreement
### 2. Core Indicators
- **RSI (9-period)**: Momentum oscillator for overbought/oversold conditions
- **Stochastic (9-period)**: %K and %D lines for entry timing
- **MACD**: Additional trend confirmation
- **Volume Analysis**: Detects volume spikes for signal validation
- **ATR-based Volatility Filter**: Ensures adequate market movement
### 3. Signal Types
- **Primary Signals**: Green triangles (LONG) and Red triangles (SHORT)
- **Enhanced Signals**: Stronger signals with multiple confirmations
- **Confirmation Signals**: Small circles for stochastic crossovers
## How to Use
### 1. Setup
- **Timeframe**: Use on 3-minute charts for Gold (XAU/USD)
- **Settings**: Default settings are optimized for Gold scalping
- **Session Filter**: Enable for London/New York sessions (recommended)
### 2. Entry Conditions
#### LONG Entry:
- Major trend is bullish (green background)
- Short-term trend is up or neutral
- RSI shows bullish momentum
- Stochastic indicates oversold recovery
- Volume spike confirmation
- Strong price action (bullish candle)
#### SHORT Entry:
- Major trend is bearish (red background)
- Short-term trend is down or neutral
- RSI shows bearish momentum
- Stochastic indicates overbought reversal
- Volume spike confirmation
- Strong price action (bearish candle)
### 3. Trade Management
- **Quick Target**: 50% of ATR-based calculation
- **Main Target**: Full ATR-based target
- **Stop Loss**: 60% of ATR below/above entry
- **Time Limit**: Exit if no progress within 20 bars (60 minutes)
### 4. Risk Management
- **Position Size**: Risk 1-2% of account per trade
- **Maximum Trades**: 3-5 trades per session
- **Avoid**: Low volatility periods and major news events
## Visual Elements
### Background Colors
- **Light Green**: Bullish major trend
- **Light Red**: Bearish major trend
- **Yellow**: Volume spike detected
- **Intense Colors**: Very strong trend alignment
### Chart Indicators
- **RSI Line (Blue)**: Main momentum indicator
- **Stochastic %K (Orange)**: Fast stochastic line
- **Stochastic %D (Yellow)**: Slow stochastic line
- **Horizontal Lines**: 70 (overbought), 30 (oversold), 50 (midline)
### Information Table (Top Right)
- Total signal count and performance statistics
- Current market conditions and trend strength
- RSI levels and volatility status
- Trading session information
- Last signal timing
## Alert System
### Standard Alerts
- **Scalp Long Signal**: Basic long entry signal
- **Scalp Short Signal**: Basic short entry signal
- **Premium Signals**: High-quality signals with strong confirmation
- **Trend Reversal**: Major trend change notifications
### Alert Setup
1. Right-click on chart → "Add Alert"
2. Select desired alert condition
3. Configure notification method (popup, email, webhook)
4. Set alert frequency to "Once Per Bar Close"
## Best Practices
### 1. Trading Sessions
- **Optimal**: London-NY overlap (3:00-5:00 PM EST)
- **Good**: London session (2:00-11:00 AM EST)
- **Avoid**: Asian session and major news releases
### 2. Market Conditions
- **Best**: Trending markets with normal to high volatility
- **Moderate**: Ranging markets during active sessions
- **Avoid**: Extremely low volatility or choppy conditions
### 3. Confirmation Rules
- Wait for signal triangle to appear
- Check that major trend aligns with signal direction
- Verify volume spike (yellow background)
- Ensure volatility is adequate (check info table)
### 4. Entry Timing
- Enter immediately after signal confirmation
- Use market orders for scalping speed
- Set stop loss and take profit levels immediately
## Settings Customization
### Essential Settings
- **MA Type**: EMA (recommended) or SMA
- **RSI Length**: 9 (default, can adjust 5-14)
- **Volume Threshold**: 1.8 (higher = fewer but stronger signals)
- **Volatility Filter**: Keep enabled for better signal quality
### Display Options
- **Show Scalping Signals**: Main entry signals
- **Show Performance Stats**: Information table
- **Show Trend Filter**: Background trend colors
- **Use Time Filter**: Session-based filtering
## Performance Optimization
### 1. Backtesting Tips
- Test on different market conditions
- Analyze win rate and average profit/loss
- Adjust settings based on historical performance
### 2. Signal Quality
- Higher trend strength (2-3) = better signals
- Volume confirmation improves success rate
- Enhanced signals have higher probability
### 3. Risk Control
- Never risk more than 2% per trade
- Use proper position sizing
- Stop trading after 3 consecutive losses
## Troubleshooting
### Common Issues
1. **No Signals**: Check volatility filter and session timing
2. **Too Many Signals**: Increase volume threshold or enable filters
3. **Poor Performance**: Verify timeframe (must be 3-minute) and symbol (XAU/USD)
### Support
- Ensure TradingView Pro+ subscription for multi-timeframe data
- Verify Gold symbol matches your broker's format
- Update to latest TradingView version
This indicator is designed for experienced traders familiar with scalping techniques and risk management. Always practice on demo accounts before live trading.
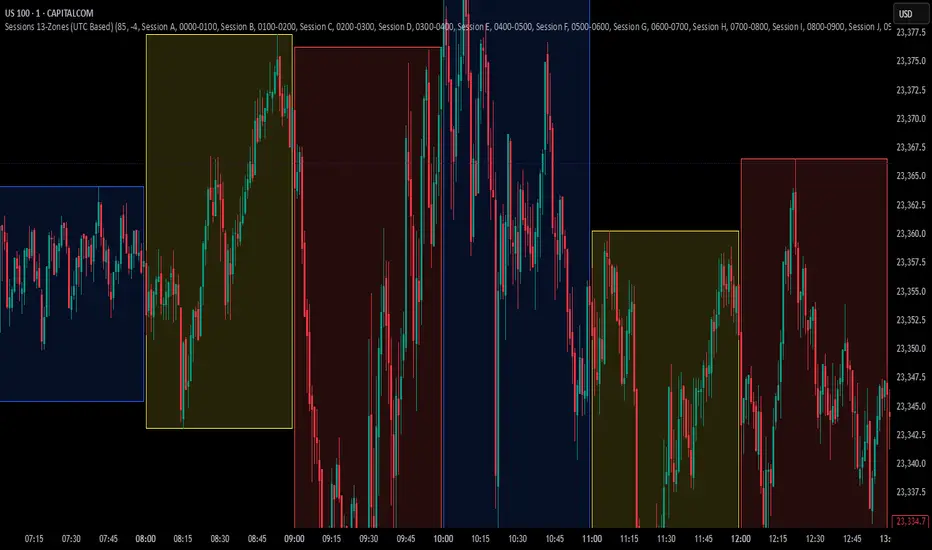
Sessions 13-Zones ValentijnJelteA simple indicator to display multiple sessions within sessions. For example, you can divide the New York session into different time slots of 3 hours, 1 hour, and 30 minutes, or whatever you need for your analysis.
EMA+ATR Band MTF Trend EntryThis is a Multi-Timeframe Trend Trading indicator strategy adapted from Sahil Rohmehtra’s Mentorship programme. The trading decision is made by first accessing the trend in higher timeframe (say Monthly) by using TWO EMAs. If the faster EMA (say 20 period) is above Slower EMA (say 50 period) and the price is above slower EMA then the trend is suitable for buyers. Similarly if faster EMA is below slow EMA and the price is below that then trend is suitable for sellers.
Once we access the trend in the higher timeframe we move to the lower timeframe (say Weekly) and access the 5-period RSI value. If RSI is below 30 then we can prepare for possible buy entry in lower (Daily) timeframe if entry conditions are met in daily timeframe. Similarly sell bias can be initiated when the higher timeframe EMA trend is down, daily RSI is above 70 and sell entry condition is met in daily timeframe. The RSI thresholds can be changed by the user.
Once we identified the RSI bias then wait for the confirmation candle in the lower timeframe (say 1 hour). In the entry timeframe we plot a band of 20 EMA of LOWs ± 1 ATR lines. Here,we wait for a candle to close above the 20 EMA of LOWs + 1 ATR for a buy signal with an increase in On Balance Volume (OBV) value. Similarly for sell signal we should get a candle close below the 20 EMA of LOWs - 1 ATR with corresponding change in OBV. This candle is the signal candle.
Once we get a Buy or Sell signal the corresponding stop loss is the nearest LOW - 1 ATR or HIGH + 1 ATR. The ATR scaling may be changed by the user. Now if another candle closes above the high of the buy signal candle then enter on buy. If the low of the buy signal candle is broken then it is a potential short-term sell entry. Similarly if another candle closes below the sell signal candle then enter short and if there is a close above high of the signal candle then it is a potential buy entry.