Institutional Footprint + RSIPurpose
Detect early signs of institutional activity (accumulation, distribution, shakeouts) using price and volume behavior, combined with RSI for confirmation.
How It Works
Footprint Score (0–100):
Above 70 → Possible accumulation
Below 30 → Possible distribution
Around 50 → Neutral
Shakeout signals: False breakdowns followed by strong recoveries
RSI Line: Plotted for confirmation
Why It Matters
Catches smart money moves before price reacts. Helps identify stealth accumulation or quiet exits not visible in price alone.
Features
Institutional Footprint + RSI
Shakeout markers
Visual zones
Usage Tips
Combine with RSI, VWAP, or support/resistance. For example: if Footprint shows accumulation and RSI is low, this may signal a high-probability buy setup
Best on 1H, 4H, or Daily timeframes
Not a standalone entry/exit signal
Indicators and strategies

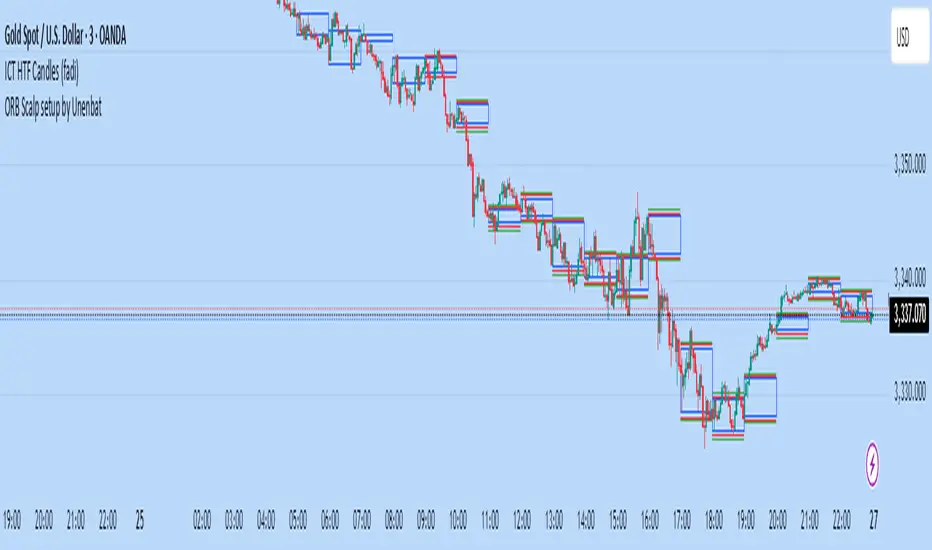
ORB Scalp setup by UnenbatDescription
ORB Scalp Setup by Unenbat is a precise breakout scalping tool that identifies short-term price ranges at the transition between hourly sessions.
📌 Core Features:
Draws a dynamic box using the price range from the last 3 minutes of the previous hour and the first 3 minutes of the new hour (total 5m59s range).
Automatically plots:
Box representing the selected range.
Opening Price Line at the start of the hour.
TP Lines (Take Profit) above and below the box at customizable distances.
BE Lines (Break-Even) above and below the box at customizable distances.
Box and line lengths are user-defined (default: 60 minutes).
Works across historical data (up to the last 100 days).
Fully customizable visuals (colors, offsets, visibility toggles).
🎯 How to Use:
Ideal for scalp traders using breakout strategies.
Enter trades when price breaks above or below the box range.
Use TP and BE lines as clear reference levels for exits or trailing stop logic.
⚙️ Custom Settings:
Enable/disable each component (box, open line, TP line, BE line).
Set your own offset in pips for TP/BE lines.
Adjust the box duration to match your trading style.
Modify start and end times of the range as needed.
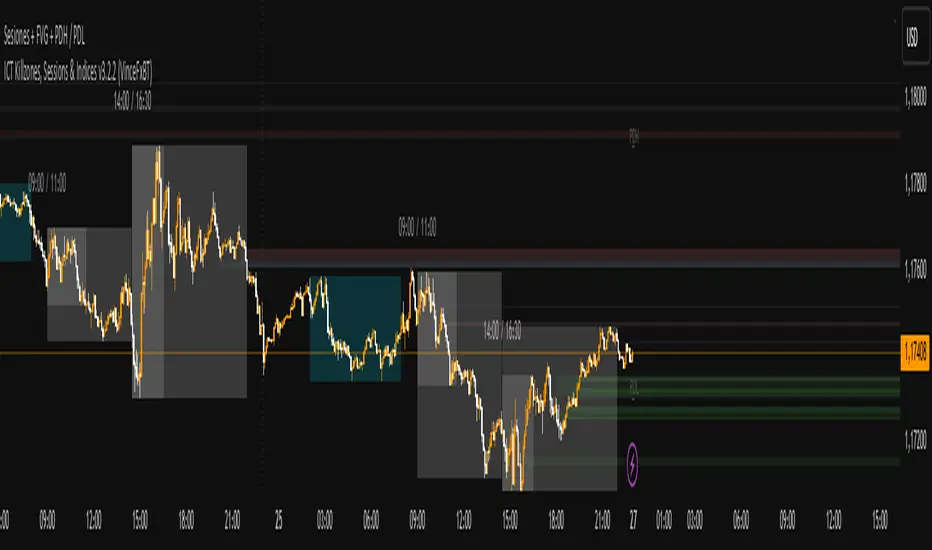
Sesiones + FVG + PDH / PDLMarket Sessions: Define and visualize four market sessions (New York, London, Tokyo, Sydney) with options to display ranges, trend lines, averages, VWAP, and highs/lows.
Dashboard: A panel that displays the status of the sessions (active/inactive) and, in advanced mode, the coefficient of determination (R2) of the trend line and the volume for each session.
Fair Value Gaps (FVG) / Imbalances: Detect and draw Fair Value Gaps (also known as imbalances or inefficiencies) on multiple time frames, with options to extend them, change their color when tested, and adjust their levels if the price touches them.
Previous Day/Week/Month Levels: Displays the highs and lows of the previous day and week (PDH/PDL, PWH/PWL), as well as the opening prices of the current day, week, and month (DO, WO, MO).
Hidden Liquidity Shift DetectorPurpose
The Hidden Liquidity Shift Detector identifies candles that indicate potential hidden accumulation or distribution activity based on volume and price action behavior. These setups often represent institutional absorption of liquidity ahead of larger moves.
How It Works
The script detects candles with the following characteristics:
Small real body relative to the total candle range
A strong wick (upper or lower) indicating rejection
Volume significantly higher than the recent average
It flags:
Hidden Selling (Distribution) when a bearish candle has a long upper wick and high volume
Hidden Buying (Accumulation) when a bullish candle has a long lower wick and high volume
These candles are often missed by traditional indicators but may precede significant reversals or breakouts.
Features
Automatic detection of absorption-style candles
Volume spike filtering based on configurable multiplier
Wick and body ratio thresholds to fine-tune signal quality
Non-intrusive signal markers (colored circles)
Real-time alerts for hidden buying/selling signals
Usage Tips
Use on 15m to 4H charts for intraday detection, or Daily for swing setups
Combine with support/resistance or volume profile zones for higher conviction
Clusters of signals in the same area increase reversal probability
Can be used alongside Wyckoff-style logic or smart money concepts

Smart Trap Candle Detector [Pro]Purpose
The Smart Trap Candle Detector is designed to identify common fakeout scenarios in the market, where price breaks a key swing high or low and quickly reverses. These “trap candles” often mislead breakout traders and are commonly used by smart money to induce liquidity before reversing.
How It Works
The script detects potential trap candles using these conditions:
A bearish trap is identified when price breaks above a recent swing high and closes back below it.
A bullish trap is identified when price breaks below a recent swing low and closes back above it.
Optional confirmation from the previous candle’s direction can be enabled.
Swing highs/lows are calculated dynamically using a configurable lookback window.
Once a trap candle is confirmed, a signal is displayed on the chart along with optional labels and alert conditions.
Features
Detects fake breakouts of swing highs and lows
Configurable swing lookback period
Optional confirmation candle filter
Optional label display on trap bars
Built-in alerts for bullish and bearish trap signals
Lightweight, real-time signal detection
Usage Tips
Best used on intraday timeframes such as 15m, 30m, or 1H
Use around key support/resistance zones or liquidity areas
Combine with other confluence signals such as order blocks or RSI divergence
Adjust the swing lookback period depending on the volatility of the asset

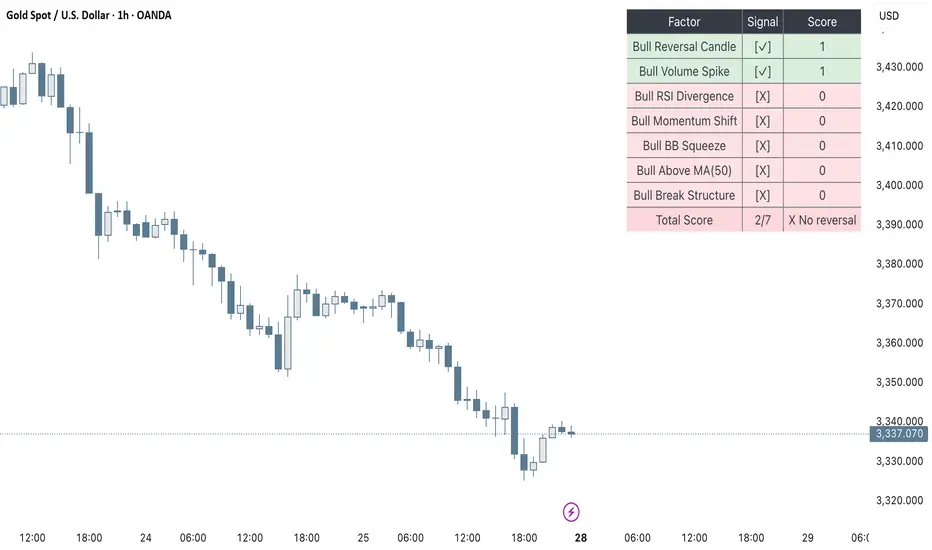
Clarix Smart Reversal ScorecardPurpose
Designed to identify potential trend reversal setups based on a rules-based scoring system. It helps traders quickly assess the strength of reversal signals using objective technical criteria.
How It Works
The script evaluates seven key technical conditions for both bullish and bearish reversals. Each condition met adds 1 point to the total score (max 7). A table displays the results with a final score and an automatic conclusion based on the strength of the setup.
Features
Reversal signal scoring from 0 to 7
Bullish and bearish detection modes
Visual scorecard table with individual factors
Configurable minimum score to show
Alert conditions for strong (5+) and perfect (7) setups
Lightweight and optimized for all timeframes
Usage Tips
Set "Direction" to Bullish, Bearish, or Both depending on your strategy
Use on timeframes between 15m to 4H for optimal signals
A score of 5 or more suggests strong reversal potential
Combine with key support/resistance or trend context for higher accuracy
Avoid using during high-volatility news events for cleaner signals
UngliMulti-Indicator Confluence System
This is a **multi-indicator confluence trading signal system** called "Ungli" that combines RSI, ADX, and MACD to identify high-probability momentum opportunities when used alongside chart pattern and trend line breakouts.
## Core Concept
The script identifies moments when multiple technical indicators align to suggest potential price momentum moves, specifically looking for oversold and overbought conditions with momentum confirmation. Use green and red highlights along with chart patterns and trend line breakouts that signal a breakout for confluence for a likely momentum move.
## Technical Indicators Used
**RSI (Relative Strength Index)**
- Default 14-period RSI
- Oversold threshold: < 40
- Overbought threshold: > 60
**ADX (Average Directional Index)**
- Default 14-period ADX with DI+ and DI-
- Threshold: 21
- Looks for ADX below threshold but ticking upward (momentum building)
**MACD (Moving Average Convergence Divergence)**
- Fast: 12, Slow: 26, Signal: 9
- Uses MACD line direction as trend filter
## Signal Logic
**Green Background (Bullish Momentum Signal):**
- RSI > 60 (overbought)
- ADX < 21 AND rising
- MACD line trending upward
**Red Background (Bearish Momentum Signal):**
- RSI < 40 (oversold)
- ADX < 21 AND rising
- MACD line trending downward
## Key Strategy Elements
1. **Confluence Approach**: Requires all three indicators to align, reducing false signals
2. **Momentum Filter**: ADX must be building (rising) even if low, indicating emerging trend strength
3. **Trend Confirmation**: MACD direction must match the expected move
4. **Visual Simplicity**: Clean background highlighting without chart clutter
5. **Pattern Integration**: Designed to work with chart patterns and breakout strategies
## Use Case
This indicator is designed for swing trading and breakout strategies, identifying moments when oversold/overbought conditions coincide with building momentum in the expected direction. The ADX filter helps avoid choppy, trendless markets. Best used in conjunction with:
- Support/resistance breakouts
- Chart pattern breakouts (triangles, flags, channels)
- Trend line breaks
- Key level violations
The background highlights serve as confluence confirmation when combined with your chart analysis and breakout setups.
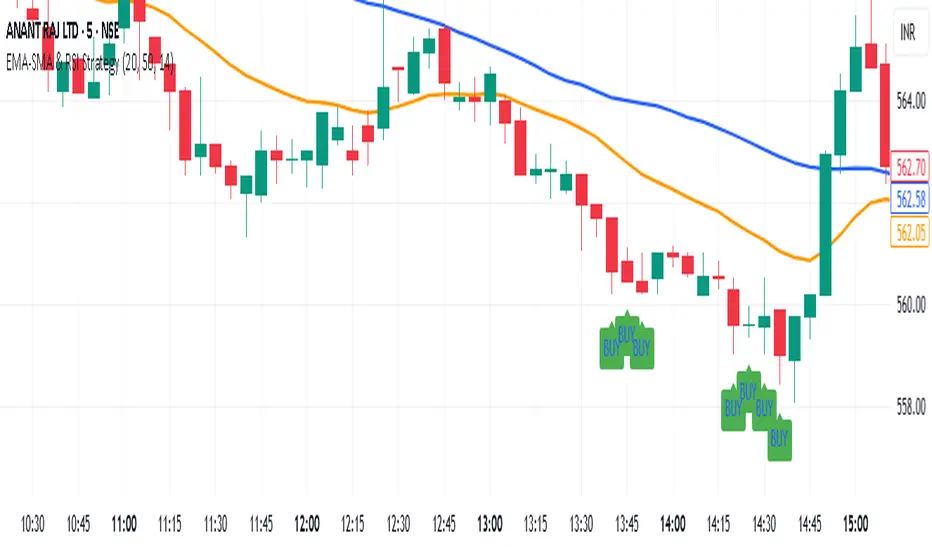
EMA-SMA & RSI Strategyusing RSI and EMA strategy, it works on RSI based rules as well as indicator based rules
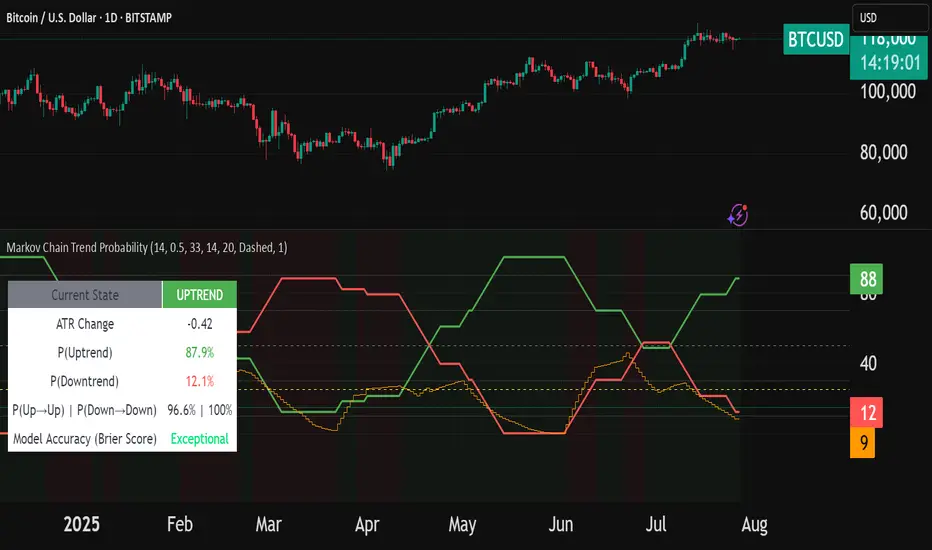
Markov Chain Trend ProbabilityA Markov Chain is a mathematical model that predicts future states based on the current state, assuming that the future depends only on the present (not the past). Originally developed by Russian mathematician Andrey Markov, this concept is widely used in:
Finance: Risk modeling, portfolio optimization, credit scoring, algorithmic trading
Weather Forecasting: Predicting sunny/rainy days, temperature patterns, storm tracking
Here's an example of a Markov chain: If the weather is sunny, the probability that will be sunny 30 min later is say 90%. However, if the state changes, i.e. it starts raining, how the probability that will be raining 30 min later is say 70% and only 30% sunny.
Similar concept can be applied to markets price action and trends.
Mathematical Foundation
The core principle follows the Markov Property: P(X_{t+1}|X_t, X_{t-1}, ..., X_0) = P(X_{t+1}|X_t)
Transition Matrix :
-------------Next State
Current----
--------P11 P12
-----P21 P22
Probability Calculations:
P(Up→Up) = Count(Up→Up) / Count(Up states)
P(Down→Down) = Count(Down→Down) / Count(Down states)
Steady-state probability: π = πP (where π is the stationary distribution)
State Definition:
State = UPTREND if (Price_t - Price_{t-n})/ATR > threshold
State = DOWNTREND if (Price_t - Price_{t-n})/ATR < -threshold
How It Works in Trading
This indicator applies Markov Chain theory to market trends by:
Defining States: Classifies market conditions as UPTREND or DOWNTREND based on price movement relative to ATR (Average True Range)
Learning Transitions: Analyzes historical data to calculate probabilities of moving from one state to another
Predicting Probabilities: Estimates the likelihood of future trend continuation or reversal
How to Use
Parameters:
Lookback Period: Number of bars to analyze for trend detection (default: 14)
ATR Threshold: Sensitivity multiplier for state changes (default: 0.5)
Historical Periods: Sample size for probability calculations (default: 33)
Trading Applications:
Trend confirmation for entry/exit decisions
Risk assessment through probability analysis
Market regime identification
Early warning system for potential trend reversals
The indicator works on any timeframe and asset class. Enjoy!
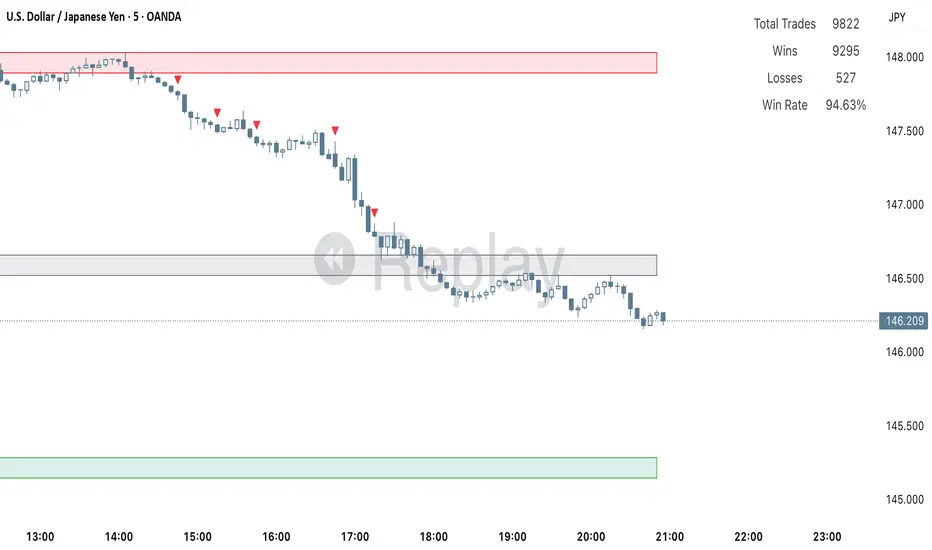
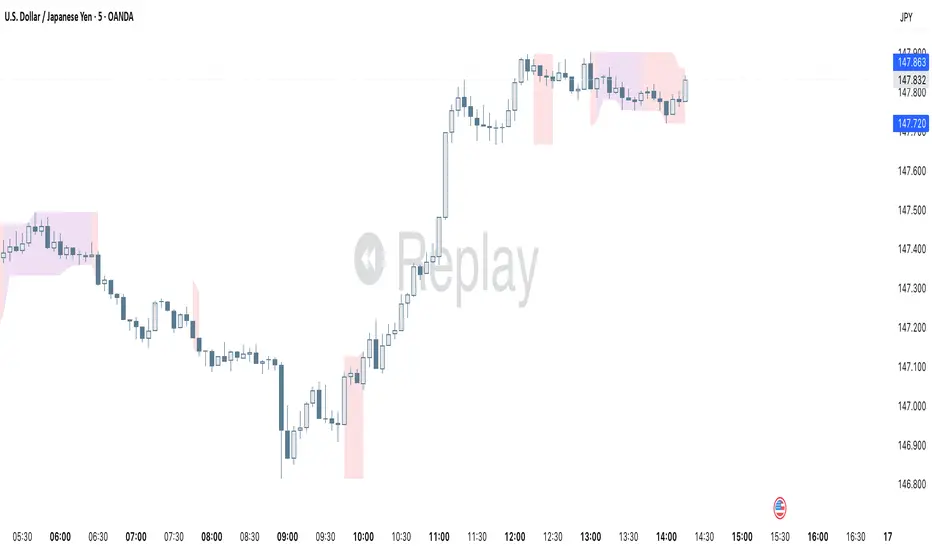
Clarix 5m Scalping Breakout StrategyPurpose
A 5-minute scalping breakout strategy designed to capture fast 3-5 pip moves, using premium/discount zone filters and market bias conditions.
How It Works
The script monitors price action in 5-minute intervals, forming a 15-minute high and low range by tracking the highs and lows of the first 3 consecutive 5-minute candles starting from a custom time. In the next 3 candles, it waits for a breakout above the 15m high or below the 15m low while confirming market bias using custom equilibrium zones.
Buy signals trigger when price breaks the 15m high while in a discount zone
Sell signals trigger when price breaks the 15m low while in a premium zone
The strategy simulates trades with fixed 3-5 pip take profit and stop loss values (configurable). All trades are recorded in a backtest table with live trade results and an automatically updated win rate.
Features
Designed exclusively for the 5-minute timeframe
Custom 15-minute high/low breakout logic
Premium, Discount, and Equilibrium zone display
Built-in backtest tracker with live trade results, statistics, and win rate
Customizable start time, take profit, and stop loss settings
Real-time alerts on breakout signals
Visual markers for trade entries and failed trades
Consistent win rate exceeding 90–95% on average when following market conditions
Usage Tips
Use strictly on 5-minute charts for accurate signal performance. Avoid during high-impact news releases.
Important: Once a trade is opened, manually set your take profit at +3 to +5 pips immediately to secure the move, as these quick scalps often hit the target within a single candle. This prevents missed exits during rapid price action.
Clarix Smart FlipPurpose
This tool identifies high-probability intraday reversals by detecting when price flips through the daily open after strong early-session commitment.
How It Works
A valid flip occurs when:
The previous daily candle is bullish or bearish
The first hour today continues in the same direction
Then, the price flips back through the daily open with a minimum break threshold (user-defined)
This setup is designed to catch liquidity grabs or fakeouts near the daily open, where early buyers or sellers get trapped after showing commitment
Signal Logic
Buy Flip
Previous day bearish → first hour bearish → price flips above open
Sell Flip
Previous day bullish → first hour bullish → price flips below open
Features
Configurable flip threshold in percentage
Signals only activate after the first hour ends
Daily open line displayed on chart
Simple triangle markers with no visual clutter
Alerts ready to use for automation or notifications
Usage Tips
Use "Once Per Bar" alert mode to get notified immediately when the flip happens
Works best in active markets like FX, indices, or crypto
Adjust threshold based on asset volatility
Suggested stop loss: use the previous daily high for sell flips or the previous daily low for buy flips
Suggested take profit: secure at least 30 pips to aim for a 1:3 risk-to-reward ratio on average
Choppiness ZONE OverlayPurpose
This script overlays choppiness zones directly onto the price chart to help traders identify whether the market is trending or ranging. It is designed to filter out low-probability trades during high choppiness conditions.
How It Works
Calculates the Choppiness Index over a user-defined period using ATR and price range.
Divides choppiness into four zones:
30 to 40: Low choppiness, possible trend initiation, shown in yellow.
40 to 50: Moderate choppiness, transition zone, shown in orange.
50 to 60: High choppiness, weakening momentum, shown in red.
60 and above: Extreme choppiness, avoid trading, shown in purple.
Highlights each zone with customizable color fills between the high and low of the selected range.
Triggers a real-time alert when choppiness exceeds 60.
Features
Customizable choppiness zones and color settings.
Real-time alert when market becomes extremely choppy (choppiness ≥ 60).
Visual zone overlay on the price chart.
Compatible with all timeframes.
Lightweight and responsive for scalping, intraday, or swing trading.
Tips
Use this tool as a volatility or trend filter.
Combine it with momentum or trend-following indicators to improve trade selection.
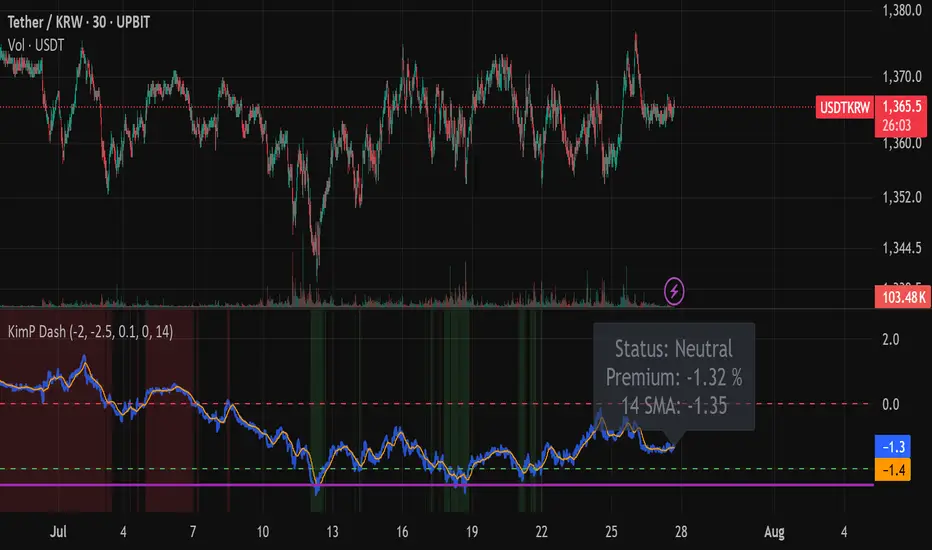
Kimchi Premium Dashboard (Final)📜 Kimchi Premium Dashboard (Live & Daily Log)
🚀 Summary
This indicator is an all-in-one dashboard that tracks the real-time price difference of USDT (Tether) between a Korean exchange (Upbit) and a global exchange (Coinbase). This difference is commonly known as the "Kimchi Premium" (Kimp) or "Reverse Premium."
Going beyond a simple premium display, this tool is designed to assist with arbitrage and swing trading strategies by providing intuitive visualizations, a smart multi-tier alert system, and a daily data logging feature.
✨ Key Features
Real-time Premium Calculation: Accurately calculates the premium in percentage (%) based on the USDT prices from Upbit and Coinbase, and the live USD/KRW exchange rate.
Intuitive Zone Visualization: Instantly identify whether the premium is in a Buy, Sell, or Neutral zone through dynamic background coloring.
Smart Alert System: Delivers systematic alerts for key events like the initial -2.0% entry, a critical -2.5% breach, and subsequent new lows, all without unnecessary spam. (Can be toggled ON/OFF in settings).
Hybrid Dashboard: Features both a real-time status label and a daily log that records the day's significant low points.
📊 Visual Components Explained
Lines
🔵 Blue Line (Premium Line): This is the core real-time premium value (%). The position of this line is most important.
🟠 Orange Line (SMA Line): This is the moving average of the premium. It helps identify the overall trend beyond short-term volatility.
Zones
🟩 Green Zone (Buy Zone): This area, typically below -2.0%, indicates a "Reverse Premium" where the Korean price is significantly lower than the global price. It represents a potential buying opportunity for arbitrage.
🟥 Red Zone (Kimp Zone): This area, typically above 0%, indicates a "Kimchi Premium" where the Korean price is higher. This represents a potential selling or profit-taking opportunity.
Dashboard
Live Status Label: Located on the right, this label displays the precise premium value, the current zone status (Buy/Sell/Neutral), and the SMA value in real-time.
Today's Lows Log: Located on the left, this table records the time and level of significant lows (below -2.5%) broken during the day. It resets automatically at midnight (UTC).
🔔 Alerts & How to Use
This indicator provides a systematic 3-tier alert system designed for arbitrage strategies. (Must be enabled via "Enable Real-time Alerts?" in settings).
✅ Good Opportunity (-2.0%): A one-time alert triggers upon the first entry into the initial buying zone.
🚨 BIG Opportunity (-2.5%): A distinct, high-priority alert triggers when this more critical level is breached.
📞 Granular Tracking (Below -2.5%): Receive alerts for each new low in -0.1% increments for precise tracking during the best opportunities.
A recommended hybrid strategy is to keep alerts off for daily review using the "Today's Lows Log," and turn them on only during critical periods for real-time action.
Disclaimer: The information provided by this indicator is for reference purposes only and does not constitute financial advice. All investment decisions and risks are the sole responsibility of the user.
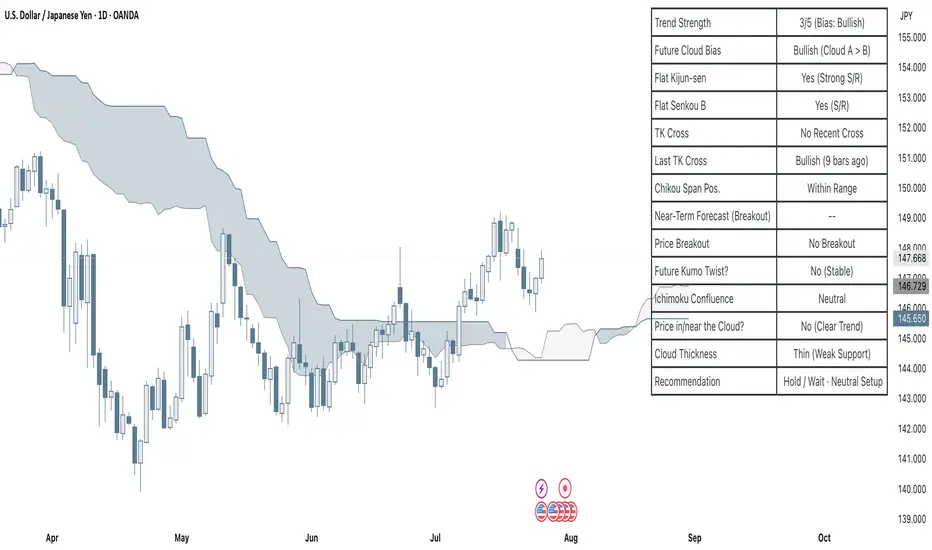
Clarix Ichimoku DashboardPurpose
The Mariam Ichimoku Dashboard is designed to simplify the Ichimoku trading system for both beginners and experienced traders. It provides a complete view of trend direction, strength, momentum, and key signals all in one compact dashboard on your chart. This tool helps traders make faster and more confident decisions without having to interpret every Ichimoku element manually.
How It Works
1. Trend Strength Score
Calculates a score from -5 to +5 based on Ichimoku components.
A high positive score means strong bullish momentum.
A low negative score shows strong bearish conditions.
A near-zero score indicates a sideways or unclear market.
2. Future Cloud Bias
Looks 26 candles ahead to determine if the future cloud is bullish or bearish.
This helps identify the longer-term directional bias of the market.
3. Flat Kijun / Flat Senkou B
Detects flat zones in the Kijun or Senkou B lines.
These flat areas act as strong support or resistance and can attract price.
4. TK Cross
Identifies Tenkan-Kijun crosses:
Bullish Cross means Tenkan crosses above Kijun
Bearish Cross means Tenkan crosses below Kijun
5. Last TK Cross Info
Shows whether the last TK cross was bullish or bearish and how many candles ago it happened.
Helps track trend development and timing.
6. Chikou Span Position
Checks if the Chikou Span is above, below, or inside past price.
Above means bullish momentum
Below means bearish momentum
Inside means mixed or indecisive
7. Near-Term Forecast (Breakout)
Warns when price is near the edge of the cloud, preparing for a potential breakout.
Useful for anticipating price moves.
8. Price Breakout
Shows if price has recently broken above or below the cloud.
This can confirm the start of a new trend.
9. Future Kumo Twist
Detects upcoming twists in the cloud, which often signal potential trend reversals.
10. Ichimoku Confluence
Measures how many key Ichimoku signals are in agreement.
The more signals align, the stronger the trend confirmation.
11. Price in or Near the Cloud
Displays if the price is inside the cloud, which often indicates low clarity or a choppy market.
12. Cloud Thickness
Shows whether the cloud is thin or thick.
Thick clouds provide stronger support or resistance.
Thin clouds may allow easier breakouts.
13. Recommendation
Gives a simple trading suggestion based on all major signals.
Strong Buy, Strong Sell, or Hold.
Helps simplify decision-making at a glance.
Features
All major Ichimoku signals summarized in one panel
Real-time trend strength scoring
Detects flat zones, crosses, cloud twists, and breakouts
Visual alerts for trend alignment and signal confluence
Compact, clean design
Built with simplicity in mind for beginner traders
Tips
Best used on 15-minute to 1-hour charts for short-term trading
Avoid entering trades when price is inside the cloud because the market is often indecisive
Wait for alignment between trend score, TK cross, cloud bias, and confluence
Use the dashboard to support your trading strategy, not replace it
Enable alerts for major confluence or upcoming Kumo twists
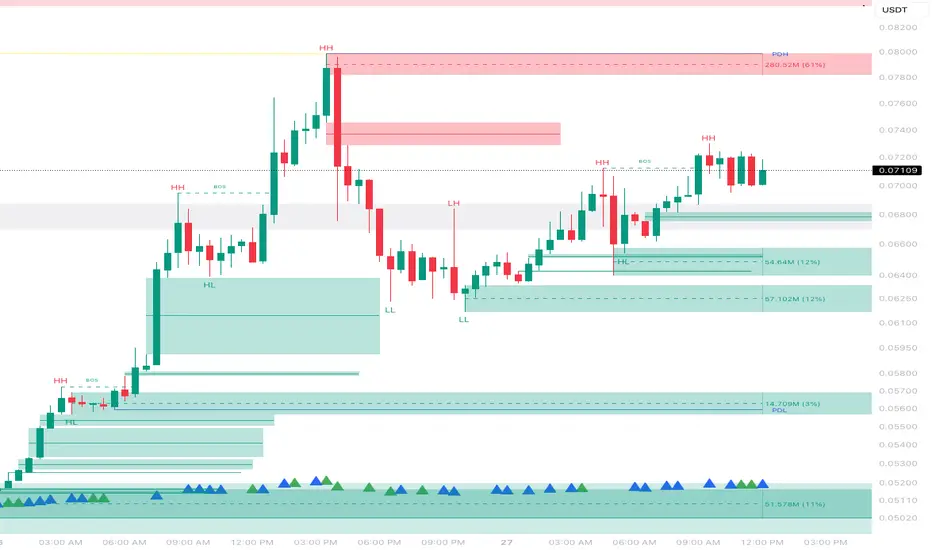
Custom ZigZag IndicatorOverview
The Custom ZigZag Indicator is a technical analysis tool built in Pine Script (version 5) for TradingView. It overlays on price charts to visualize market trends by connecting significant swing highs and lows, filtering out minor price noise. This helps identify the overall market direction (uptrends or downtrends), potential reversal points, and key support/resistance levels. Unlike standard price lines, it "zigzags" only between meaningful pivots, making trends clearer.
Core Logic and How It Works
The script uses a state-machine approach to track market direction and pivots:
Initialization
Starts assuming an upward trend on the first bar.
sets initial high/low prices and bar indices based on the current bar's high/low.
Direction Tracking:
Upward Trend (direction = 1):
Monitors for new highs: If the current high exceeds the tracked high, update the high price and bar.
Checks for reversal: If the low drops below the high by the deviation percentage (e.g., high * (1 - 0.05) for 5%), it signals a downtrend reversal.
Draws a green line from the last pivot (low) to the new high.
If labels are enabled, adds a label: "HH" (Higher High if above previous high), "LH" (Lower High if below), or "H" (for the first one).
Updates the last high and switches to downward direction.
Downward Trend (direction = -1):
Monitors for new lows: If the current low is below the tracked low, update the low price and bar.
Checks for reversal: If the high rises above the low by the deviation percentage (e.g., low * (1 + 0.05)), it signals an uptrend reversal.
Draws a red line from the last pivot (high) to the new low.
If labels are enabled, adds a label: "LL" (Lower Low if below previous low), "HL" (Higher Low if above), or "L" (for the first one).
Updates the last low and switches to upward direction.

Volume in ₹ (Total Traded Value in Crores)vikram dayal volume chart with total traded value in crores

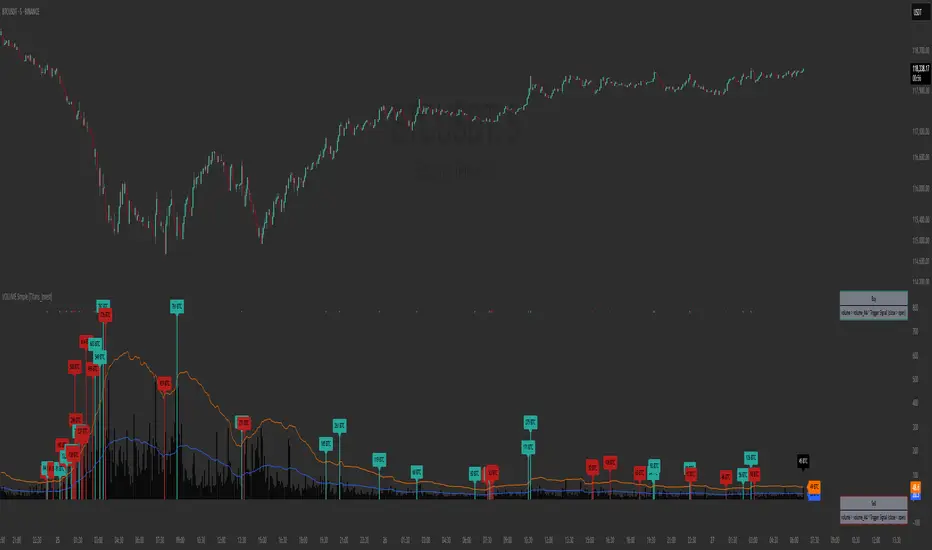
VOLUME Simple [Titans_Invest]VOLUME Simple
A streamlined volume analysis tool crafted for simplicity and smart signal detection.
Although simple in appearance, this indicator brings intelligent volume-based entries through configurable logic. Its design emphasizes clean and effective interpretation of volume signals.
⯁ WHAT IS THE VOLUME INDICATOR❓
The Volume indicator is a fundamental technical analysis tool that measures the number of shares or contracts traded in a security or market during a given period. It helps traders and investors understand the strength or weakness of a price movement, confirm trends, and predict potential reversals. Volume is typically displayed as a histogram below a price chart, with each bar representing the volume traded during a specific time interval.
⯁ HOW TO USE THE VOLUME❓
The Volume indicator can be used in several ways to enhance trading decisions:
• Trend Confirmation: High volume during a price move confirms the strength of that trend, while low volume can indicate a weak or unsustainable trend.
• Breakouts: A price breakout from a pattern or range accompanied by high volume is more likely to be valid and sustainable.
• Divergence: When the price moves in one direction and volume moves in the opposite direction, it can signal a potential reversal.
• Overbought/Oversold Conditions: Extreme volume levels can sometimes indicate that an asset is overbought or oversold, though this is less straightforward than with oscillators like the RSI.
⯁ ENTRY CONDITIONS
The conditions below are fully flexible and allow for complete customization of the signal.
______________________________________________________
🔹 CONDITIONS TO BUY 📈
______________________________________________________
▪︎ Signal Validity: The signal will remain valid for X bars .
🔹 volume > volume_MA * Trigger Signal (close > open)
🔹 volume > volume_MA * Trigger Signal (Keep State)
______________________________________________________
______________________________________________________
🔸 CONDITIONS TO SELL 📉
______________________________________________________
▪︎ Signal Validity: The signal will remain valid for X bars .
🔸 volume > volume_MA * Trigger Signal (close > open)
🔸 volume > volume_MA * Trigger Signal (Keep State)
______________________________________________________
______________________________________________________
🤖 AUTOMATION 🤖
• You can automate the BUY and SELL signals of this indicator.
______________________________________________________
______________________________________________________
⯁ UNIQUE FEATURES
______________________________________________________
Signal Validity: The signal will remain valid for X bars
Condition Table: BUY/SELL
Condition Labels: BUY/SELL
Plot Labels in the Graph Above: BUY/SELL
Automate and Monitor Signals/Alerts: BUY/SELL
Signal Validity: The signal will remain valid for X bars
Table of Conditions: BUY/SELL
Conditions Label: BUY/SELL
Plot Labels in the graph above: BUY/SELL
Automate & Monitor Signals/Alerts: BUY/SELL
______________________________________________________
📜 SCRIPT : VOLUME Simple
🎴 Art by : @Titans_Invest & @DiFlip
👨💻 Dev by : @Titans_Invest & @DiFlip
🎑 Titans Invest — The Wizards Without Gloves 🧤
✨ Enjoy!
______________________________________________________
o Mission 🗺
• Inspire Traders to manifest Magic in the Market.
o Vision 𐓏
• To elevate collective Energy 𐓷𐓏
🧠 Rogue BTC Dominance + BTC Price MonitorLiquidity never lies.
When whales are done pumping, they exit before price tanks, often during sideways chop or fake strength.
So we build a tracker that detects:
Volume drop during uptrend (distribution phase)
Exchange inflows of coins
Rising USDT.D while price holds → stealth exit
Divergence between price & on-chain flows
👁️ Quick Use Case: BTC/USDT with USDT.D Overlay
If you see this pattern:
BTC sideways or slow uptrend
Volume declining
USDT.D rising
BTC.D holding flat
→ Liquidity Exit Detected.
Smart money is exiting quietly, waiting for retail to hold the bag.
GLOBEX BOX v1.0All credit to the creator and teacher of this strategy, @RS.
The "GOBEX BOX v1.0" indicator draws customizable horizontal rectangles (with optional midlines and labels) around specific opening candles in the EST timezone ("America/New_York").
It highlights:
The 09:30–09:31 EST 1-minute candle high/low for Monday through Friday.
The 18:00–18:05 EST 5-minute candle high/low for Sunday through Thursday.
Various customizable features are in the indicator settings.
Happy trading!

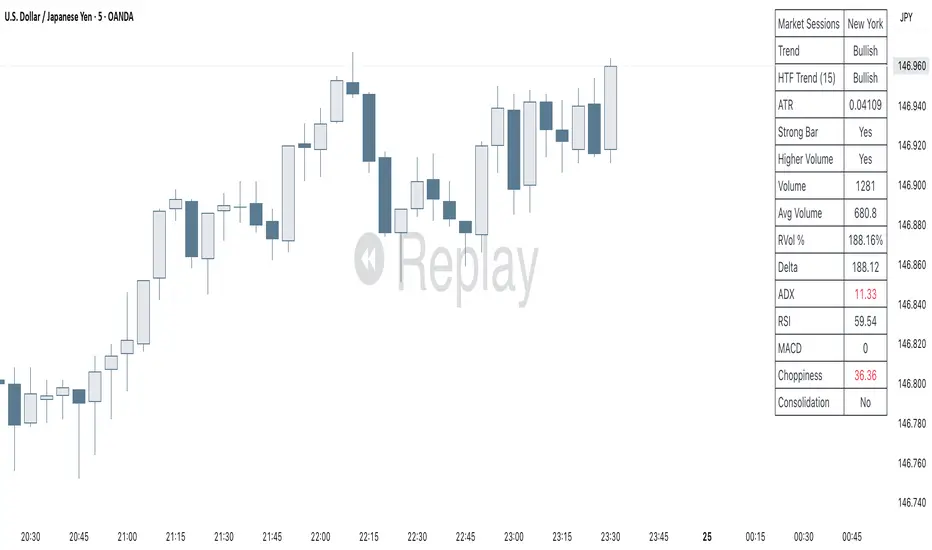
Clarix Market DashboardPurpose :
Shows if the market is trending, volatile, or stuck so you can decide when to trade or wait.
How to Use
Add the indicator to your chart. Adjust basic settings like EMA, RSI, ATR lengths, and timezone if needed. Use it before entering any trade to confirm market conditions.
What Each Metric Means (with general ranges)
Session: Identifies which market session is active (New York, London, Tokyo).
Trend: Shows current market direction. “Up” means price above EMA and VWAP, “Down” means price below. Use this to confirm bullish or bearish bias.
HTF Trend: Confirms trend on a higher timeframe for stronger signals.
ATR (Average True Range): Measures market volatility or price movement speed.
Low ATR (e.g., below 0.5% of price) means quiet or slow market; high ATR (above 1% of price) means volatile or fast-moving market, good for active trades.
Strong Bar: A candlestick closing near its high (above 75% of range) indicates strong buying momentum; closing near its low indicates strong selling momentum.
Higher Volume: Volume higher than average (typically 10-20% above normal) means more market activity and stronger moves.
Volume / Avg Volume: Ratio above 1.2 (120%) shows volume is significantly higher than usual, signaling strong interest.
RVol % (Relative Volume %): Above 100% means volume is hotter than normal, increasing chances of strong moves; below 50% means low activity and possible indecision.
Delta: Difference between buying and selling volume (if available). A positive delta means buyers dominate; negative means sellers dominate.
ADX (Average Directional Index): Measures trend strength:
Below 20 means weak or no trend;
Above 25 means strong trend;
Between 20-25 is moderate trend.
RSI (Relative Strength Index): Momentum oscillator:
Below 30 = oversold (potential buy);
Above 70 = overbought (potential sell);
Between 40-60 means neutral momentum.
MACD: Confirms momentum direction:
Positive MACD histogram bars indicate bullish momentum;
Negative bars indicate bearish momentum.
Choppiness Index: Measures how much the market is ranging versus trending:
Above 60 = very choppy/sideways market;
Below 40 = trending market.
Consolidation: When true, price is stuck in a narrow range, signaling indecision. Avoid breakout trades during this.
Quick Trading Reminder
Trade only when the trend is clear and volume is above average. Avoid trading in low volume or choppy markets.
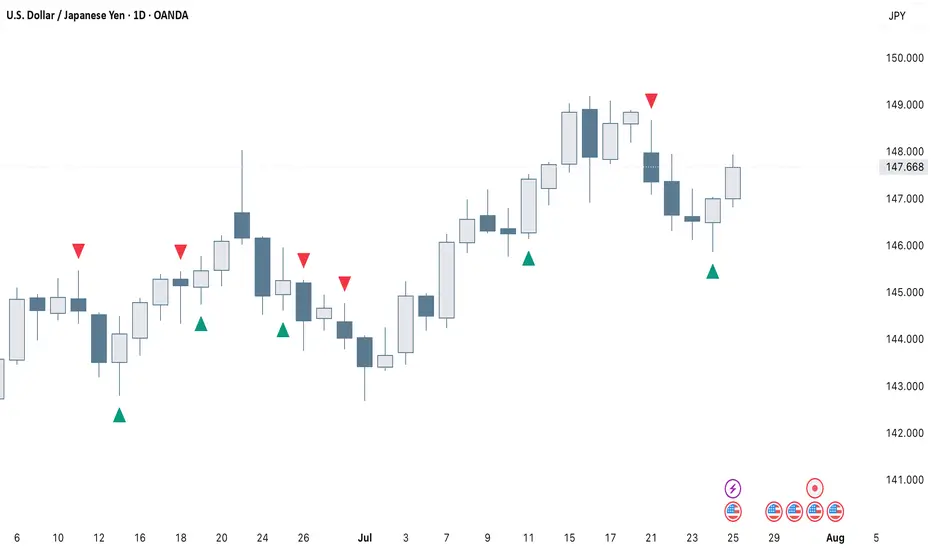
Larry Williams's Market Structure
Here is a Pine script based on Larry Williams' market structure model.
Note: When processing real-time ticks, heavy calculations can cause script errors. To prevent this, please adjust the script's data range accordingly.
As I'm not an expert in Pine Script, there may be some imperfections. Your understanding is appreciated.
I have great admiration for the wisdom of Larry Williams.
May the trend be with you.

Kent Directional Filter🧭 Kent Directional Filter
Author: GabrielAmadeusLau
Type: Filter
📖 What It Is
The Kent Directional Filter is a directionality-sensitive smoothing tool inspired by the Kent distribution, a probability model used to describe directional and elliptical shapes on a sphere. In this context, it's repurposed for analyzing the angular trajectory of price movements and smoothing them for actionable insights.
It’s ideal for:
Detecting directional bias with probabilistic weighting
Enhancing momentum or trend-following systems
Filtering non-linear price action
🔬 How It Works
Price Angle Estimation:
Computes a rough angular shift in price using atan(src - src ) to estimate direction.
Kent Distribution Weighting:
κ (kappa) controls concentration strength (how sharply it prefers a direction).
β (beta) controls ellipticity (bias toward curved vs. linear moves).
These parameters influence how strongly the indicator favors movements at ~45° angles, simulating a directional “lens.”
Smoothing:
A Simple Moving Average (SMA) is applied over the raw directional probabilities to reduce noise and highlight the underlying trend signal.
⚙️ Inputs
Source: Price series used for angle calculation (default: close)
Smoothing Length: Window size for the moving average
Pi Divisor: Pi / 4 would be 45 degrees, you can change the 4 to 3, 2, etc.
Kappa (κ): Controls how focused the directionality is (higher = sharper filter)
Beta (β): Adds curvature sensitivity; higher values accentuate asymmetrical moves
🧠 Tips for Best Results
Use κ = 1–2 for moderate directional filtering, and β = 0.3–0.7 for smooth elliptical bias.
Combine with volume-based indicators to confirm breakout strength.
Works best in higher timeframes (1h–1D) to capture macro directional structure.
I might revisit this.

Asian & London Session Two-Color Candlesthis script use to find the asian and london session with different candle colours.
