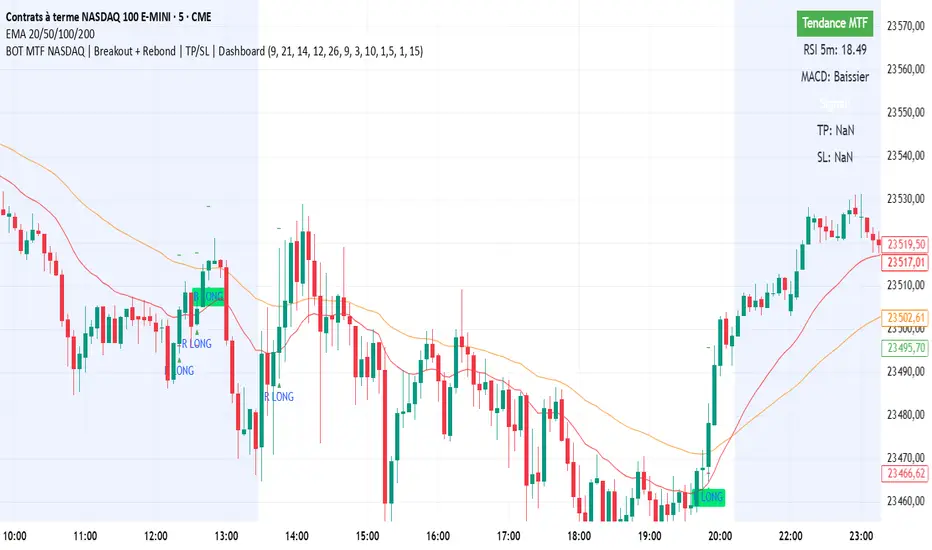
BOT MTF NASDAQ | Breakout + Rebond | TP/SL | DashboardBOT MTF NASDAQ | Breakout + Rebond | TP/SL | Dashboard
Indicators and strategies
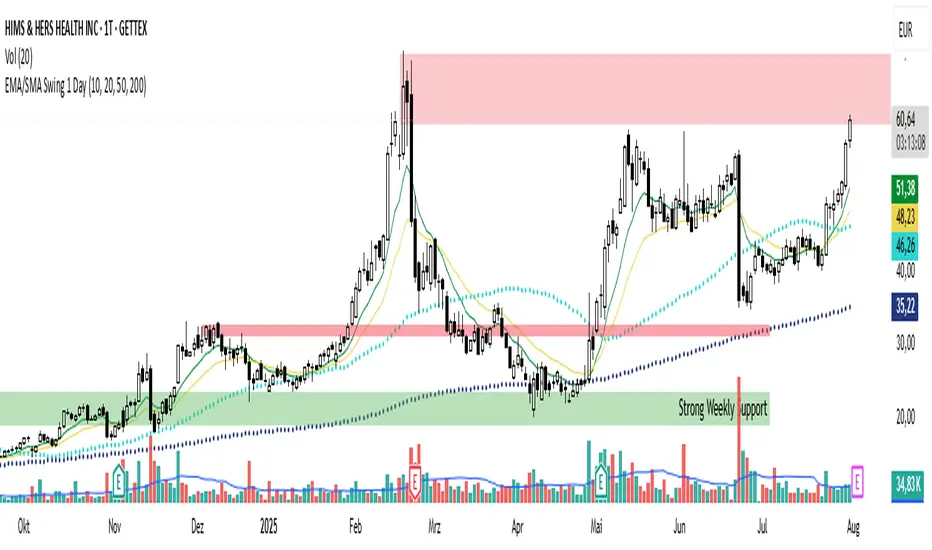
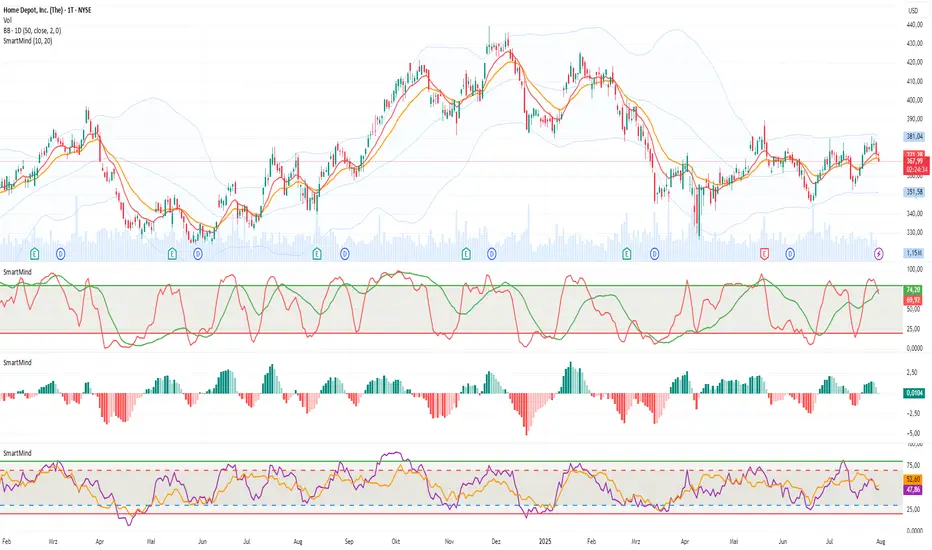
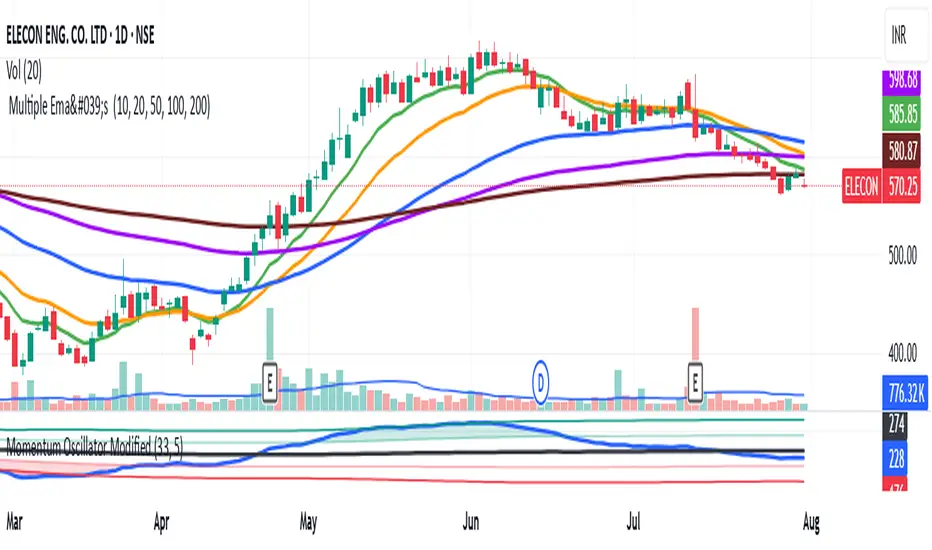
EMA 10,20 SMA 50, 200This indicator is very helpful for swing traders who plan their trades using EMAs and SMAs. It is used on the daily chart and displays the 10- and 20-EMA, as well as the 50- and 200-SMA.
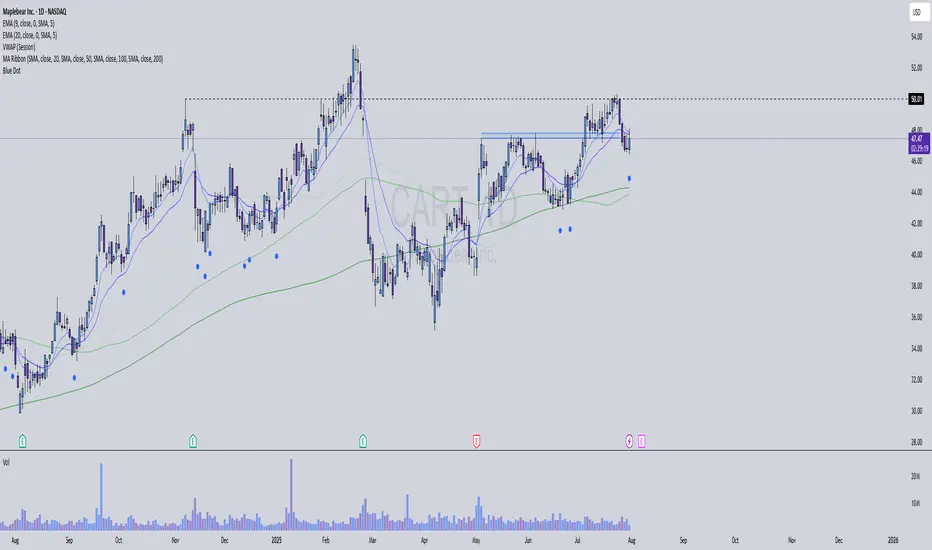
Blue DotThis indicator identifies high-probability long entry signals by combining stochastic momentum analysis with moving average trend confirmation. It's designed to catch oversold bounces in stocks that are already in established uptrends.
SmartMind2The MACD (Moving Average Convergence Divergence) is a popular technical indicator in trading, primarily used to detect trends and possible reversal points.
How is the MACD structured?
The MACD indicator consists of three components:
MACD Line:
Calculated as the difference between two exponential moving averages (EMAs), commonly 12 and 26 periods.
Formula:
MACD Line
=
𝐸
𝑀
𝐴
12
(
Price
)
−
𝐸
𝑀
𝐴
26
(
Price
)
MACD Line=EMA
12
(Price)−EMA
26
(Price)
Signal Line:
An exponential moving average (usually 9 periods) of the MACD line.
Formula:
Signal Line
=
𝐸
𝑀
𝐴
9
(
MACD Line
)
Signal Line=EMA
9
(MACD Line)
Histogram:
Graphically represents the difference between the MACD line and the Signal line.
Formula:
Histogram
=
MACD Line
−
Signal Line
Histogram=MACD Line−Signal Line
Interpretation of MACD:
Buy Signal: Occurs when the MACD line crosses above the signal line (bullish signal).
Sell Signal: Occurs when the MACD line crosses below the signal line (bearish signal).
Trend Reversal: A divergence between price movements and the MACD indicates a potential reversal (e.g., rising prices with a falling MACD).
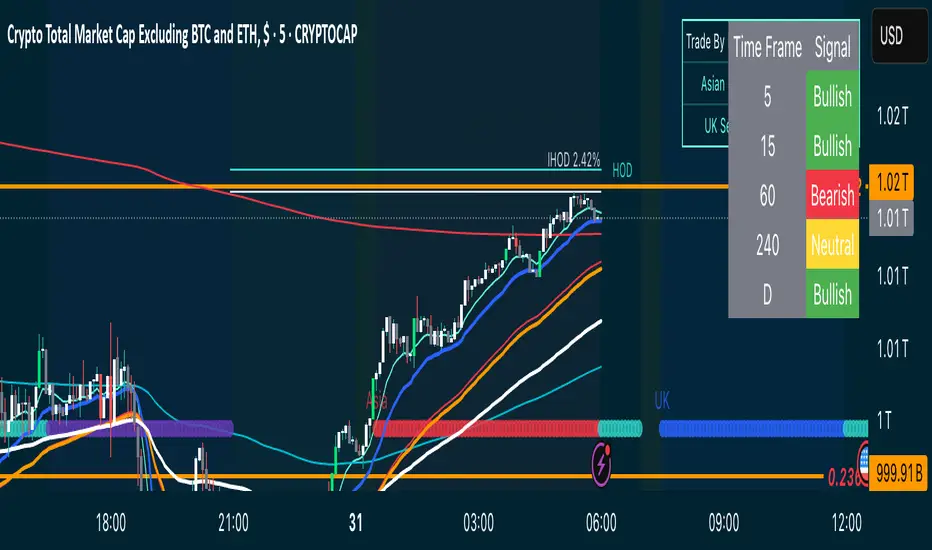
Manual 1H Trend BackgroundThis TradingView Pine Script v6 indicator allows you to manually set the trend direction (based on your analysis of the 1-hour timeframe), and it will change the background color of your chart based on that input:
"Buy" → chart background turns green
"Sell" → chart background turns red
"Neutral" → no background color (transparent)

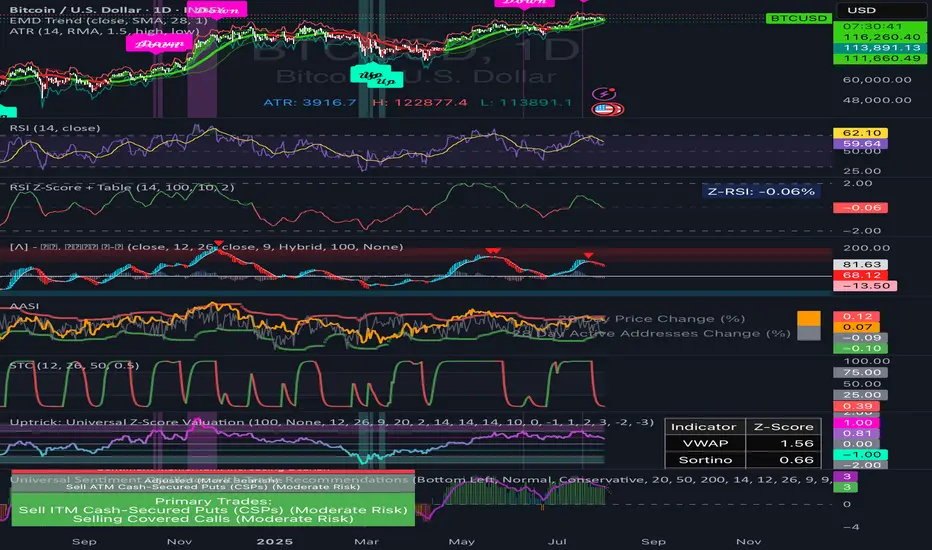
RSI Z‑Score + TableRSI Z-Score + Table
This script calculates the Z-Score of the RSI (Relative Strength Index), which standardizes RSI based on its own recent history.
What It Shows:
RSI Z-Score = (Current RSI - Mean RSI) / Standard Deviation
This tells you how extreme the current RSI is compared to its historical values.
A table displays:
Current RSI
Rolling Mean
RSI Z-Score
How to Use:
Z-Score > +2 = Statistically overbought
Z-Score < -2 = Statistically oversold
Use it to time reversals or overextension in RSI behavior.
🔒 Based on rolling lookback window — fully customizable.
Author:
Tags: #RSI #ZScore #Momentum #StatisticalEdge #MeanReversion #Crypto
20 EMA / 55 EMA Cross with 50 SMMA FilterBulish Bearish indicator for the 55 ema flipping abover or below 20 ema and abover or below 50 smma
Momentum Oscillator ModifiedThis indicator is a custom momentum oscillator enhanced with True Range-adjusted price logic and dynamic Bollinger Bands, offering a refined way to track price strength, momentum shifts, and overbought/oversold extremes with reduced noise.
Key Features:
Dynamic Price Oscillator:
Measures momentum using both price change and a volatility-adjusted price for greater accuracy.
Smoothing factor lets you fine-tune the balance between responsiveness and noise filtering.
True Range-Based Volatility Adjustment:
Integrates true range calculations to adapt to current volatility, making signals more robust during different market conditions.
Adaptive Bollinger Bands:
Two sets of custom Bollinger Bands (standard and expanded) are drawn around the oscillator, adapting over time.
These bands help identify when momentum is exceptionally strong or weak relative to recent history.
Special fills dynamically highlight when the oscillator breaks above/below the bands, signaling potential trend extremes.
Customization:
Easily adjust lookback length and smoothing factor to fit your personal trading style (e.g., scalping or swing trading).
How to Use:
Watch for the oscillator crossing above the green Bollinger Bands or below the red bands for potential overbought/oversold or breakout scenarios.
Expanded bands provide a "super extreme" zone which may hint at exhaustion or trend climax.
The dynamic mean (black line) gives a visual reference for the normalized momentum level.
Ghost Month HighlighterGhost Month and Trading: Understanding the Phenomenon
Ghost Month (鬼月) is the seventh month of the lunar calendar in Chinese culture, typically falling between late July and September. During this period, it's believed that the gates of the afterlife open and spirits roam the earth. This deeply rooted cultural belief has significant implications for Asian markets, particularly in regions with large Chinese populations like Taiwan, Hong Kong, Singapore, and mainland China.
Why Markets Often Decline or Stay Flat During Ghost Month:
Reduced Business Activity : Many businesses avoid launching new products, signing major contracts, or making significant investments during this period, believing it brings bad luck.
Property Market Slowdown : Real estate transactions drop significantly as people avoid moving homes or making large purchases. In some markets, property sales can decline by 20-30%.
IPO and M&A Drought : Companies often delay IPOs and merger announcements until after Ghost Month, reducing market catalysts.
Retail Spending Drops : Consumer spending on big-ticket items decreases, though spending on offerings and religious items increases.
Self-Fulfilling Prophecy : Many traders and investors reduce positions or stay on the sidelines, creating lower volumes and increased volatility. This becomes a self-fulfilling prophecy where expectation of poor performance leads to actual underperformance.
Tourism and Entertainment Impact : Travel and entertainment sectors see reduced activity as people avoid unnecessary trips and celebrations.
Historical data shows that Asian equity markets often underperform during Ghost Month, with some studies indicating average returns can be 2-5% lower than other months. However, this also creates opportunities for contrarian investors who buy during the seasonal weakness.
Inspired by @honey_xbt

ATR Squeeze BackgroundThis simple but powerful indicator shades the background of your chart whenever volatility contracts, based on a custom comparison of fast and slow ATR (Average True Range) periods.
By visualizing low-volatility zones, you can:
* Identify moments of compression that may precede explosive price moves
* Stay out of choppy, low-momentum periods
* Adapt this as a component in a broader volatility or breakout strategy
🔧 How It Works
* A Fast ATR (default: 7 periods) and a Slow ATR (default: 40 periods) are calculated
* When the Fast ATR is lower than the Slow ATR, the background is shaded in blue
* This shading signals a contraction in volatility — a condition often seen before breakouts or strong directional moves
⚡️ Why This Matters
Many experienced traders pay close attention to volatility cycles. This background indicator helps visualize those cycles at a glance. It's minimal, non-intrusive, and easy to combine with your existing tools.
🙏 Credits
This script borrows core logic from the excellent “Relative Volume at Time” script by TradingView. Credit is given with appreciation.
⚠️ Disclaimer
This script is for educational purposes only.
It does not constitute financial advice, and past performance is not indicative of future results. Always do your own research and test strategies before making trading decisions.

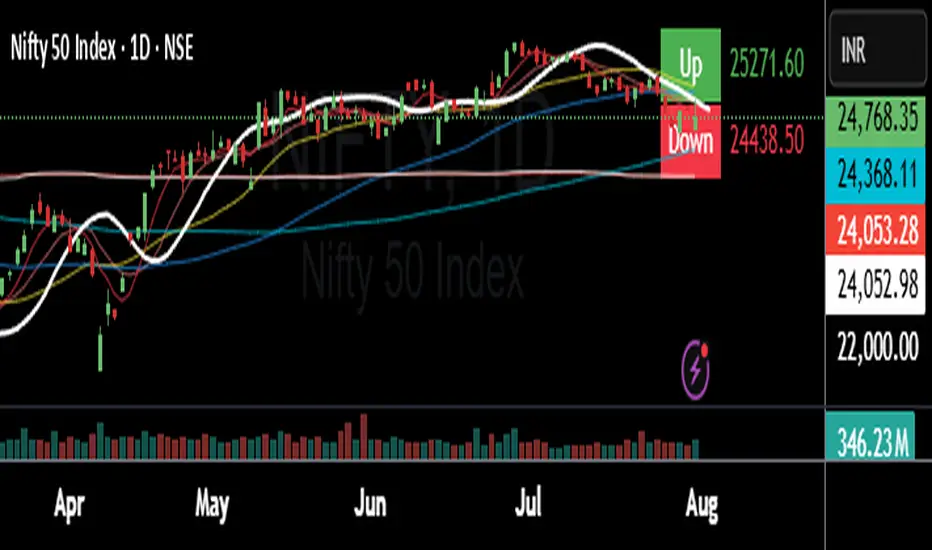
Circuit Breaker Table (NSE Style)🛡️ NSE Circuit Breaker Table – With Volatility-Based Band Support
This script displays a real-time circuit breaker table for any stock, showing the Upper and Lower circuit limits in a clean 2x2 grid. It’s especially useful for Indian traders monitoring NSE-listed stocks.
✅ Key Features:
📊 Upper & Lower Limits based on the previous day’s close
⚡ Optional ATR-based dynamic volatility band calculation
🎨 Customizable font sizes (Small / Medium / Large)
✅ Table neatly positioned on the top-right corner of your chart
🟢 Upper circuit shown in green, 🔴 lower circuit in red
Works on all NSE stocks and adapts automatically to charted symbols
⚙️ Customization Options:
Use static percentage bands (e.g., 10%)
Or enable ATR mode to reflect dynamic circuit potential based on recent volatility
This tool helps you stay aware of where a stock might get halted — useful for momentum traders, circuit breakout traders, and anyone monitoring volatility limits during intraday sessions.
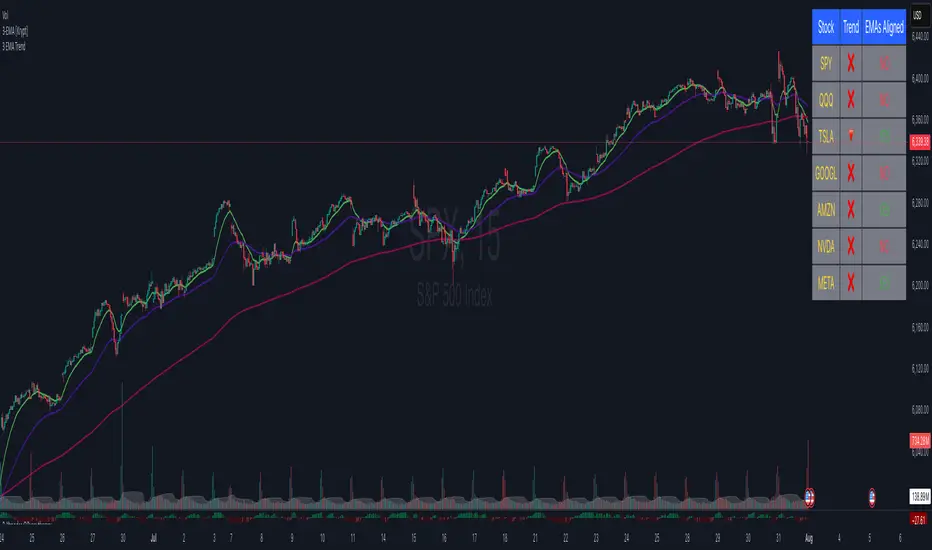
3 EMA cross overThis Pine Script displays the 3 EMA trend status for a list of popular stocks in a dynamic table. It calculates and monitors 13 EMA, 48 EMA, and 200 EMA for each ticker to detect bullish or bearish alignment.
Best Use:
Use this script to quickly scan market trends across multiple stocks and identify potential trade opportunities based on EMA alignment.
RSI Z‑Score + TableRSI Z-Score + Table
This script calculates the Z-Score of the RSI (Relative Strength Index), which standardizes RSI based on its own recent history.
What It Shows:
RSI Z-Score = (Current RSI - Mean RSI) / Standard Deviation
This tells you how extreme the current RSI is compared to its historical values.
A table displays:
Current RSI
Rolling Mean
RSI Z-Score
How to Use:
Z-Score > +2 = Statistically overbought
Z-Score < -2 = Statistically oversold
Use it to time reversals or overextension in RSI behavior.
🔒 Based on rolling lookback window — fully customizable.
Author:
Tags: #RSI #ZScore #Momentum #StatisticalEdge #MeanReversion #Crypto

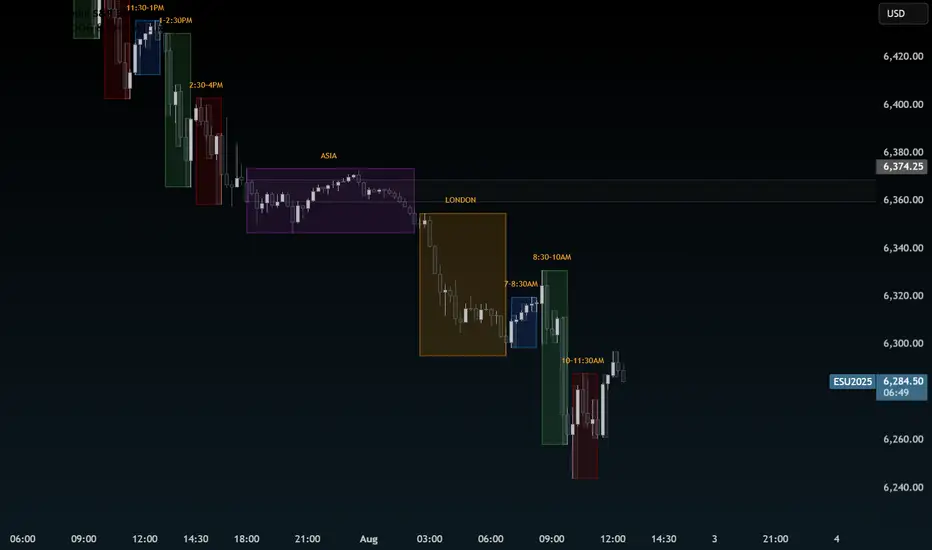
Time CyclesUses Zeussy's time and price cycles. This shows the Asia and London sessions, and has the PM session broken into 90 minute cycles with the option of toggling 30m cycles within them.
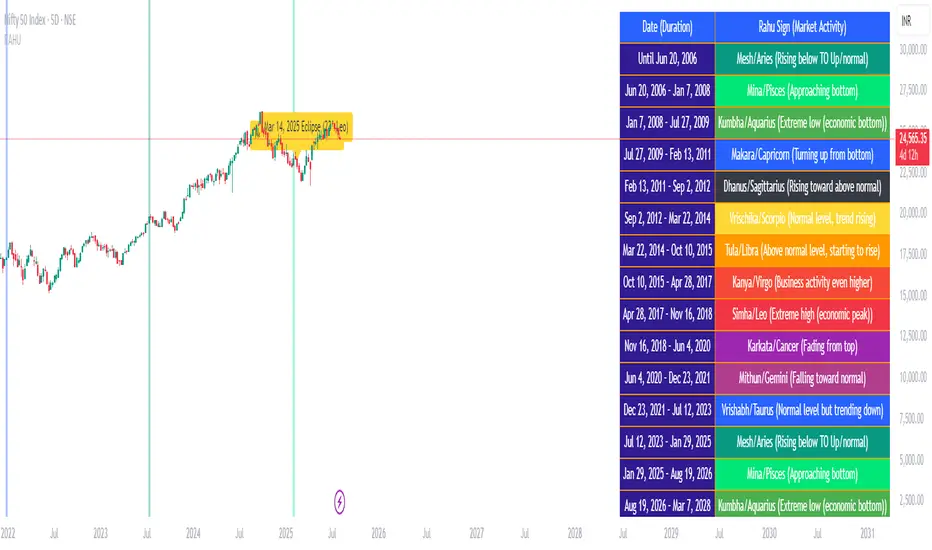
Rahu Cycle This script is showing special “Rahu times” for markets like old man watch sun for rain or farming. It make colorful boxes on chart say, “from this date to that date, market like this sign.” Like, maybe market very good, or very bad, or going up, or down, just like weather season change.
You see table on chart, color, big words - it tell when Rahu (shadow planet in Indian myth) move from one place to next. Say “Mesh/Aries: Market going up, Pisces: market falling.” It’s like old people telling “From June to July, rain come, crop grow.”
It remember big crash, recession, boom - it show label on those dates, so you see “oh, here big problem come.” Like “2008: crash, 2015: China problem, 2009: market at lowest.”
It make chart background colored also, so you know which Rahu phase now, like green for very bad, red for super boom—just like traffic light for market activity.
All these things come in TradingView chart as colored boxes and notes, you don’t need read big book. Just look, see color, understand—market going up, or danger coming, or safe time.
So, this script… make market ups-and-downs simple for you. Rahu go from one sign to next, market change color, you see, you decide. No need expert—just see color, follow cycle, stay safe.
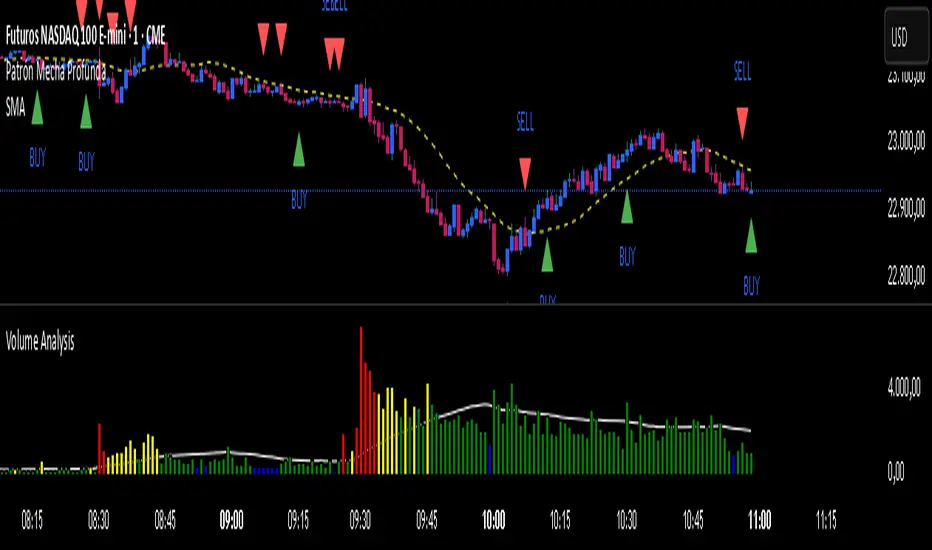
Patrón Mecha Profunda
This pattern must be combined with a 20-period moving average. It is used to know the direction of the price. When the pattern appears and the price is above the 20-period moving average, it is a bullish signal and vice versa.

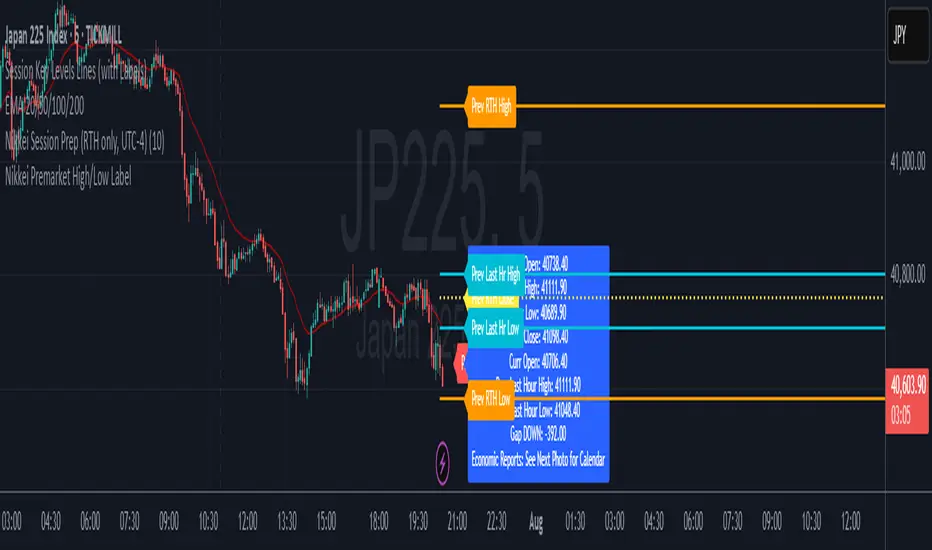
Nikkei Session Key Levels Lines (with Labels) - Nikkei CFDThis is Nikkei Session Key Levels Lines (with Labels) - Nikkei CFD. shows you all the key level lines that you need to be aware. hope it helps :)

Nikkei Premarket High/Low LabelThis is Nikkei Premarket High/Low Label. shows you the premarket high and low. hope it helps :)
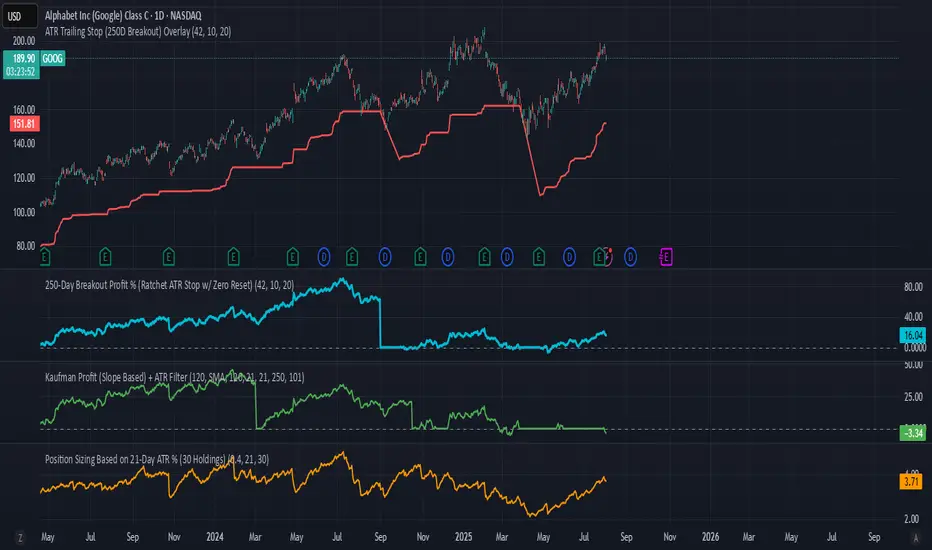
Position Sizing Based on 21-Day ATR % (30 Holdings) 40 volATR portion sizing based on 40 vol to get is close to STD DEV weightings.

Nikkei Session Prep (RTH only, UTC-4)This is Nikkei Session Prep (RTH only, UTC-4). hope it helps :)

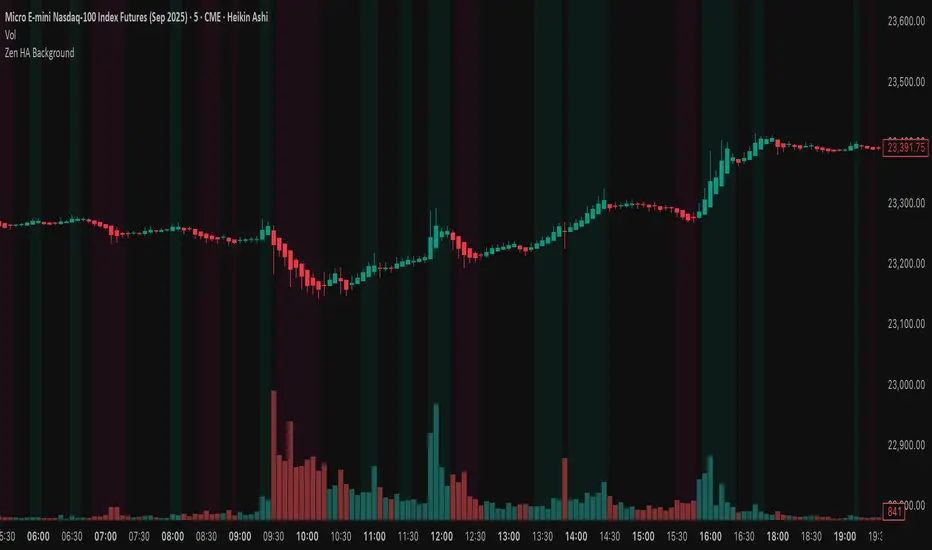
Zen HA BackgroundThis script colors the chart background based on Heikin Ashi candle direction.
It filters out noise by waiting for 2 confirmed candles in the same direction with real body size.
Clean, simple, and easy on the eyes.
Great for scalpers and trend traders who want visual confirmation without clutter.