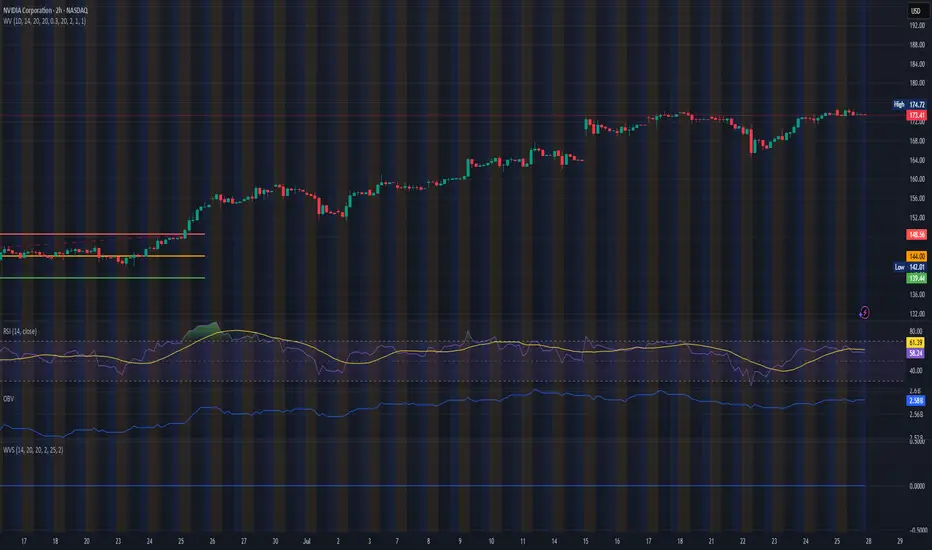
RSI + VWAP Strategy by vipindaskr🔍 This script combines RSI and VWAP for intraday trend-based entries.
✅ *Buy Signal:*
- Price above VWAP
- RSI > 60
- Green background + up triangle shown
❌ *Sell Signal:*
- Price below VWAP
- RSI < 40
- Red background + down triangle shown
📈 Ideal for Nifty 50 intraday traders using 5-minute chart.
Developed by vipindaskr 💻
Indicators and strategies

CRT Impulse Detector - Bull & BearHelps Identify Impulse Candles, only triggering those that break recent swings.
RSI+BOLLINGER (LONG & SHORT)This indicator combines two of the most popular tools in technical analysis, the Relative Strength Index (RSI) and Bollinger Bands (BB), to generate both long (BUY) and short (SELL) trading signals.
Strategy:
Entries (Buy/Short): Entry signals are based on the RSI.
A BUY is suggested when the RSI crosses above an oversold level (default: 29), indicating a possible upward reversal.
A SHORT is suggested when the RSI crosses below an overbought level (default: 71), indicating a possible downward reversal.
Exits (Position Closure): Exit signals are based on Bollinger Bands.
A long position is closed when the price crosses below the upper Bollinger Band.
A short position is closed when the price crosses above the lower Bollinger Band.
Key Features:
Cascade Filter: Includes a smart filter that prevents opening new consecutive trades if the price hasn't moved significantly in favor of a new entry, optimizing signal quality.
Automation Alerts: Generates detailed alerts in JSON format for each event (buy, sell, close), designed for easy integration with trading bots and automated systems via webhooks.
Fully Configurable: All parameters of the RSI, Bollinger Bands, and strategy filters can be adjusted from the indicator’s settings menu.

5-Min EMA Crossover (5/10)The 5-Minute EMA Crossover (5/10) strategy is a technical trading approach that uses two Exponential Moving Averages (EMAs) on a 5-minute chart to identify potential buy and sell signals based on trend shifts. Here's a description:
EMAs Used:
Fast EMA: 5-period EMA calculated on 5-minute candles. This EMA reacts quickly to recent price changes since it gives more weight to the latest data.
Slow EMA: 10-period EMA calculated on 5-minute candles. It responds more slowly, smoothing out short-term fluctuations.
How the Crossover Works:
A buy signal (long entry) occurs when the 5-period EMA crosses above the 10-period EMA. This suggests that recent price momentum is gaining strength upward, potentially indicating a bullish trend beginning or resuming.
A sell signal (short entry) happens when the 5-period EMA crosses below the 10-period EMA, signaling weakening recent price momentum and a possible bearish trend.
Purpose:
This crossover method helps traders catch short-term trends on a 5-minute timeframe by signaling moments when momentum shifts.
Because EMAs weight recent prices more heavily, the signals tend to be more responsive to fast market moves compared to simple moving averages.
Typical Usage:
Traders apply this to intraday charts (5-minute candles) looking for quick entries and exits.
It is common to use this crossover in combination with other indicators or price action context to reduce false signals.
Example of Signal Application:
When the 5 EMA crosses above the 10 EMA, consider entering a long position.
When the 5 EMA crosses below the 10 EMA, consider exiting longs or entering shorts.
This method leverages short-term momentum shifts visible on the 5-minute timeframe to help take advantage of intraday trends or reversals.

SMT Divergence x outofoptions🔍 SMT Divergence — Advanced Market Correlation Analysis
This was created with and approved by @outofoptions to bring you smaller SMTs based on his original SMT Divergence indicator
SMT Divergence is a sophisticated technical analysis indicator designed to identify high-probability reversal and continuation signals through intelligent correlation analysis between related markets. This powerful tool reveals hidden market dynamics by comparing price action divergences across correlated instruments, providing traders with institutional-level market insight.
🎯 Core Capabilities:
Multi-Market Analysis : Automatically compares your chart with a correlated instrument to identify divergence patterns and market inefficiencies
Smart Liquidity Detection : Advanced algorithms identify key liquidity levels and sweep patterns for enhanced signal accuracy
Dynamic Divergence Mapping : Real-time visualization of bullish and bearish divergences with customizable line styles and colors
Intelligent Signal Validation : Optional candle-based confirmation system to filter high-probability setups from noise
Automated Line Management : Smart removal of invalidated divergences to maintain clean, actionable chart analysis
📊 Professional Features:
The SMT Divergence indicator excels at revealing market structure imbalances that often precede significant price movements. By analyzing the relationship between correlated markets, it identifies when institutional money may be positioned differently than retail sentiment suggests, providing early warning signals for potential reversals.
⚙️ Advanced Customization:
Flexible correlation pair selection for any market combination
Customizable visual styling with multiple line types and color schemes
Adjustable validation criteria for different trading styles
Professional alert system with detailed message customization
Automatic cleanup of broken or invalidated divergences
🎨 Visual Excellence:
Clean, professional line drawing with customizable styling
Dynamic labeling system with size and color options
Real-time divergence tracking and management
Institutional-grade chart presentation
Optimized performance for extended analysis periods
📈 Ideal For:
Swing traders seeking high-probability reversal signals
Multi-market analysts comparing correlated instruments
Institutional-style traders using correlation analysis
Advanced technical analysts studying market structure
Those seeking early warning signals for trend changes
🔔 Smart Alerts:
Comprehensive alert system with customizable messaging allows you to stay informed of new divergences across multiple timeframes and market sessions, ensuring you never miss critical market developments.
💡 Market Intelligence:
SMT Divergence transforms complex inter-market relationships into clear, actionable signals, giving you the same analytical edge used by professional trading institutions to identify market turning points before they become obvious to retail traders.
Educational Tool: This indicator is designed for educational and analytical purposes. Divergence analysis requires understanding of market correlation principles. Always combine with proper risk management and additional analysis methods.

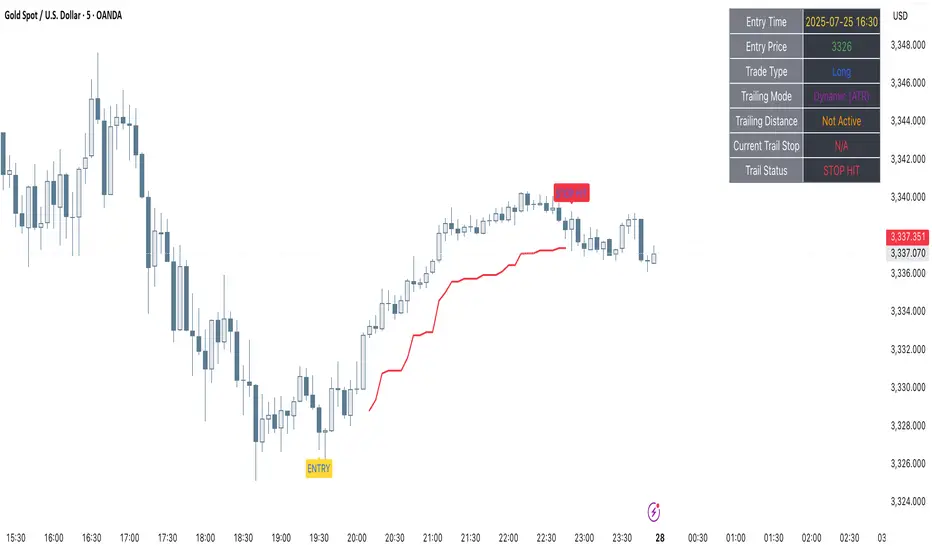
Clarix Trailing MasterClarix Trailing Master
Advanced Manual Entry Trailing Stop Strategy
Purpose :
Clarix Trailing Master is designed to give traders precise control over trade exits with a customizable trailing stop system. It combines manual entry inputs with dynamic and static trailing stop options, empowering users to protect profits while minimizing premature stop-outs.
How It Works:
You manually input your trade entry price and specify the trade direction (Long or Short).
The strategy activates the trailing stop only after the price moves favorably by a configurable profit threshold. This helps avoid early stop losses during initial market noise.
You can choose between a dynamic trailing stop based on Average True Range (ATR) or a fixed static trailing distance. The ATR can also be computed on a higher timeframe for enhanced stability.
Once active, the trailing stop updates live with price movements, ensuring your gains are locked in progressively.
If the price crosses the trailing stop, a clear alert triggers, and the stop-hit status displays visually on the chart.
Key Features:
Manual entry with exact price and timestamp input for precise trade tracking.
Supports both Long and Short trades.
Choice between dynamic ATR-based trailing or static trailing stops.
Configurable profit threshold before trailing stop activation to avoid early exits.
Visual markers for entry and stop-hit points (yellow and red respectively).
Live dashboard displaying entry details, trade status, trailing mode, and current stop level.
Works on all asset classes and timeframes, adaptable to various trading styles.
Built-in audio alert notifies you immediately when the trailing stop is hit.
Usage Tips:
Adjust the profit threshold and ATR settings based on your asset’s volatility and timeframe. For example, use higher ATR multipliers for more volatile markets like crypto.
Consider using higher timeframe ATR values for smoother trailing stops in fast-moving markets.
Ideal for swing trading or position trading where precise stop management is crucial.
Always backtest and paper trade before applying to live markets.
Multi-Timeframe High/Low LinesMulti-Timeframe High/Low Lines
Track and visualize high/low levels from multiple timeframes with automatic interaction detection and alerts.
Features:
Displays horizontal lines for highs and lows from Daily, Weekly, Monthly, Quarterly, and Yearly timeframes
Lines extend to the right until price interacts with them
Automatic interaction detection - lines stop extending when touched
Customizable colors for each timeframe and level type
Configurable line width and style (solid, dashed, dotted)
Built-in alerts for level interactions
Performance optimized for smooth operation
Works with traditional markets (futures, stocks) and crypto
How It Works:
Detects new candles on higher timeframes (Daily, Weekly, Monthly, Quarterly, Yearly)
Creates horizontal lines at the high and low of each new timeframe candle
Lines are drawn from the exact time/bar where the high/low occurred
Lines extend to the right until price touches the level
When a level is touched, the line stops extending and is marked as "hit"
Alerts can be configured to notify when levels are touched
Settings:
Timeframe Settings: Enable/disable individual timeframes
Visual Settings: Line width, style, and maximum number of levels
Colors: Custom colors for each timeframe's highs and lows
Alert Settings: Enable alerts for high/low level touches
Use Cases:
Identify key support and resistance levels from higher timeframes
Track when price interacts with significant levels
Use as part of a multi-timeframe analysis strategy
Set up alerts for level breaks or bounces
Combine with other indicators for entry/exit signals
Compatibility:
Works on all timeframes (1m to monthly)
Compatible with traditional markets (futures, stocks, forex)
Optimized for crypto markets
Handles market gaps and session resets properly
This indicator automatically manages line lifecycle, removing old lines and limiting total count for optimal performance.

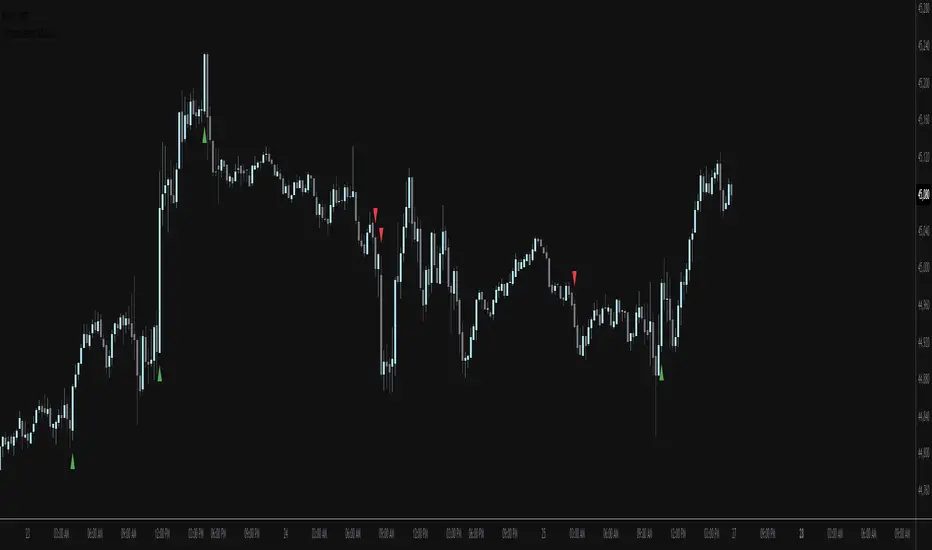
Reversal Signal avec TICK + RSIThis indicator is a potential reversal indicator for SCALPING, don't use it for swing. It's base on TICK and on an overbrought/oversold condition of the RSI. You can play with the setting, typicaly I like my TICK to be over reacting an 800/-800 and my rsi over 20 and 80, but it give not enough signal. So I set the TICK signal at 651/-651 and the RSI at 25/75. This indicator is made for SP500 and Nasdaq, so SPY/QQQ/SPX/ES/NQ should work well. It's the first version of it, so maybe I'll add so more data to it to increase signal and lower false one. For now I've test it on live market yet(26/7/25).
The RSI is Fast(5 period), I like to use it on the 1 or 5 min chart.
Please not that it only work during 9h30am to 4pm EST.(Because of the TICK)
Feel free to try and even comment. Don't be harsh on me, it's my first try!
(Sorry for my 'english' it's not my first language)
FAUCON
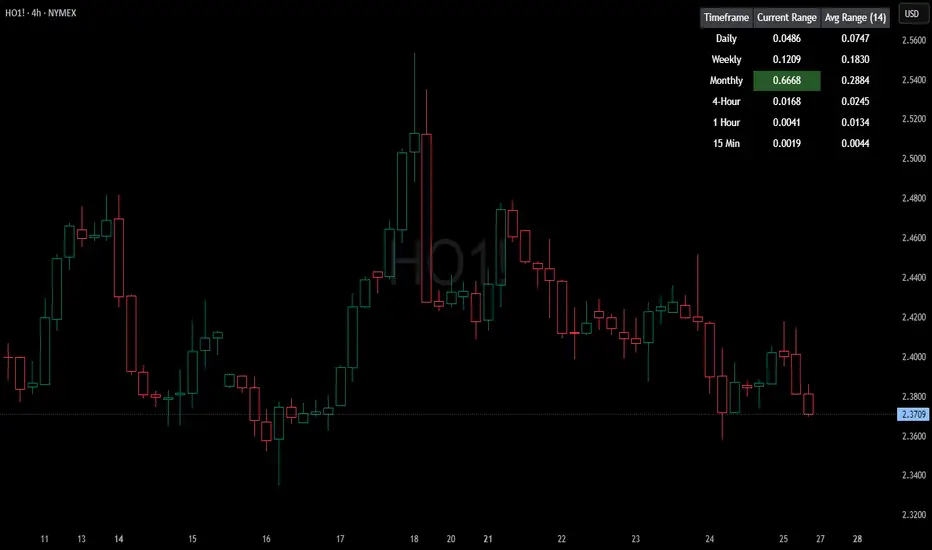
HTF Current/Average RangeThe "HTF(Higher Timeframe) Current/Average Range" indicator calculates and displays the current and average price ranges across multiple timeframes, including daily, weekly, monthly, 4 hour, and user-defined custom timeframes.
Users can customize the lookback period, table size, timeframe, and font color; with the indicator efficiently updating on the final bar to optimize performance.
When the current range surpasses the average range for a given timeframe, the corresponding table cell is highlighted in green, indicating potential maximum price expansion and signaling the possibility of an impending retracement or consolidation.
For day trading strategies, the daily average range can serve as a guide, allowing traders to hold positions until the current daily range approaches or meets the average range, at which point exiting the trade may be considered.
For scalping strategies, the 15min and 5min average range can be utilized to determine optimal holding periods for fast trades.
Other strategies:
Intraday Trading - 1h and 4h Average Range
Swing Trading - Monthly Average Range
Short-term Trading - Weekly Average Range
Also using these statistics in accordance with Power 3 ICT concepts, will assist in holding trades to their statistical average range of the chosen HTF candle.
CODE
The core functionality lies in the data retrieval and table population sections.
The request.security function (e.g., = request.security(syminfo.tickerid, "D", , lookahead = barmerge.lookahead_off)) retrieves high and low prices from specified timeframes without lookahead bias, ensuring accurate historical data.
These values are used to compute current ranges and average ranges (ta.sma(high - low, avgLength)), which are then displayed in a dynamically generated table starting at (if barstate.islast) using table.new, with conditional green highlighting when the current range is greater than average range, providing a clear visual cue for volatility analysis.
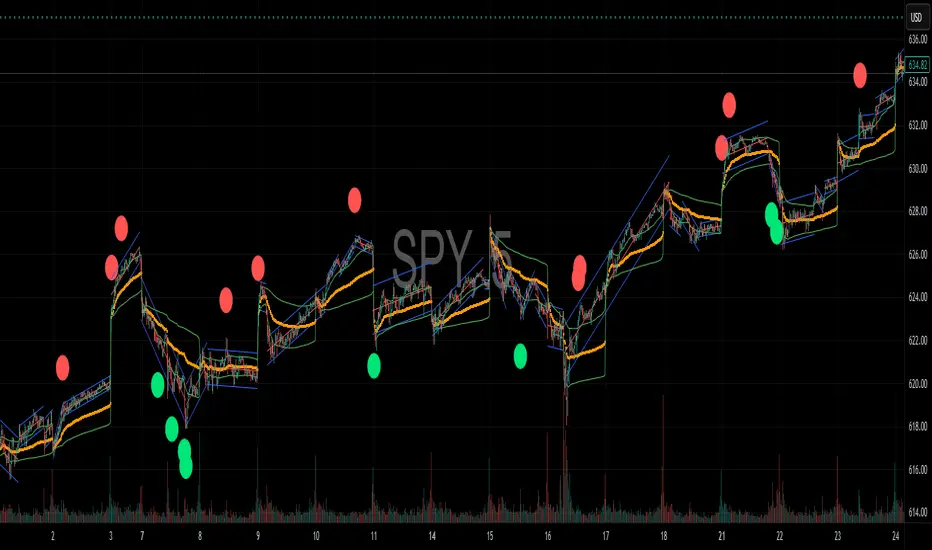
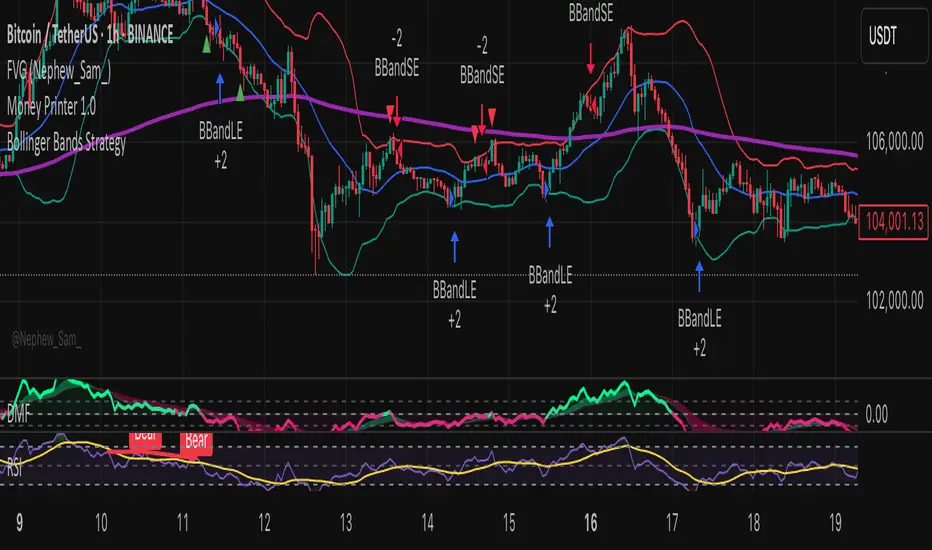
Money Printer 1.0bollinger band candle body closes, while using the 100,200 ema for shorts, longs, take profit at the middle of the bollinger bands
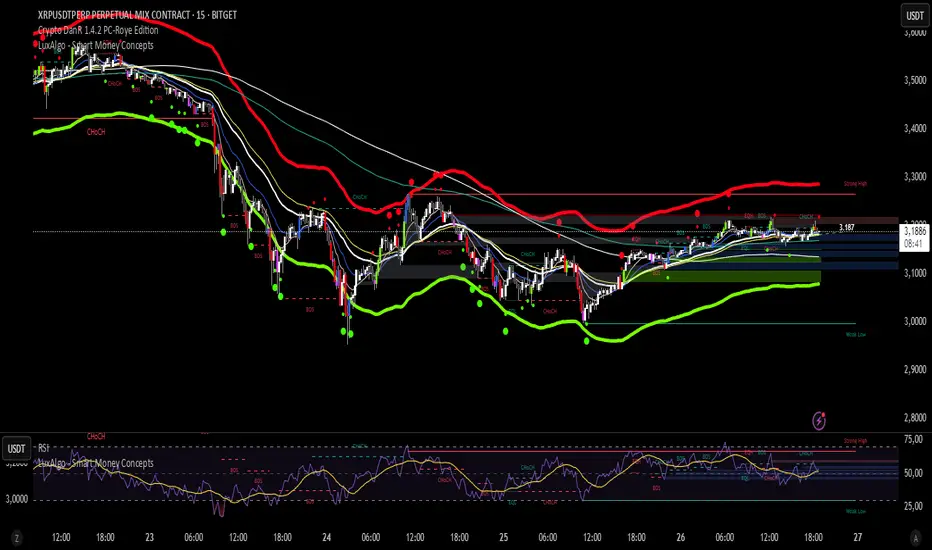
Crypto DanR 1.4.2 PC-Roye Edition📜 Crypto DanR 1.4.2 — PC Roye Edition (Open Source)
This indicator combines Smart Money Concepts (SMC), Liquidity Analysis, and Trend Filtering to provide traders with a high-quality tool for intraday and swing trading on assets like XRP/USDT.
✅ What This Script Does
Crypto DanR 1.4.2 integrates the following advanced features:
Break of Structure (BOS) & Change of Character (CHoCH):
Detects key shifts in market structure
Helps confirm trend direction and reversal points
Fair Value Gaps (FVG):
Displays unmitigated liquidity voids using a style inspired by LuxAlgo
Highlights potential retracement zones where smart money may re-enter
Equal Highs / Equal Lows (EQH/EQL):
Marks liquidity zones that institutions often target before reversals
Order Blocks (OB):
Identifies potential institutional demand/supply zones
Option to filter by wick, body, or mitigation logic
Fibonacci Volatility Bands (based on BigBeluga’s logic):
Detects potential price extremes using Fib extensions on volatility
10 Moving Averages in One (inspired by hiimannshu's script):
Supports 10 custom MAs (SMA, EMA, RMA, HMA, VWMA, etc.) with adjustable source and timeframe
Ideal for trend filtering or dynamic support/resistance
Vector Candles (TradersReality / PVSRA):
Color-coded candles showing real-time volume pressure and trend bias
Visual Trade Plan:
Optional overlay for entry, stop-loss, and take-profit planning
Displays risk-to-reward ratio and potential % gain/loss live
🧠 How It Works
The script uses a price-action-first approach, built around concepts from Smart Money Theory. CHoCH and BOS detect structural shifts, while FVGs and OBs help forecast likely reaction zones. The multiple moving averages act as a trend filter to avoid entering against momentum.
This combination allows traders to:
Enter on mitigations or breakouts
Set stops outside liquidity zones
Manage trades visually with dynamic risk/reward levels
📊 Best Use Cases
15m or 1h scalping (ideal)
Swing trading on 4h
Works well on crypto, FX, and indices
🙏 Credits
TradersReality for PVSRA logic via public library
LuxAlgo for FVG inspiration
hiimannshu for 10-in-1 MA logic
BigBeluga for Fibonacci Bands methodology
All reused logic is significantly modified and part of a broader framework.
📌 Notes
Script is open-source to promote transparency and collaboration
Please do not copy-paste and republish without adding meaningful improvements
Feedback and suggestions welcome!
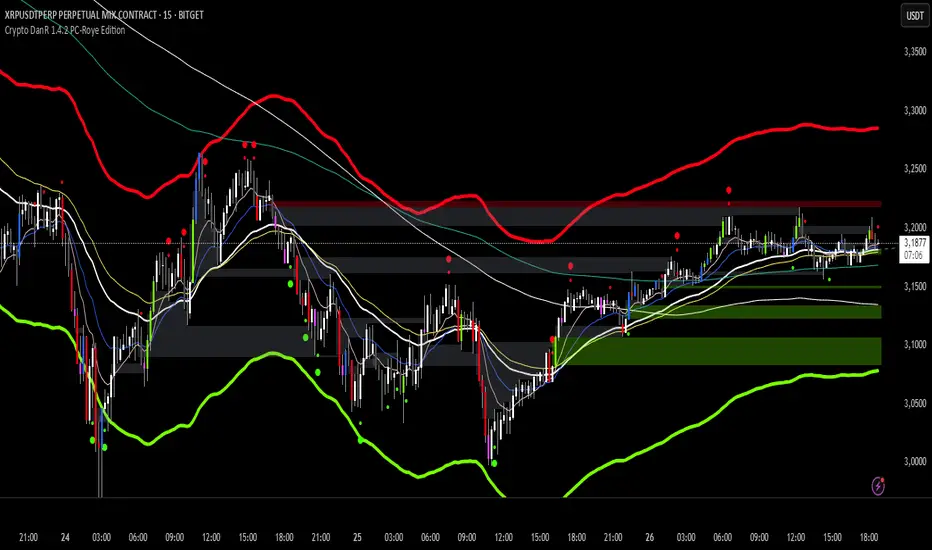
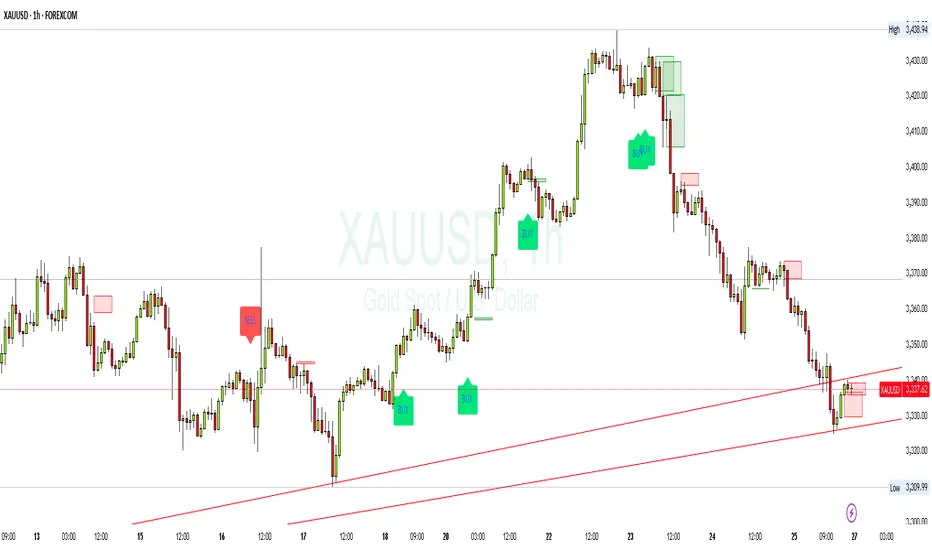
SMC XAU/USD Pro✅ Structure filter: Only BUY if the price is above the last bullish BOS, and SELL if it is below the last bearish BOS.
✅ Significant candle body: At least 40% of the range to avoid weak signals.
✅ Boxes limited to 3 per type (old ones automatically cleared).
✅ Visual display of Take Profit and Stop Loss with green and red dashed lines.
✅ Clear BUY/SELL signals with visible labels.
تلوين الشموع حسب الحجم (يومي أو متوسط)📊 Indicator Name:
Candle Coloring Based on Volume Change (Flexible Comparison)
🎯 Purpose of the Indicator:
This indicator colors candlesticks based solely on changes in volume, regardless of price direction. It helps traders visualize unusual volume activity and potential accumulation or distribution zones.
It also displays the percentage change in volume above each candle — based on a comparison method chosen by the user.
⚙️ User Inputs:
Comparison Method (Mode):
"Compare with Previous Day":
The volume of the current candle is compared with the volume of the previous candle.
"Compare with Average of N Days":
The volume is compared with a moving average of volume over a number of past days (e.g., 10 days).
Average Length (for mode 2):
Used only when "Compare with Average" is selected.
Defines the number of days over which to calculate the volume average.
Minimum % Change to Show Label:
A threshold that controls when the percentage label appears.
Prevents label clutter for insignificant volume changes.
🎨 Candle Coloring Logic:
Condition Meaning Candle Color
Current volume > reference volume High activity 🟢 Green
Current volume < reference volume Low activity 🔴 Red
Nearly equal volumes Normal ⚪ Gray
🏷️ Volume Change Label:
The indicator displays a percentage change label above the candle.
For example:
If volume increased by 45% → label shows +45.00%.
If the change exceeds ±50%, the label turns yellow to indicate a significant spike.
✅ Key Benefits:
Quickly detects unusual volume activity (e.g., spikes, drops).
Enhances classic price-action analysis with volume context.
Flexible comparison:
Day-to-day for short-term traders.
Moving average for swing and position traders.
Clean, minimalist design with conditional labels.
🔍 Use Case Examples:
🔴 Red candle on price rise → weak rally (low participation).
🟢 Green candle on price drop → potential distribution.
⚪ Gray candles → sideways or stable behavior.
👤 Who Should Use It?
Day traders and scalpers monitoring volume strength.
Technical analysts who focus on volume-price behavior.
Traders who track accumulation/distribution patterns.

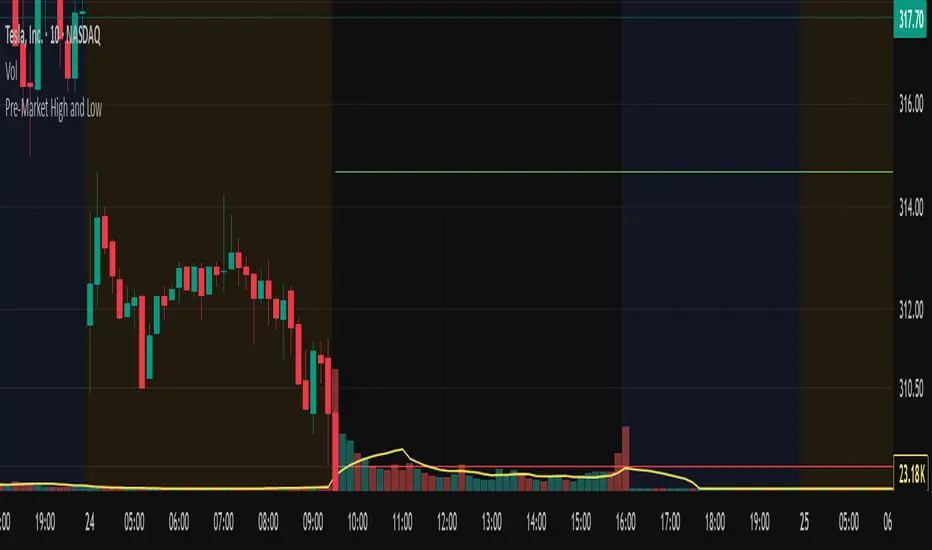
Pre-Market High and LowThis Pine Script indicator automatically plots the pre-market high and low price levels for each trading day, helping traders identify key support and resistance zones based on pre-market activity. Designed for stocks and other assets with pre-market sessions, it draws horizontal lines at the pre-market high and low prices at the regular market open (9:30 AM EST) and resets automatically at the start of each new trading day.
Features:
Automatic Daily Reset: Tracks pre-market highs and lows without requiring manual date changes.
Customizable Timeframe: Set your preferred pre-market session (default: 4:00 AM to 9:30 AM EST).
Flexible Styling: Choose line styles (Solid, Dashed, Dotted) and colors for high/low lines.
Adjustable Panel Size: Control how far the lines extend across the chart (default: 50 bars).
Optional Labels: Toggle labels to display "Pre-Market High" and "Pre-Market Low" at the market open.
Overlay Display: Lines and labels are plotted directly on the price chart for easy reference.
3 Bullish Candles + No Wick + SL unter BoS (Swing Low)1m strategie basierend auf price action and volume candle sticks

ES Gap Trading Levels# ES Gap Trading Levels
## Overview
A professional gap trading indicator designed specifically for ES Futures traders. This indicator automatically captures the closing price at 3:59 PM ET (NYSE close) and immediately displays key gap levels for the evening trading session starting at 6:00 PM ET.
## Key Features
### ✅ **Automatic Gap Level Detection**
- Captures ES Futures closing price at 3:59-4:00 PM ET
- Instantly displays gap levels for immediate session planning
- Resets daily for fresh gap analysis
### ✅ **Six Critical Gap Levels**
- **±10 Points** (White lines) - Short-term gap targets
- **±20 Points** (Light Blue lines) - Medium gap targets
- **±30 Points** (Red lines) - Extended gap targets
### ✅ **Professional Display**
- Clean horizontal lines with customizable colors
- Clear labels showing point values (+30, +20, +10, -10, -20, -30)
- Gap levels table showing exact price targets
- Optional closing price reference line
### ✅ **Customizable Settings**
- Adjustable line colors, width, and extension
- Toggle labels and reference table on/off
- Manual closing price override for testing
- Debug mode for troubleshooting
### ✅ **Smart Management**
- Automatic cleanup of previous day's levels
- Lines appear immediately after market close
- Optimized for ES1!, MES1!, and other ES futures contracts
## How It Works
1. **Market Close Capture**: At 3:59 PM ET, the indicator captures the ES closing price
2. **Instant Display**: Gap levels immediately appear on your chart
3. **Evening Session Ready**: Lines are positioned for 6:00 PM ET session start
4. **Daily Reset**: Old levels are automatically cleared each new trading day
## Perfect For:
- Gap trading strategies
- Overnight futures trading
- ES futures scalping
- Session transition analysis
- Risk management levels
## Usage Tips:
- Best used on 1-15 minute ES futures charts
- Ensure chart timezone shows ET times
- Use manual mode for backtesting specific dates
- Combine with volume and momentum indicators
## Settings Guide:
- **Display Settings**: Control lines, labels, and table visibility
- **Colors**: Customize each gap level color scheme
- **Manual Settings**: Override closing price for testing
- **Debug**: View time detection and diagnostic information
*Designed by traders, for traders. Clean, professional, and reliable gap level detection for serious ES futures trading.*

Volume Weighted Average Pricehelps my strategy and allows my trades to hit tp allowing me to gain profit

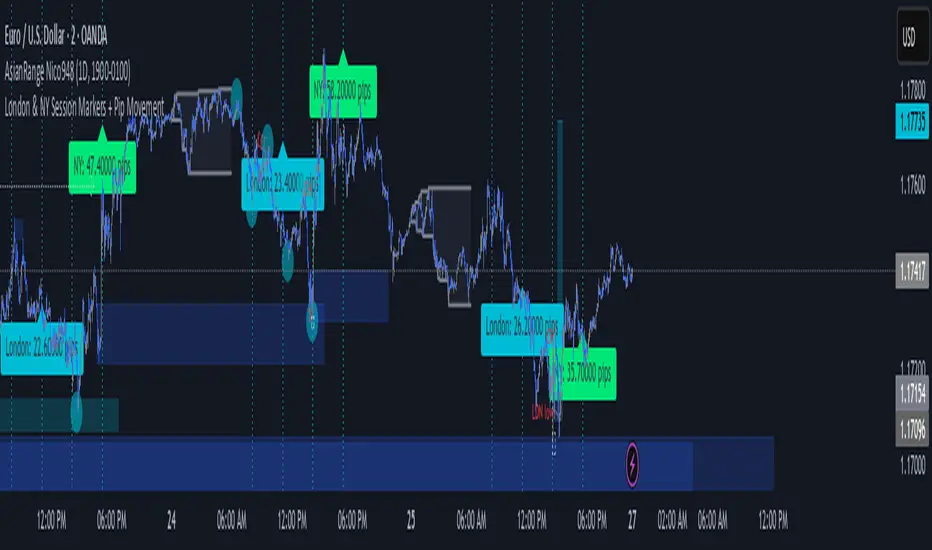
London & NY Session Markers + Pip MovementThis indicator visually marks the London and New York trading sessions on your chart and optionally calculates the pip range (high-low movement) during each session. It's specifically designed for Forex traders, helping you identify volatility windows and analyze market movement within major session times.
🔍 Key Features:
✅ Session Open/Close Markers
Draws vertical dotted lines at:
London Open (08:00 UK time)
London Close (11:00 UK time)
New York Open (14:00 UK time)
New York Close (17:00 UK time)
Each marker is labeled clearly ("London Open", "NY Close", etc.)
Uses color-coding for easy identification:
Aqua for London
Lime for New York
✅ Pip Range Display (Optional)
Measures the high-low price movement during each session.
Converts this movement into pips, using:
0.0001 pip size for most pairs
0.01 pip size for JPY pairs (auto-detected)
Displays a label (e.g., "London: 42.5 pips") above the candle at session close.
This feature can be toggled on/off via the settings panel.
✅ Time-Zone Aware
Session times are aligned to Europe/London time zone.
Adjusts automatically for Daylight Saving Time (DST).
✅ User Controls
Toggle visibility for:
London session markers
New York session markers
Pip range labels
📊 Use Cases:
Identify when liquidity and volatility increase, especially during session overlaps.
Analyze historical session-based volatility (e.g., compare NY vs. London pip ranges).
Combine with price action or indicator signals that work best in high-volume hours.
Optimize entry and exit timing based on session structure.
⚙️ Best Timeframes:
5-min to 1-hour charts for precise session tracking.
Works on Forex and CFD pairs with standard tick sizes.
⚠️ Notes:
This tool does not repaint and uses only completed bar data.
Pip calculation is based on the chart’s current symbol and tick size.
Designed for spot FX, not intended for cryptocurrencies or synthetic indices.
✅ Ideal For:
Forex Day Traders
Session-based Strategy Developers
London Breakout or NY Reversal Traders
Anyone analyzing volatility by session windows
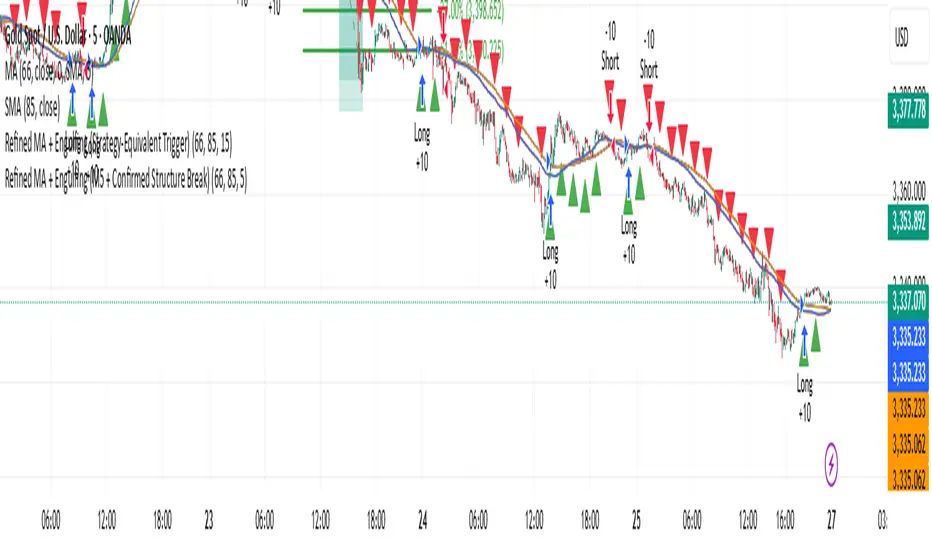
Refined MA + Engulfing (Strategy-Equivalent Trigger)I would like to start by saying that this indicator was put together using ChatGPT, some past trades from myself and some backtested trades, and from my time as a student in Wallstreet Academy under Cue Banks.
I am not profitable yet. I am too jumpy and blow accounts. I'm hoping this indicator (and it's strategy twin), with the help of some alerts, can help me spend less time on the charts, so that I'm not tempted to press buttons as much.
It does fire quite a bit. It can be adjusted, I believe, to trigger more or less (open the script, cooldown bars(x) <== change the X to whatever. 5 minute intervals so 1 is 5.
With that being said, there are times that this indicator has shown to trigger and I ask, "Why?".
I just want to help myself and others, and maybe make some decent\cool stuff along the way. Enjoy
KR
Thors Ghost Candles Thors Ghost Candles (TGC)
A volume-based indicator that visualizes volume through dynamic candle transparency.
Candles fade or intensify based on relative volume strength, creating "ghost" effects for
low-volume periods and highlighting significant volume spikes.
Key Features:
- Candle opacity adjusts based on volume Z-score (standard deviations from mean)
- High volume candles appear solid, while low volume candles become transparent
- Includes volume moving average overlay
- Built-in alerts for extreme volume conditions
- Customizable colors and option to completely hide low-volume bars
Perfect for identifying genuine breakouts, spotting volume divergences, and filtering out
low-conviction price movements. The ghost effect helps traders focus on price action backed
by significant volume.
Waterfall ScreenerHow to Use This to Screen Stocks: A Step-by-Step Guide
Save the Screener Script: Open the Pine Editor, paste the code above, and save it with a clear name like "Waterfall Screener".
Open the Stock Screener: Go to the TradingView homepage or any chart page and click the "Screener" tab at the bottom. Make sure you are on the "Stock" screener.
Set Your Market: Choose the market you want to scan (e.g., NASDAQ, NYSE).
Add Your Custom Filter (The Magic Step):
Click the "Filters" button on the right side of the screener panel.
In the search box that appears, type the name of your new script: "Waterfall Screener".
It will appear as a selectable filter. Click it.
Configure the Filter:
A new filter will appear in your screener list named "Waterfall Screener".
You can now set conditions for the "ScreenerSignal" value we plotted.
To find stocks with a new, actionable trade plan, set the filter to:
Waterfall Screener | Equal | 1
Refine and Scan:
Add other essential filters to reduce noise, such as:
Volume > 1M (to find liquid stocks)
Market Cap > 1B (to find established companies)
The screener will now automatically update and show you a list of all stocks that currently have a "PENDING_ENTRY" setup according to the indicator's logic and your chosen timeframe (e.g., Daily).