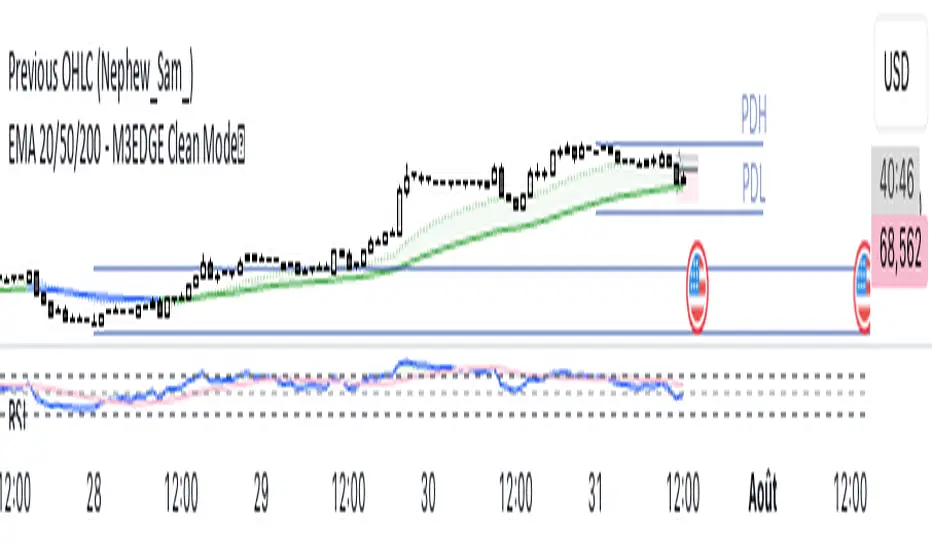
EMA 20/50/200 - M3EDGE Clean Mode™The M3EDGE Clean Mode™ indicator is designed to spot the cleanest, most aligned market phases.
It filters out market noise and highlights only the high-probability trending zones where the odds are in your favor.
How it works:
• Tracks 3 key EMAs (20, 50, 200)
• Confirms directional alignment across short, medium, and long-term trends
• Colors optimal market phases to identify high-probability setups
• Optional display of the dynamic EMA50/EMA200 zone to visualize the trend’s core
Purpose:
🎯 Avoid choppy, sideways market conditions
🎯 Focus only on smooth, directional price moves
🎯 Reduce false signals and improve chart clarity
Best use cases:
• Ideal for scalping, day trading, and swing trading
• Works on all markets: indices, commodities, forex, crypto
• Perfect when combined with macro analysis and other M3EDGE™ setups
💡 Pro tip: The M3EDGE Clean Mode™ isn’t just another indicator — it’s a quality filter that keeps you out of messy conditions. When it lights up, you know the road ahead is clear.
Indicators and strategies
TSD Quantum | mrmoeinudinThis indicator, **TSD Quantum**, has been developed by **Moeinudin Montazerfaraj**, exclusively for the students of the **TSD Intraday Trading Course**.
TSD Quantum is an intelligent and proprietary tool designed to accurately identify **valid supply and demand zones** and distinguish them from weak or linear bases. The algorithm is fully customized to align with the advanced concepts taught in the TSD methodology, empowering traders to make more confident and data-driven decisions.
### Key Features:
- Smart zone detection tailored to TSD methodology
- Floating risk management panel
- Integrated checklist for trade validation
- Real-time display of ATR, spread, and other essential metrics
- Optimized for intraday traders who follow price action and zone-based decision making strategies.
To join our exclusive educational programs, visit our official website:
🌐 (mrmoeinudin.com)
Stay connected and follow us for insights, updates, and free educational content:
📌 Telegram: (t.me)
📌 YouTube:
📌 Instagram:
Wishing all Persian-speaking traders around the world continued success and growth in their trading journey. 🚀📈
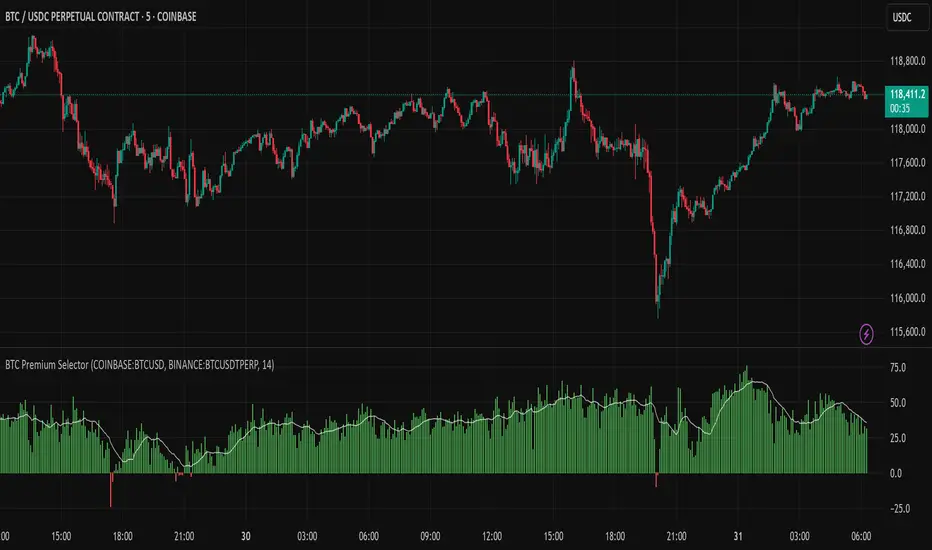
Multi CEX BTC Spot vs Perpetual PremiumThis Indicator shows the BTC Spot vs Perpetual premium across different CEX.
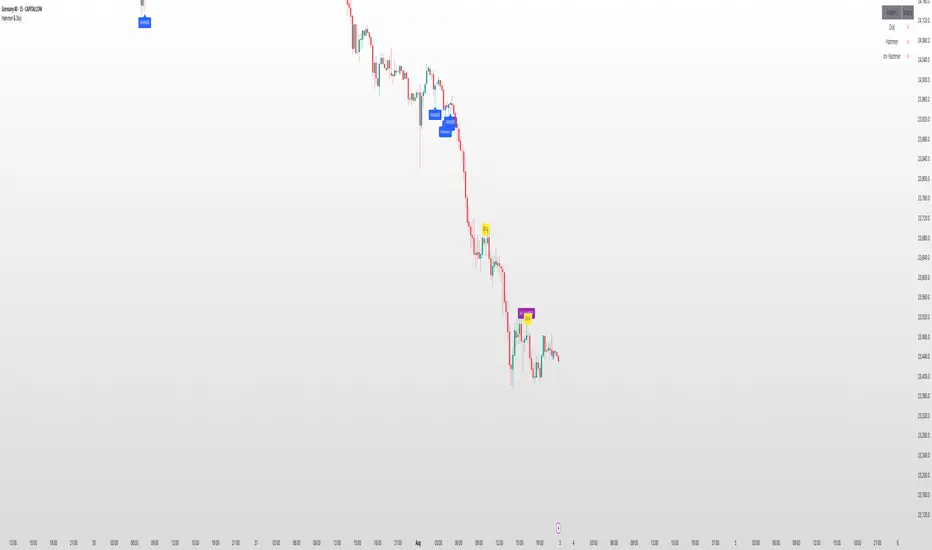
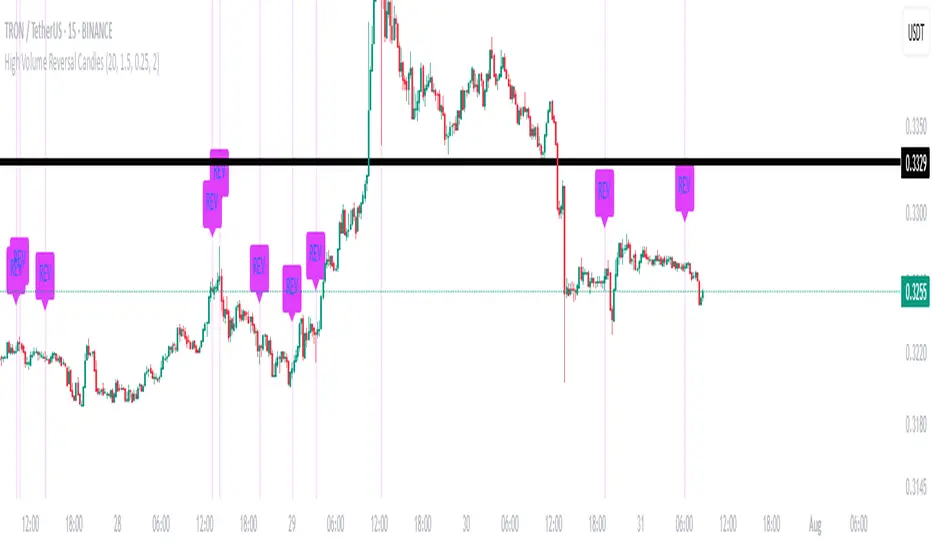
High Volume Reversal CandlesIdentifies candles which display reversal patterns (mainly hammers, inverted hammers, spinning top) on unusually high volume.
This makes the candlestick pattern more likely to fulfil.
Remember to always wait for confirmation; should only be used as an entry locator, not entry trigger.
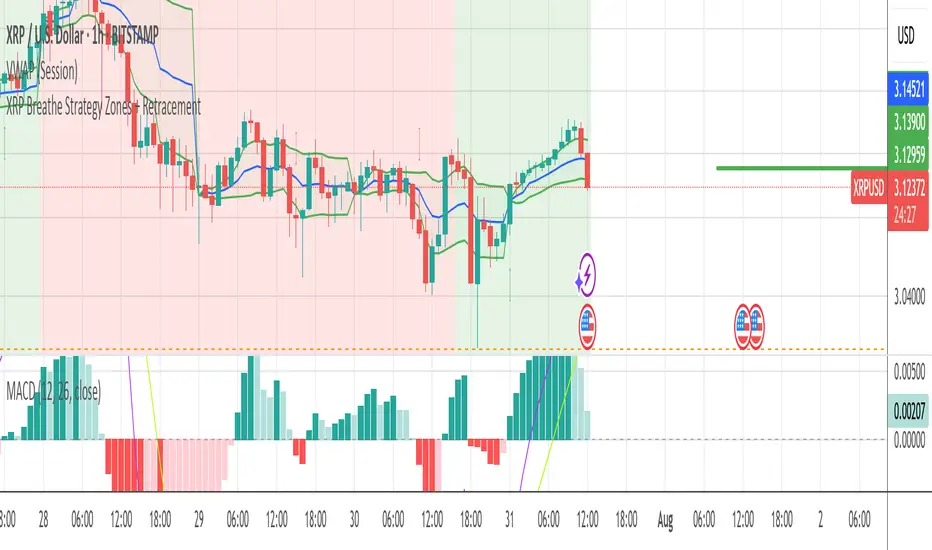
XRP Breathe Strategy Zones + RetracementGreen/red backgrounds = Inhale/Exhale phase timing
Horizontal lines at $3.65 / $3.00 / $2.60 for reference
MACD arrows = entry/exit hints within phase context
New yellow/purple retracement lines:
Inhale → yellow line = pullback buy zone
Exhale → purple line = potential rally target or short zone
Square Root Candles Its just a squareroot candles of Main chart the major support and resistance levels at 0.1, 0.45 and 0.75 levels

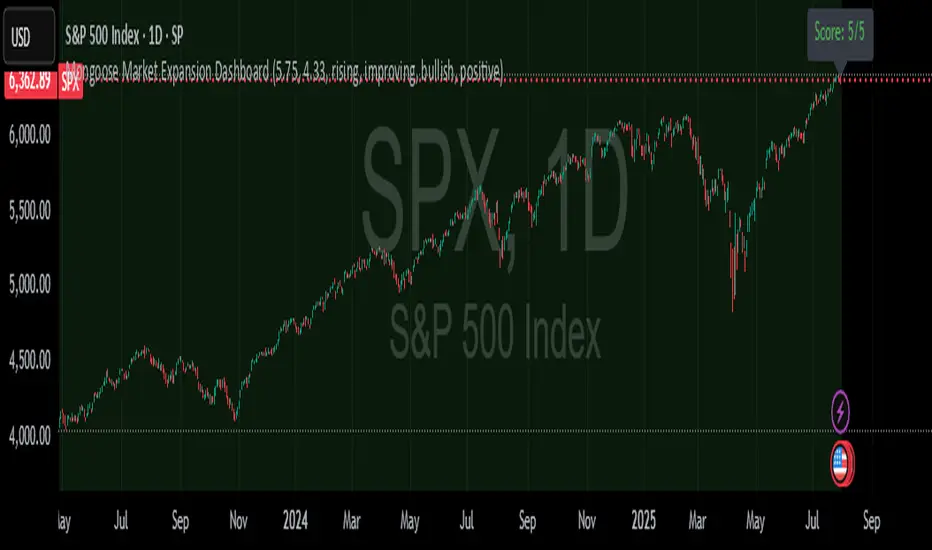
Mongoose Market Expansion DashboardDescription:
The Mongoose Market Expansion Dashboard tracks macro conditions that favor stock market upside. This dashboard aggregates five distinct categories:
Taylor Rule Gap (FFR vs. estimated neutral rate)
Liquidity Trend
Market Breadth
Sentiment Reversal
Macro Acceleration
Each category contributes to a composite score (0–5), plotted in real-time. A higher score signals improving market conditions and potential expansion. Designed for traders, analysts, and macro quants seeking clean macro overlays on price charts.
Smart Confluence + WinRateTwo EMAs (Fast/Slow)
Scoring Signal System (≥ 2 conditions = Buy/Sell)
Display Buy/Sell Arrows on Chart
Backtest System
Results Table: Trades, Wins, Losses, Win Rate %

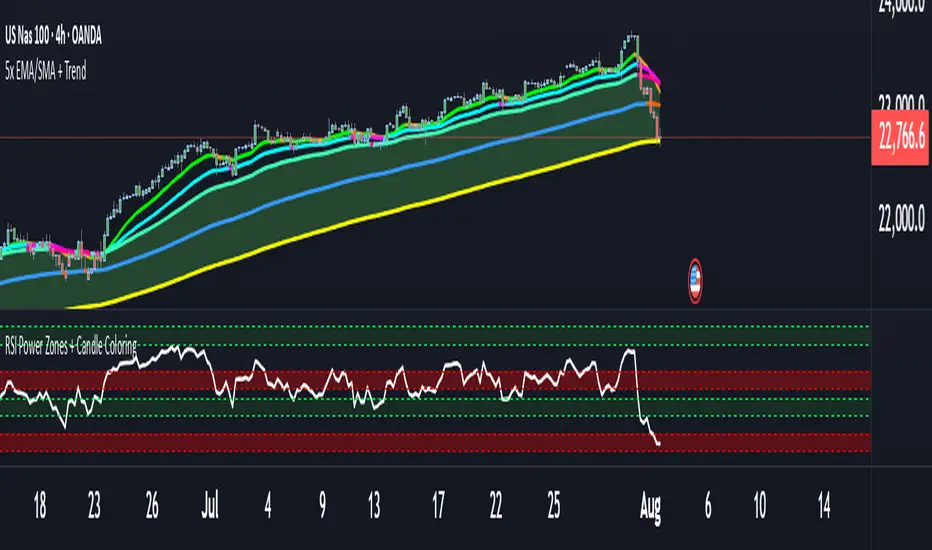
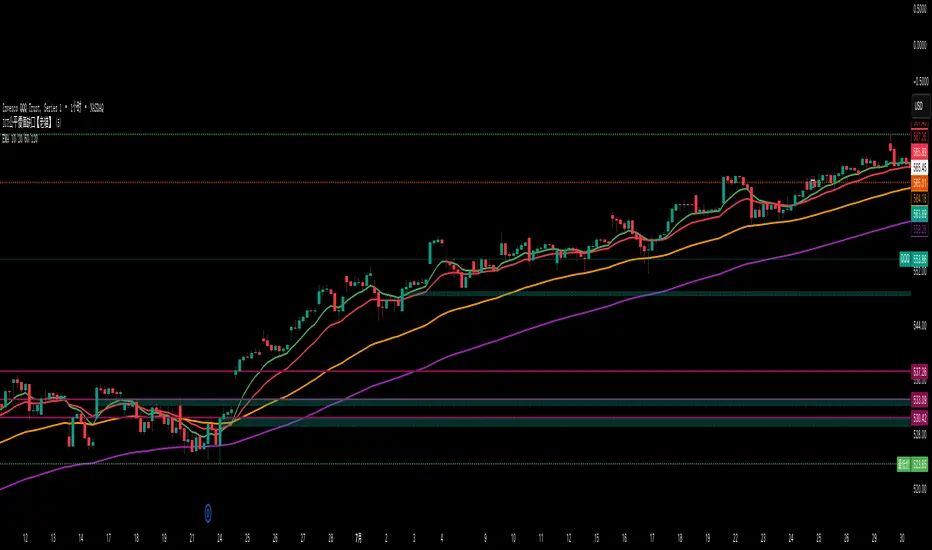
RSI Power Zones + Candle ColoringOk , So here is the newly revised PowerZones
With CAndle Coloring Showing you what the PowerZones Show you if it is in a bullish upTrend
or if the trend is currently in a downtrend
Along with my newly created indicator5x EMA/SMA Trend Indicator with the Cloud that coincides with new RSI PowerZones Indictor showing you the candles colored if it is bullish or Bearish Currently
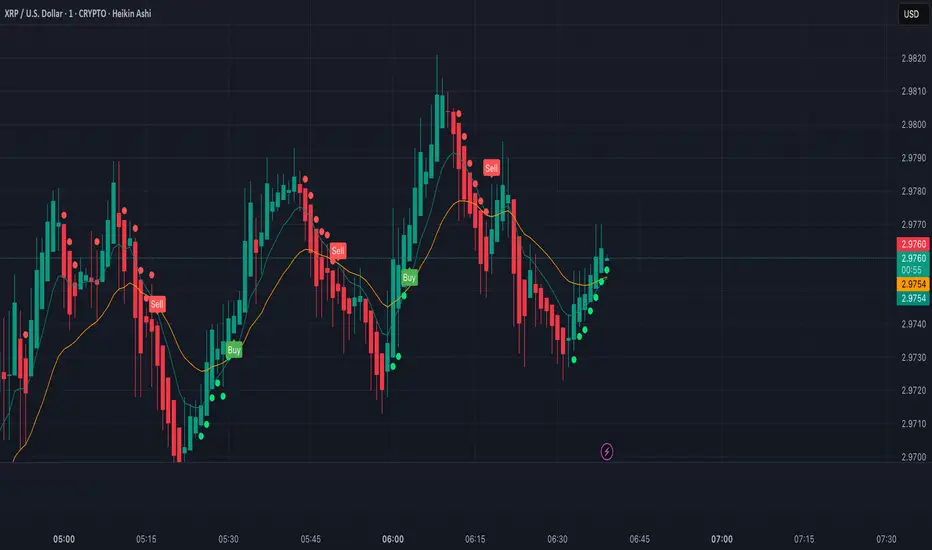
XRP Scalping with EMA Crossover Anticipation This script is designed to detect scalping opportunities on XRP by anticipating EMA crossovers, reinforced with technical confirmation filters.
Methodology
- The core signal is based on the crossover between a fast EMA (9) and a slow EMA (21).
- RSI (14) conditions are applied to avoid weak setups: RSI must be above 40 for buy signals and below 70 for sell signals.
- Before any crossover is validated, the script requires at least two consecutive “pre-crossover” signals. These indicate favorable momentum and convergence conditions before the crossover occurs.
- Final signals are only displayed if this minimum number of preconditions is met.
Application
This system is optimized for scalping on the 1-minute to 5-minute timeframes but can be adapted for longer-term setups by adjusting parameters. The anticipation logic helps reduce lagging entries and improves signal selectivity during volatile conditions.
Both pre-crossover and confirmed crossover conditions include alert options. The code is fully editable and customizable.
Dual Supertrend tohungmc tikDual Supertrend is an advanced trend-following indicator that combines two Supertrend strategies — a Large Supertrend and a Small Supertrend — to provide you with more precise entry and exit signals.
This indicator plots two Supertrend lines:
Large Supertrend (Blue and Orange): A broader trend that reacts slower to price movements.
Small Supertrend (Green and Red): A faster trend that responds quicker to market changes.
Key Features:
Customizable ATR Periods and Multipliers for both Large and Small Supertrends.
Buy/Sell Signals: When the Small Supertrend trend changes, and it's aligned with the Large Supertrend, you get reliable buy and sell signals.
Highlighting: The background can be highlighted in green or red, depending on whether the Large Supertrend is in an uptrend or downtrend.
Alerts: Alerts can be set for buy/sell signals or when the trend direction changes.
Use Case:
This indicator is designed for traders looking to follow both long-term and short-term trends. By combining the slower Large Supertrend with the faster Small Supertrend, it gives a more comprehensive view of market trends and better entry/exit points.
Indicator Inputs:
ATR Periods and Multipliers: Control how sensitive the Supertrend reacts to market changes.
Highlighting: Enable/Disable background highlighting.
Buy/Sell Signals: Option to show buy/sell signals based on trend direction changes.

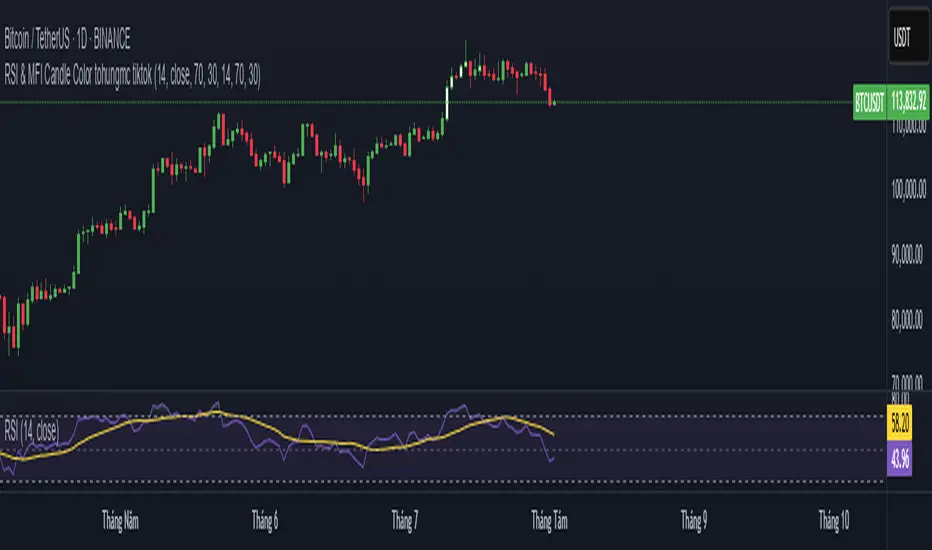
RSI & MFI Candle Color tohungmc tikRSI & MFI Candle Color with Alerts is a visual momentum indicator that highlights overbought and oversold conditions directly on your chart using candle colors.
This script combines the Relative Strength Index (RSI) and the Money Flow Index (MFI) with flexible settings, allowing you to:
✅ Display candle color based on RSI
✅ Display candle color based on MFI
✅ Show only candles where both RSI and MFI agree (for stronger signals)
✅ Customize overbought and oversold thresholds
✅ Receive real-time alerts when conditions are met at candle close
Color Logic:
White candles = Overbought (above threshold)
Blue candles = Oversold (below threshold)
Use case:
This tool is useful for traders who want quick, visual confirmation of momentum extremes, and who may combine RSI and MFI for higher accuracy.
Tip: Use with hidden candles (turn off price candles) or overlay it on price action for enhanced visibility.
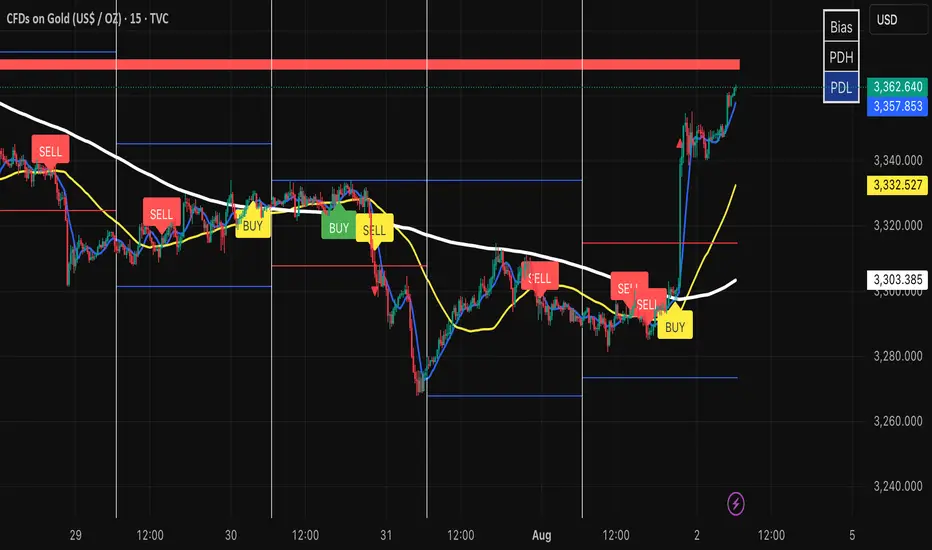
Triple MA Buy & Sell SignalsTriple MA Buy & Sell Signals Indicator
This indicator is designed to help traders identify high-probability entry points based on the combination of three moving averages (8, 50, and 200) while filtering signals in the direction of the main trend.
How It Works
Trend Filter (200 MA)
If the price is above the 200 MA, only BUY signals are displayed.
If the price is below the 200 MA, only SELL signals are displayed.
8 MA and 50 MA Cross (Regular Signals)
BUY (Green): When the 8 MA crosses above the 50 MA, and the price is above the 200 MA.
SELL (Red): When the 8 MA crosses below the 50 MA, and the price is below the 200 MA.
8 MA and 200 MA Cross (Major Trend Signals)
BUY (Yellow): When the 8 MA crosses above the 200 MA.
SELL (Yellow): When the 8 MA crosses below the 200 MA.
Purpose
This indicator is particularly useful for traders who follow Smart Money Concepts (SMC) or ICT-based strategies, as it helps:
Identify trend direction with the 200 MA.
Spot short-term trade entries using the 8/50 MA cross.
Highlight major trend reversals using the 8/200 MA cross.
EMA 10/20/60/120// This script plots four Exponential Moving Averages (10, 20, 60, 120)
// for trend-following analysis. Crossovers and the order of the EMAs can
// help identify the strength and direction of the trend.
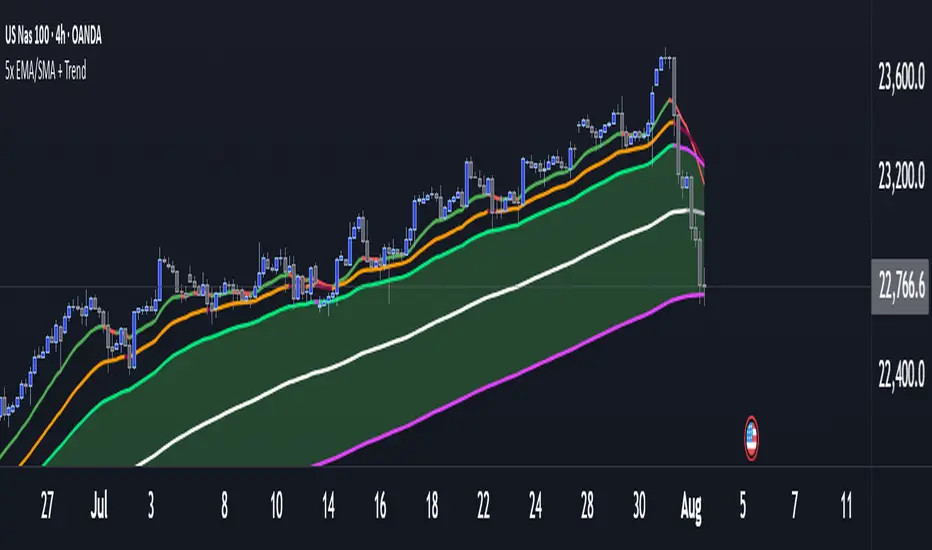
Multi 5x EMA/SMA Colored + EMA Trend Cloud- Ok so these are the settings to the ema's
15
30
50
115
200
Remember these ema's change color depending if the market is bullish or bearish, so choose what colors you want to see bullish and what colors you want to see Bearish
You can also toggle them on or off if you want.
- These are the setting to the trend cloud so you know if the market is bullish or Bearish
50
200
200
Toggle off all plots and only have plots background on
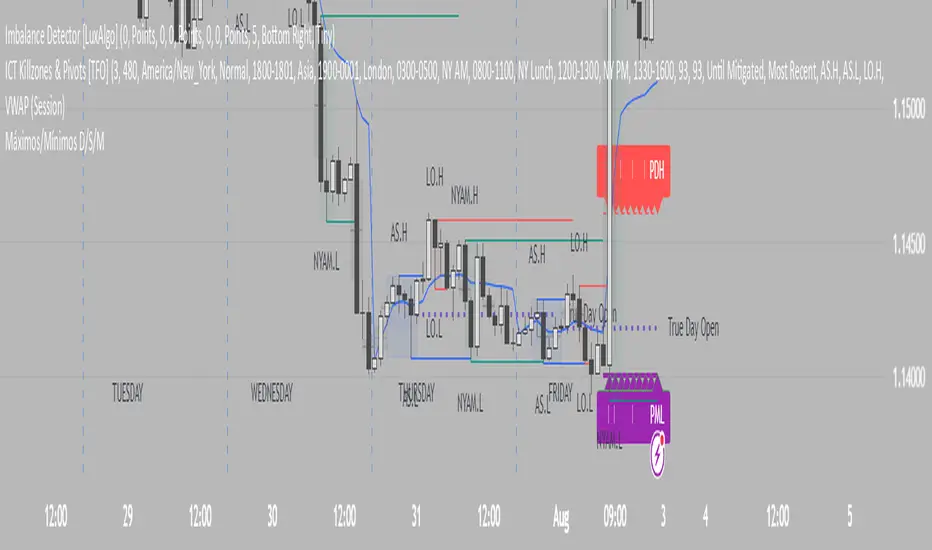
Lucas Scalia Maximums and minimums of the day, week, and month. Basically, it automatically marks and labels the highs and lows of the previous daily , weekly, and monthly candles. The labels can be added or removed at your discretion, leaving only the dotted lines.
Custom Candle Colors by Day (Full Week)Highlight specific daily candles a different color (Monday - Sunday)

