[Pandora] Laguerre Ultimate Explorations MulticatorIt's time to begin demonstrations differentiating the difference between known and actual feasibility beyond imagination... Welcome to my algorithmic twilight zone .
INTRODUCTION:
Hot off my press, I present this Laguerre multicator employing PSv6.0, originally formulated by John Ehlers for TASC - July 2025 Traders Tips. Basically I transcended Ehlers' notions of transversal filtration with an overhaul of his Laguerre design with my "what if" Pandora notions included. Striving beyond John Ehlers' original intended design. This action packed indicator is a radically revamped version of his original filter using novel techniques. My aim was to explore whether providing even more enhanced responsiveness and lesser lag is possible and how. Presented here is my mind warping results to witness.
EHLERS' LAGUERRE EXPLAINED:
First and foremost, the concept of Ehlers' Laguerre-izing method deserves a comprehensive deep dive. Ehlers' Laguerre filter design, as it functions originally, begins with his Ultimate Smoother (US) followed by a gang of four LERP (jargon for Linear intERPolation) filters. Following a myriad of cascading LERPs is a window-like FIR filter tapped into the LERP delay values to provide extra smoothness via the output.
On a side note, damping factor controlled LERP filters resemble EMAs indeed, but aren't exactly "periodic" filters that would have a period/length parameter and their subsequent calculations. I won't go into fine-grained relationship details, but EMA and LERP are indeed related in approach, being cousins of similar pedigree.
EXAMINING LAGUERRE:
I focused firstly on US initialization obstacles at Pine's bar_index==0 with nz() in abundance. The next primary notion of intrigue I mostly wondered about was, why are there four LERP elements instead of fewer or more. Why not three or why not two LERPs, etc... 1-4-6-4-1, I remember seeing those coefficients before in high pass filters.
Gathering my thoughts from that highpass knowledge base, I devised other tapped configuration modes to inspect their behavior out of curiosity. Eureka! There is actually more to Laguerre than Ehlers' mind provided, now that I had formulated additional modes. Each mode exhibits it's own lag/smoothness characteristics better than the quad LERPed version. I narrowed it down to a total of 5 modes for exploration. Mode 0 is just the raw US by itself.
ANALYZING FILTER BEHAVIORS:
Which option might be possibly superior, and how may I determine that? Fortunately, I have a custom-built analyzer allowing me to thoroughly examine transient responses across multiple periodicities simultaneously, providing remarkable visual insights.
While Ehlers has meagerly touched upon presenting general frequency responses in his books, I have excelled far beyond that. This robust filter analysis capability enables me to observe finer aspects hidden to others, ultimately leading to the deprecation of numerous existing filters. Not only this, but inventing entirely new species of filtration whether lowpass, highpass, or bandpass is already possible with a thorough comprehensive evaluation.
Revealing what's quirky with each filter and having the ability to discover what filters may be lacking in performance, is one of it's implications. I'm just going to explain this: For example US has a little too much overshoot to my liking, along with nonconformant cutoff frequency compliance with the period parameter. Perhaps Ehlers should inspect US coefficients a bit closer... I hope stating this is not received in an ill manner, as it's not my intention here.
What this technically eludes to is that UltimateSmoother can be further improved, analogous to my Laguerre alterations described above. I will also state Laguerre can indeed be reformulated to an even greater extent concerning group delay, from what I have already discussed. Another exciting time though... More investigative research is warranted.
LAGUERRE CONCLUSIONS:
After analyzing Laguerre's frequency compliance, transient responses, amplitudes, lag, symmetry across periodicities, noise rejection, and smoothness... I favor mode 3 for a multitude of reasons over the mode 4 configuration, but mostly superb smoothing with less lag, AND I also appreciated mode 1 & 2 for it's lower lag performance options.
Each mode and lag (phase shift) damping value has it's own unique characteristics at extremes, yet they demonstrate additional finesse in it's new hybrid form without adding too much more complexity. This multicator has a bunch of Laguerre filters in the overlay chart over many periodicities so you can easily witness it's differing periodic symmetries on an input signal while adjusting lag and mode.
LAGUERRE OSCILLATOR:
The oscillator is integrated into the laguerreMulti() function for the intention of posterity only. I performed no evaluation on it, only providing the code in Pine. That wasn't part of my intended exploration adventure, as I'm more TREND oriented for the time being, focusing my efforts there.
Market analysis has two primary aspects in my observations, one cyclic while the other is trending dynamics... There's endless oscillators, but my expectations for trend analysis seems a little lesser explored in my opinion, hence my laborious trend endeavors. Ehlers provided both indicator facets this time around, and I hope you find the filtration aspect more intriguing after absorption of this reading.
FUNCTION MODULES EXPLAINED:
The Ultimate Smoother is an advanced IIR lowpass smoothing filter intended to minimize noise in time series data with minimal group delay, similar to a traditional biquad filter. This calculation helps to create a smoother version of the original signal without the distortions of short-term fluctuations and with minimal lag, adjustable by period.
The Modified Laguerre Lowpass Filter (MLLF) enhances the functionality of US by introducing a Laguerre mode parameter along side the lag parameter to refine control over the amount of additional smoothing/lag applied to the signal. By tethering US with this LERPed lag mechanism, MLLF achieves an effective balance between responsiveness and smoothness, allowing for customizable lag adjustments via multiple inputs. This filter ends with selecting from a choice of weighted averages derived from a gang of up to four cascading LERP calculations, resulting with smoother representations of the data.
The Laguerre Oscillator is a momentum-like indicator derived from the output of US and a singular LERPed lowpass filter. It calculates the difference between the US data and Laguerre filter data, normalizing it by the root mean square (RMS). This quasi-normalization technique helps to assess the intensity of the momentum on any timeframe within an expected bound range centered around 0.0. When the Laguerre Oscillator is positive, it suggests that the smoothed data is trending upward, while a negative value indicates a downward trend. Adjustability is controlled with period, lag, Laguerre mode, and RMS period.
Indicators and strategies

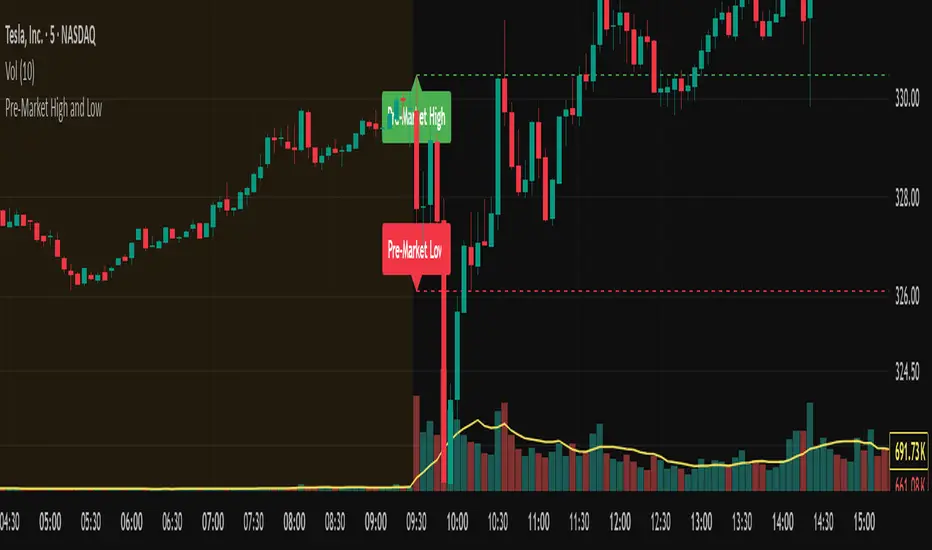
Pre-Market High and LowThis indicator automatically tracks and plots the daily pre-market high and low levels on your chart for U.S. stocks. It monitors the pre-market session from 4:30 AM to 9:30 AM Eastern Time (New York) and captures the highest and lowest prices during this period.
At exactly 9:30 AM ET, when the regular market opens, the indicator draws dashed horizontal lines representing the pre-market high and pre-market low, extending them forward for better visibility throughout the trading day.
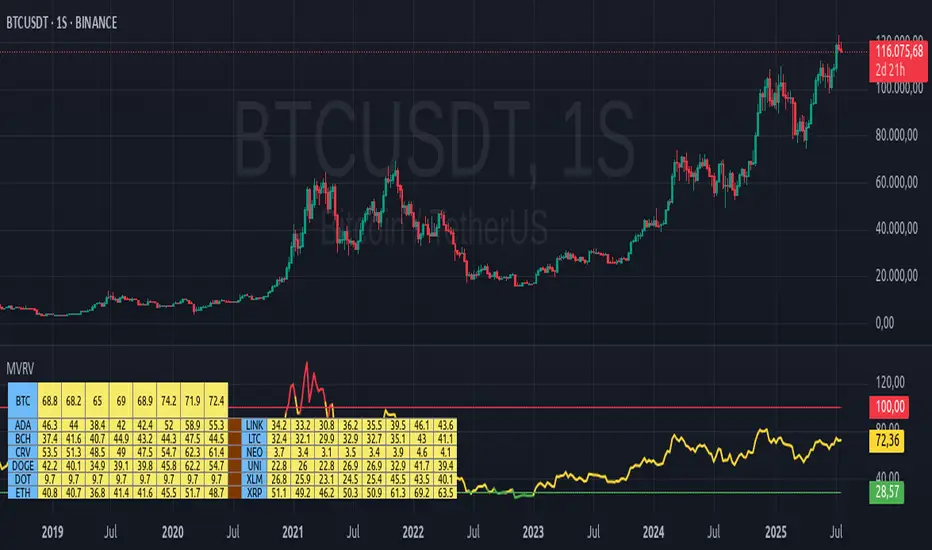
MVRV Altcoins📌 Technical Description of Indicator: MVRV Altcoins
This advanced script calculates the Market Value to Realized Value (MVRV) ratio across multiple cryptocurrencies simultaneously. It offers two analytical modes: Normal and Z-Score, optimized for visual comparison and real-time monitoring of up to 13 predefined assets. If a user applies the indicator to a symbol that is not among the 13 programmed assets, the default behavior displays the Bitcoin chart as a fallback reference.
🔍 What Is MVRV and Why Is It Important?
MVRV is an on-chain metric designed to assess whether a cryptocurrency is overvalued or undervalued by comparing its market capitalization to its realized capitalization.
- Market Cap: The total circulating supply multiplied by the current market price.
- Realized Cap: The sum value of all coins based on the price at the time they last moved on-chain, offering a time-weighted valuation.
Normal Calculation:
MVRV_Normal = Market Cap / Realized Cap
This version reflects investor profitability and identifies potential accumulation or distribution zones.
📊 Z-Score Calculation:
MVRV_ZScore = (Market Cap − Realized Cap) / Standard Deviation of Market Cap
This formula evaluates how extreme the current market conditions are compared to historical norms. It normalizes the difference using statistical dispersion, turning it into a volatility-aware metric that better reflects valuation extremes.
🔎 How Market Cap Is Computed
Unlike conventional indicators relying on consolidated feeds, this script uses modular components from CoinMetrics to construct the active capitalization more accurately, especially for altcoins. Here's the breakdown:
Active Capitalization = MARKETCAPFF + MARKETCAPACTSPLY
Realized Capitalization = MARKETCAPREAL
Component Definitions:
- MARKETCAPFF: Market Cap Free Float — total valuation based only on truly circulating coins.
- MARKETCAPACTSPLY: Capitalization from actively circulating supply — filters dormant or locked coins.
- MARKETCAPREAL: Realized Cap — historical valuation weighted by the last on-chain movement of each coin.
This method offers enhanced precision and compatibility across assets that may lack comprehensive data from centralized providers.
⚙️ User-Configurable Parameters
- MVRV Mode: Choose between Normal and Z-Score.
- Percentage Scale View: If enabled, visual output is scaled using predefined divisors (100 / 3.5 or 100 / 6).
- Thresholds for Analysis:
- Normal mode: Define overbought and oversold levels (default 1.0 and 3.5).
- Z-Score mode: Configure statistical boundaries (default 0.0 and 6.0).
- Table Controls:
- Adjustable position on screen (9 options).
- Font size customization: tiny, small, normal, large.
- Color scheme personalization:
- Header: text and background
- Body: text and background
- Central column separator color
📊 Multicrypto Table Architecture
The indicator renders a high-performance visual table displaying data from up to 13 assets simultaneously. Each asset is represented as a vertical column featuring eigth historical data points plus the most recent value.
- Assets are displayed in two blocks separated by a decorative column.
- Each value is rounded to one decimal place for clarity.
- Cells are styled dynamically based on user settings.
🎨 Decorative Column Separator
Since the entire table is built as a unified structure, a color-configurable empty column is inserted mid-table to act as a visual divider. This approach improves readability and aesthetic balance without duplicating code or splitting table logic.
🔁 Default Behavior on Unsupported Assets
If the active chart is not one of the 13 predefined assets, the indicator will automatically display Bitcoin’s data. This ensures the chart remains functional and informative even outside the target asset group.
🎯 Color Interpretation by Condition
The MVRV value for each asset is highlighted using a traffic light system:
- Green: Undervalued (below oversold threshold)
- Red: Overvalued (above overbought threshold)
- Yellow: Neutral zone
This coding simplifies decision-making and visual scanning across assets.
Final Notes
This indicator is modular and fully adaptable, with well-commented sections designed for efficient customization. Its multiactive architecture makes it a valuable tool for crypto analysts tracking diversified portfolios beyond Bitcoin and Ethereum.
It supports visual storytelling across assets, comparative historical evaluation, and identification of strategic zones — whether for accumulation, distribution, or monitoring on-chain sentiment.
Days Since ±1% Move on CloseInterpretation & Use‑Case
The “Days Since ±1% Move” indicator simply tells you how many trading days have passed since the last daily close that moved at least 1% in either direction. Here’s how to put it to work:
Complacency Gauge
A long stretch without a ≥1% move often signals that realized volatility has collapsed and market participants may be under‑positioned for a sudden swing.
Positioning Insight
When institutional hedges and systematic strategies see low recent volatility, they tend to scale back protection (fewer options hedges, tighter risk limits), which can amplify the impact of any eventual volatility pickup.
Mean‑Reversion Signal
After an extended streak (e.g. 20–30 days), a fresh ≥1% move is more likely—and often more violent—because pent‑up positioning flows rush to adjust.
Trend Confirmation
Conversely, a reset in the count (i.e., a new ≥1% move) that coincides with strong volume and follow‑through suggests genuine directional conviction rather than just a volatility “blip.”

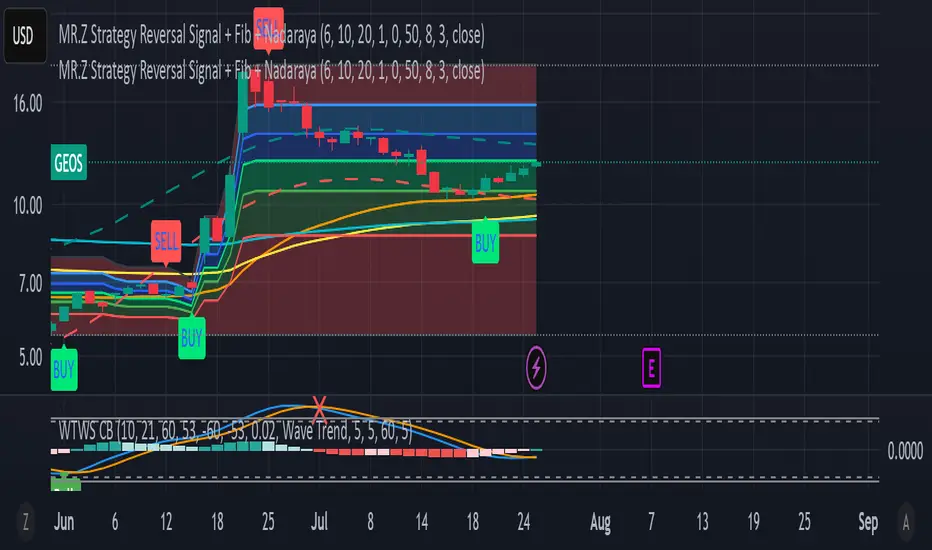
MR.Z Strategy Reversal Signal Nadaraya SMA)Nadaraya-Watson Envelope (NW Envelope):
A smoothed, non-linear dynamic envelope that adapts to price structure. It visually identifies price extremes using kernel regression. The upper and lower bands move with the chart and provide reliable dynamic support and resistance.
EMA Levels:
Includes three key exponential moving averages:
EMA 50 (short-term trend)
EMA 100 (medium-term)
EMA 200 (long-term, institutional level)
Fully Scrollable and Responsive:
All lines and envelopes are plotted using plot() so they move with the chart and respond to zoom and pan actions naturally.
🧠 Ideal Use:
Identify reversal zones, dynamic support/resistance, and trend momentum exhaustion.
Combine WTB and NW Envelope for confluence-based entries.
Use EMA structure for trend confirmation or breakout anticipation.
Let me know if you'd like to add:
Divergence detection
Buy/Sell signals
Alerts or signal filtering options
I’ll be happy to extend the description or the script accordingly!
PRO Investing - Apex EnginePRO Investing - Apex Engine
1. Core Concept: Why Does This Indicator Exist?
Traditional momentum oscillators like RSI or Stochastic use a fixed "lookback period" (e.g., 14). This creates a fundamental problem: a 14-period setting that works well in a fast, trending market will generate constant false signals in a slow, choppy market, and vice-versa. The market's character is dynamic, but most tools are static.
The Apex Engine was built to solve this problem. Its primary innovation is a self-optimizing core that continuously adapts to changing market conditions. Instead of relying on one fixed setting, it actively tests three different momentum profiles (Fast, Mid, and Slow) in real-time and selects the one that is most synchronized with the current price action.
This is not just a random combination of indicators; it's a deliberate synthesis designed to create a more robust momentum tool. It combines:
Volatility analysis (ATR) to generate adaptive lookback periods.
Momentum measurement (ROC) to gauge the speed of price changes.
Statistical analysis (Correlation) to validate which momentum measurement is most effective right now.
Classic trend filters (Moving Average, ADX) to ensure signals are only taken in favorable market conditions.
The result is an oscillator that aims to be more responsive in volatile trends and more stable in quiet periods, providing a more intelligent and adaptive signal.
2. How It Works: The Engine's Three-Stage Process
To be transparent, it's important to understand the step-by-step logic the indicator follows on every bar. It's a process of Adapt -> Validate -> Signal.
Stage 1: Adapt (Dynamic Length Calculation)
The engine first measures market volatility using the Average True Range (ATR) relative to its own long-term average. This creates a volatility_factor. In high-volatility environments, this factor causes the base calculation lengths to shorten. In low-volatility, they lengthen. This produces three potential Rate of Change (ROC) lengths: dynamic_fast_len, dynamic_mid_len, and dynamic_slow_len.
Stage 2: Validate (Self-Optimizing Mode Selection)
This is the core of the engine. It calculates the ROC for all three dynamic lengths. To determine which is best, it uses the ta.correlation() function to measure how well each ROC's movement has correlated with the actual bar-to-bar price changes over the "Optimization Lookback" period. The ROC length with the highest correlation score is chosen as the most effective profile for the current moment. This "active" mode is reflected in the oscillator's color and the dashboard.
Stage 3: Signal (Normalized Velocity Oscillator)
The winning ROC series is then normalized into a consistent oscillator (the Velocity line) that ranges from -100 (extreme oversold) to +100 (extreme overbought). This ensures signals are comparable across any asset or timeframe. Signals are only generated when this Velocity line crosses its signal line and the trend filters (explained below) give a green light.
3. How to Use the Indicator: A Practical Guide
Reading the Visuals:
Velocity Line (Blue/Yellow/Pink): The main oscillator line. Its color indicates which mode is active (Fast, Mid, or Slow).
Signal Line (White): A moving average of the Velocity line. Crossovers generate potential signals.
Buy/Sell Triangles (▲ / ▼): These are your primary entry signals. They are intentionally strict and only appear when momentum, trend, and price action align.
Background Color (Green/Red/Gray): This is your trend context.
Green: Bullish trend confirmed (e.g., price above a rising 200 EMA and ADX > 20). Only Buy signals (▲) can appear.
Red: Bearish trend confirmed. Only Sell signals (▼) can appear.
Gray: No clear trend. The market is likely choppy or consolidating. No signals will appear; it is best to stay out.
Trading Strategy Example:
Wait for a colored background. A green or red background indicates the market is in a tradable trend.
Look for a signal. For a green background, wait for a lime Buy triangle (▲) to appear.
Confirm the trade. Before entering, confirm the signal aligns with your own analysis (e.g., support/resistance levels, chart patterns).
Manage the trade. Set a stop-loss according to your risk management rules. An exit can be considered on a fixed target, a trailing stop, or when an opposing signal appears.
4. Settings and Customization
This script is open-source, and its settings are transparent. You are encouraged to understand them.
Synaptic Engine Group:
Volatility Period: The master control for the adaptive engine. Higher values are slower and more stable.
Optimization Lookback: How many bars to use for the correlation check.
Switch Sensitivity: A buffer to prevent frantic switching between modes.
Advanced Configuration & Filters Group:
Price Source: The data source for momentum calculation (default close).
Trend Filter MA Type & Length: Define your long-term trend.
Filter by MA Slope: A key feature. If ON, allows for "buy the dip" entries below a rising MA. If OFF, it's stricter, requiring price to be above the MA.
ADX Length & Threshold: Filters out non-trending, choppy markets. Signals will not fire if the ADX is below this threshold.
5. Important Disclaimer
This indicator is a decision-support tool for discretionary traders, not an automated trading system or financial advice. Past performance is not indicative of future results. All trading involves substantial risk. You should always use proper risk management, including setting stop-losses, and never risk more than you are prepared to lose. The signals generated by this script should be used as one component of a broader trading plan.

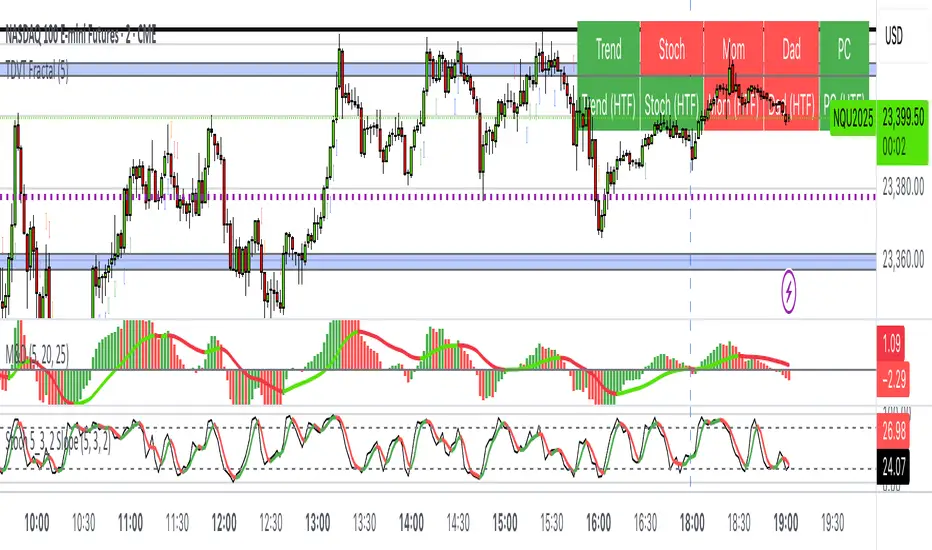
The Visualized Trader (Fractal Timeframe)The **The Visualized Trader (Fractal Timeframe)** indicator for TradingView is a tool designed to help traders identify strong bullish or bearish trends by analyzing multiple technical indicators across two timeframes: the current chart timeframe and a user-selected higher timeframe. It visually displays trend alignment through arrows on the chart and a condition table in the top-right corner, making it easy to see when conditions align for potential trade opportunities.
### Key Features
1. **Multi-Indicator Analysis**: Combines five technical conditions to confirm trend direction:
- **Trend**: Based on the slope of the 50-period Simple Moving Average (SMA). Upward slope indicates bullish, downward indicates bearish.
- **Stochastic (Stoch)**: Uses Stochastic Oscillator (5, 3, 2) to measure momentum. Rising values suggest bullish momentum, falling values suggest bearish.
- **Momentum (Mom)**: Derived from the MACD fast line (5, 20, 30). Rising MACD line indicates bullish momentum, falling indicates bearish.
- **Dad**: Uses the MACD signal line. Rising signal line is bullish, falling is bearish.
- **Price Change (PC)**: Compares the current close to the previous close. Higher close is bullish, lower is bearish.
2. **Dual Timeframe Comparison**:
- Calculates the same five conditions on both the current timeframe and a user-selected higher timeframe (e.g., daily).
- Helps traders see if the trend on the higher timeframe aligns with the current chart, providing context for stronger trade decisions.
3. **Visual Signals**:
- **Arrows on Chart**:
- **Current Timeframe**: Blue upward arrows below bars for bullish alignment, red downward arrows above bars for bearish alignment.
- **Higher Timeframe**: Green upward triangles below bars for bullish alignment, orange downward triangles above bars for bearish alignment.
- Arrows appear only when all five conditions align (all bullish or all bearish), indicating strong trend potential.
4. **Condition Table**:
- Displays a table in the top-right corner with two rows:
- **Top Row**: Current timeframe conditions (Trend, Stoch, Mom, Dad, PC).
- **Bottom Row**: Higher timeframe conditions (labeled with "HTF").
- Each cell is color-coded: green for bullish, red for bearish.
- The table can be toggled on/off via input settings.
5. **User Input**:
- **Show Condition Boxes**: Toggle the table display (default: on).
- **Comparison Timeframe**: Choose the higher timeframe (e.g., "D" for daily, default setting).
### How It Works
- The indicator evaluates the five conditions on both timeframes.
- When all conditions are bullish (or bearish) on a given timeframe, it plots an arrow/triangle to signal a strong trend.
- The condition table provides a quick visual summary, allowing traders to compare the current and higher timeframe trends at a glance.
### Use Case
- **Purpose**: Helps traders confirm strong trend entries by ensuring multiple indicators align across two timeframes.
- **Example**: If you're trading on a 1-hour chart and see blue arrows with all green cells in the current timeframe row, plus green cells in the higher timeframe (e.g., daily) row, it suggests a strong bullish trend supported by both timeframes.
- **Benefit**: Reduces noise by focusing on aligned signals, helping traders avoid weak or conflicting setups.
### Settings
- Access the indicator settings in TradingView to:
- Enable/disable the condition table.
- Select a higher timeframe (e.g., 4H, D, W) for comparison.
### Notes
- Best used in trending markets; may produce fewer signals in choppy conditions.
- Combine with other analysis (e.g., support/resistance) for better decision-making.
- The higher timeframe signals (triangles) provide context, so prioritize trades where both timeframes align.
This indicator simplifies complex trend analysis into clear visual cues, making it ideal for traders seeking confirmation of strong momentum moves.
Order Block + Liquidity Sniper by TradingNexus🧠 Order Block + Liquidity Sniper by TradingNexus
📌 How the Indicator Works – Explanation of Visual Elements
🔺 Triangles – Liquidity Sniper Signals
Green triangle below candle (▲): This is a Bullish Liquidity Sniper Signal. It indicates that price swept liquidity below a Swing Low, triggering stop-losses, and then returned back above a bullish Order Block zone. This suggests potential institutional buying interest and could mark a strong buy opportunity.
Red triangle above candle (▼): This is a Bearish Liquidity Sniper Signal. It shows that price swept above a Swing High to collect liquidity and then returned below a bearish Order Block zone. This implies possible institutional selling after a liquidity hunt and may signal a short entry.
🟢 Circles – Order Block Zones
Green circle (●): Represents a Bullish Order Block area – typically the last bearish candle before a strong bullish move. Price returning to this zone may react due to renewed institutional buying.
Red circle (●): Marks a Bearish Order Block – the last bullish candle before a strong bearish move. These zones may act as resistance when price revisits.
✖️ Crosses – Liquidity Zones
Purple cross (+): Identifies a Swing High liquidity level – a short-term high where many stop-loss orders are likely clustered.
Orange cross (+): Marks a Swing Low liquidity zone – a key area where stop orders from long positions may reside.
This indicator seeks precise institutional-style entries by detecting when price:
Sweeps liquidity at a recent swing high or low;
Then reacts from a valid Order Block zone.
The triangle markers highlight potential Sniper entries, while circles and crosses help visualize the key zones that underpin these moves.
Use this tool to improve timing, context, and confidence in your trades – especially when combining with SMC or price action frameworks.
Built by TradingNexus – designed for price action traders who use Smart Money Concepts (SMC).

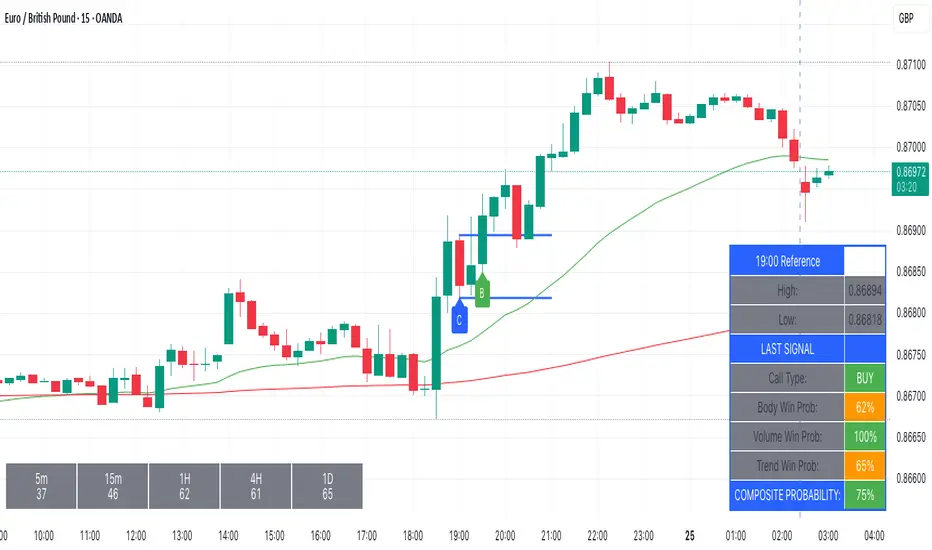
Kairos BarakahTrade with precision during high-probability windows using this advanced Pine Script indicator, designed specifically for Indian Standard Time (IST). The tool identifies key reversal opportunities within a user-defined trading session, combining time-based reference levels, sequence-validated signals, and multi-factor win probability analysis for confident decision-making.
Key Features
1. Time-Based Reference Levels
Automatically sets high/low reference levels at a customizable start time (default: 19:00 IST).
Active trading window with adjustable duration (default: 135 minutes).
Clear visual reference lines for easy tracking.
2. Intelligent Signal Generation
Initial Signals:
Buy (B): Triggered when price closes above the reference high.
Sell (S): Triggered when price closes below the reference low.
Reversal Signals (R):
Valid only after an initial signal, ensuring proper sequence.
Buy Reversal: Price closes above reference high (after a Sell signal).
Sell Reversal: Price closes below reference low (after a Buy signal).
3. Multi-Dimensional Win Probability
Body Strength: Measures candle conviction (body size / total range).
Volume Confirmation: Compares current volume to 20-period average.
Trend Alignment: Uses EMA crosses (9/21) and RSI (14) for momentum.
Composite Score: Weighted blend of all factors, color-coded for quick interpretation:
🟢 >70%: High-confidence signal.
🟠 40-69%: Moderate confidence.
🔴 <40%: Weak signal.
4. Professional Visualization
Clean labels (B/S/R) at signal points.
Real-time reference table showing levels, active signal, and probabilities.
Customizable alerts for all signal types.
Why Use This Indicator?
IST-Optimized: Tailored for Indian market hours.
Rules-Based Reversals: Avoids false signals with strict sequence checks.
Data-Driven Confidence: Win probability metrics reduce guesswork.
Flexible Setup: Adjust time windows and parameters to fit your strategy.
SMC Core Concepts TradingNexus (BOS, CHoCH, FVG, OB) - Stage 1🔍 SMC Core Concepts TradingNexus – Stage 1 (BOS, CHoCH, FVG, OB)
Smart Money Concepts made visual and accessible.
This indicator helps traders identify key institutional structures such as Break of Structure (BOS), Change of Character (CHoCH), Fair Value Gaps (FVG), and Order Blocks (OB) – all automatically detected and visualized on the chart.
✅ Features in Stage 1:
🔹 BOS Detection – Detects bullish and bearish structure breaks based on swing points
🔹 CHoCH Identification – Spots potential change of character after a trend
🔹 Fair Value Gap Zones – Highlights imbalances between candles
🔹 Order Block Zones – Detects key OB zones before strong price moves
🔹 Smart Auto-Cleanup – Automatically removes old boxes to optimize performance
🔹 User Inputs – Configure swing sensitivity and toggle each feature
🧠 Built for Traders Seeking Clarity
This script is ideal for SMC traders who want clear structure-based setups without drawing everything manually. Designed for both scalpers and swing traders who follow institutional logic.
🚀 Stage 2 (Coming Soon):
Liquidity zones (EQH/EQL)
Internal vs. external BOS
Mitigation blocks
Bias detection
Buy/Sell signal system
Smart SL/TP zones
Alerts system
👤 Created by TradingNexus
💬 Open-source & community-driven. Feel free to fork, contribute, or suggest improvements.

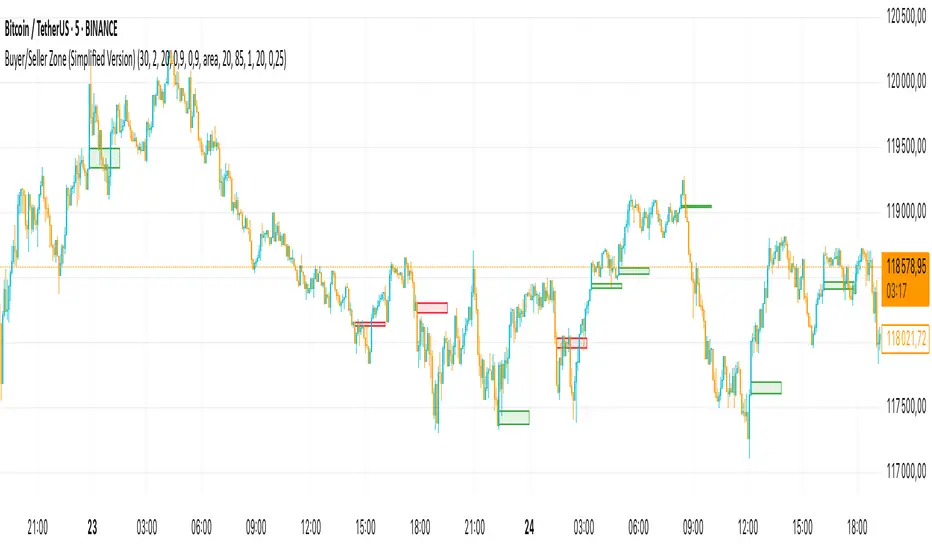
Buyer/Seller Zone (Simplified Version)📌 Indicator: Buyer/Seller Zone (Simplified Version)
This indicator is designed to highlight potential areas of strong buyer or seller activity based on advanced volume and volatility analysis. It identifies key candles that exhibit anomalous behavior — those standing out from typical market noise — and marks them as potential interest zones.
🔍 What it does:
Detects candles with unusually high volume (anomalies).
Filters them further based on strong price movement (volatility).
Marks bullish and bearish zones using customizable visuals: area, circle, or diamond.
Provides optional alerts when a buyer/seller signal is detected.
💡 How to use:
Use this tool to identify potential reversal or continuation zones.
Zones may act as strong support/resistance areas.
Some levels are more significant than others — do not trade every level blindly. Combine with your own analysis or wait for a retest/confirmation before entry.
⚙️ Customization:
Volume filter threshold
Volatility sensitivity
Visualization type, size, and transparency
🚨 Alerts: Set alerts for bullish, bearish, or any signal type.
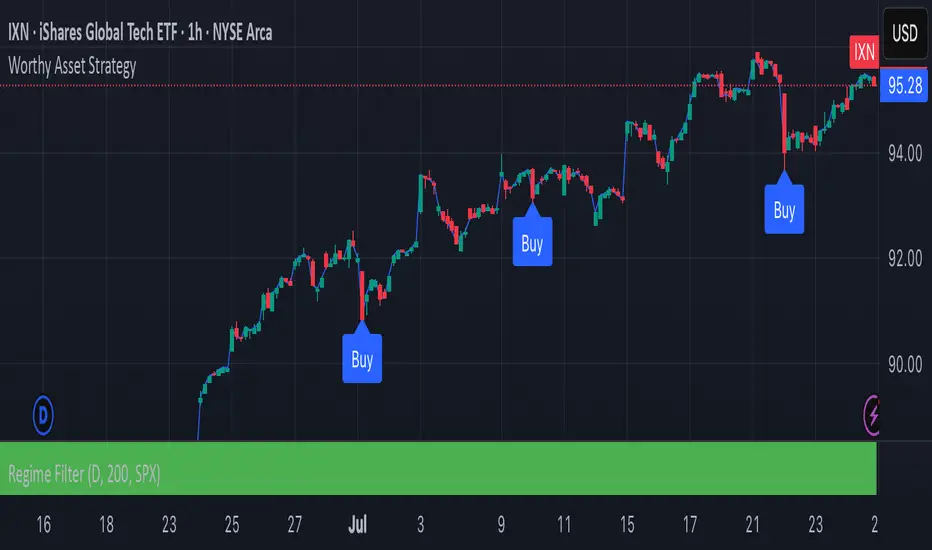
Worthy Asset StrategyThis strategy is designed with a two-part philosophy: a regime filter and a value-based accumulation approach.
🟩 Regime Filter:
If the S&P 500 (SPX) is trading above its 200-period EMA, a green background is shown below the chart, signaling a favorable market regime.
If the SPX is below the 200 EMA, the background turns red, indicating a less favorable environment.
📉 Buy Signals:
Buy signals are generated by red candles that drop a certain percentage from their open — essentially treating these pullbacks as discount opportunities.
The idea is to accumulate more of a selected asset when it becomes temporarily cheaper.
💎 Philosophy & Execution:
I only apply this strategy to assets I’ve personally researched and believe to be fundamentally valuable.
If a Buy signal occurs and the SPX is trading above its 200 EMA (i.e., the background is green), I enter the position.
Once in the trade, I follow this logic:
If the position reaches +1.5% profit, I sell it.
If it doesn’t reach profit and goes into a loss, I simply hold.
I don’t sell at a loss because I believe in the long-term value of the asset.
If the price drops further, I accumulate more — aiming to lower my average cost and eventually exit at a profit once the asset recovers.
This approach is based on the mindset of treating drawdowns as discounts, not danger.
"The more it drops, the more I accumulate — because I see value, not risk."
This is still a work in progress, and I’m actively refining it over time.
⚠️ Note: The sell logic is not yet visible on the chart and will be added in a future update.
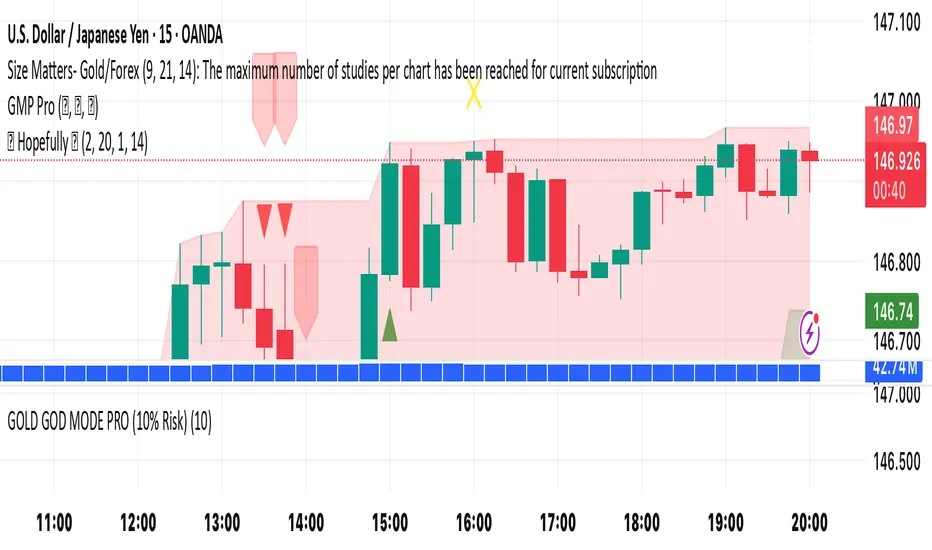
🚀 Hopefully 🤲🏻It’s a simple yet effective indicator. Its power level is high. Its secret lays in its dynamics. Simply “BUY’ when you see green triangle & "SELL" when you see red triangle 🔺. Do your own due diligence and remember to always be disciplined and focused 🧘
Happy trading to you all ☮️
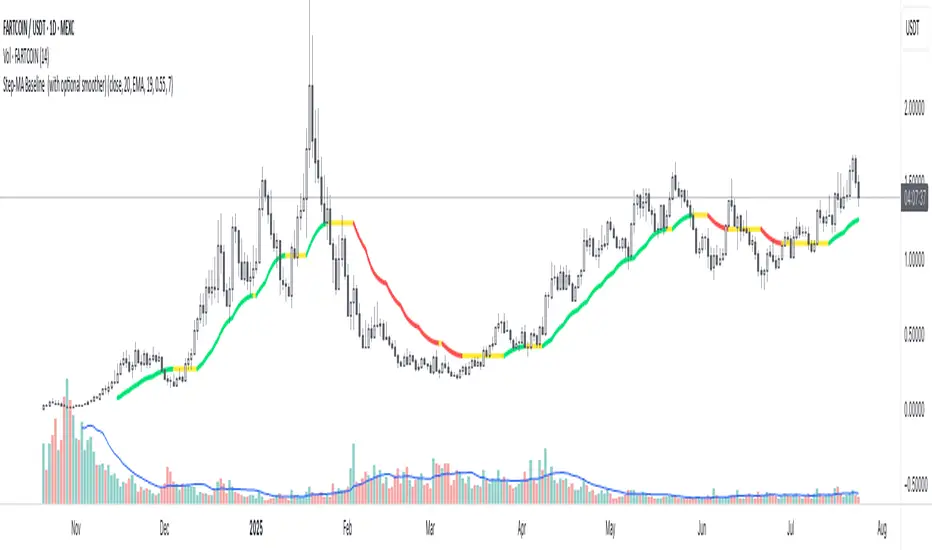
Step-MA Baseline (with optional smoother)Trackline – Trend-Following Baseline with Confirmation Zones
A clean trend-following baseline that adapts to price action while filtering noise. Built on a smoothed moving average (EMA or HMA), Trackline highlights directional bias, with optional zone coloring to indicate breakout alignment or pullback opportunities. Use it to identify trend direction, validate entries, or act as dynamic support/resistance in trending environments.
Features:
• Customizable length & smoothing method (EMA, HMA, or WMA)
• Optional signal coloring (bullish/bearish/neutral)
• Works on all timeframes and assets
• Pairs well with momentum or liquidity tools
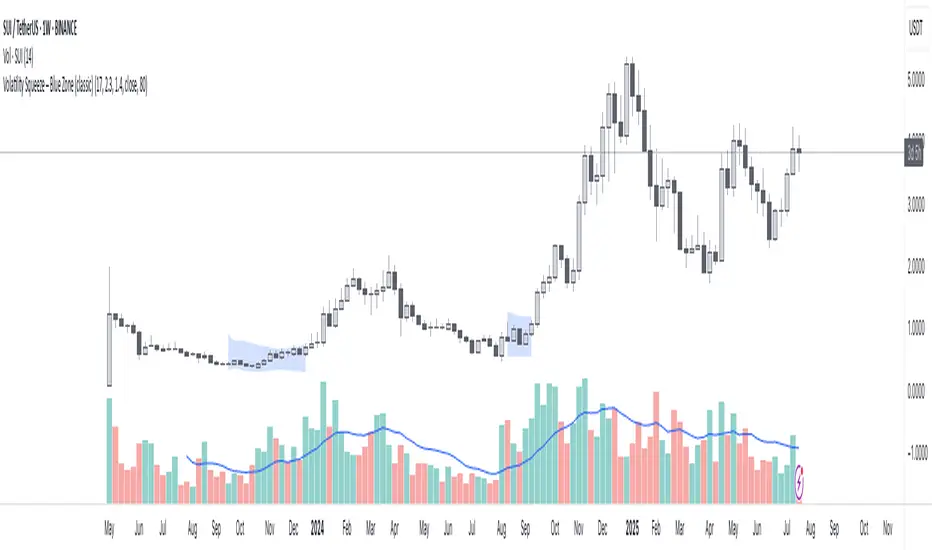
Volatility Squeeze – Blue Zone (classic) Volatility Squeeze – Blue Zone
Highlights periods when volatility contracts by showing a blue band between the Bollinger Bands (BB) whenever they fall inside the Keltner Channel (KC).
Blue zone = squeeze: BB upper & lower are inside KC – market coiling.
Automatic breakout alert: optional alert fires on the first bar after the squeeze releases.
Fully adjustable: BB/KC length, BB σ, KC ATR multiplier, zone colour & opacity, border on/off.
Clean overlay: zone hugs price bar-by-bar and disappears only when the squeeze ends, so past squeezes remain visible for context.
Use it to spot low-volatility setups, then watch for momentum or volume confirmations when the squeeze breaks.
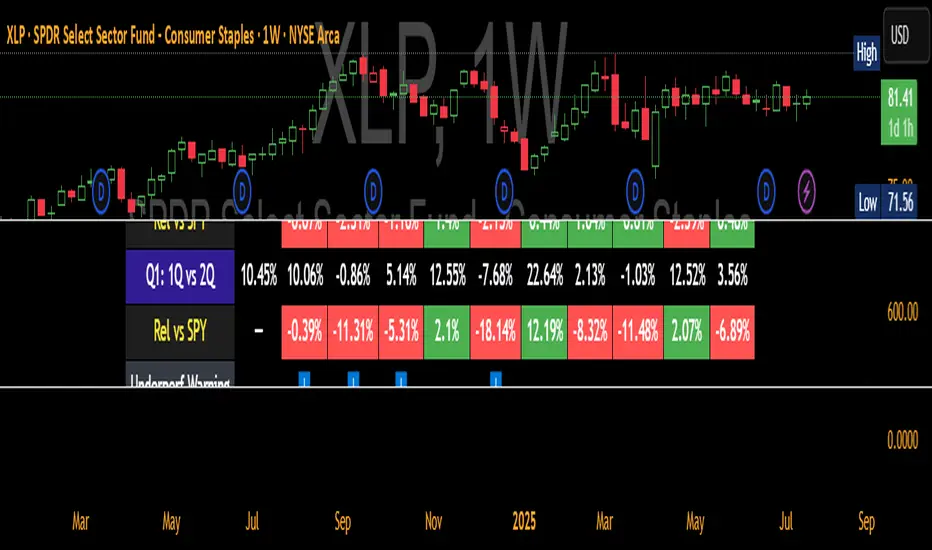
QTR Sector Fund Performance vs SPY - by LMAnalyzes various market sectors and compares the last several quarters to the performance of the SPY. The goal is to seek out the sectors that have underperformed for several quarters in the hopes that they would overperform in the next quarter.
Magnet Zones: Trap Detection & Flow Map [@darshakssc]This script detects potential bull and bear trap candles—price actions that may appear strong but are likely to reverse—based on:
🔺 Wick structure
📊 Volume spike behavior
💡 RSI confirmation logic
⏳ Signal cooldown filter to reduce false positives
The indicator then plots:
🟥 Red “🚨 Trap” labels above candles showing possible bull traps
🟩 Green “🧲 Trap” labels below candles showing possible bear traps
➖ Horizontal zone lines to mark these trap levels as “magnet zones,” which may act as future support or resistance
🧠 How It Works:
1. Volume Spike Detection
2. The script first checks for unusually high volume (1.5× the average volume over the last 20 candles).
3. Trap Candle Structure
4. A trap is suspected when there is a long wick opposite the direction of the candle body, signaling a failed breakout or price manipulation.
5. RSI Confirmation
6. Bull Traps: RSI must be above 60
7. Bear Traps: RSI must be below 40
✅ This helps validate whether the price was overbought or oversold.
✅ Cooldown Mechanism
✅ After a trap is detected, it waits for 10 bars before allowing another signal—this reduces noise and overfitting.
✅ How to Use It:
1. Apply on any timeframe, especially effective for intraday trading (e.g. 5m, 15m, 1h).
2. Use the trap signals as early warnings to avoid fake breakouts.
3. Combine with your own strategy or trend-following system for confirmation.
4. The trap lines (magnet zones) can be used as dynamic support/resistance levels for future pullbacks or reversals.
⚠️ Important Note:
This script is for educational purposes only and is not financial advice.
Always use traps in combination with your personal discretion, risk management, and other confluence tools.

Minimalist Trend & Risk For 5-Min Timeframe
Of course. Here is a professionally written TradingView description for your indicator, following the specified formatting and incorporating the strategy you outlined.
Minimalist Trend & Risk For 5-Min Timeframe
Overview
This is a clean, on-chart visual tool designed to identify high-probability entries and manage risk, specifically tailored for a 5-minute scalping or day trading strategy. It combines a higher-timeframe trend anchor with a current-timeframe trigger line and a volatility-based stop loss level, keeping your chart uncluttered and your decisions clear.
Visual Components
Trend EMA (50-period, 15-min): This is your main trend guide. The thick, colored line represents the 50 EMA from the 15-minute chart.
Green: Confirmed uptrend.
Red: Confirmed downtrend.
Gray: Neutral or consolidating market.
Price EMA (21-period, 5-min): The thin white line is the 21 EMA based on your current chart (5-minute). This acts as a dynamic trigger line that price must reclaim after a pullback.
Stop Loss Zone (ATR-based): The thin red line provides a suggested stop loss level based on current market volatility (ATR). It automatically appears below price in an uptrend and above price in a downtrend, helping you define your risk on every trade.
How To Use for a Long Entry Strategy
The strategy is to trade pullbacks in the direction of the higher-timeframe trend. This indicator helps you visualize each step of the setup.
1. Identify the Trend: Wait for the main Trend EMA (the thick line) to be green. This confirms you are in an established uptrend on the 15-minute timeframe and should only be looking for long entries.
2. Wait for a Pullback: The core of the strategy is patience. Wait for a 5-minute candlestick to pull back and close below the 15-minute Trend EMA. This confirms a temporary dip within the larger uptrend, offering a better entry price.
3. Spot the Entry Trigger: After the pullback, the entry signal occurs when a 5-minute candlestick closes back above the faster, white Price EMA (21-period). This signals that momentum is returning in the direction of the main trend.
4. Manage Your Risk: Use the red Stop Loss Zone line that appears below your entry as a guide to set your initial stop loss. This helps ensure your risk is managed dynamically based on current volatility.
This indicator simplifies a powerful pullback strategy by plotting all the necessary components directly on your chart, allowing for quick and disciplined trade execution.

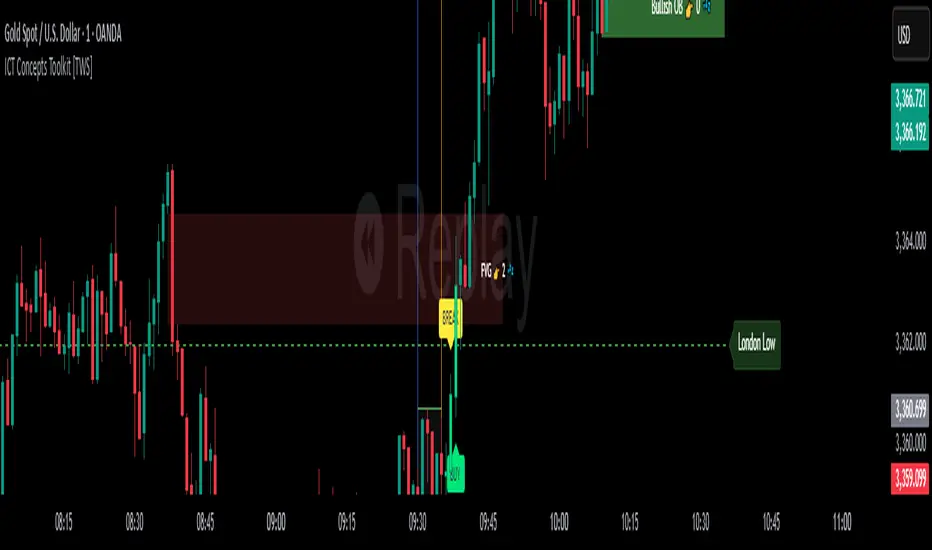
ICT Concepts Toolkit [TWS]
ICT Concepts Toolkit – by Trade With Stevie
Unlock the full power of Inner Circle Trader (ICT) concepts with this all-in-one indicator built for serious traders.
The ICT Concepts Toolkit combines the most powerful price action tools into one clean, efficient, and highly customizable interface — perfect for mastering market structure and timing precision entries.
✅ Features Included:
🟩 Order Blocks – Automatically detect key institutional levels for potential reversals and entries.
📉 Fair Value Gaps (FVGs) – Visualize imbalances in price action to spot high-probability targets and mitigation zones.
📊 Support & Resistance – Dynamically plotted levels to track market structure and trend shifts in real-time.
📅 Previous Daily Highs/Lows – Key liquidity zones marked for precision scalping and swing setups.
🕒 Session Zones – Clearly defined Asian, London, and New York sessions with customizable times and colors.
📌 Extension Lines – Extends each session’s high and low to the current candle for ongoing bias and liquidity mapping.
🚦ICT Morning Signal – Your personal directional bias assistant: smart signals showing when to Buy or Sell based on ICT’s powerful Morning Model logic.
Whether you're trading Forex, Futures, or Crypto — this toolkit gives you a cleaner chart, clearer bias, and more confidence in your setups.
💡 Created by Trade With Stevie — follow for more smart tools and signal insights.
SPY, QQQ, VIX - Multi TF Trend Table***CURRENTLY IN BACKTESTING PHASE***
This TradingView script creates a real-time multi-timeframe trend status table for SPY, QQQ, and VIX using the Ripster-style EMA cloud logic.
🔍 What It Shows:
Current Price (1 Min): Live snapshot of each symbol.
10min Trend (5/12 EMA): Short-term momentum.
10min Trend (34/50 EMA): Intermediate-term direction.
1 Hour Trend: Higher timeframe trend.
Daily Trend: Long-term trend using 5/12 and 34/55 EMA alignment.
Each cell is color-coded:
✅ Green = Bullish
❌ Red = Bearish
Yellow can be used for neutral if customized.
⚙️ How It Works:
Uses request.security() to pull multi-timeframe EMA values for each symbol.
Compares fast/slow EMAs to determine bullish or bearish alignment.
The table is refreshed live and placed in a corner of your choice.
✅ Ideal For:
Trend traders using Ripster EMA clouds
SPY/QQQ/VIX correlation watchers
Traders seeking real-time trend clarity across multiple timeframes

Digital Clock with Candle Alert📊 Digital Clock with Candle Alert
A sleek, customizable digital clock for your trading charts that displays real-time with seconds and provides visual alerts before new candles form. Never miss a candle entry again!
✨ Key Features:
- Real-time Digital Clock - Shows hours, minutes, and seconds in your chosen timezone
- Visual Candle Alerts - Blinking notification before new candles form
- Multi-Timeframe Alerts - Get alerts for any timeframe regardless of your chart period
- Fully Customizable - Colors, size, position, and alert timing all configurable
- Half-Second Blinking - Eye-catching 2Hz blink rate for maximum visibility
- 6 Timezone Options - Exchange, UTC, New York, London, Tokyo, Sydney
🎯 Use Cases:
- Scalping - Know exactly when the next candle will form
- Entry Timing - Perfect for strategies that enter on new candles
- Multi-Timeframe Trading - Monitor higher timeframe candles while on lower timeframes
- General Awareness - Always know the current time in your trading timezone
⚙️ Settings:
Time Settings:
- Timezone selection (Exchange default or specific zones)
Display Options:
- Text and background colors for normal operation
- Alert colors for blinking state
- Text size (tiny to huge)
- Position (9 locations on chart)
Alert Configuration:
- Enable/disable blinking alerts
- Select timeframe to monitor
- Alert lead time (5 seconds to 1 hour)
📝 Important Notes:
- Clock updates depend on incoming price ticks
- During low-volume periods, updates may be less frequent
- Works best on liquid instruments during active market hours
- Alert timeframe is independent of your chart timeframe
💡 Tips:
- Use contrasting alert colors for maximum visibility
- Set lead time based on your reaction needs
- Position clock where it won't obstruct price action
- Try red background with white text for urgent alerts
🔄 Version 1.0 - Initial release

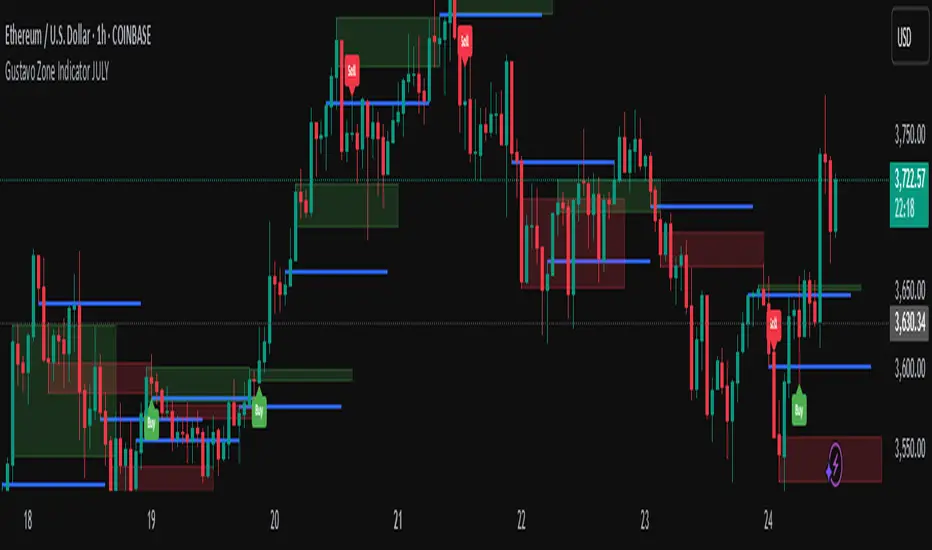
Gustavo Zone Indicator JULYThis indicator watches for runs of at least three consecutive green (or red) candles followed by an opposite-color candle, then marks that reversal zone by drawing a rectangle from the wicks of the first two run candles. It optionally plots a horizontal “target” line at the wick of the third run candle. While the zone is active, if three bars in a row close beyond both the zone boundary and the target line, it issues a customizable “Sell” label above the bar (after bullish runs) or a “Buy” label below the bar (after bearish runs). All colors, text labels, sizes, offsets, and toggles for the zones, lines, and signals can be adjusted in the input settings.
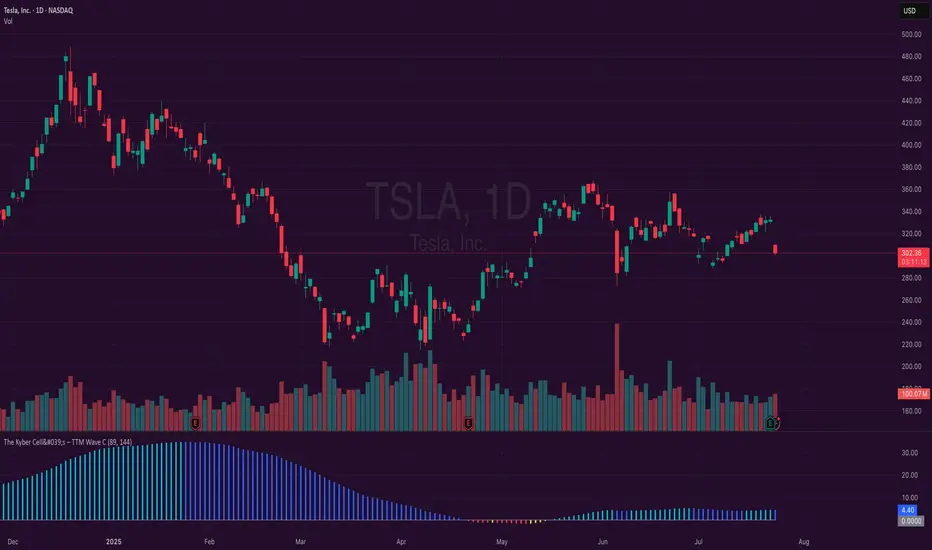
The Kyber Cell's – TTM Wave CThe Kyber Cell’s Wave C – TTM Squeeze Macro Bias & Structural Filter
⸻
1. Introduction
Wave C is the strategic compass in the TTM Squeeze Wave system — the final layer that helps you align with the larger trend or macro context. While Wave A delivers momentum bursts and Wave B confirms active trend direction, Wave C filters trades through a broader lens, helping you avoid taking strong intraday setups that go against the dominant structure.
Wave C is designed to act as your macro bias validator — filtering out trades that contradict higher-timeframe flows or major moving average slopes. When all three waves line up, you’re no longer just reacting to signals — you’re trading with intention and structure. When in doubt, zoom out and that is what Wave C gives you.
⸻
2. Core Concept and Calculation
Wave C is built to measure high-level trend bias, either on the current chart timeframe or derived from a higher timeframe (HTF). Its logic is based on one or more of the following structural tools:
• Long-term EMA slope (e.g., 55, 89, or 200 EMA)
• HTF VWAP positioning (price above or below)
• Long-period HMA slope (e.g., HMA 144 or HMA 233)
• Directional bias from HTF TTM Squeeze or MTF trend engine
Unlike Wave A and B, which may fluctuate during normal price swings, Wave C changes more slowly. That’s the point — it gives a “big picture” backdrop against which all lower-level signals should be evaluated. It reduces false positives and helps you wait for trades in the direction of the broader trend.
⸻
3. Visual Output and Color Logic
Wave C uses a simple and deliberate color scheme to communicate macro alignment:
• Green: Bullish macro structure
• Red: Bearish macro structure
• Gray: Neutral, indecisive, or flat macro trend
This muted but firm logic encourages patient, structured trading. The goal isn’t to trigger trades directly from Wave C, but to filter out trades that contradict market posture.
• When Wave C is Green, you ideally want Wave B to be blue and Wave A to turn cyan before going long.
• When Wave C is Red, you look for Wave B to be red and Wave A to turn bright red before shorting.
• If Wave C is Gray, it may signal choppy, indecisive structure — use caution or reduce trade size.
⸻
4. Ideal Use Case
Wave C functions as your global bias filter:
1. Set your directional bias for the session or week.
2. Only take trades that agree with Wave C direction.
3. When all waves align, trade with size and confidence.
4. When Wave C disagrees, wait or downshift your trade plan.
This makes Wave C especially valuable for swing traders, position traders, or intraday traders who want to anchor their entries within a broader trend.
⸻
5. Configuration and Customization
Wave C is built with advanced users in mind, and its configuration allows multiple structural methods:
• EMA Slope Method: Set EMA length and threshold angle
• HTF Source Method: Request HTF data for squeeze trend, VWAP, or Wave B analog
• HMA Trend Filter: Longer-term smoothing to detect sustained directional flow
• Color Preferences: Customize green/red/gray scheme as needed
This flexibility allows you to tailor Wave C to your strategy — whether you’re anchoring to a Daily EMA while scalping the 5-minute chart, or aligning swing entries with the Weekly VWAP.
⸻
6. Alerts and Add-ons
Although Wave C isn’t typically used for alerts, it can be incorporated into confluence-based alert stacks. For example:
• Alert only when Wave C = Green, Wave B = Blue, and Wave A = Rising
• Alert on macro flip (e.g., Green → Red) as a possible regime change
• Alert when macro bias agrees with MTF Squeeze Panel bias
These setups are more advanced but help automate disciplined trade selection.
⸻
7. Disclaimer
This indicator is for educational and research purposes only. It is not trading advice. Wave C is most effective when used in conjunction with Wave A, Wave B, and other structural context. All trades should be executed with proper risk management and backtested methodology.