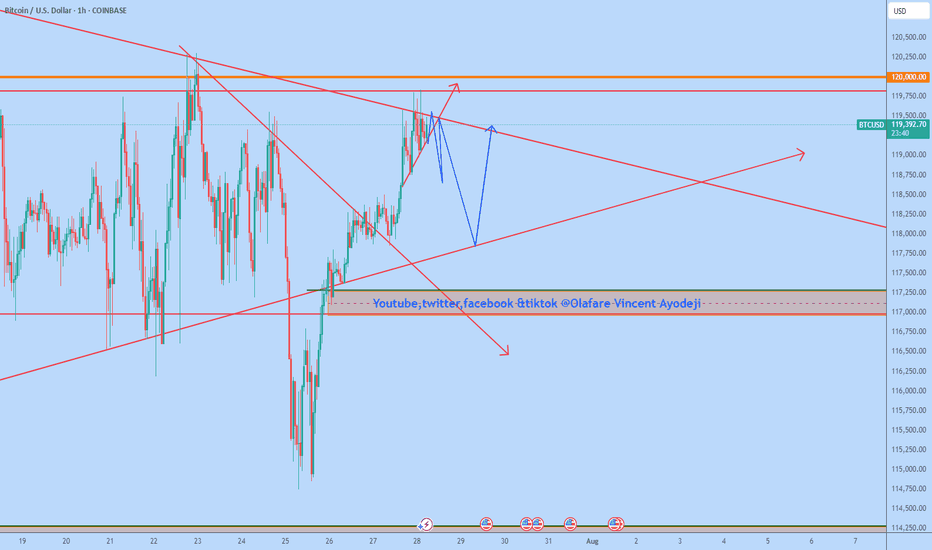
Understanding Wedge Patterns - A Real Bitcoin Case Study🎓📊 Understanding Wedge Patterns - A Real Bitcoin Case Study 🧠📈
Hi everyone, FXPROFESSOR here 👨🏫
From this moment forward, I will no longer be posting targets or trade setups here on TradingView. Instead, I’ll be focusing 100% on education only for here in Tradinfview.
Why? Because over time I’ve learned that even when traders receive the right charts, most still struggle to trade them effectively. So, from now on, FX Professor Crypto content here will be strictly educational — designed to teach you how to read and react to the markets like a professional. Unfortunately I cannot be posting on Tradingview frequent updates like I do all day. Education is always better for you guys. And i am very happy to share here with you what matters the most.
🧩 In today’s post, we dive into one of the most misunderstood formations: the wedge pattern.
Most resources show wedges breaking cleanly up or down — but real price action is messier.
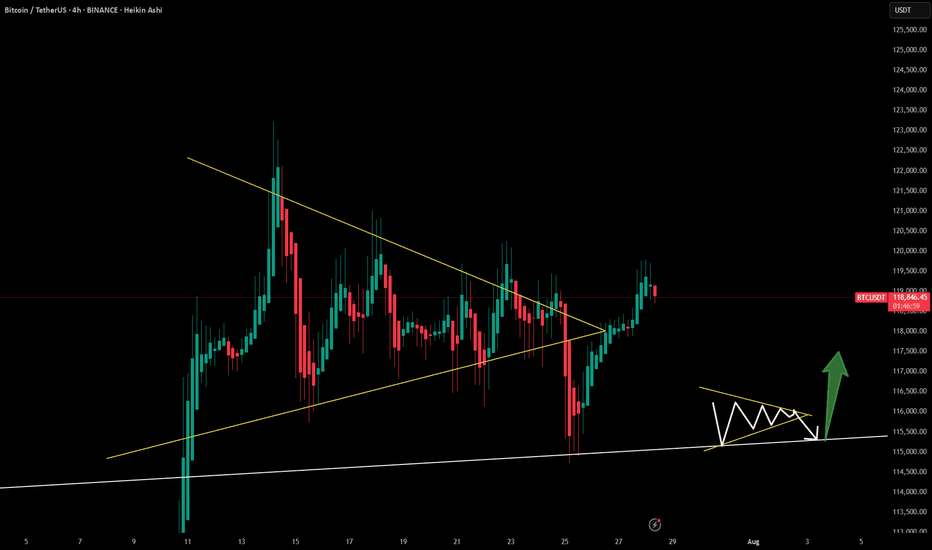
🎥 I recorded a video a few days ago showing exactly how BTC respected a wedge formation.
⚠️ Note: Unfortunately, TradingView doesn’t play the audio of that clip — apologies that you can’t hear the live commentary — but the visuals are clear enough to follow the logic. (there is no advertising of any kind on the video so i hope i don't get banned again - i did make a mistake the last time and will avoid it-the community here is awesome and needs to stay clean and within the rules of TV).
Here’s what happened:
🔸 A clean wedge formed over several days
🔸 We anticipated a fake move to the downside, grabbing liquidity
🔸 BTC rebounded off support around a level marked in advance
🔸 Then price re-entered the wedge, flipping support into resistance
The lesson?
📉 Often price will exit the wedge in the wrong direction first — trapping retail traders — before making the real move. This is a classic liquidity trap strategy, exercised by the 'market'.
💡 Remember:
Wedges often compress price until it "runs out of space"
The initial breakout is often a trap
The true move tends to come after liquidity is taken
The timing of the 'exit' has a lot to do with the direction. In the future we will cover more examples so pay attention.
I stayed long throughout this move because the overall market context remained bullish — and patience paid off.
Let this be a reminder: it’s not about guessing the direction — it’s about understanding the mechanics.
More educational breakdowns to come — keep learning, keep growing.
One Love,
The FX PROFESSOR 💙
Disclosure: I am happy to be part of the Trade Nation's Influencer program and receive a monthly fee for using their TradingView charts in my analysis. Awesome broker, where the trader really comes first! 🌟🤝📈
Community ideas
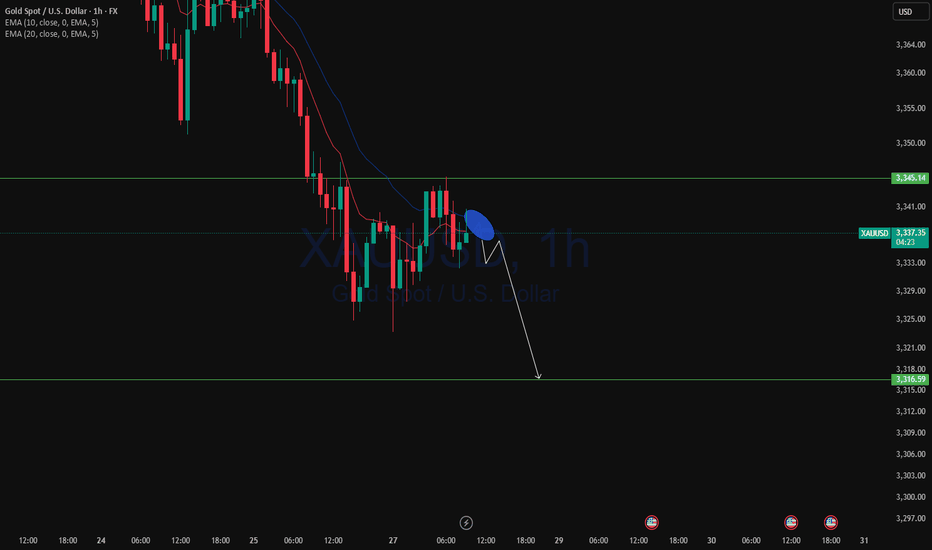
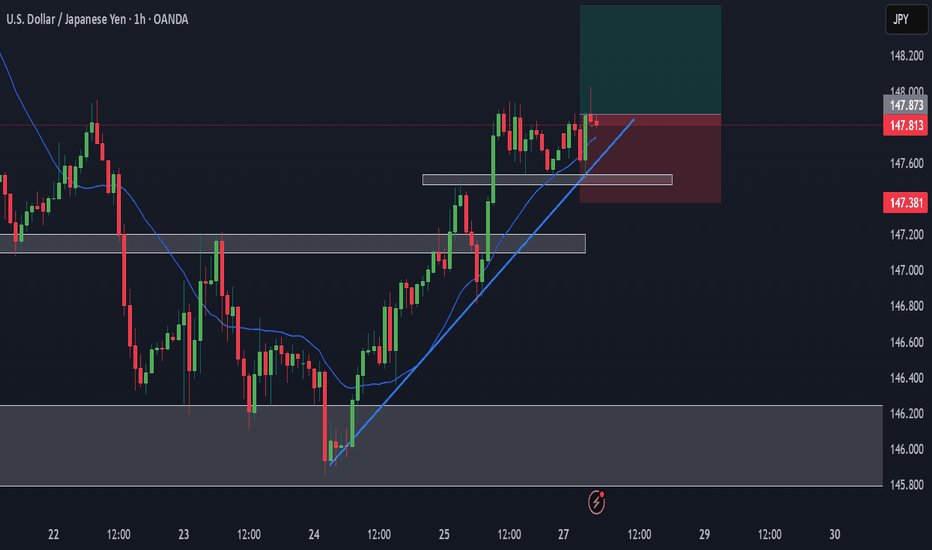
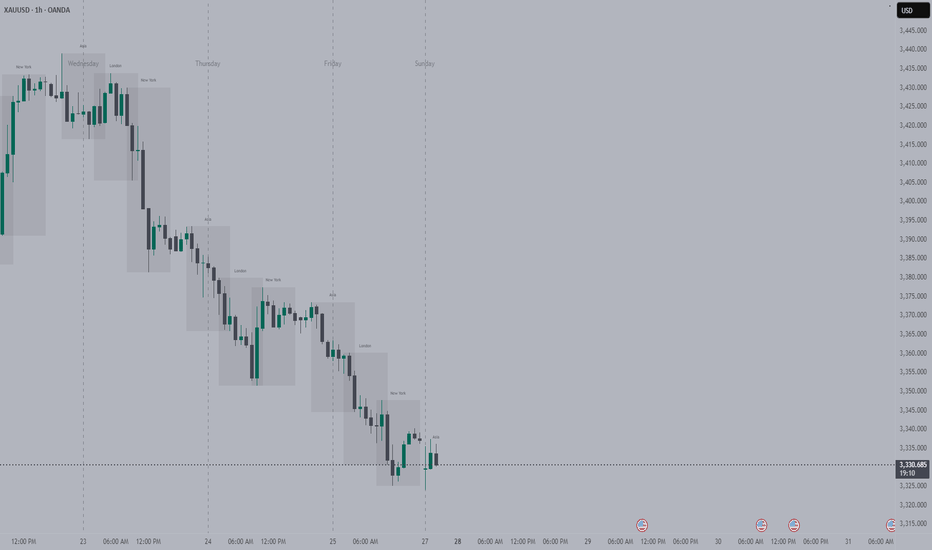
XAUUSD and AUDUSD Analysis todayHello traders, this is a complete multiple timeframe analysis of this pair. We see could find significant trading opportunities as per analysis upon price action confirmation we may take this trade. Smash the like button if you find value in this analysis and drop a comment if you have any questions or let me know which pair to cover in my next analysis.
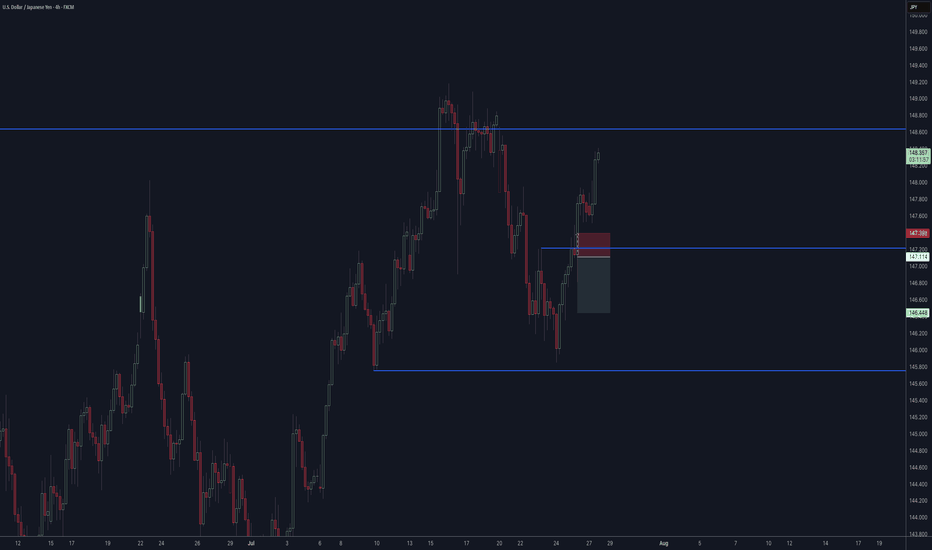
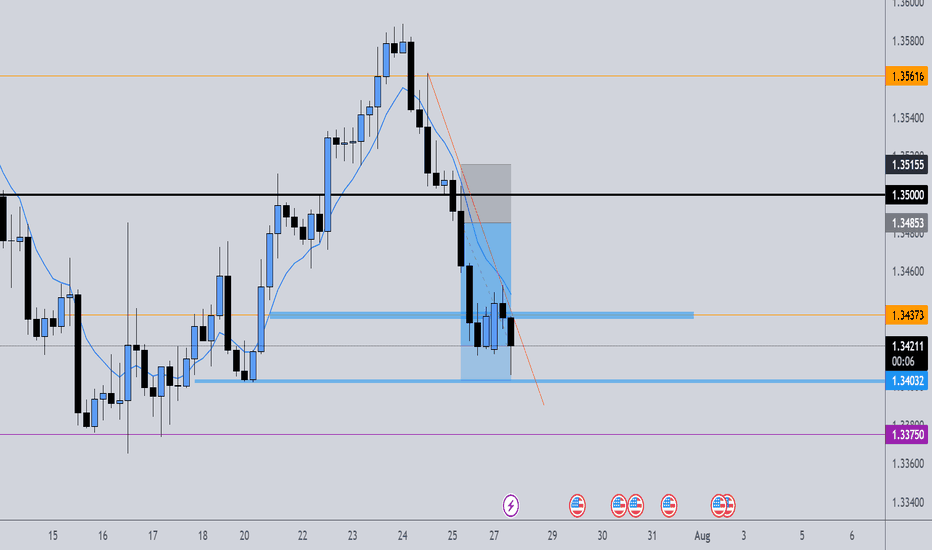
GBPUSD - GBPJPY - USDJPY Trade Recaps 28.07.25Three positions taken last week. Some vital findings within my self-review process which showed a stop loss error with GBJPY causing me to miss a solid 4% trade, and a manual close on GBPUSD to bank a little extra profit.
Full explanation as to why I executed on these positions and the management plan with both.
Any questions you have just drop them below 👇
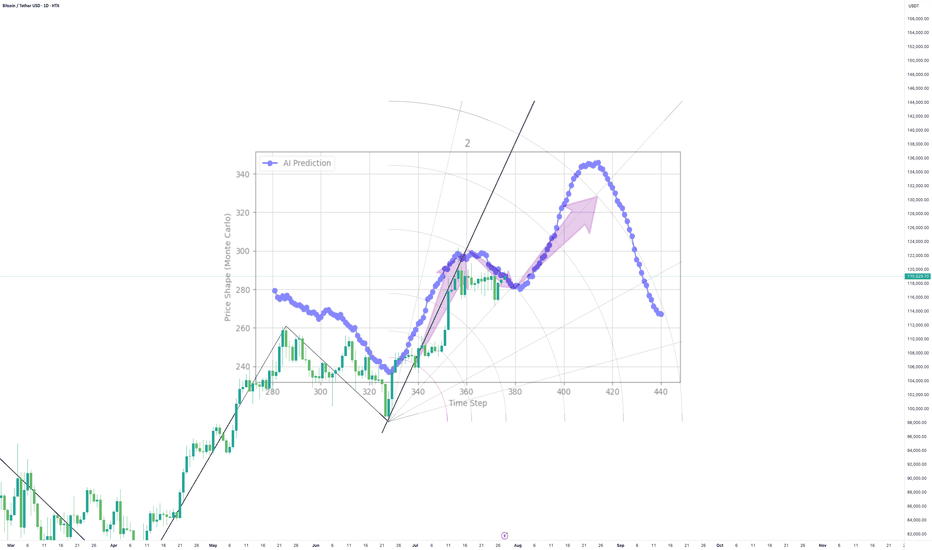
Consistency and reliable performance with real time validationMy cutting edge tech has been put to the test with daily real time validation
It's been correct for over 4 weeks
It's been my mission to defy market odds and revolutionize trading, and with thanks to AI my mission is being fulfilled
I would love to hear your thoughts...or if not, I hope you're getting really excited by what you see
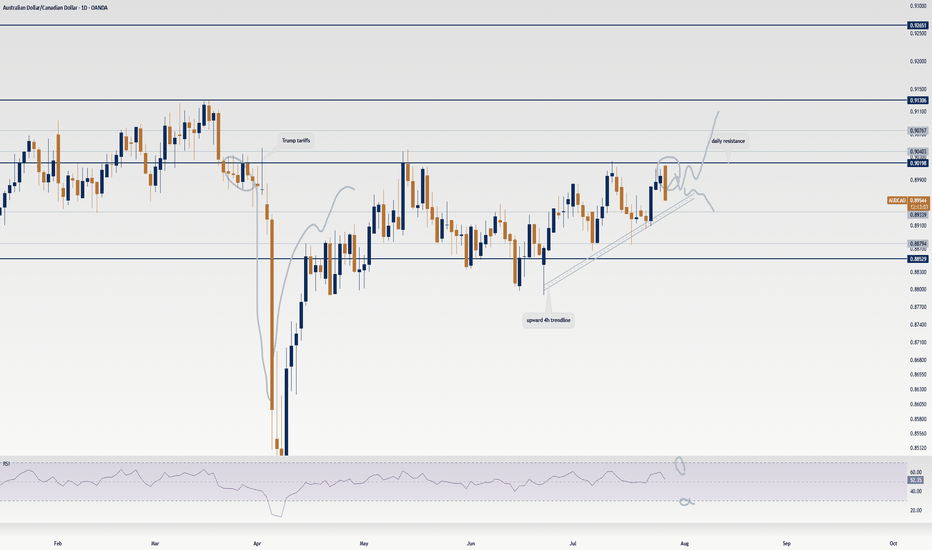
AUD/CAD’s Big Move: Don’t Sleep on This Breakout Setup!Hey traders, Skeptic from Skeptic Lab here! 🔥 While everyone’s freaking out over interest rate news and Non-Farm Employments , AUD/CAD ’s stealing the show on the daily time frame.
📉Post-tariff crash, it’s rebounding strong. A daily resistance break could kick off a major uptrend. Use RSI overbought/oversold ( linked in my TradingView article ) to confirm momentum.
👀Beware of fakeouts this week—volatility’s high! Trade smart, keep risk tight, and don’t FOMO. Share your thoughts in the comments, boost if it helps <3 🩵
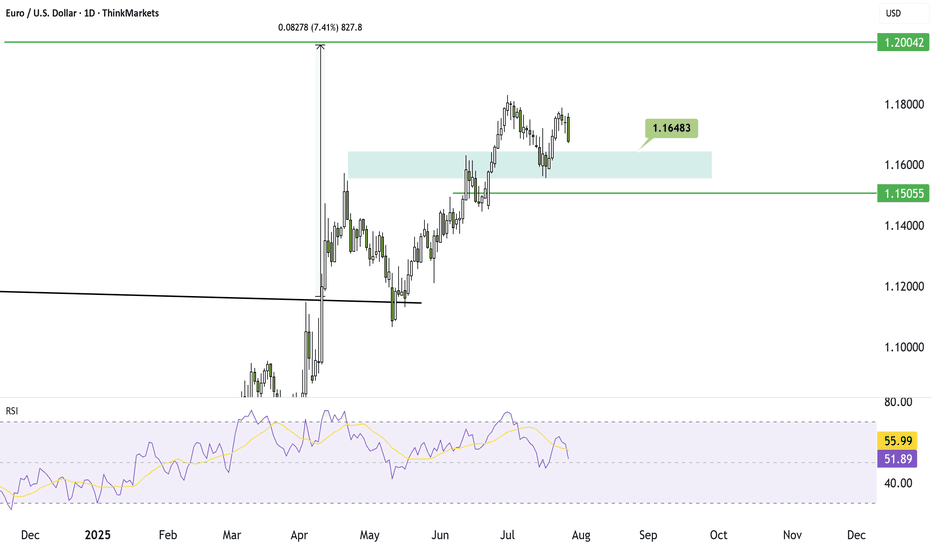
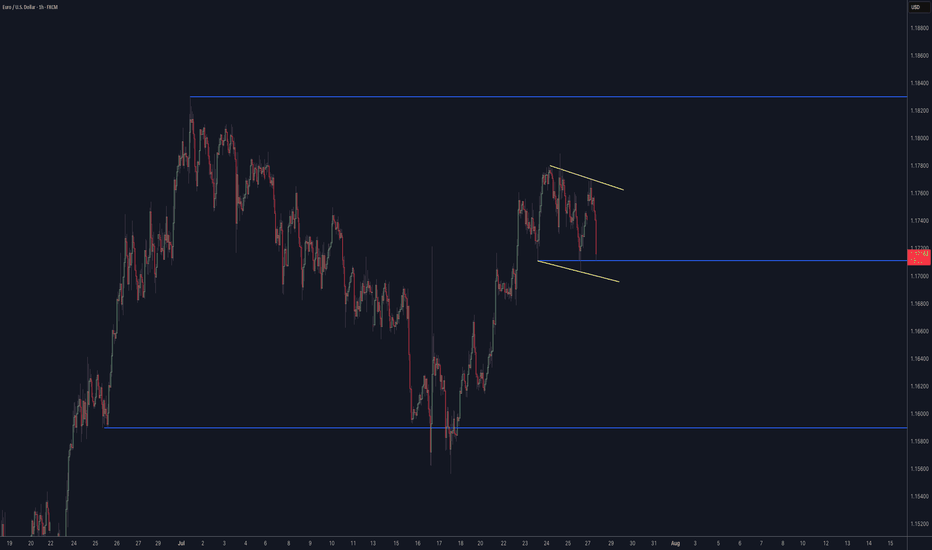
Will the Euro collapse on US Tariffs? Traders eye 1.15The EURUSD is under pressure today, dropping nearly half a percent. This follows the new US–EU trade deal that introduces a 15 percent baseline import tariff on most goods. That means Americans buying European products must now pay 15 percent more.
Naturally, markets are adjusting. When one side of a trade deal takes the hit, its currency often weakens. In this case, the euro is sliding as the cost of EU exports rises. If the euro were to fall by the full 15 percent in response, we could see EURUSD drop to parity again. That would balance the new cost for American buyers, making European goods just as affordable as before.
Still, the technical outlook remains neutral. The trend on EURUSD remains bullish until a break below 1.15 occurs. If that happens, it could open the door to 1.12 or even 1.10. Until then, traders watching the chart may stay cautious.
One reason why the EURUSD might gain is that President Trump continues to pressure the Federal Reserve to cut interest rates. If the Fed caves while inflation is still rising, the US could face the same issues that have plagued countries like Turkey, where political pressure has undermined monetary stability and triggered runaway inflation.
In that case, the euro might strengthen, pushing EURUSD back toward 1.20 or higher.
Is this the peak for EURUSD or just a pause before the next leg higher? The next few weeks will reveal the answer.
This content is not directed to residents of the EU or UK. Any opinions, news, research, analyses, prices or other information contained on this website is provided as general market commentary and does not constitute investment advice. ThinkMarkets will not accept liability for any loss or damage including, without limitation, to any loss of profit which may arise directly or indirectly from use of or reliance on such information.
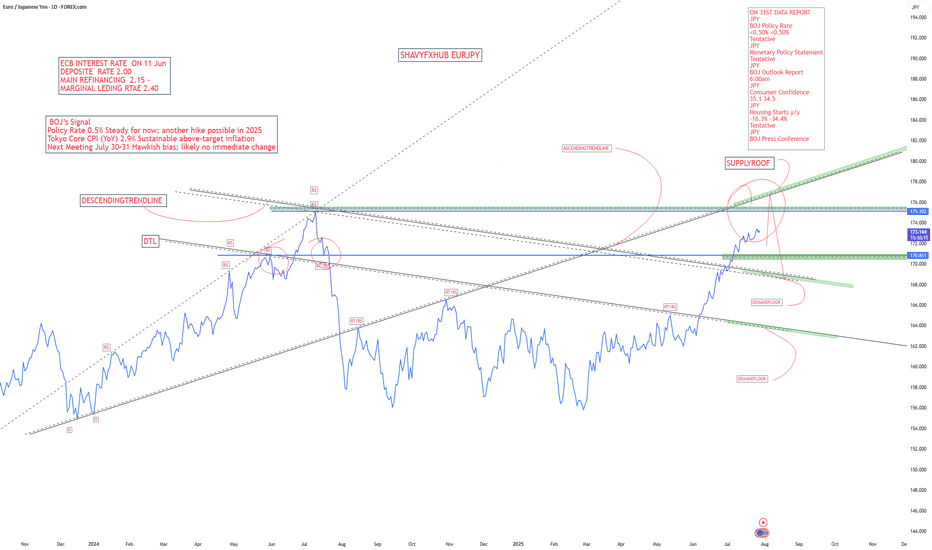
EURJPYBank of Japan (BOJ) — July 28, 2025: Latest Overview
Policy Rate and Recent Moves
Short-term policy rate: Remains at 0.5%, the highest since 2008.
Decision timing: This rate was set in January 2025 (up from 0.25%) and has been maintained
Policy Outlook and Economic Backdrop
Inflation: Tokyo's core CPI is running above the BOJ’s 2% target (2.9% YoY in July), primarily due to external price pressures like energy and currency movements, not strong domestic demand.
Growth trends: The BOJ has trimmed its growth outlook, noting headwinds from higher U.S. tariffs and yen weakness, but still expects a moderate recovery if global trade remains stable.
Bond Purchases: The BOJ is scaling back its massive holdings of Japanese government bonds—targeting a 400 billion yen quarterly reduction through March 2026, then lowering to 200 billion yen in subsequent quarters.
Potential rate path: Market consensus and BOJ commentary indicate a possible hike to at least 0.75% by year-end 2025 if above-target inflation persists and downside global risks do not intensify.
Key Drivers and Central Bank Signals
U.S.-Japan trade: The new trade pact has reduced some uncertainties, supporting the possibility of policy tightening if inflation and yen trends remain stable.
Inflation’s nature: The BOJ stresses that any additional rate hikes will depend on seeing sustained, demand-driven price increases and wages, rather than just external cost pressures.
Governor Ueda’s message: The BOJ is maintaining a cautious, data-dependent approach, prioritizing stability and careful evaluation of global and domestic risk factors.
Quick Fact Table
Indicator Latest (July 2025) BOJ’s Signal
Policy Rate 0.5% Steady for now; another hike possible in 2025
Tokyo Core CPI (YoY) 2.9% Sustainable above-target inflation
Next Meeting July 30–31 Hawkish bias; likely no immediate change
Bonds (JGB reduction) -400B yen/Q Gradual unwinding through March 2026
Rate Outlook Stable, with upside Hike to 0.75% possible by year-end if justified
Summary:
The BOJ remains in a cautious, data-driven policy stance at 0.5% as of late July 2025, with inflation still above target and moderate growth. The central bank is slowly reducing bond purchases and may raise rates again by year-end if the current economic trends persist, but no change is expected at the imminent July meeting.
European Central Bank (ECB) — July 2025: Latest Policy and Economic Update
Key Interest Rates and Current Stance
Deposit Facility Rate: 2.00%
Main Refinancing Operations (MRO) Rate: 2.15%
Marginal Lending Facility Rate: 2.40%
These rates were set after a 25 basis point cut in early June 2025 and have now been held steady as of the ECB’s July 24, 2025 meeting.
Monetary Policy Context
Policy Pause: The ECB ended a year-long easing cycle which saw rates cut from 4% to 2%. The current pause reflects the ECB’s “wait-and-see” approach as inflation has now stabilized at its 2% target and global trade tensions—especially over U.S. tariffs—add significant uncertainty.
No Commitments: The Governing Council is explicitly not pre-committing to any future rate path, emphasizing a data-dependent, meeting-by-meeting stance.
Asset Purchases: The ECB’s asset purchase programme (APP) and the pandemic emergency purchase programme (PEPP) portfolios are being reduced gradually, with no reinvestment of maturing securities.
Inflation and Economic Outlook
Inflation: Now at 2% (its target). The ECB expects it to remain near target for the period ahead. Wage growth continues but is slowing, and underlying price pressures are easing.
Ecoomic Growth: The eurozone economy grew more strongly than expected in early 2025, but trade uncertainty and a stronger euro are holding back business investment and exports. Higher government spending, especially on defense and infrastructure, is expected to support growth over the medium term.
Loans and Credit: Borrowing costs are at their lowest since late 2022. Households are benefiting from strong labor markets and growing wages, but banks are cautious in their lending due to uncertainty and global trade tensions.
Risks and Forward Guidance
The ECB is focused on safeguarding price stability amid exceptional uncertainty due to global trade disputes and policy risks.
There is no forward guidance for the next rate change. Markets are pricing only one possible additional cut for 2025, and a potential return to tightening in late 2026 if inflation stays below target.
Summary Table: ECB at a Glance (July 2025)
Policy Rate 2.15%
Deposit Rate 2.00%
Marginal Lending 2.40%
Inflation (Jun 25) 2% (target achieved)
GDP Growth (2025) 0.9% (projected)
Policy bias Cautious, data-dependent pause
The ECB’s current stance is one of caution, monitoring the effects of prior easing and global trade risks while inflation stabilizes at target. No further near-term cuts are planned unless significant data surprises emerge. The approach is flexible, with decisions made meeting-by-meeting in response to evolving economic and financial conditions.
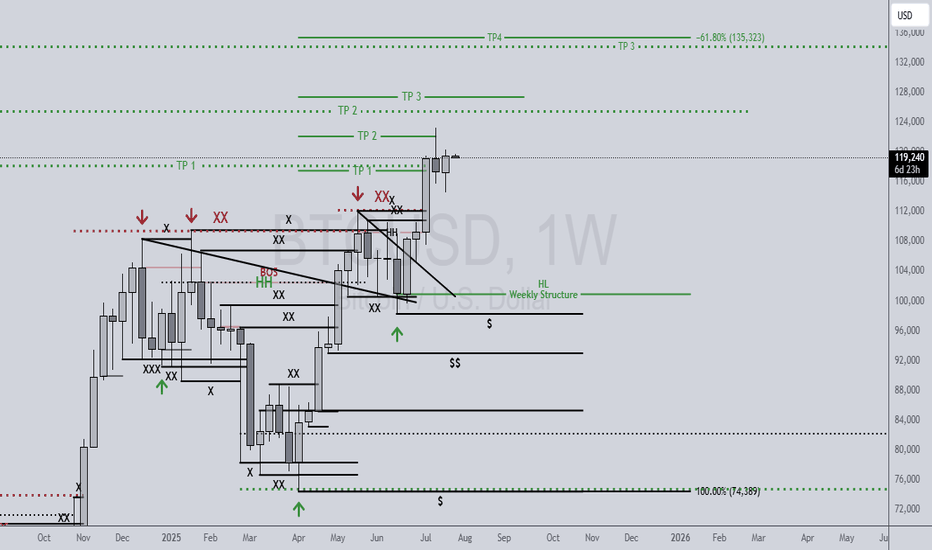
BTCUSD 7/27/2025Come Tap into the mind of SnipeGoat as he gives you a Full Top-Down Analysis of Bitcoins Price Action as we embark on another week of Quarter 3.
_SnipeGoat_
_TheeCandleReadingGURU_
#PriceAction #MarketStructure #TechnicalAnalysis #Bearish #Bullish #Bitcoin #Crypto #BTCUSD #Forex #NakedChartReader #ZEROindicators #PreciseLevels #ProperTiming #PerfectDirection #ScalpingTrader #IntradayTrader #DayTrader #SwingTrader #PositionalTrader #HighLevelTrader #MambaMentality #GodMode #UltraInstinct #TheeBibleStrategy
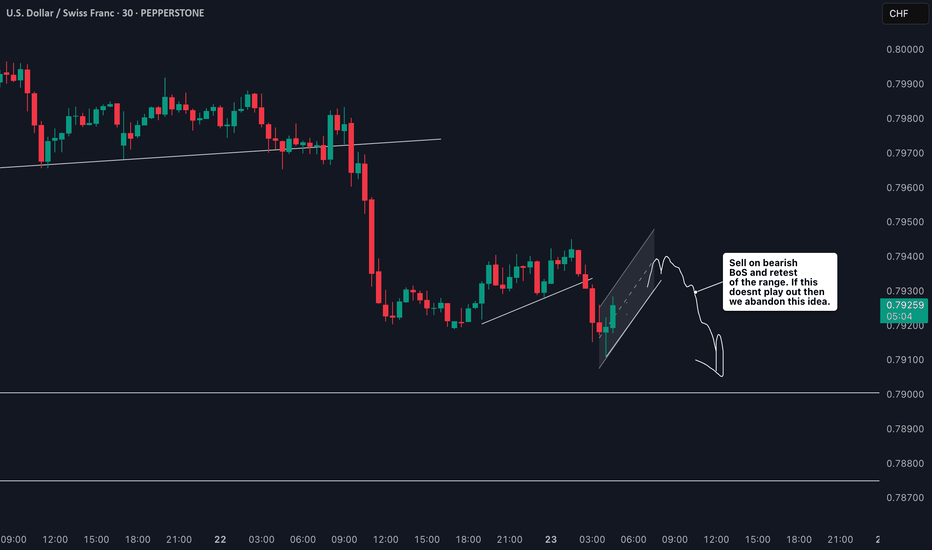
Is USDCHF Ready to Drop? Short Setup Explained📉 USDCHF Trade Idea Breakdown
Taking a close look at USDCHF, we’re currently in a clear downtrend 🔻. Price is under pressure on the higher timeframes, but on the lower timeframes (15m & 30m), we’re seeing a pullback 🌀.
What I’m watching for now is a rejection at resistance 🔄 followed by a bearish break in market structure ⛔️. If that confirms, I’ll be looking to take a short entry with targets set at the two previous lows marked out in the video 🎯📉.
Stop loss placement would be just above the recent swing high for risk management 🛑.
As always — this is not financial advice ⚠️.
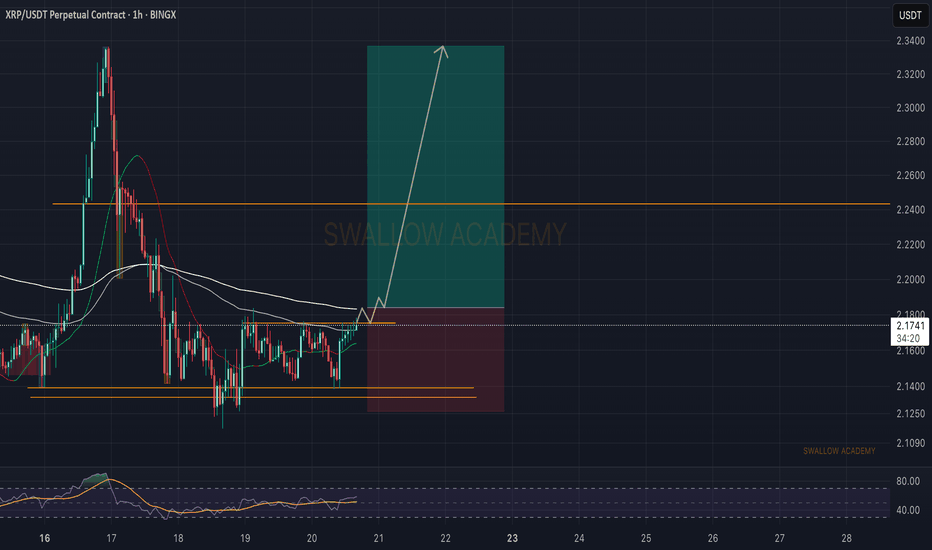
Ripple (XRP): Seeing Smaller Bullish Movement To AccumilateRipple coin has extended itself heavily since november but what we noticed is how close the 200EMA line on the daily timeframe has come to the market price, which is our main point of interest as of now.
More in-depth info is in the video—enjoy!
Swallow Academy
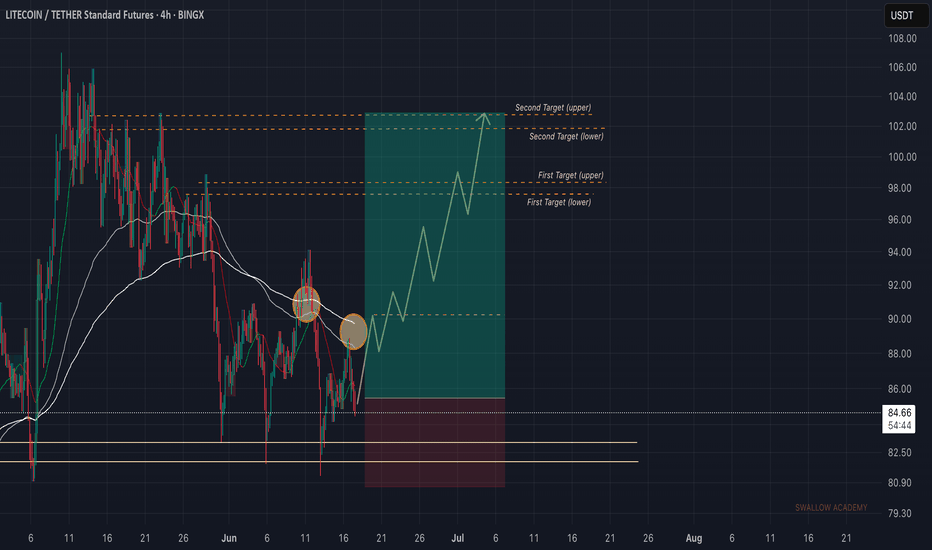
Litecoin (LTC): Looking Bad Now, But Has Good Potential Litecoin is in bad shape, where sellers are showing pressure, which could lead to bigger downward movement.
Despite that, we are still above the local neckline area, so we are still bullish, for now!
More in-depth info is in the video—enjoy!
Swallow Academy
