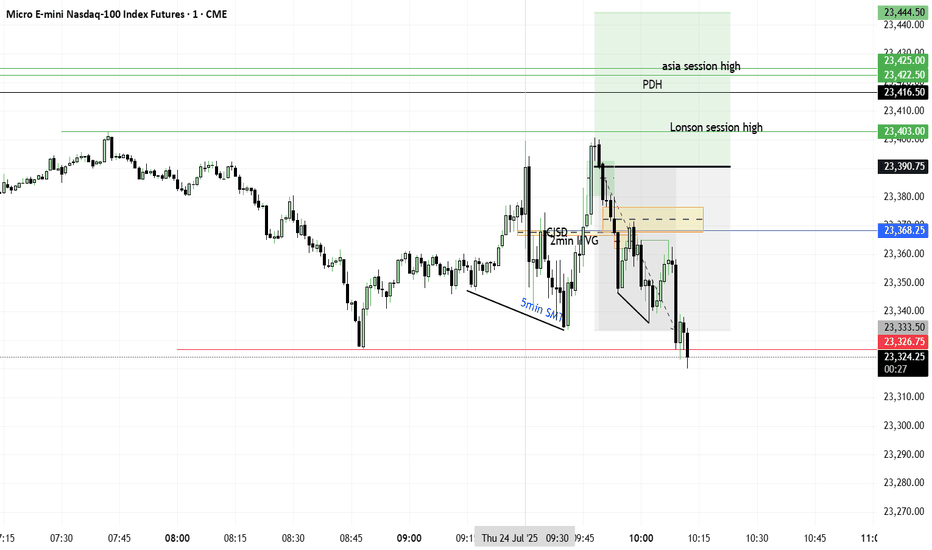
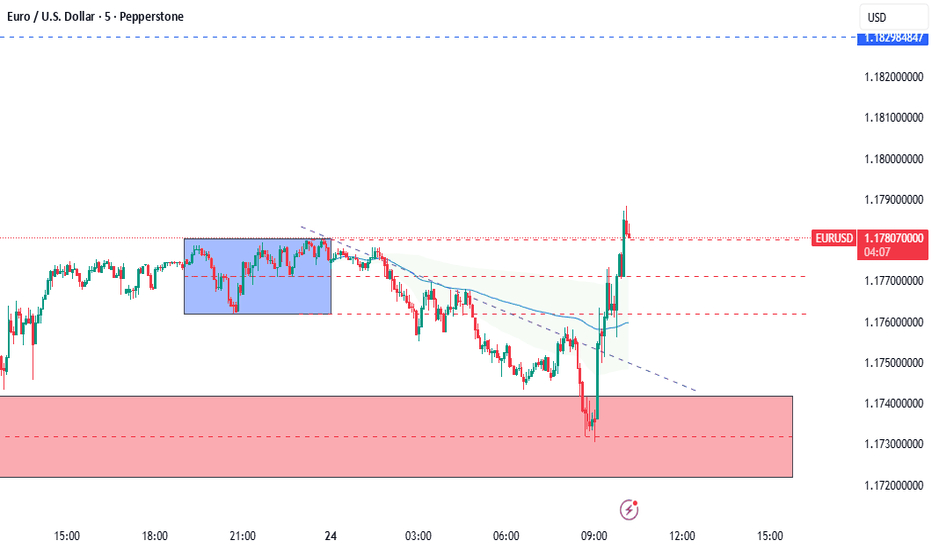
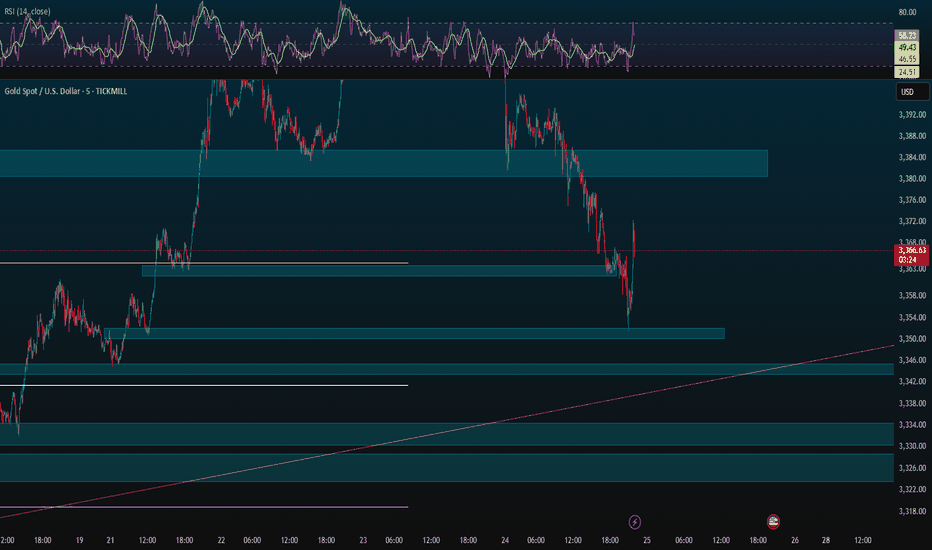
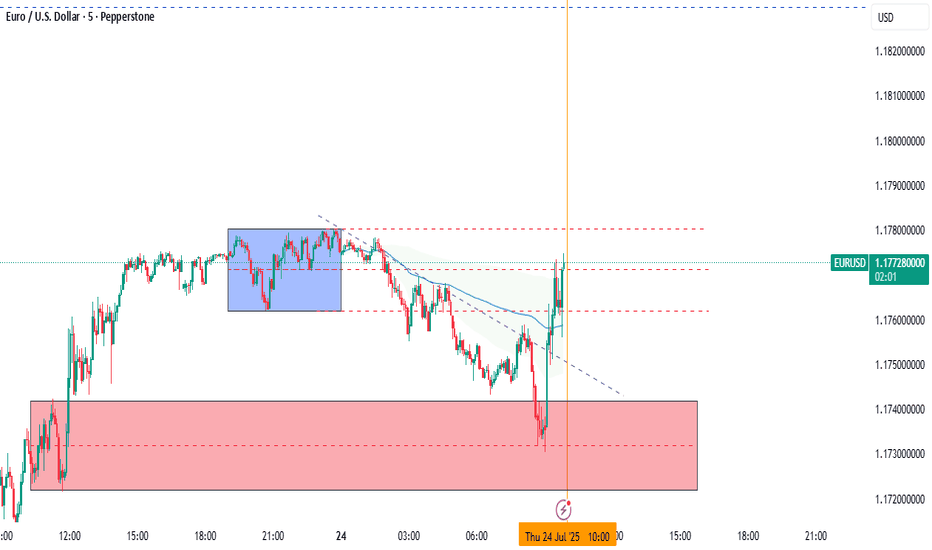
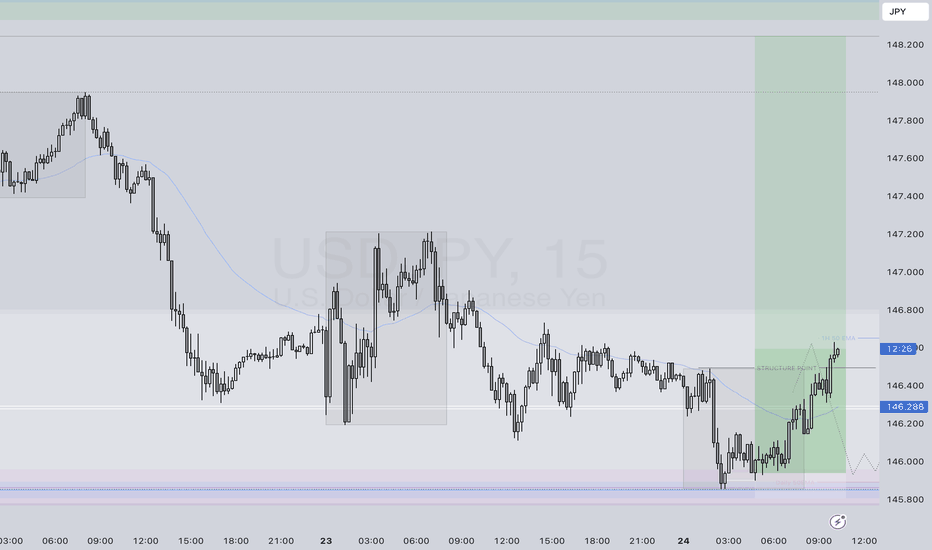
Trading Game of the day 10-MAY-2025The trading plan of the day :-
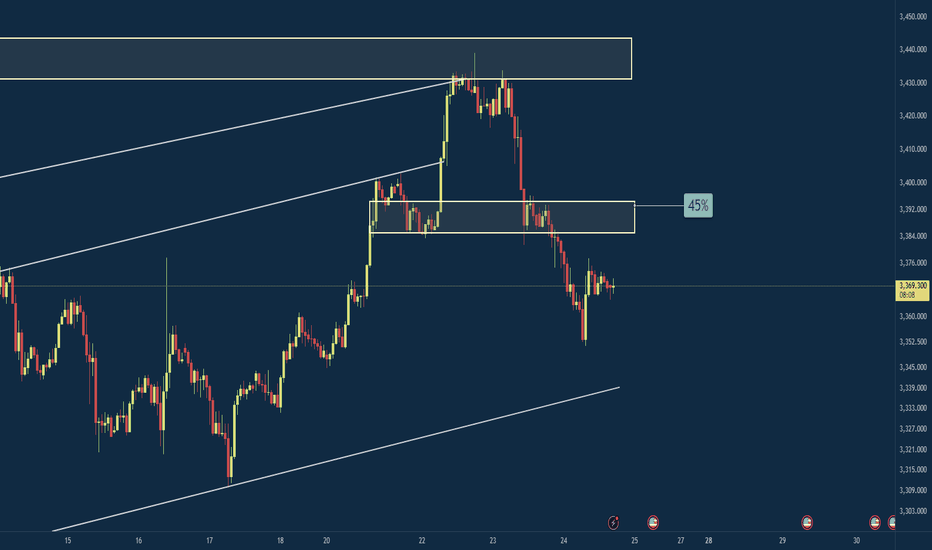
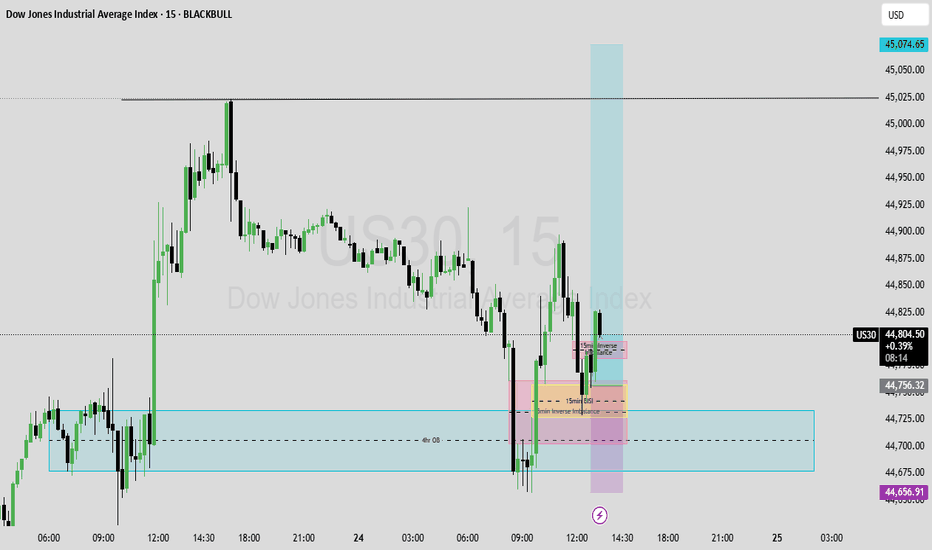
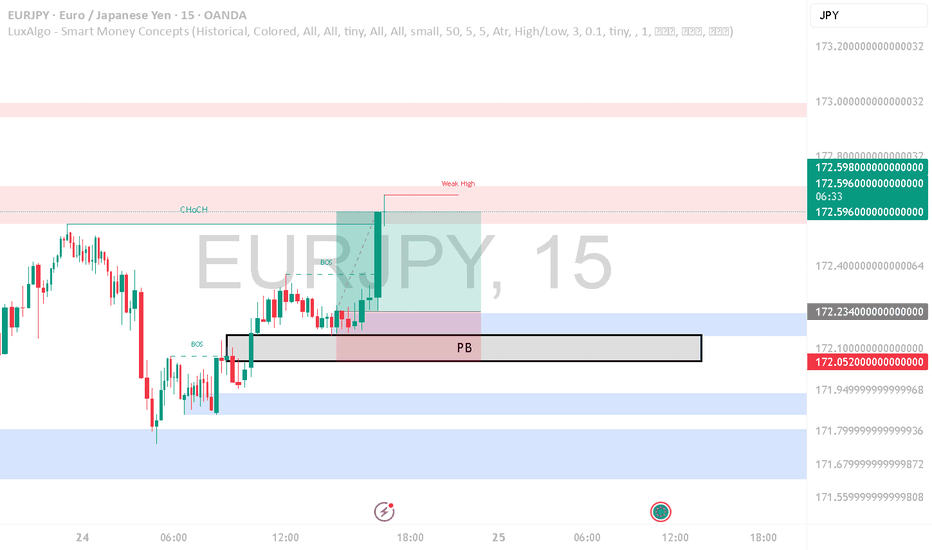
1-the price disrespected the bearish FVG,s
2- formation of Bullish FVGs
3-TS_BB
4-cisd
5-Rejection
6- Reclaimed OB
7-Targeting the swing high
The price was struggling in this area at first but at the end continue to its target swing high
Community ideas
WTI oil has approached a key area of resistanceThe technical picture of WTI oil shows that the commodity is now near one of its key downside resistance lines. Could we get a break, or trendline will remain intact?
Let's dig in!
TVC:USOIL
MARKETSCOM:OIL
Let us know what you think in the comments below.
Thank you.
77.3% of retail investor accounts lose money when trading CFDs with this provider. You should consider whether you understand how CFDs work and whether you can afford to take the high risk of losing your money. Past performance is not necessarily indicative of future results. The value of investments may fall as well as rise and the investor may not get back the amount initially invested. This content is not intended for nor applicable to residents of the UK. Cryptocurrency CFDs and spread bets are restricted in the UK for all retail clients.
ETH/USD Breaking Higher, Can Fill The Gap? Hey traders,
Some of the altcoins are recovering very nicely today, with Ethereum being no exception. In fact, weโve seen a pretty nice consolidation on ETH over the last three weeks, and it looks like itโs breaking to the upside right now. I wouldnโt be surprised to see more gains unfolding into wave five of a five-wave advance away from the April lows.
Targets around 3000 and even 3300 could be quite interesting, especially if we consider the big gap that dates back to February.
GH
Morning market ideasSPX could be finished overnight but the cash session may try to equal the overnight high. Gold is coming up to heavy resistance. Oil Looks to be heading towards 66 and maybe more. BTC looks like it may drop again but right now it's at support. Natural Gas is likely going to drop.
SPY/QQQ Plan Your Trade For 6-10 : POP PatternToday's POP pattern suggests a potential big price move will take place. Given the overnight activity on the ES (rallying higher then rolling over), I suggest today's price move may attempt to retest these overnight highs, then repeat the breakdown phase into the close.
The markets continue to try to melt upward. This trend will continue until the markets decide to break downward.
After the deep low created by the tariff news, the markets continue to try to rally to new highs. It is very likely that Q2 earnings data may push the SPY to new ATH levels before we see any big rotation in price.
The markets have a tendency to move just above recent highs, then stall and revert downward as a pullback. This move may be no different.
The continued stalling of price trying to move higher recently suggests the markets are running into moderate resistance and I believe traders are actively pulling capital away from this rally.
The trend is still BULLISH. Stay cautious of this upward move as a breakdown could happen at any time.
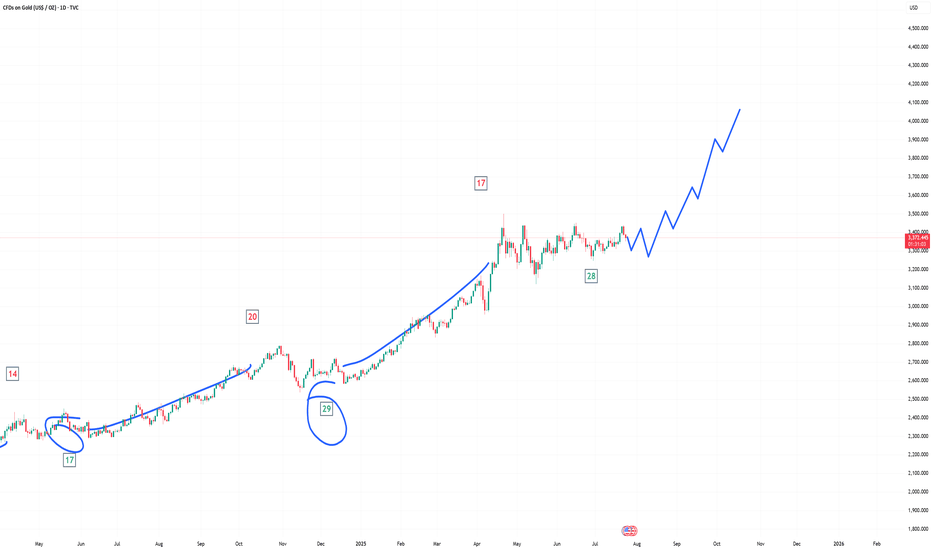
Gold and Silver are moving into an impressive rally phase. Silver and Platinum have moved considerably higher over the past 10+ days. I believe Gold is lagging and will make a big move higher over the next 5 to 10+ days.
Silver is targeting $41-44+. Gold should target $3400 to $3500+ near the same time.
Bitcoin made a huge rally yesterday - reaching my 110,500 upper resistance level. Now, we see if Bitcoin has the momentum to carry higher or if it will fail and rollover into a downtrend.
It seems we are right as a MAKE or BREAK level in the markets. I'm still a believer of MELT UP until it fails.
I continue to watch for technical failure - but I've not seen it happen yet.
Get some.
#trading #research #investing #tradingalgos #tradingsignals #cycles #fibonacci #elliotwave #modelingsystems #stocks #bitcoin #btcusd #cryptos #spy #gold #nq #investing #trading #spytrading #spymarket #tradingmarket #stockmarket #silver
Weekly trading plan for Solana Solana looks weaker against BTC & ETH, but still the price is above PP and we can expect continued growth either now or after a local correction as long as the price is above PP
Write a comment with your coins & hit the like button and I will make an analysis for you
The author's opinion may differ from yours,
Consider your risks.
Wish you successful trades ! mura
UNISWAP - Long Term Buy Opportunity ๐จMartyBoots here , I have been trading for 17 years and sharing my thoughts on UNI here.๐จ
UNI vs ETH | Why Uniswap Deserves a New All-Time High
In this video, we dive deep into the fundamentals of Uniswap (UNI) and explore its close relationship with Ethereum (ETH)โthe blockchain itโs built on. While ETH has regained massive attention with its expanding ecosystem and institutional adoption, UNI is still massively undervalued in comparison, despite powering one of the largest DeFi protocols in the world.
โธป
Fundamentals Breakdown:
โข Uniswap is the backbone of decentralized trading, facilitating billions in volume without intermediaries.
โข Fee switch mechanics and upcoming v4 upgrades have the potential to drive real yield to UNI holders.
โข Unlike ETH, which serves as a Layer 1 gas token, UNI represents governance and future revenue potential over a growing protocol.
โธป
Why UNI Has Upside:
โข UNI still trades far below its all-time highsโeven as Ethereum ecosystem activity rebounds.
โข ETH has already made major recovery moves, but UNI hasnโt caught up yetโcreating a bullish divergence.
โข With the rise of on-chain liquidity, tokenized real-world assets, and institutional DeFi, Uniswap is positioned to be a key infrastructure layer.
โธป
My Thesis:
โข ETH = Base Layer | UNI = DeFi Rail
โข As ETH grows, Uniswap scales alongside itโcapturing more swap volume, TVL, and governance power.
โข If Uniswap activates protocol revenue, UNI transitions from a governance token to a yield-bearing asset, giving it real valuation metrics and long-term investor interest.
โธป
Watch to see my full breakdown, including:
โข UNI vs ETH price chart comparison
โข On-chain stats, dominance shifts, and upcoming catalysts
โข Why I believe UNI is set for a breakout back toward new all-time highs
โธป
Like, comment, and follow for more deep-dive crypto breakdowns and technical setups.
#Uniswap #UNI #Ethereum #ETH #CryptoAnalysis #DeFi #TradingView #AltcoinSeason #PineScript #FundamentalAnalysis
Weekly trading plan for EthereumEthereum continues its growth and has already updated the local top at $2,791. Above the current price is an important resistance zone and after its breakdown it will be possible to see the price above 3k
Write a comment with your coins & hit the like button and I will make an analysis for you
The author's opinion may differ from yours,
Consider your risks.
Wish you successful trades ! mura
USDJPY Analysis Today: Technical and Order Flow !In this video I will be sharing my USDJPY analysis today, by providing my complete technical and order flow analysis, so you can watch it to possibly improve your forex trading skillset. The video is structured in 3 parts, first I will be performing my complete technical analysis, then I will be moving to the COT data analysis, so how the big payers in market are moving their orders, and to do this I will be using my customized proprietary software and then I will be putting together these two different types of analysis.
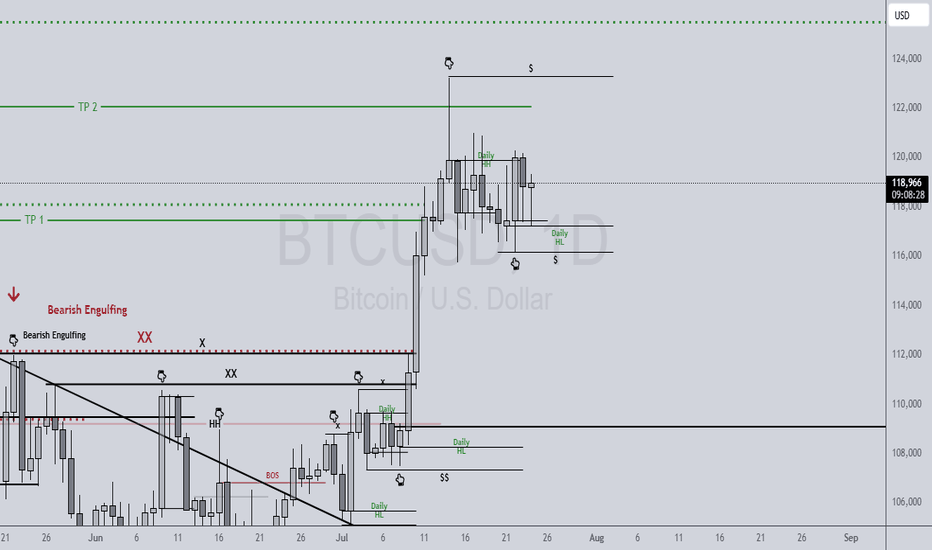
Weekly trading plan for BitcoinAt the moment we see a very positive growth, after a rapid fall. The price has already got a reaction from the resistance zone formed on the chart and is now in a local correction. We can expect an ATH update, but the local correction may last a few days. Also noted an important level and in case of its breakdown there are more chances for a decline
Write a comment with your coins & hit the like button and I will make an analysis for you
The author's opinion may differ from yours,
Consider your risks.
Wish you successful trades ! mura
XAUUSD Analysis todayHello traders, this is a complete multiple timeframe analysis of this pair. We see could find significant trading opportunities as per analysis upon price action confirmation we may take this trade. Smash the like button if you find value in this analysis and drop a comment if you have any questions or let me know which pair to cover in my next analysis.
EURUSD | Clean Price Flow Recap Target Hit with ARX StructureQuick breakdown of the recent EURUSD move we analyzed structure held, and price followed through to target.
This video reviews how the setup formed, the confluences behind the entry, and why patience paid off.
๐ฏ For educational purposes only.
GOLD Relationship Between Gold, Dollar (DXY), Bond Prices, and 10-Year Bond Yields
1. Gold and the Dollar (DXY)
Gold is priced in U.S. dollars, so there is a strong inverse relationship between gold prices and the dollar index (DXY).
When the DXY strengthens, gold becomes more expensive for holders of other currencies, reducing demand and pushing gold prices down.
Recently, gold prices dipped about 0.4% to around $3,294/oz as the DXY shed 0.3%, reflecting a cautious market awaiting U.S.-China trade talks and reacting to stronger U.S. jobs data that tempered expectations of Fed rate cuts.
2. Gold and 10-Year Bond Yields
The 10-year U.S. Treasury yield and gold generally have an inverse relationship. Rising yields increase the opportunity cost of holding non-yielding gold, making bonds more attractive.
However, both gold and bond yields can rise simultaneously during inflationary periods or economic uncertainty, reflecting inflation expectations and safe-haven demand.
Recent data shows yields near 4.5%, with gold holding elevated levels above $3,300 and attempted 3328 before dropping due to inflation concerns and geopolitical risks, despite some downward pressure from rising yields.
3. Gold and Bond Prices
Bond prices move inversely to yields; when yields rise, bond prices fall.
Falling bond prices (rising yields) often signal inflation or risk concerns, which can boost gold as an inflation hedge.
Yet, rising yields also raise the opportunity cost of holding gold, which can cap goldโs upside. This dynamic explains why the correlation between gold and bond yields has weakened recently, sometimes showing near-zero correlation .
4. Macro and Market Drivers
Inflation and Safe-Haven Demand: Persistent inflation and geopolitical tensions (e.g., U.S.-China trade talks) support gold demand despite dollar strength and rising yields.
Central Bank Buying: Central banks remain significant gold buyers, underpinning long-term price support.
Economic Data and Fed Policy: Strong U.S. jobs reports reduce expectations of Fed rate cuts, pushing yields up and dollar strength, which can pressure gold short term.
Conclusion
Gold prices in June 2025 are influenced by a complex interplay of factors: a slightly weaker dollar recently has supported gold, but rising 10-year Treasury yields and falling bond prices exert downward pressure. Inflation concerns and geopolitical risks continue to underpin goldโs appeal as a safe haven and inflation hedge. The usual inverse relationship between gold and bond yields has weakened recently, reflecting evolving market dynamics and the balance between inflation expectations and real yields.
#gold #dollar
Usd/Jpy intra-day Analysis 10-Jun-25Sharing the possible scenarios we could have on Usd/Jpy.
Keeping in mind that the Volume is still slow since start of the week, and investors are waiting for the next set of important economic data which is starting tomorrow with the US CPI (inflation number).
Disclaimer: easyMarkets Account on TradingView allows you to combine easyMarkets industry leading conditions, regulated trading and tight fixed spreads with TradingView's powerful social network for traders, advanced charting and analytics. Access no slippage on limit orders, tight fixed spreads, negative balance protection, no hidden fees or commission, and seamless integration.
Any opinions, news, research, analyses, prices, other information, or links to third-party sites contained on this website are provided on an "as-is" basis, are intended only to be informative, is not an advice nor a recommendation, nor research, or a record of our trading prices, or an offer of, or solicitation for a transaction in any financial instrument and thus should not be treated as such. The information provided does not involve any specific investment objectives, financial situation and needs of any specific person who may receive it. Please be aware, that past performance is not a reliable indicator of future performance and/or results. Past Performance or Forward-looking scenarios based upon the reasonable beliefs of the third-party provider are not a guarantee of future performance. Actual results may differ materially from those anticipated in forward-looking or past performance statements. easyMarkets makes no representation or warranty and assumes no liability as to the accuracy or completeness of the information provided, nor any loss arising from any investment based on a recommendation, forecast or any information supplied by any third-par ty.
Bitcoin Rally Overextended: Patience is Key for the Next Move๐น BTC/USDC โ Bullish Outlook, heres my Trade Plan.
Bitcoin (BTC/USDC) is currently maintaining a strong bullish trajectory ๐, showing impressive momentum after breaking through recent resistance levels ๐.
However, price is now overextended from the last swing low, and Iโm anticipating a pullback into value ๐ โ specifically targeting the 50%โ61.8% Fibonacci retracement zone drawn from the latest swing low to swing high ๐. This zone often acts as a rebalancing point for institutional traders and provides confluence for smart entries ๐ฏ.
Iโll be closely watching this retracement area for signs of support forming, and more importantly, a bullish break in market structure ๐ง ๐. Only after that confirmation, would I consider executing a long position โ no structure break, no trade โ
.
This isnโt about predicting โ itโs about reacting with discipline.
GOLD Relationship Between Gold, Dollar (DXY), Bond Prices, and 10-Year Bond Yields
1. Gold and the Dollar (DXY)
Gold is priced in U.S. dollars, so there is a strong inverse relationship between gold prices and the dollar index (DXY).
When the DXY strengthens, gold becomes more expensive for holders of other currencies, reducing demand and pushing gold prices down.
Recently, gold prices dipped about 0.4% to around $3,294/oz as the DXY shed 0.3%, reflecting a cautious market awaiting U.S.-China trade talks and reacting to stronger U.S. jobs data that tempered expectations of Fed rate cuts.
2. Gold and 10-Year Bond Yields
The 10-year U.S. Treasury yield and gold generally have an inverse relationship. Rising yields increase the opportunity cost of holding non-yielding gold, making bonds more attractive.
However, both gold and bond yields can rise simultaneously during inflationary periods or economic uncertainty, reflecting inflation expectations and safe-haven demand.
Recent data shows yields near 4.5%, with gold holding elevated levels above $3,300 and attempted 3328 before dropping due to inflation concerns and geopolitical risks, despite some downward pressure from rising yields.
3. Gold and Bond Prices
Bond prices move inversely to yields; when yields rise, bond prices fall.
Falling bond prices (rising yields) often signal inflation or risk concerns, which can boost gold as an inflation hedge.
Yet, rising yields also raise the opportunity cost of holding gold, which can cap goldโs upside. This dynamic explains why the correlation between gold and bond yields has weakened recently, sometimes showing near-zero correlation .
4. Macro and Market Drivers
Inflation and Safe-Haven Demand: Persistent inflation and geopolitical tensions (e.g., U.S.-China trade talks) support gold demand despite dollar strength and rising yields.
Central Bank Buying: Central banks remain significant gold buyers, underpinning long-term price support.
Economic Data and Fed Policy: Strong U.S. jobs reports reduce expectations of Fed rate cuts, pushing yields up and dollar strength, which can pressure gold short term.
Conclusion
Gold prices in June 2025 are influenced by a complex interplay of factors: a slightly weaker dollar recently has supported gold, but rising 10-year Treasury yields and falling bond prices exert downward pressure. Inflation concerns and geopolitical risks continue to underpin goldโs appeal as a safe haven and inflation hedge. The usual inverse relationship between gold and bond yields has weakened recently, reflecting evolving market dynamics and the balance between inflation expectations and real yields.
#gold #dollar
AUD/JPY Short, EUR/JPY Short, GBP/JPY Short and USD/CHF ShortAUD/JPY Short
Minimum entry requirements:
- 1H impulse down below area of value.
- If tight non-structured 5 min continuation follows, reduced risk entry on the break of it.
- If tight structured 5 min continuation follows, reduced risk entry on the break of it or 5 min risk entry within it.
- If tight non-structured 15 min continuation follows, 5 min risk entry within it if the continuation is structured on the 5 min chart or reduced risk entry on the break of it.
- If tight structured 15 min continuation follows, reduced risk entry on the break of it or 15 min risk entry within it.
EUR/JPY Short
Minimum entry requirements:
- If structured 1H continuation forms, 1H risk entry within it.
GBP/JPY Short
Minimum entry requirements:
- If tight non-structured 1H continuation forms, 15 min risk entry within it if the continuation is structured on the 15 min chart.
- If tight structured 1H continuation forms, 1H risk entry within it.
USD/CHF Short
Minimum entry requirements:
- Corrective tap into area of value.
- 4H risk entry or 1H risk entry after 2 x 1H rejection candles.
Minimum entry requirements:
- Tap into area of value.
- 1H impulse down below area of value.
- If tight non-structured 5 min continuation follows, reduced risk entry on the break of it.
- If tight structured 5 min continuation follows, reduced risk entry on the break of it or 5 min risk entry within it.
- If tight non-structured 15 min continuation follows, 5 min risk entry within it if the continuation is structured on the 5 min chart or reduced risk entry on the break of it.
- If tight structured 15 min continuation follows, reduced risk entry on the break of it or 15 min risk entry within it.
Bitcoin Approaches Resistance as Momentum Cools: Whatโs Next?Bitcoin has been on a strong upward trend ๐, but recent moves show signs of exhaustion as it approaches major resistance zones ๐. The appearance of a three-drive pattern on the 4-hour chart, suggests the market could be due for a healthy correction ๐. While the broader trend remains bullish, I'm watching for a potential pullback and then looking for renewed strength (bullish BoS) before considering new long positions. Patience and confirmation are key in these conditions! ๐โจ
USOIL Trade Setup: Watching for a Bullish Break After Pullback ๐ US OIL Trade Plan
Currently, USOIL is in a strong bullish trend ๐ฅ โ price action has pushed into overextended territory, which opens the door for a potential pullback ๐.
I'm watching for a WTI retracement into equilibrium, ideally aligning with the 50%โ61.8% Fibonacci levels from the previous swing low to high ๐๐. If price corrects into that zone and we find support, followed by a bullish break in market structure ๐ฅ โ that would be the confirmation Iโm waiting for to consider a long position ๐.
โ ๏ธ Key Level to Watch: That structure break is the trigger โ no confirmation, no trade ๐ง .
โ ๏ธ Disclaimer:
This content is for educational and informational purposes only and should not be considered financial advice. Always conduct your own analysis and consult a professional before making trading decisions. Trade responsibly.