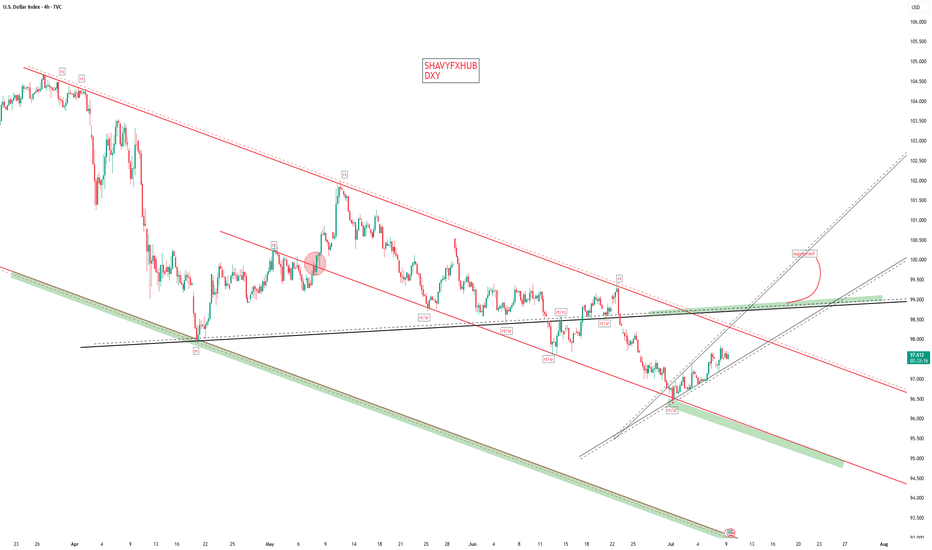
DXY DOLLAR INDEX The DXY has declined from its current high 114.54 to 96.59 reflecting a weaker dollar against a basket of major currencies including the euro, yen, pound, Canadian dollar, Swedish krona, and Swiss franc.
Despite this decline, the dollar remains supported by strong US economic growth and higher US 10-year bond yields, which have widened the yield gap with other developed economies .
The Federal Reserve’s monetary policy has been relatively hawkish, with fewer rate cuts priced in compared to other central banks, helping to underpin the dollar.
Trade tensions and tariff uncertainties continue to create volatility, but the dollar benefits from safe-haven demand amid global uncertainties
Composition of the DXY Basket:
Euro (EUR): 57.6%
Japanese Yen (JPY): 13.6%
British Pound (GBP): 11.9%
Canadian Dollar (CAD): 9.1%
Swedish Krona (SEK): 4.2%
Swiss Franc (CHF): 3.6%
context
Drivers: US economic strength, Fed policy, bond yield differentials, trade tensions, and safe-haven flows keeping dollar on support hold.
Ongoing US tariff announcements and trade policy changes have contributed to volatility and risk aversion, pressuring the dollar lower.
US Economic Policy the Market is concerned about fiscal policy, Federal Reserve independence, and rising US debt which have led to reduced demand for US assets, further weighing on the dollar.
Interest Rate Differential:
The US Fed funds rate remains at 4.50%-4.25%, but with global central banks adjusting policy, the relative appeal of the dollar has diminished.
Conversely, a sustained move above 98.00 could signal a reversal and renewed dollar strength.
hope we can get back to 100 aagin.
#dollar
Community ideas
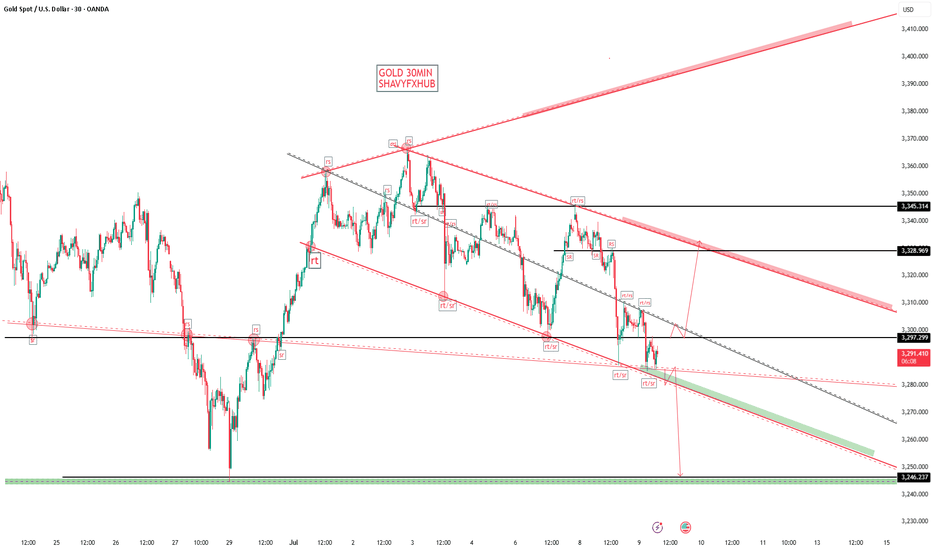
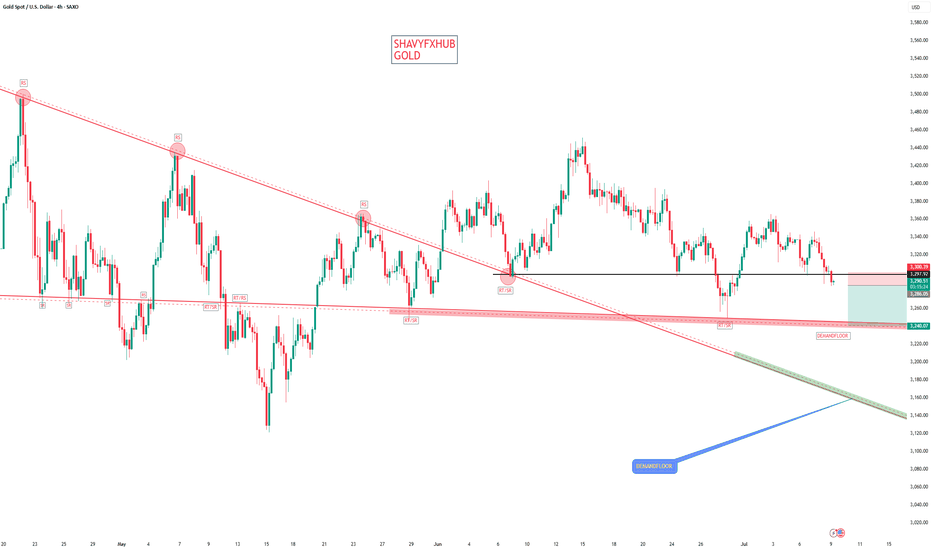
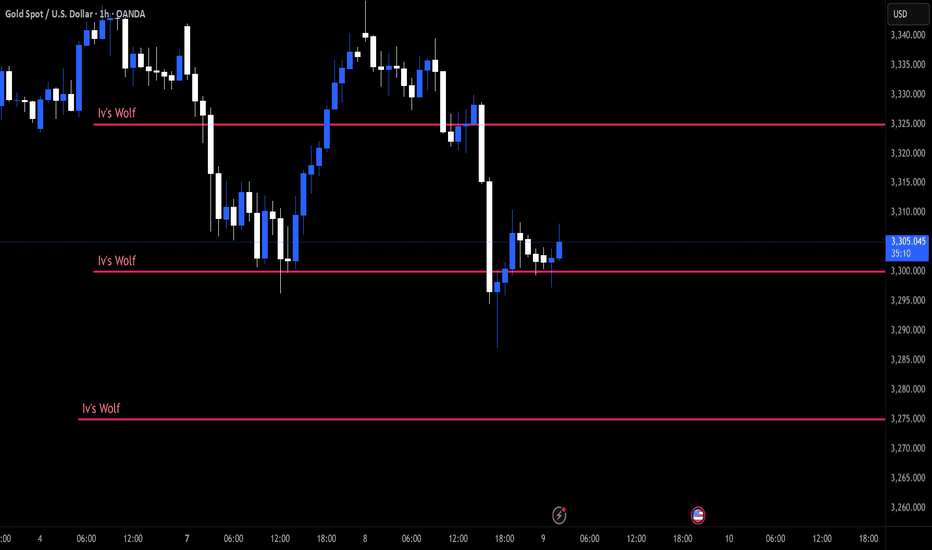
GOLD GOLD ,your checklist should always include the following
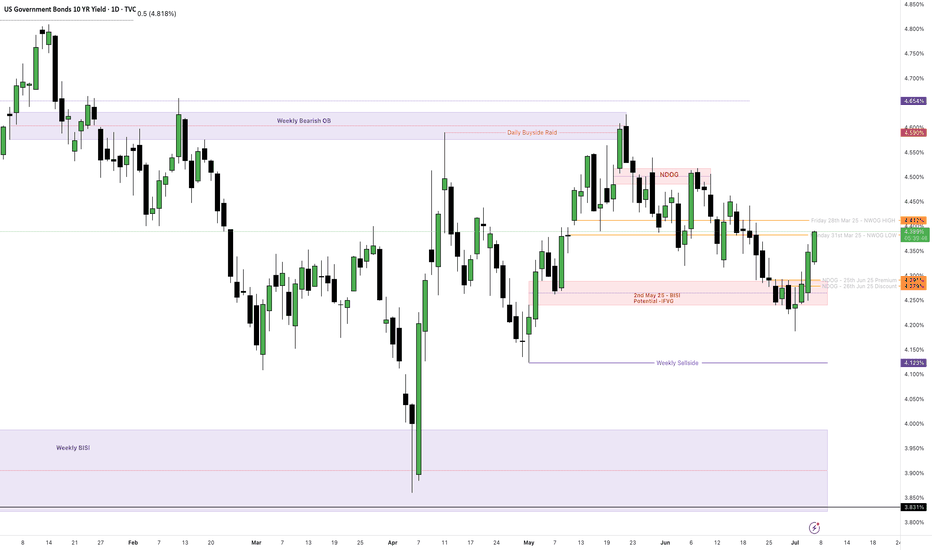
what is the current high and low of the US10Y ???
what is the current interest rate decision
what is the current HTF AND LTF of dollar index
what is the phase of the price action(demand or supply).eg if price action is in demand phase and you try to sell it ,your stop loss will be taken, if you trade in the direction and phase of price action ,you dont need a big stoploss.
trading is 100% probability and any key level can fail.
risk management is key .
#gold
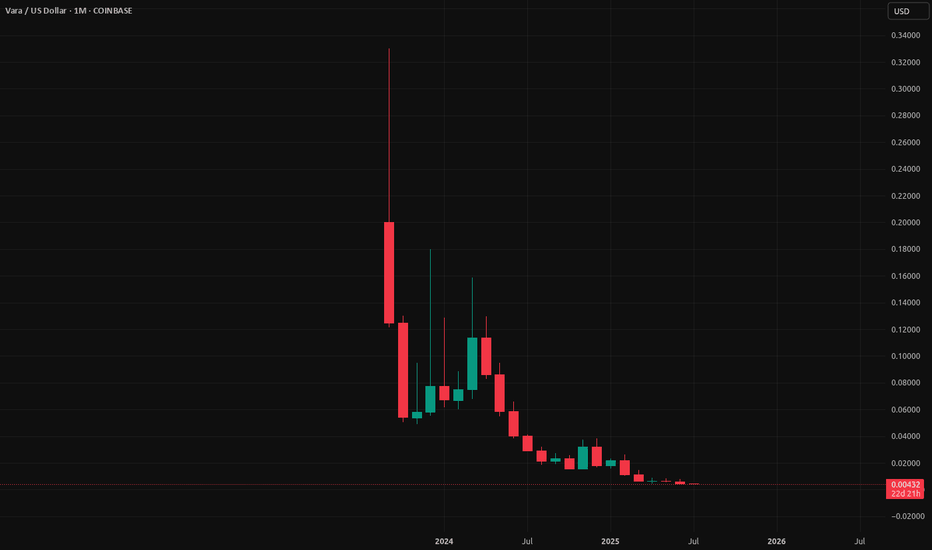
$VARA Network and others LIVE ORDER FLOW! Today I go over levels for the next possible trade and set low target for the next long entry if support here fails. Staking rates remain high however I think now is a great time to start unstaking to prepare for the next swing out and swing in. Staking will be there after the next trade.
VARA NETWORK, POLYGON, BITCOIN, SILVER, CARTESI, MATIC
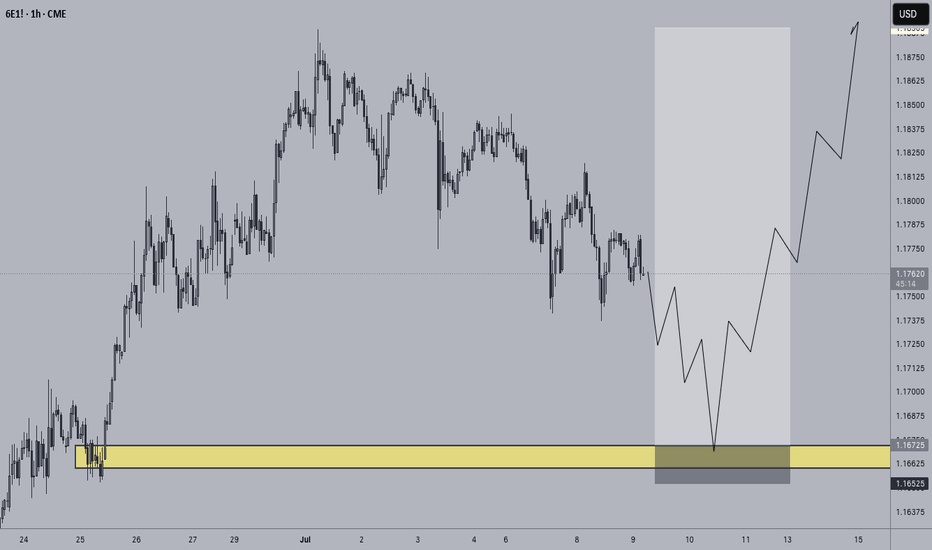
Sell the EURO vs USD?Welcome back to the Mid-Week Analysis for Wed, July 8th.
In this video, we will analyze the following FX markets:
EURO and USD Index.
The USD is seeing some strength off the tariffs Trump is declaring... and extending the grace period again on. This dragging down the EURO a bit, as it is printing bearish candles for Mond and Tues.
Will Wed print another bearish candle? Are we heading for a full retracement in the EURUSD?
This could be the scenario forming that I eluded to in my Weekly Forecast video: Buy The Dips and Sell The Rips.
Enjoy!
May profits be upon you.
Leave any questions or comments in the comment section.
I appreciate any feedback from my viewers!
Like and/or subscribe if you want more accurate analysis.
Thank you so much!
Disclaimer:
I do not provide personal investment advice and I am not a qualified licensed investment advisor.
All information found here, including any ideas, opinions, views, predictions, forecasts, commentaries, suggestions, expressed or implied herein, are for informational, entertainment or educational purposes only and should not be construed as personal investment advice. While the information provided is believed to be accurate, it may include errors or inaccuracies.
I will not and cannot be held liable for any actions you take as a result of anything you read here.
Conduct your own due diligence, or consult a licensed financial advisor or broker before making any and all investment decisions. Any investments, trades, speculations, or decisions made on the basis of any information found on this channel, expressed or implied herein, are committed at your own risk, financial or otherwise.
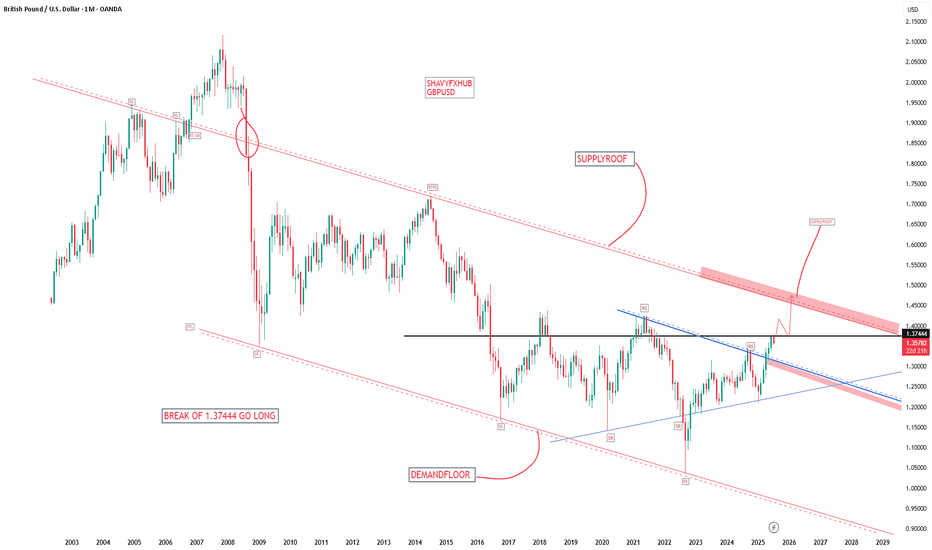
GBPUSD Bank of England (BoE) Bank Rate
Current Rate: 4.25% ,the 10 year bond yield GB10Y =4.632%
The BoE reduced its base rate from 4.50% to 4.25% in May 2025 and has maintained it at 4.25% since then (including the June 19, 2025 meeting).
The Monetary Policy Committee (MPC) has signaled a likely gradual easing path with expectations of a 25 basis point cut possibly at the August 7, 2025 meeting, potentially bringing the rate down to around 4.00%.
The BoE’s decision reflects easing inflation pressures as inflation stands at 3.4% but remains cautious due to ongoing economic uncertainties and inflation still above target.
Federal Reserve (Fed) Funds Rate
Current Rate: Approximately 4.50%-4.25% (mid-2025 consensus)
The united state 10 year government bond yield US10Y=4.407%
The Fed has held rates steady at around 4.50% -4.25%, with markets expecting a cautious approach to rate cuts amid inflation concerns and economic data.
The Fed’s policy remains more restrictive compared to the BoE, though some easing is anticipated later in 2025 depending on inflation and growth.
Context
bond yield differential
GB10Y-US10Y=4.632%-4.407%= 0.225% advantage for carry traders in favour GBP.
Interest rate differential
GBP IRT-USD IRT= 4.25%-4.5%=-0.25% ,The Fed rate is about 0.25 percentage points higher than the BoE rate, giving a slight interest rate advantage to the USD over GBP at the short-term policy rate level.
Carry Trade Impact
The carry trade involves borrowing in a currency with a lower interest rate and investing in a currency with a higher rate to earn the spread.
Despite the Fed’s slightly higher policy rate, the BoE’s historically higher rates earlier in 2025 and expectations of a slower pace of Fed cuts have supported GBP carry trades.
The interest rate differential is relatively narrow, so carry trade flows are moderate but still contribute to demand for GBP assets.
The bond yield differential slightly favors GBP at 4.632% gb10y as against USD 4.407% , attracting fixed-income capital to uk treasury giving gbp short term advantage.
#GBPUSD
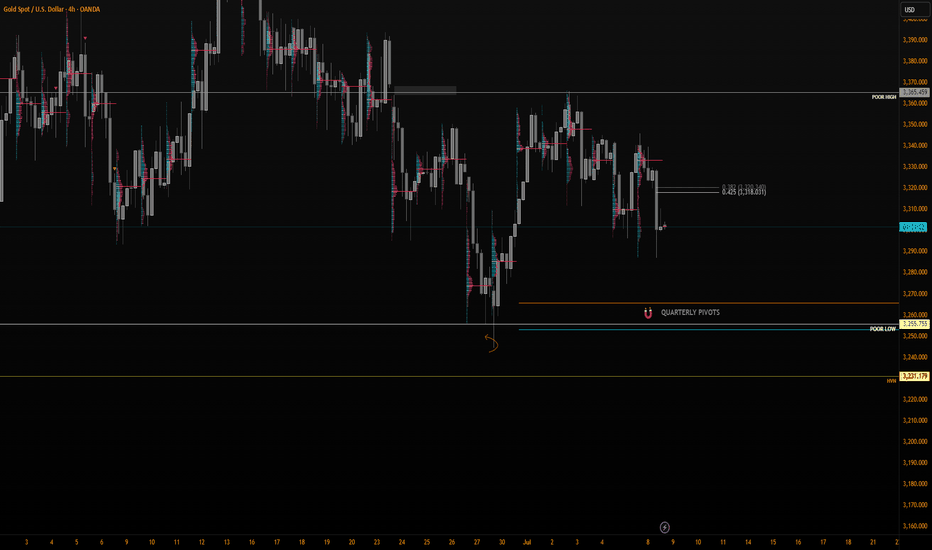
Gold Setup for longs and shorts This video covers gold on the local range whereby I expect price to eventually complete the move to the downside and clear the equal lows from MAy and June as well as take care of the poor lows and fill Quart Pivots .
I talk also about the Tradingview session volume profile chart and how this feature can really be a simple yet powerful guide for taking scalp trades off of specific levels and I show a couple of examples of the respect PA has for hitting those daily POC .
I Welcome any questions you may have
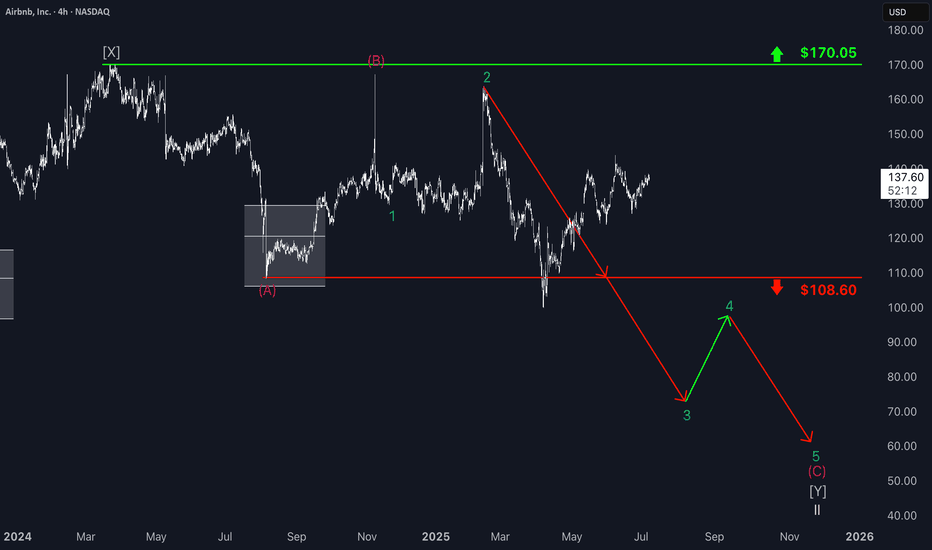
Airbnb: Downtrend Set to Resume SoonSince our last update, Airbnb has experienced a rebound, which diverted the stock from the anticipated sell-off. However, the price is expected to soon resume its downward trajectory and, as the next key step, break through support at $108.60. This move should complete turquoise wave 3, with all subsequent waves of this downward impulse likely to unfold below this level. Ultimately, the stock is expected to finish the broader correction of the beige wave II.
📈 Over 190 precise analyses, clear entry points, and defined Target Zones - that's what we do.
Market Outlook (7/5/2025).Insights on DXY, BTC,SPX,NAS100 & GOLDThis week's chart analysis dives into essential technical patterns and indicators, revealing the behavior and direction of the Dollar Index, Bitcoin, SPX500, NAS100 Indices, and GOLD for the upcoming week! It showcases price trends, support and resistance levels, candlestick formations, and moving averages to pinpoint potential targets. My aim is to decode market sentiment and forecast exciting price movements based on historical data and technical signals. I hope you find immense value in my analysis to empower your trade and investment decisions. Cheers!
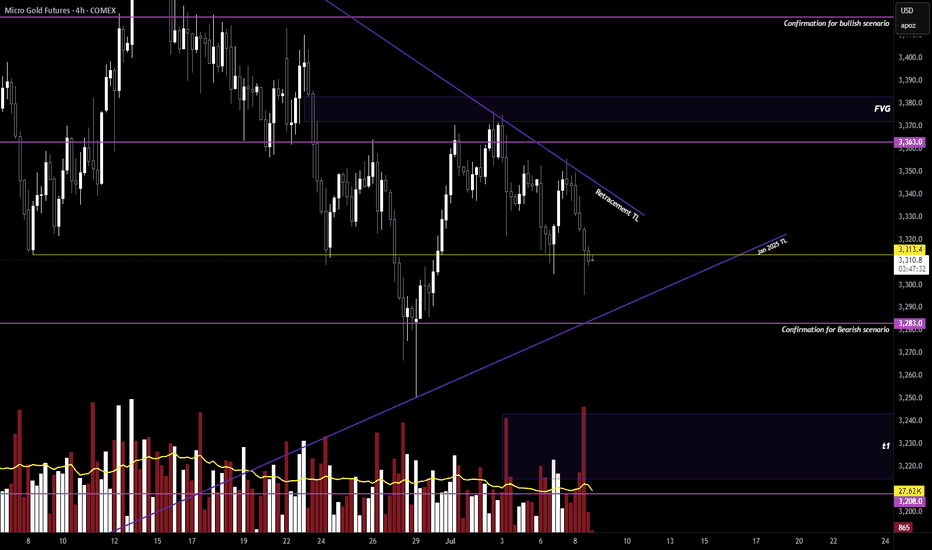
$GC / Gold Update - The Bears Strike BackHello fellow gamblers,
I'm making this video to tell you all that nothing has changed!
Both scenarios are still at play and in this video I explain why I'm playing safe.
I might have mentioned in the video some of the trendlines, but at this time, it is best to play off the key levels for any confirmation.
- Levels to watch: 3418, 3363, 3283, 3208
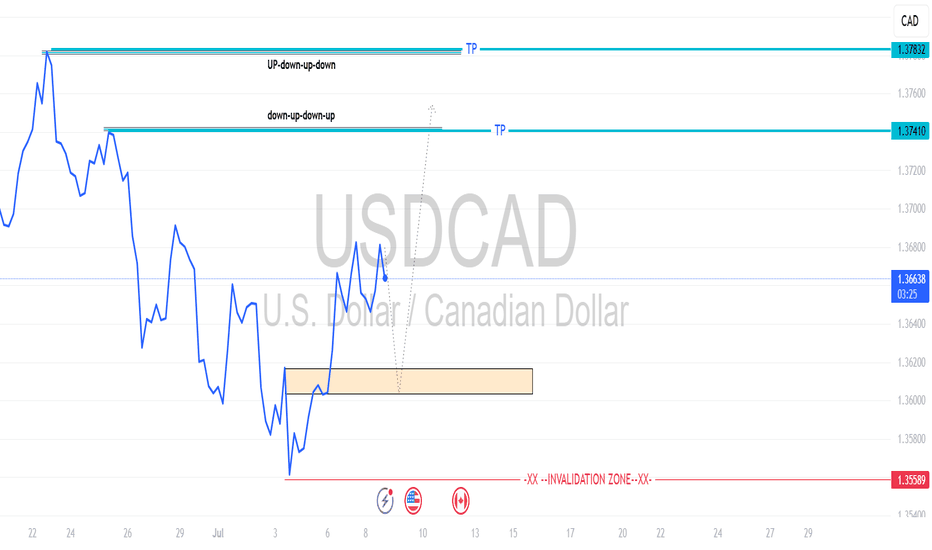
Why I’m Bullish on USD/CAD This Week | Forex Market OutlookIn this video, I break down a potential bullish setup on USD/CAD based purely on technical analysis using support and resistance zones on the 4H and Daily timeframes.
Key Highlights:
Strong price bounce off major support zone
Former resistance flipping into support
Bullish market structure with higher lows forming
My price target: 1.37400
Invalidation zone: 1.35334
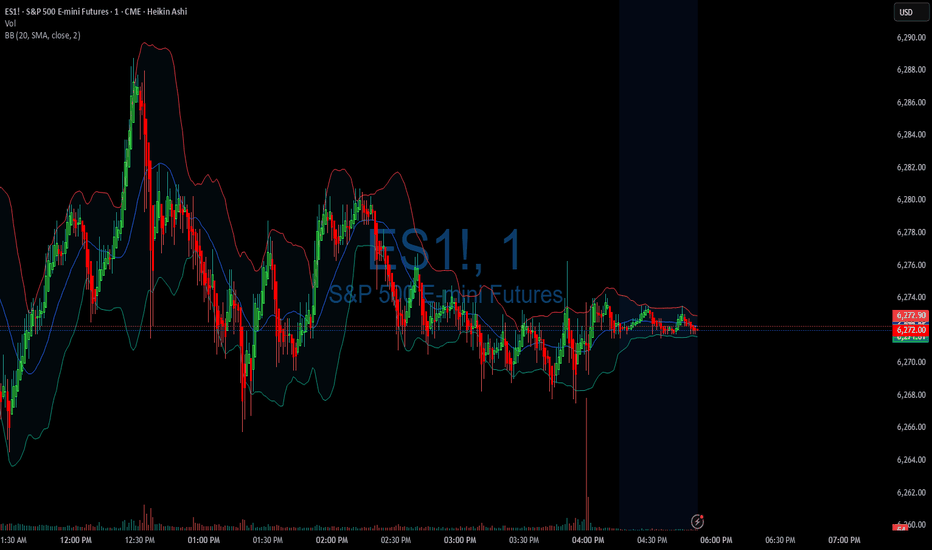
07/08/25 Trade Journal, and ES_F Stock Market analysis EOD accountability report: +220
Sleep: 7 hours
Overall health: Good
VX Algo System Signals from (9:30am to 2pm) 4/4 success
— 9:30 AM Market Structure flipped bullish on VX Algo X3! :check:
— 10:30 AM VXAlgo NQ X1 Buy Signal :check:
— 12:24 PM Market Structure flipped bullish on VX Algo X3! :check:
— 1:30 PM Market Structure flipped bearish on VX Algo X3! :check:
What’s are some news or takeaway from today? and What major news or event impacted the market today?
After taking losses, I usually set a lock out on my account after $200 profit to build back small wins and confidence. so luckily I was locked out pretty early today and avoided most of the market whipsaw. But on days like these, if you don't walk away after you make money, you could eventually get triggered and tilted by the whipsaw. a lot of orb traders probably died today.
News
*HOWARD LUTNICK ON TARIFFS: EXPECT ANOTHER 15-20 LETTERS TO GO OUT OVER THE NEXT 2 DAYS- CNB
*Trump announces 50% tariff on copper imports, threatens 200% tariff on pharmaceuticals and maybe chips
What are the critical support levels to watch?
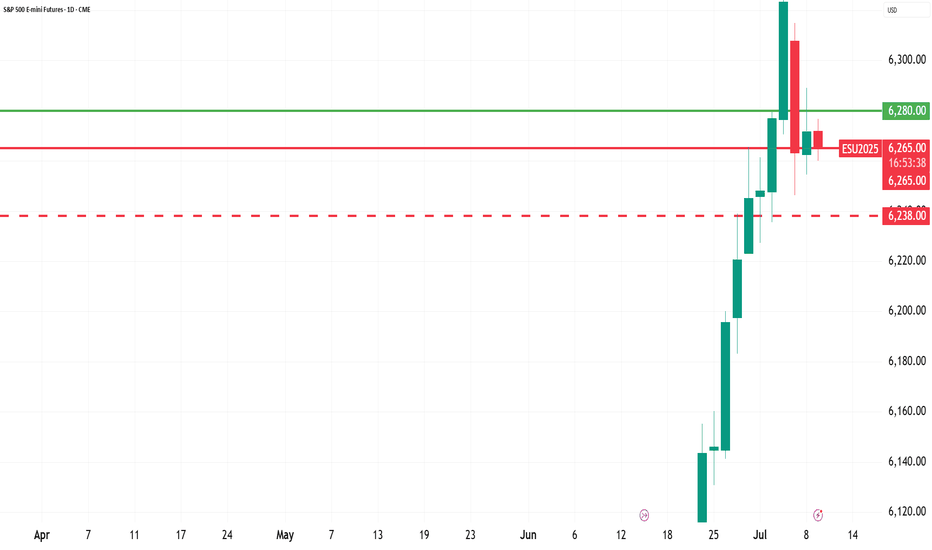
--> Above 6280= Bullish, Under 6260= Bearish
Video Recaps -->https://tradingview.sweetlogin.com/u/WallSt007/#published-charts
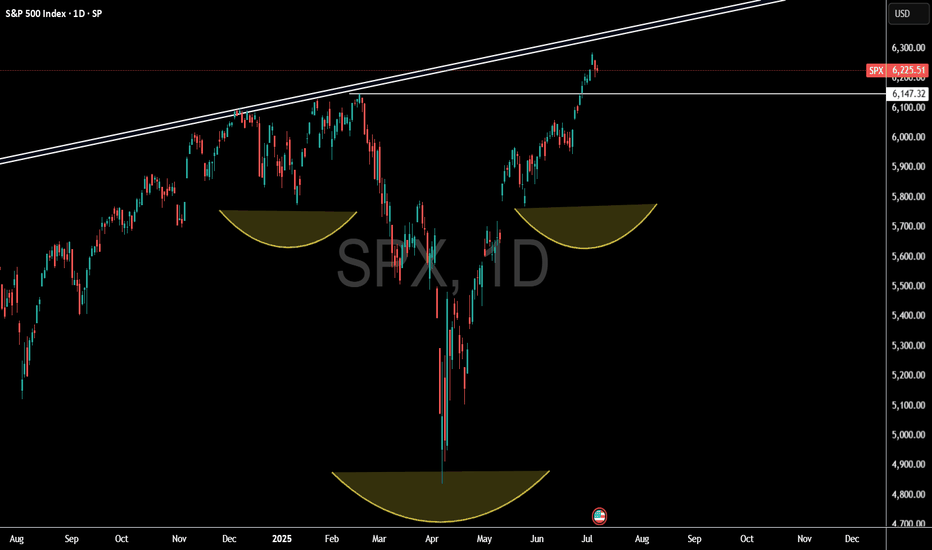
SPX - Are you catching the rotation trends? SPX is still holding very bullish price action. Technicals are pointing towards higher price and todays inside consolidation day certainly helps digest recent gains.
Along with the flat indices market session, we did observe some massive capital rotation trends.
Financials saw a pretty strong down move across the board. JPM / BAC / C all saw large outflows. We were positioned on the short side of financials and took profits on JPM puts.
Even with the big selloff in financials, SPX held up surprisingly well.
Capital simply rotated instead of outright leaving the market. Bullish Signal.
Technology, Energy, Materials, Health care, Transports all saw capital inflow trends.
Rotation into under preforming sectors is a sign that markets could be staging another healthy leg up.
We still have an upside target over 6300 on SPX.
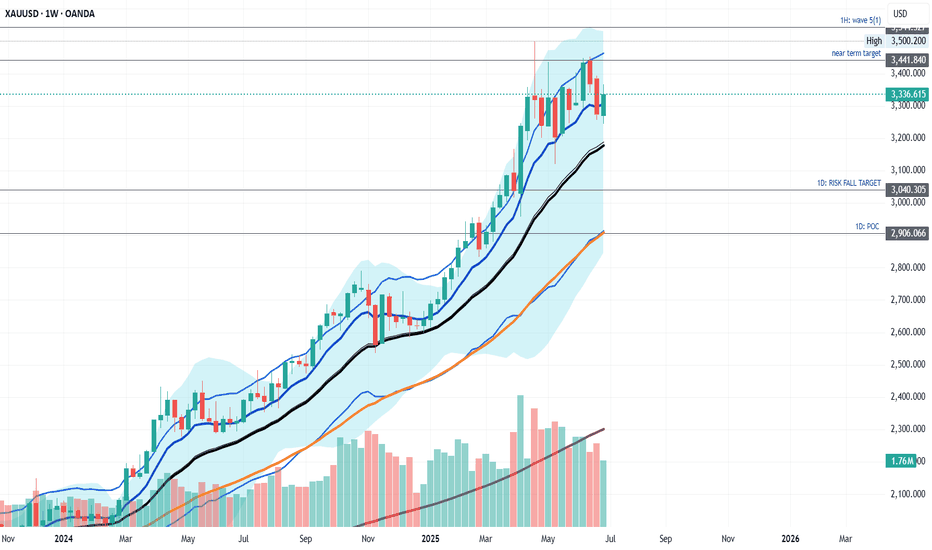
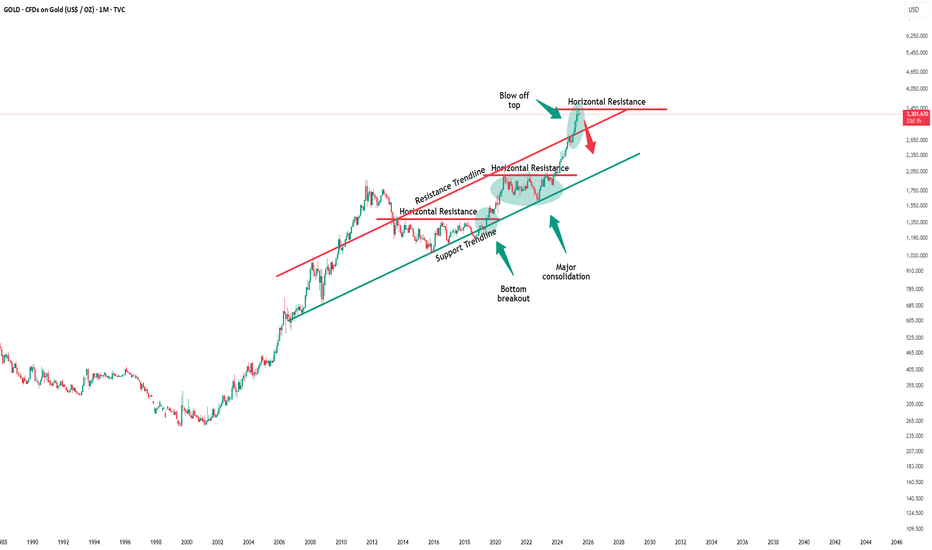
Gold - The clear top formation!🪙Gold ( TVC:GOLD ) just created a top formation:
🔎Analysis summary:
Over the past four months, Gold has overall been moving sideways. Following a previous blow-off rally of about +25%, this cycle is very similar to the 2008 bullish cycle. Bulls are starting to slow down which will most likely result in the creation of at least a short term top formation.
📝Levels to watch:
$3.000
🙏🏻#LONGTERMVISION
Philip - Swing Trader
