Community ideas
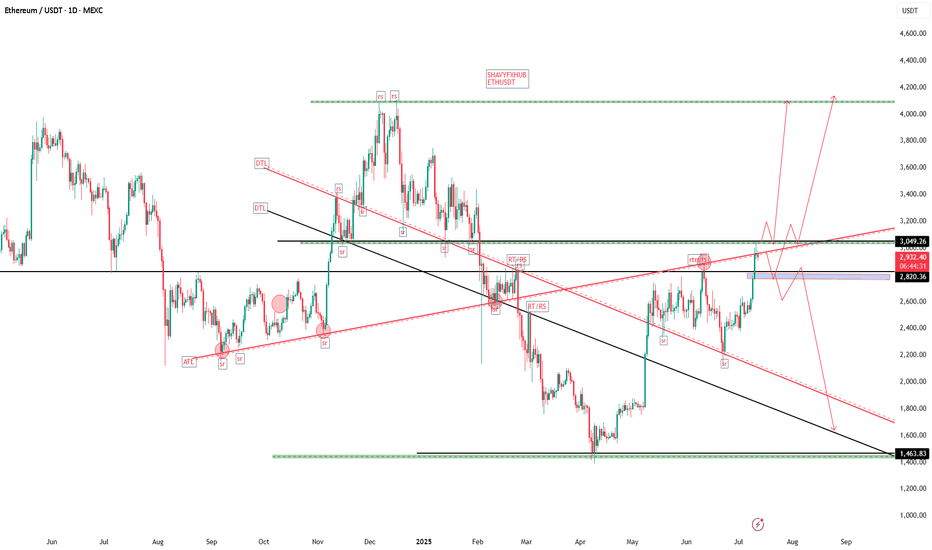
ETHEREUM DAILYETHEREUM DAILY CONFIRMATION FOR LONG IS NOT APPROVED YET.BE PATIENT
Ethereum Approximately $2,930.55 per ETH, watch for 30754 ascending trendline breakout or pull back into 2680 zone ,if we keep buying then 4100 zone will be on the look out as immediate supply roof break and close will expose 4900.my goal in this context is to see ETHUDT buy into my purple supply roof,it will happen .
Market Capitalization: Around $358 billion, making Ethereum the second-largest cryptocurrency by market cap.
Circulating Supply: About 120.7 million ETH.
Recent Performance: Ethereum has gained roughly 17.3% over the past week and about 7% over the last month, though it is down about 4% compared to one year ago.
Market and Technical Overview
Ethereum remains a key player in the blockchain ecosystem, supporting decentralized finance (DeFi), NFTs, and smart contract applications.
The price is consolidating near the $3,000 level, with technical indicators suggesting moderate bullish momentum but some short-term volatility.
Trading volume in the last 24 hours is around $29 billion, indicating strong liquidity and active market participation.
Ethereum continues to be a foundational blockchain platform with strong institutional interest and ongoing development, maintaining its position as a major digital asset in 2025.
#ethusdt #btc #bitcoin
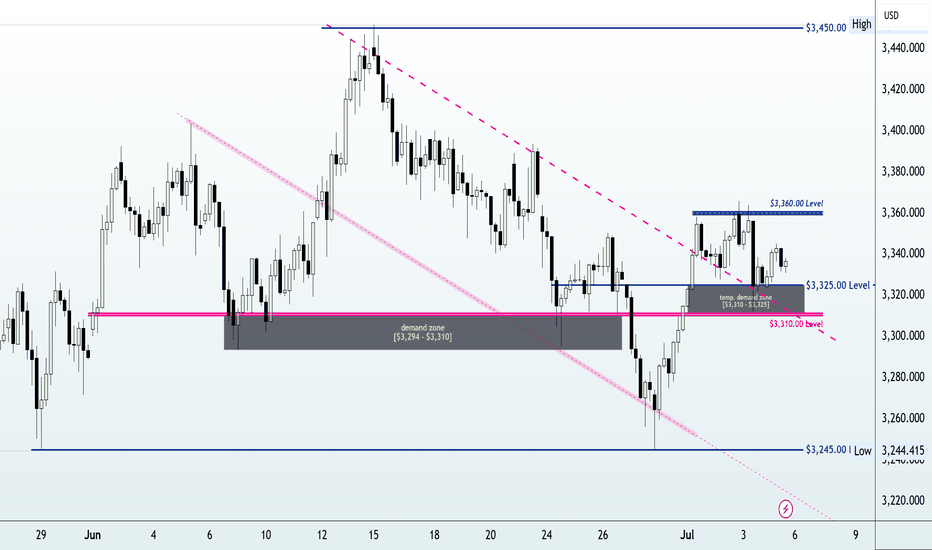
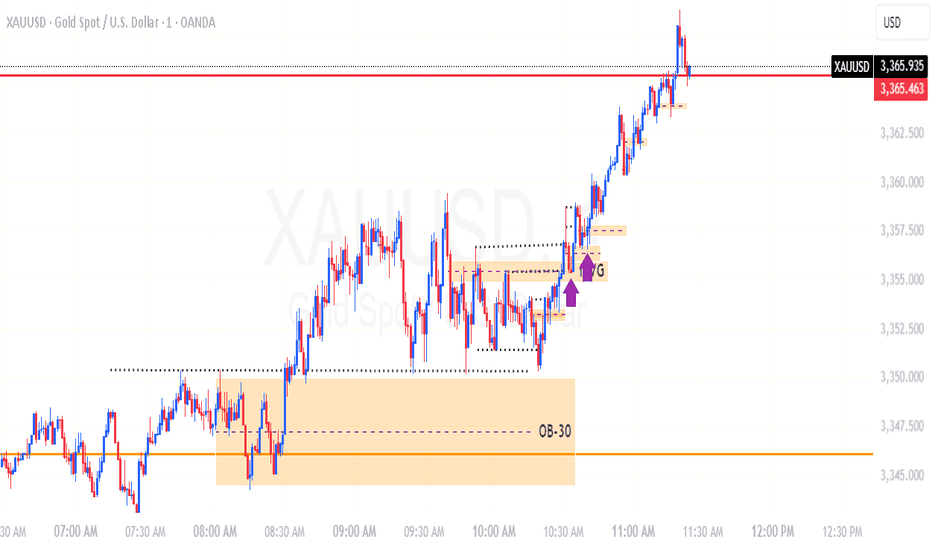
Is Gold Ready for a Breakout or Pullback? | Weekly ForecastIn this video, we dive deep into the gold market analysis for the week of July 7 to July 11, 2025. I break down everything you need to know from last week’s price action — including the surge to $3,360, the impact of the U.S. tax cut and spending bill, and the 2.2% weekly gain despite consolidation.
We also look ahead at what to expect this week, including:
📅 July 9 Trade Tariff Deadline
📉 Key U.S. labor data (Initial Jobless Claims)
🏦 Market sentiment around Fed rate cut speculation
📊 Strategic insights based on technical and macro confluence
👉 If you find this content valuable, don’t forget to Vote, Comment, and Subscribe for weekly market breakdowns.
💬 Drop your thoughts in the comments:
Do you think gold will break above $3,360 this week? Or are we gearing up for a deeper pullback?
Disclaimer:
Based on experience and what I see on the charts, this is my take. It’s not financial advice—always do your research and consult a licensed advisor before trading.
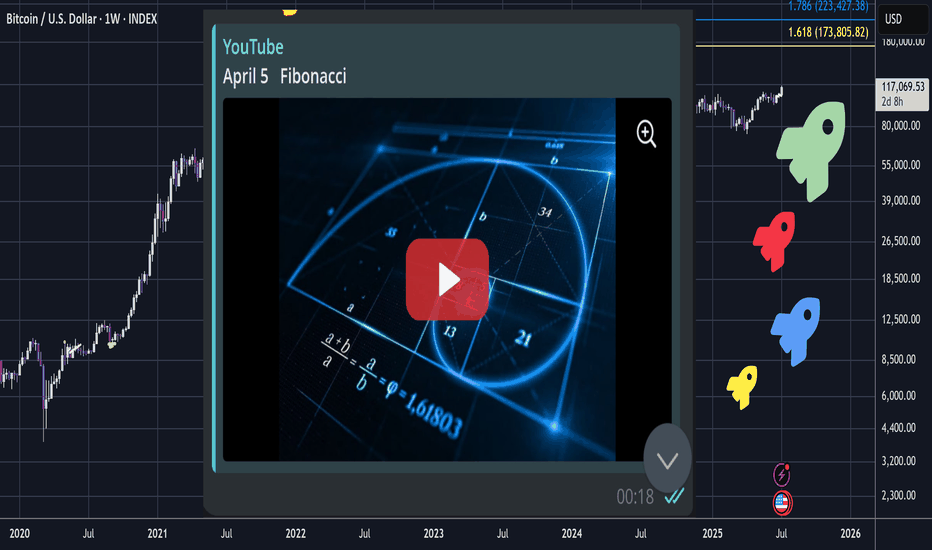
The Return Of The Rocket Booster Strategy Part 1This strategy is the reason of how my audience grew on tradingview.
Its my favorite strategy
and looking at it in hind sight, has been a blessing and a curse.
One of these days am going to share with you how i mastered this strategy.
Something not nice happened to me
i broke up with my girlfriend and this forced
me to study this strategy
For 6 weeks every single day.
Without missing a day.
The pain of the break up forced me into this isolation
where i was forced to study this
strategy because of having no more money
and losing my girlfriend to another man.
Watch this video
to learn more about my flagship strategy
Called " The 3-Step Rocket Booster Strategy. "
Rocket Boost This Content To Learn More.
Disclaimer:Trading is risky please learn risk management and profit taking strategies.Also feel free to use a simulation trading account before you
trade with real money.
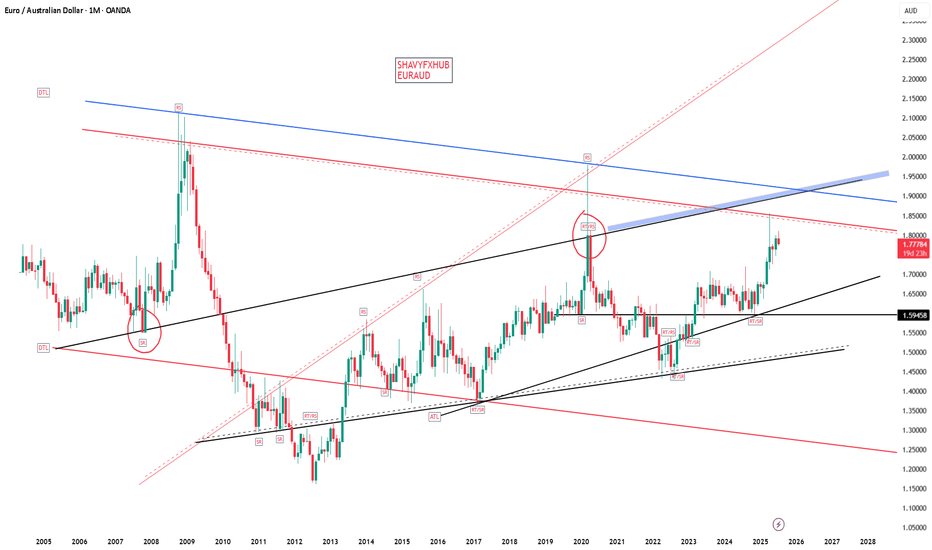
EURAUD The current head of the European Central Bank (ECB) is Christine Lagarde. She has been serving as ECB President since November 2019, Lagarde has emphasized her commitment to steering the ECB through complex economic challenges, including inflation control and adapting monetary policy to evolving global conditions.
the current key interest rates set by the European Central Bank (ECB) are as follows:
Deposit Facility Rate: 2.00%
Main Refinancing Operations Rate: 2.15%
Marginal Lending Facility Rate: 2.40%
These rates were last adjusted on June 11, 2025, when the ECB lowered the key interest rates by 25 basis points (0.25%) to reflect the updated inflation outlook and economic conditions.
Additional Context:
Inflation in the Eurozone is currently around the ECB’s medium-term target of 2%.
The ECB’s Governing Council decided on the rate cut based on a downward revision of inflation projections for 2025 and 2026, partly due to lower energy prices and a stronger euro.
The next ECB interest rate decision is scheduled for July 24, 2025.
ECB Executive Board member Isabel Schnabel recently indicated that the bar for further rate cuts remains “very high” as the economy is holding up well.
Summary Table of ECB Key Rates (as of June 11, 2025)
Rate Type Interest Rate (%)
Deposit Facility Rate 2.00
Main Refinancing Rate 2.15
Marginal Lending Rate 2.40
the Reserve Bank of Australia (RBA) cash rate remains at 3.85%. This decision was made at the RBA’s July 8, 2025 meeting, where the board chose to hold rates steady despite widespread market expectations of a cut to 3.6%
Key Points:
The RBA has signaled that an easing cycle is likely coming, but it wants to wait for the release of the full quarterly inflation data at the end of July to confirm that inflation is on track to decline sustainably toward the target range (2–3%).
Inflation has moderated, with trimmed mean inflation at 2.4% in May, within the target band.
The board was divided: six members voted to hold rates, while three favored a cut.
Market expectations now price in about an 85% chance of a 25 basis point cut to 3.60% at the next meeting on August 12, 2025.
RBA Governor Michele Bullock emphasized that the bank is reacting to domestic inflation and employment data and is prepared to adjust policy as needed, but is not holding rates high “just in case.”
Summary Table
Date Cash Rate (%) Board Decision Next Meeting Expectation
July 8, 2025 3.85 Hold rates steady Likely 0.25% cut at August 12, 2025
Additional Context
The RBA’s cautious approach reflects the need to confirm inflation trends before easing.
The decision surprised markets that had anticipated an immediate cut due to slowing consumer spending and inflation within the target range.
Governor Bullock acknowledged the challenges for borrowers but noted that housing prices, not just interest rates, affect affordability.
EURAUD TRADE MATHE
EU10Y=2.686%
ECB RATE =2.0%
AU10Y= 4.362%
RBA RATE =3.85%
INTEREST RATE DIFFERENTIAL= EUR-AUD=2.0-3.85=-1.85% EURO BASE CURRENCY AND AUD QUOTE. FAVOUR AUD CARRY TRADE.THE TARRIF HAMMER ,AUDSTRALIA AND CHINA TRADE REMAINS A KEY TOOL FOR AUD STRENGTH.
BOND YIELD DIFFERENTIAL= EURO-AUD =2.686%-4.362%=-1.676 FAVOUR AUD .
BUT EURO ZONE ECONOMIC OUTLOOK WILL OFFSET YIELD AND BOND ADVANTAGE AS CHINA AUSTRALIA COMMODITIES MARKET IS DEPENDING MORE ON CHINA ,SO GLOBAL RESTRICTION ON EXPORT WILL GIVE EURAUD LONG POSITION.
#EURAUD
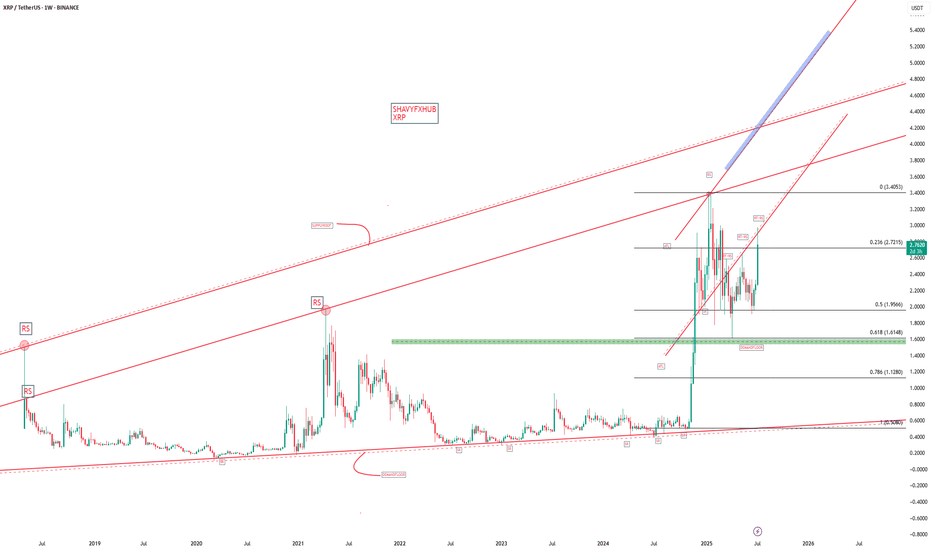
XRPRipple’s CEO Brad Garlinghouse has made bold statements in 2025 about XRP’s potential to disrupt and capture a significant share of SWIFT’s cross-border payments market. Here are the key points:
Ripple’s Ambition vs. SWIFT
Goal: Ripple aims to capture up to 14% of SWIFT’s current cross-border payment volume within five years. SWIFT currently handles over $5 trillion daily in money transfers and more than 45 million financial messages.
Focus on Liquidity, Not Just Messaging: Garlinghouse emphasizes that SWIFT’s traditional strength is in messaging between banks, but the real value lies in liquidity—the actual movement of funds. Ripple’s blockchain-based XRP Ledger offers both messaging and instant liquidity, enabling faster and cheaper cross-border transfers.
XRP as a Bridge Currency: XRP facilitates instant currency conversions, reducing the need for banks to hold large foreign currency reserves in multiple countries, freeing up capital and improving efficiency.
Why XRP Could Gain Market Share
Speed and Cost: XRP transactions settle within 3–5 seconds and cost less than a cent, compared to SWIFT transfers that can take days and cost $20–$50 per transaction.
Central Bank and Institutional Interest: Several central banks are reportedly studying Ripple’s network alongside SWIFT’s systems in pilot programs, signaling growing institutional acceptance.
Blockchain Integration: Ripple is launching an Ethereum Virtual Machine (EVM)-compatible sidechain on the XRP Ledger, expanding its ecosystem and utility for decentralized applications, which could enhance adoption.
Legal Clarity: Following the SEC’s dismissal of remaining claims against Ripple in mid-2025, XRP’s legal status as not being a security has boosted confidence among investors and institutions.
Potential Impact on XRP Price
Experts suggest that if XRP captures a significant portion of SWIFT’s liquidity layer, its price could rise substantially, potentially reaching three-digit levels in USD.
Current XRP price is around $2.25–$2.92, up over 300% since late 2024, but many analysts believe it remains undervalued relative to its utility and potential market share.
Summary
Aspect Details
SWIFT Daily Volume $5 trillion+ in cross-border payments
Ripple’s Target Market Share Up to 14% within 5 years
XRP’s Role Bridge currency providing instant liquidity
Transaction Speed & Cost 3–5 seconds, <$0.01 vs SWIFT’s days and $20–$50
Institutional Adoption Increasing, with central bank pilots underway
Legal Status SEC claims dismissed; XRP not a security
Price Potential Analysts project possible three-digit USD price
Conclusion
Ripple is positioning XRP as a disruptive alternative to SWIFT’s legacy system, focusing on liquidity and speed rather than just messaging. With growing institutional interest, blockchain innovation, and a clearer legal environment, XRP could capture a meaningful share of global cross-border payments, potentially driving significant price appreciation over the next five years.
#XRP
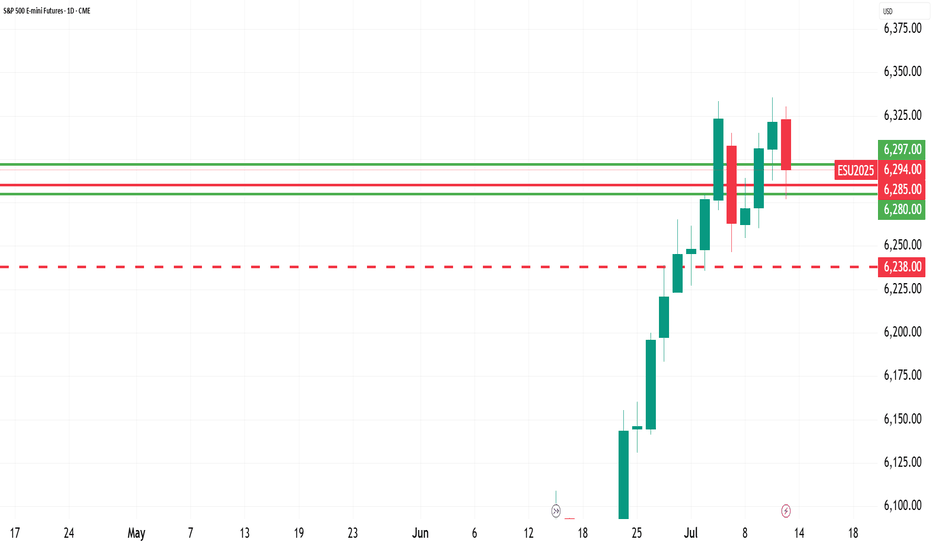
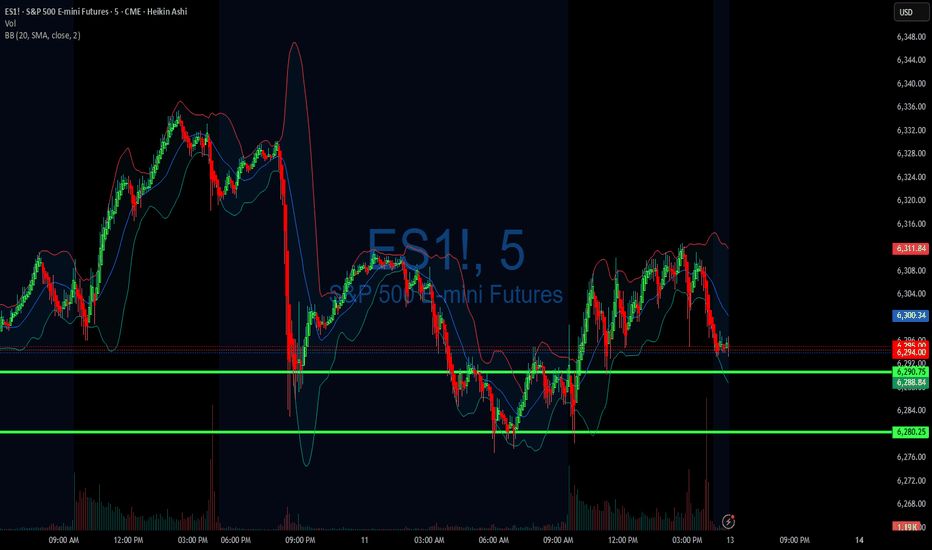
DIYWallSt Trade Journal: Missed Entry & Climbing Back From Loss **07/11/25 Trade Journal, and ES_F Stock Market analysis **
EOD accountability report: -46.25
Sleep: 5 hours
Overall health: Good
** VX Algo System Signals from (9:30am to 2pm) 3/3 success**
— 9:41 AM Market Structure flipped bearish on VX Algo X3!
— 10:15 AM VXAlgo ES X7 Buy signal,
— 10:23 AM Structure flipped bullish
— 11:30 AM VXAlgo ES X3DD Sell Signal
**What’s are some news or takeaway from today? and What major news or event impacted the market today? **
I was a little busy this morning and missed the chance to short the market at MOB with Bearish market structure at 9:30, so I had to wait for the next chance but when i shorted the MOB on the move up, the X7 buy signal came out and pushed market structure bullish.
Ultimately If i had a better entry on my short, I would have been okay, but since i shorted early, i got stopped at at 6306 and it ended up dropping right after that. So the day actually started pretty bad and i was -300 from there and was just trying to climb back and forth the next few hours.
News
*LATEST TARIFF THREATS COULD DELAY RATE CUTS, CHICAGO FED’S GOOLSBEE SAYS - WSJ
**What are the critical support levels to watch?**
--> Above 6290= Bullish, Under 6280= Bearish
Video Recaps -->https://tradingview.sweetlogin.com/u/WallSt007/#published-charts
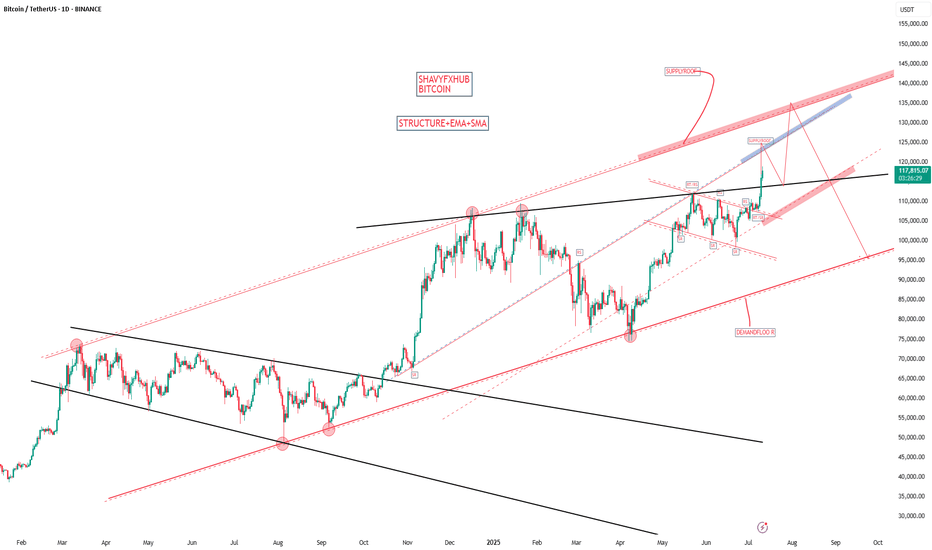
BITCOIN Bitcoin and the Potential Move to $136,000 based on my price action +sma+ema advanced strategy.
Current Market Context
Bitcoin (BTC) is trading near all-time highs, recently surpassing $117,000-118000
The market is characterized by strong institutional inflows, robust ETF demand, and bullish technical momentum.
Is a Move to $136,000 Possible?
Analyst and Model Forecasts
Bitwise Asset Management and several market analysts see a 30% rally possible in July, which could push Bitcoin to the $136,000 level. This projection is based on:
Historical post-crisis rallies (average 31% gains after macro/geopolitical shocks).
Institutions buying more BTC than miners can supply.
Global rate cuts increasing liquidity and risk appetite.
Quantitative models and technical forecasters also predict a range between $136,000 and $143,000 as a potential 2025 high, with some models extending targets to $151,000 and beyond.
Other major banks and analysts (e.g., Standard Chartered, Bernstein, Fundstrat) maintain even higher year-end targets ($150,000–$200,000), but $136,000 is seen as a key intermediate technical and psychological level.
Technical Analysis
Bullish momentum is confirmed across short, medium, and long-term timeframes.
Key resistance levels to watch: $120,000 (psychological), $130,000 (round number), and $136,000 (target zone highlighted by several analysts).
Sustained trading above $112,000–$118,000 would support a move toward $130,000–$136,000, especially if ETF inflows and institutional demand remain strong.
Drivers Supporting the $136K Scenario
ETF and Institutional Inflows: Demand from US spot Bitcoin ETFs and corporate treasuries remains robust.
Macro Tailwinds: Expectations of US Federal Reserve rate cuts and a weakening dollar are fueling risk-on sentiment.
Supply Dynamics: The recent Bitcoin halving has reduced miner supply, amplifying the impact of new demand.
Technical Breakouts: Bull flag and breakout patterns suggest further upside, with $136,000 cited as a technical extension target.
Risks and Considerations
Volatility: Bitcoin remains highly volatile; sharp pullbacks are possible even in a strong uptrend.
Regulatory and Macro Risks: Changes in regulatory stance or a major shift in macro conditions could impact the trajectory.
Profit-Taking: Approaching major round numbers like $130,000 or $136,000 could trigger profit-taking and temporary corrections.
Summary Table: Bitcoin 2025 Price Targets
Source/Model 2025 Target Range $136K Move Outlook
Bitwise, Polymarket $136,000 (July 2025) High probability if current trends persist
Coinfomania AI Model Up to $143,440 $136K within model range
Investing Haven $80,840–$151,150 $136K within bullish scenario
Changelly, CoinDCX $100,000–$150,000 $136K is a key resistance
Standard Chartered $120,000–$200,000 $136K as a stepping stone
Conclusion
A move to $136,000 for Bitcoin is considered plausible in 2025 by my market structure advanced strategy , This scenario is supported by strong institutional demand, favorable macro conditions, and bullish technical patterns. However, volatility and macro/regulatory risks remain, so price action should be monitored closely as BTC approaches key resistance levels at 120k and 136k level
#bitcoin #btc
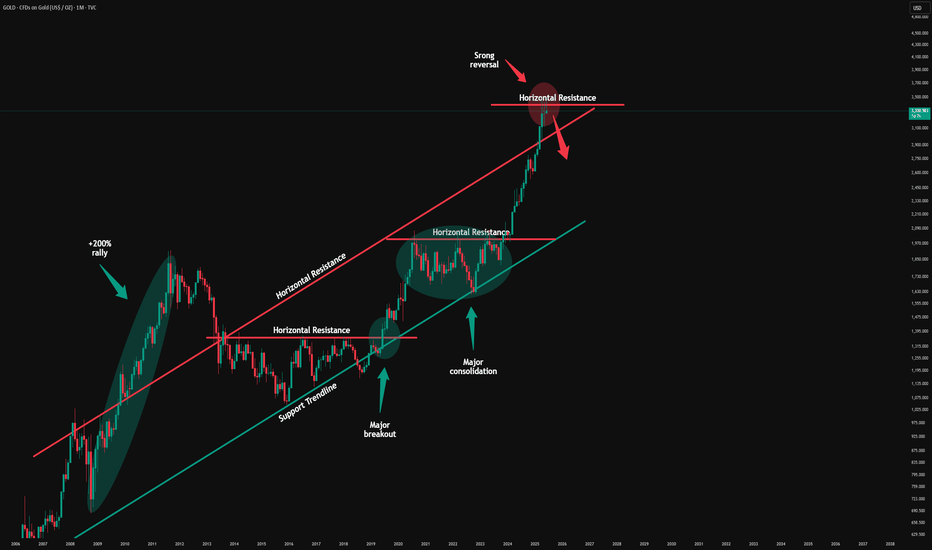
Gold - This is the official top!Gold - TVC:GOLD - might top out soon:
(click chart above to see the in depth analysis👆🏻)
Since Gold confirmed its rounding bottom in 2019 it rallied more than +200%. Especially the recent push higher has been quite aggressive, squeezing all bears. But now Gold is somehow unable to create new all time highs, which could constitute the a top formation.
Levels to watch: $3.500, $3.000
Keep your long term vision🙏🙏
Philip (BasicTrading)
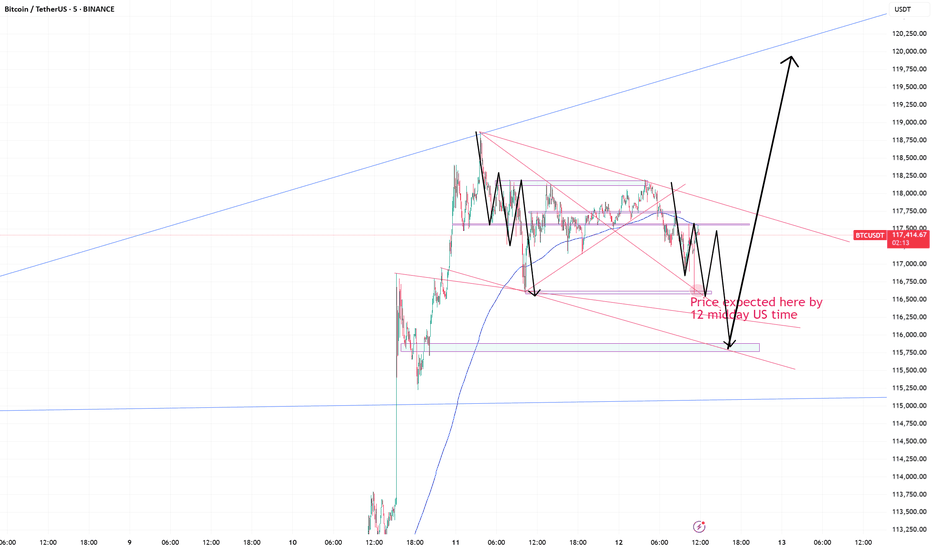
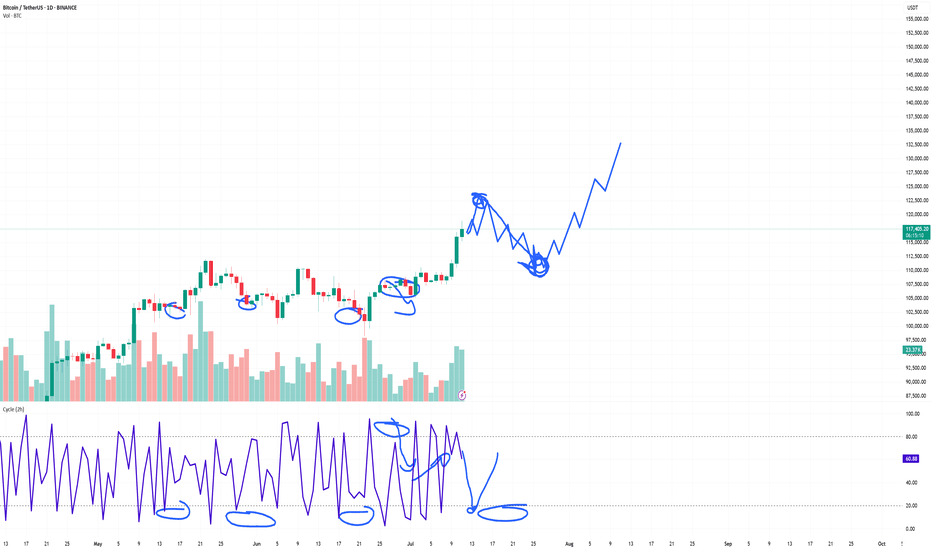
Bitcoin: Final Push in the 60-Day Cycle?Bitcoin appears to be making its final move higher within the current 60-day cycle. We could potentially see a push into the $121K–$122K range before a sharp correction takes us down to around $110K–$112K toward the end of the month, driven by the 3-day cycle timing.
After that, we’re likely to form a new 60-day cycle low, which could set the stage for a renewed move to the upside.
Is it time to go long?
At this point, the risk/reward doesn’t look favorable for new longs. Personally, I’m watching for one final push above $120K to consider opening a short position into the expected cycle low.
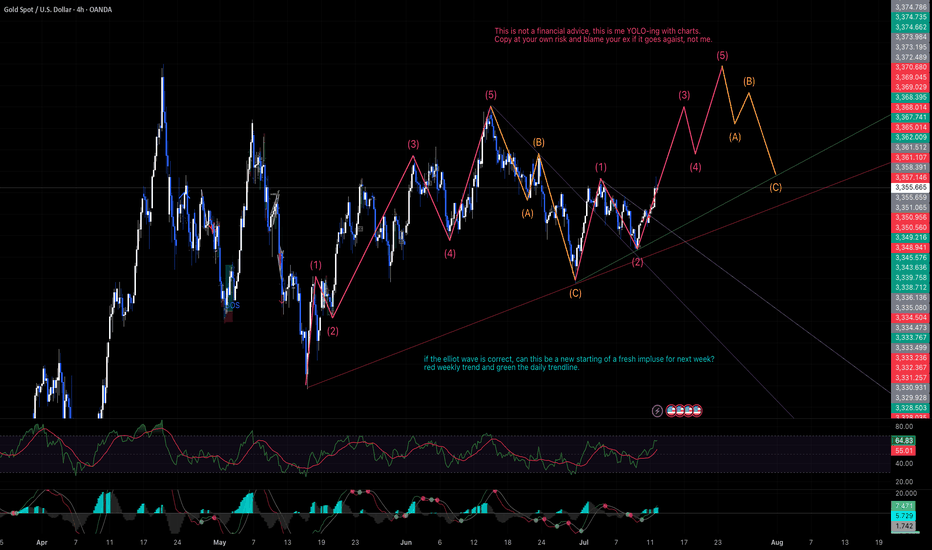
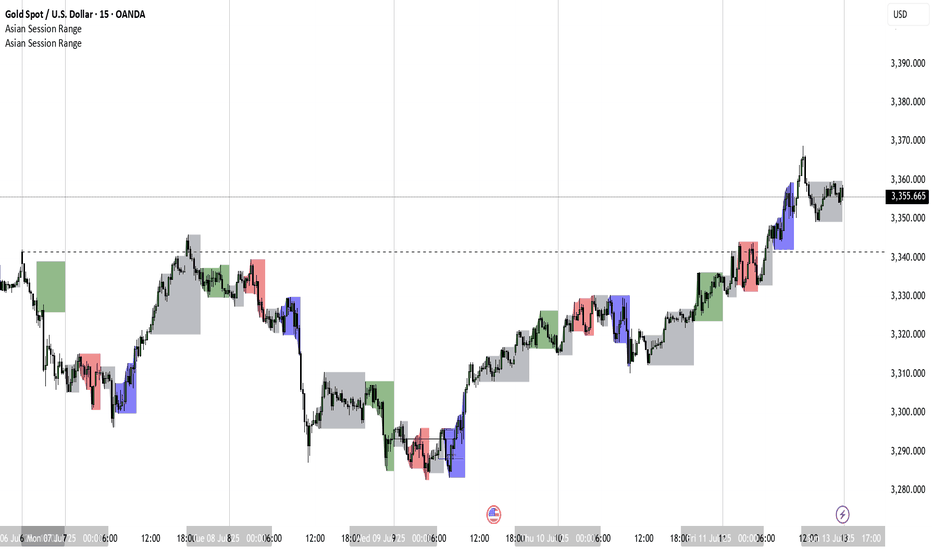
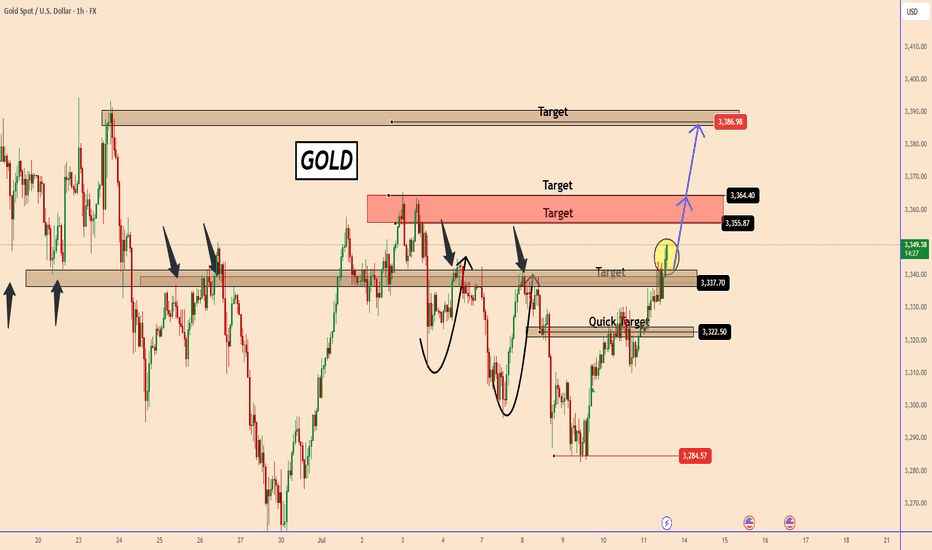
Gold Eyes 3,386 with No Reversal in SignsGold Eyes 3,386 with No Reversal in Signs
Gold continues its upward trajectory, with potential extension toward the $3,386 level.
In my view, the primary catalyst behind this rally is market manipulation.
Additionally, recent comments from former President Trump regarding tariffs, and remarks from Chair Powell on interest rate policy, have further fueled bullish sentiment.
You may watch the analysis for further details!
Thank you!
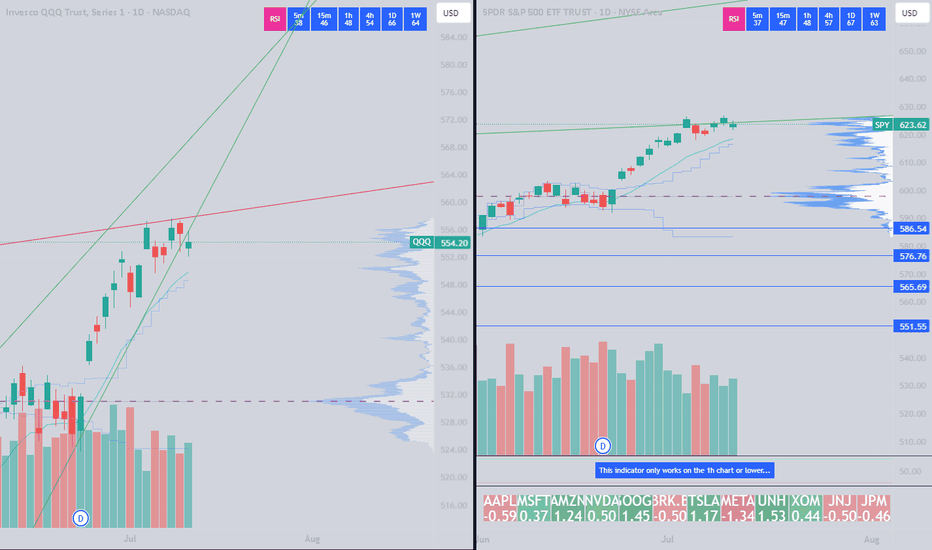
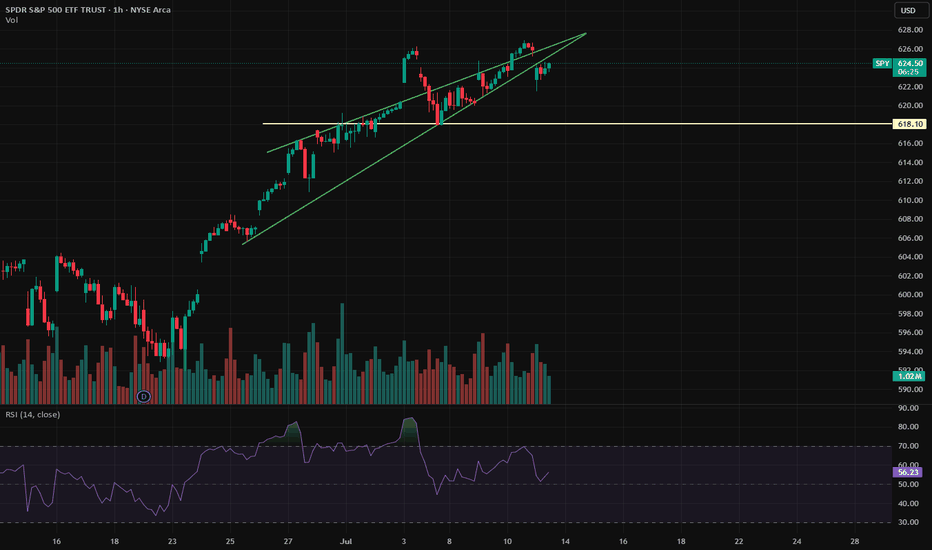
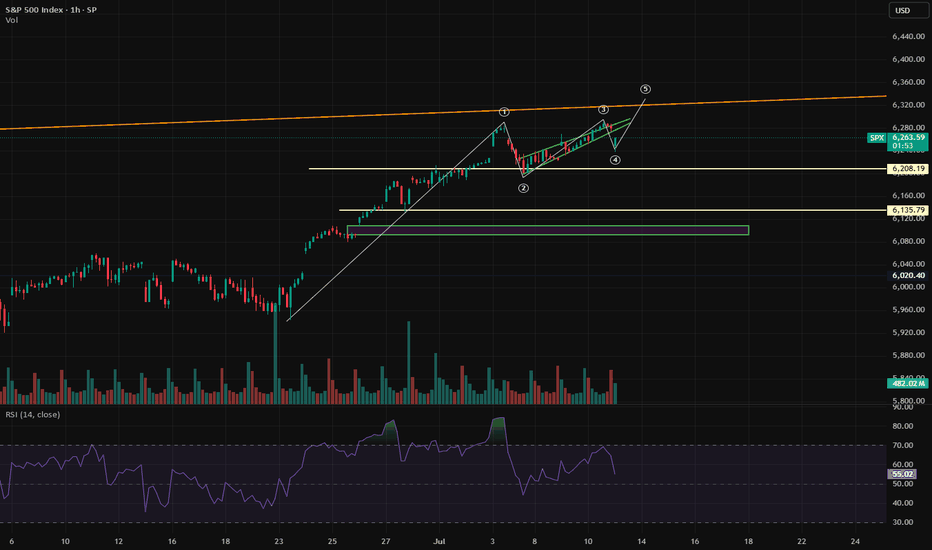
Gap down is likely a bear trap - SPYSo the gap down looked bearish but the technicals are not confirming it. One more high is likely today or Monday. Gold is at resistance here. OIl found support and looks like a long. BTC rallied and can go higher but it's putting in daily bearish divergences. Natural Gas looks like it will bounce.
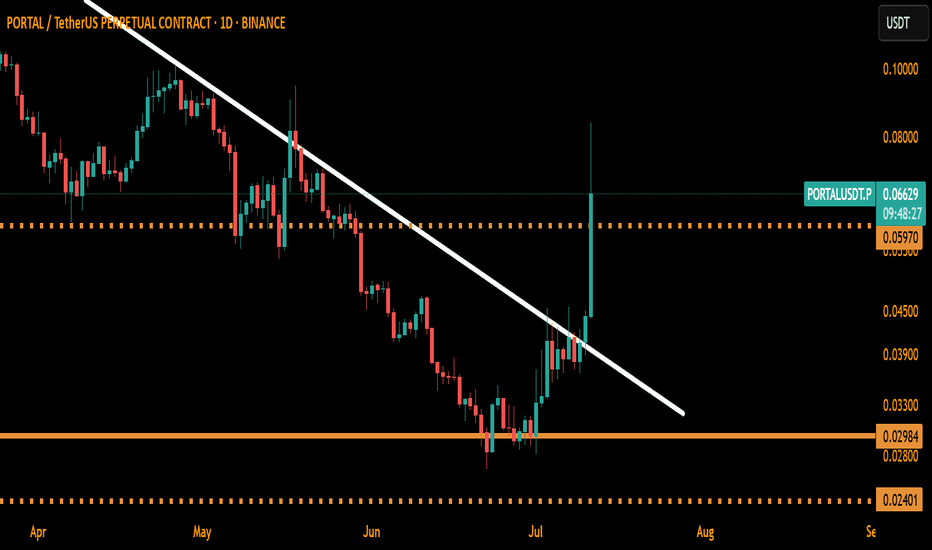
PORTALUSDT CHART ANALYSİS ISTRADING CRYPTO PROFITABLE?
Crypto trading is profitable but only if done correctly. Follow the
steps, strategies, and tips shared throughout our guide, and you will be
in a better position to make profitable trades. And a golden rule:
Plan your trade, trade your plan.
Never Forget: 90/90/90 trading rule.
90% of traders will lose 90% of their account value within 90
days.
1. No matter how much profit you make; what matters is how
much you keep.
2. No matter how much you keep, what matters is how much you
re-invest.
3. No matter how much you re-invested, what matters is your
total return on investment (ROI).
