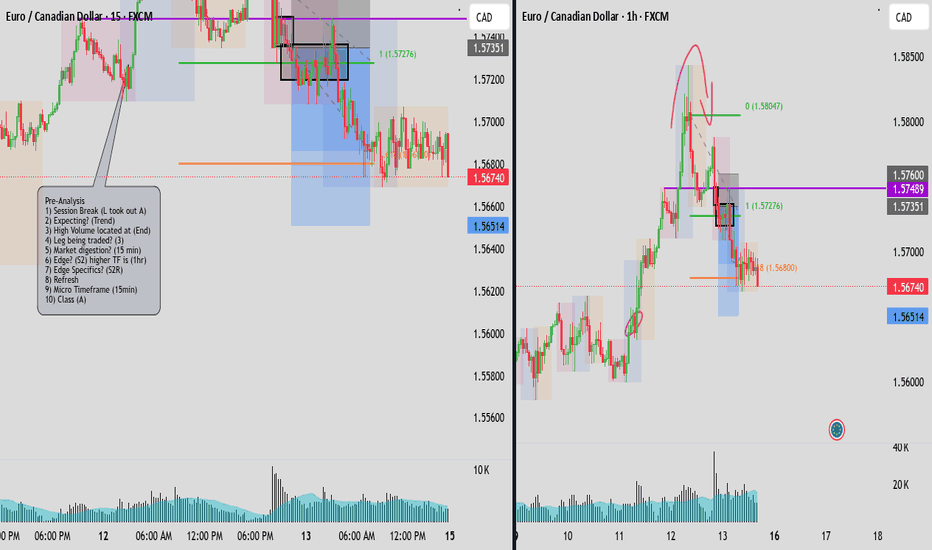
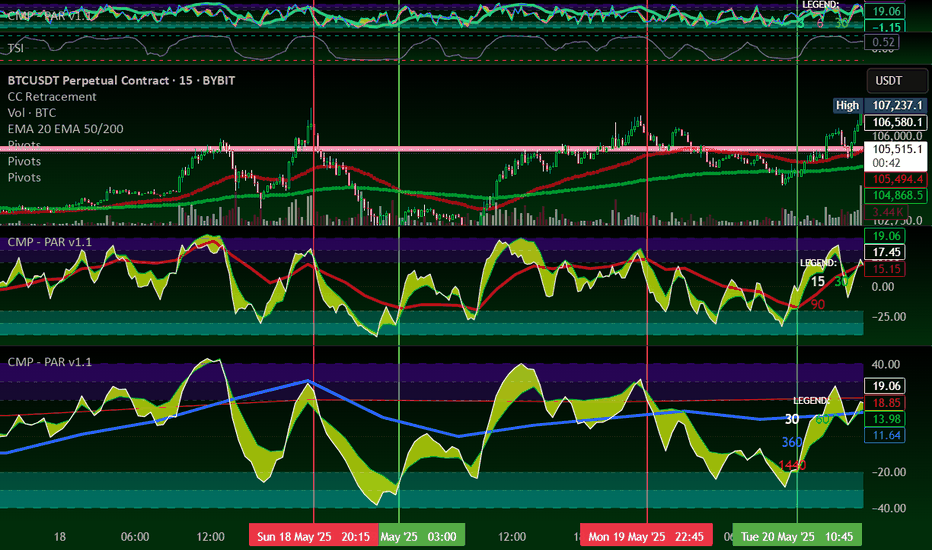
Community ideas
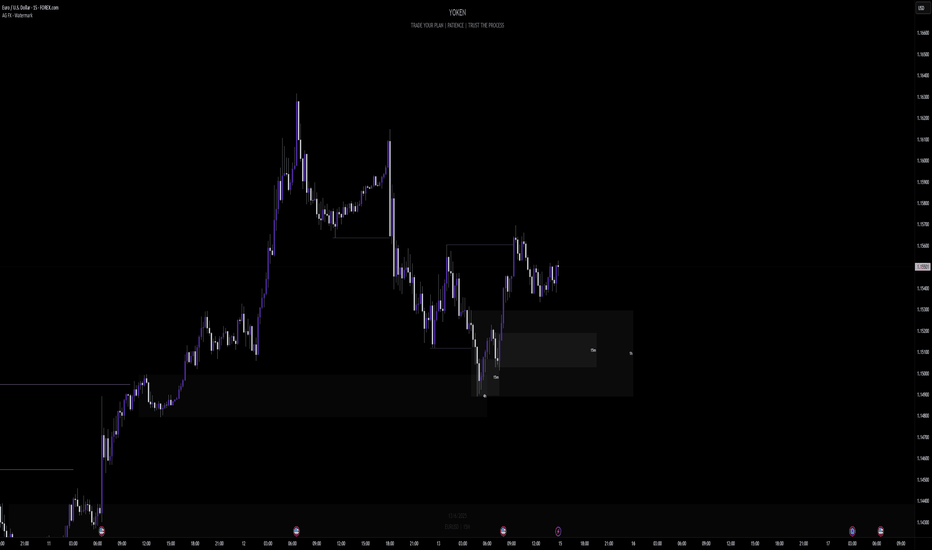
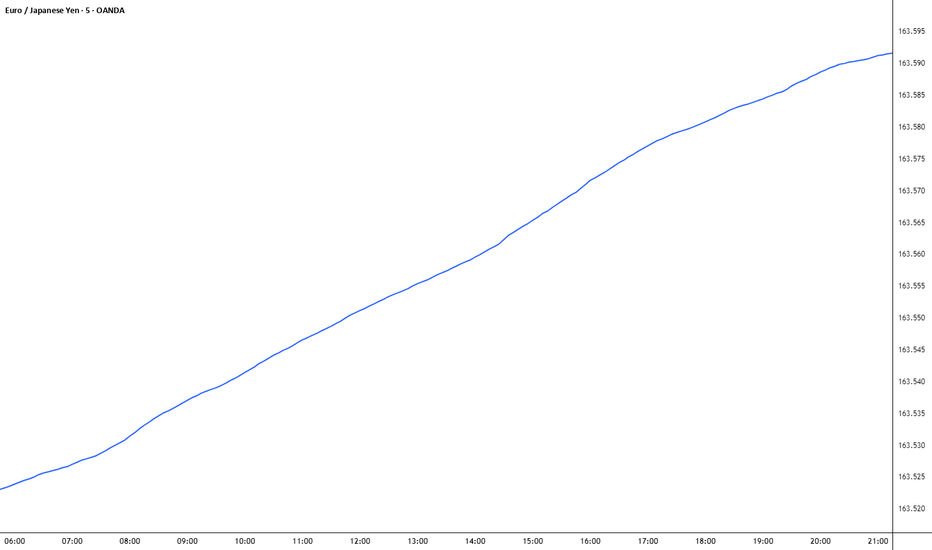
Forex Weekly Portfolio Selection – Top Trade SetupsWeekly Forex Portfolio Selection – H1 Chart Analysis
Using the Weekly & Daily Currency Strength Index, we’ve identified the strongest and weakest currencies to build a focused trading portfolio for the week.
📊 Currency Strength Ranking (1 = Weakest, 8 = Strongest):
EUR: 8
CHF: 7
CAD: 6
GBP: 5
AUD: 4
NZD: 3
USD: 2
JPY: 1
➡️ The Euro (EUR) is currently the strongest, while the Japanese Yen (JPY) is the weakest.
🔍 Analysed Pairs (H1 Timeframe):
EURJPY
EURUSD
CADJPY
GBPUSD
This selection focuses on high-probability setups aligned with trend and strength analysis.
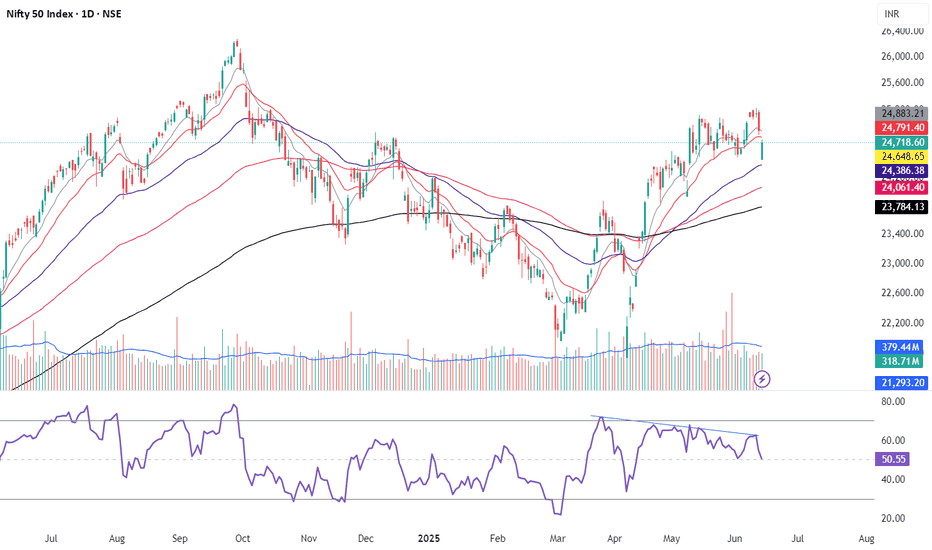
Review and plan for 16th June 2025Nifty future and banknifty future analysis and intraday plan.
This video is for information/education purpose only. you are 100% responsible for any actions you take by reading/viewing this post.
please consult your financial advisor before taking any action.
----Vinaykumar hiremath, CMT
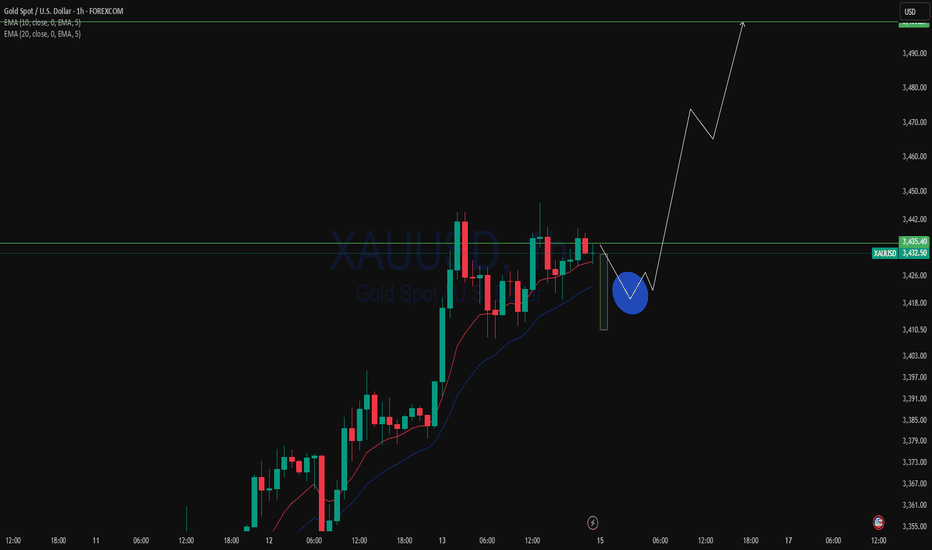
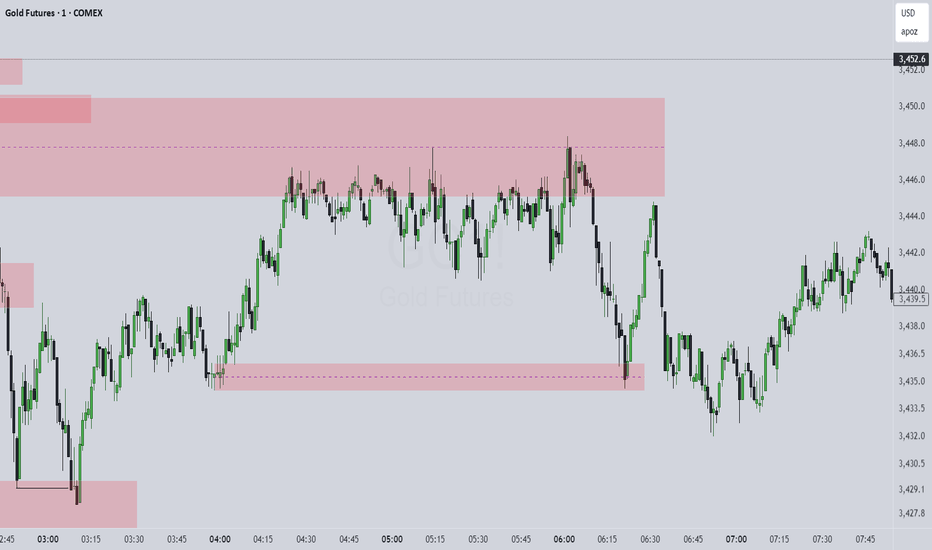
XAUUSD Analysis todayHello traders, this is a complete multiple timeframe analysis of this pair. We see could find significant trading opportunities as per analysis upon price action confirmation we may take this trade. Smash the like button if you find value in this analysis and drop a comment if you have any questions or let me know which pair to cover in my next analysis.
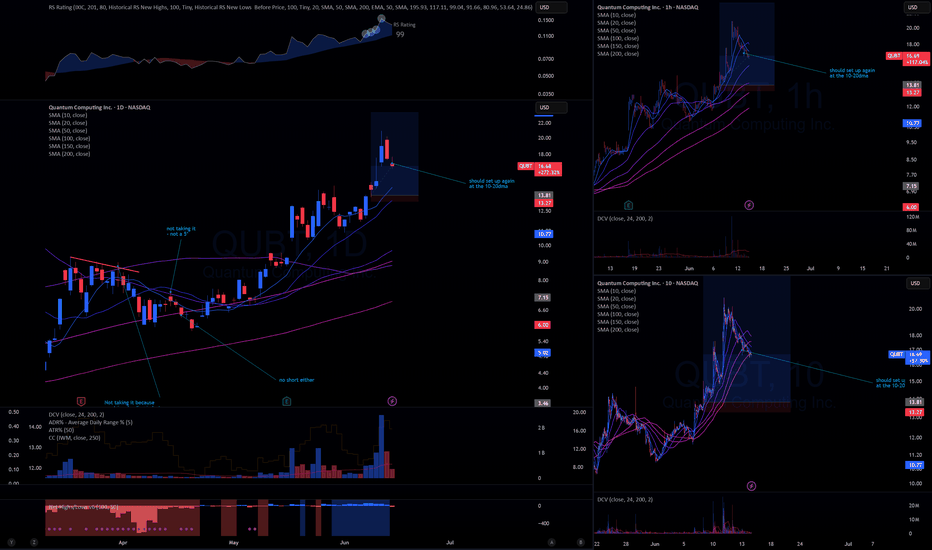
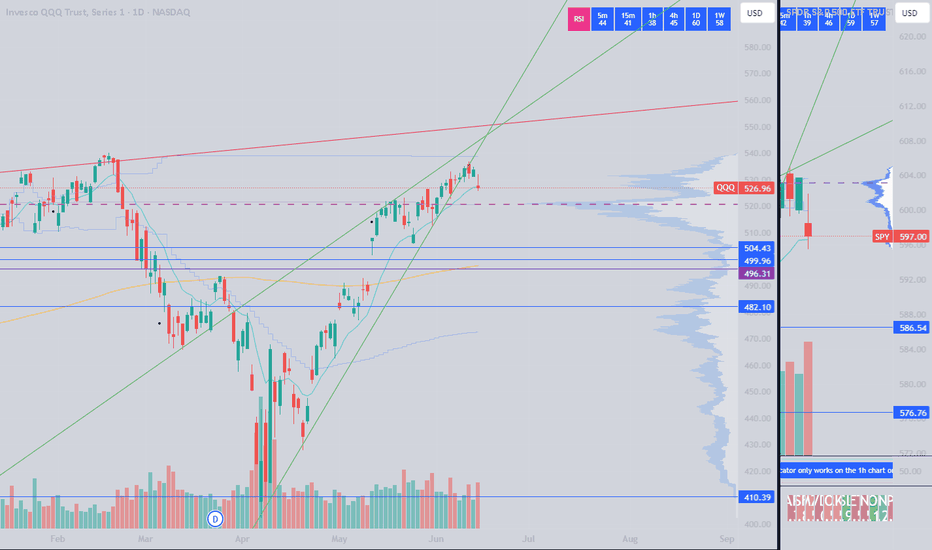
Market Update - 6/15/2025• Almost everything sold off on Friday, I also closed all my positions even though some of them still didn't hit my sell rule ( NYSE:QBTS , NASDAQ:LAES , NYSE:AMPX ), might regret it later
• Gold, energy and defense stocks are holding up, reflecting the middle east fears
• Weirdly gaming and entertainment stocks like NYSE:RBLX , NYSE:SPOT and NYSE:SGHC were holding up strong on Friday, not sure why, but they could be future leaders. War expectations and lockdown so people stay at home gaming and gambling? Who knows
Portfolio Analytics
• 2 big mistakes remaining: missing out trades (I'm getting better) and giving back too much -> this week I focused on the latter
• On average I'm giving back 0.82R per trade, almost 1
• So every trade could almost cover 1 loss
• This means that just by taking profits better I could cover a large portion of my losses, becoming profitable
• Usually my gains peak out at day 4-5 at around 5-7R
• Interesting how Qullamaggie always said to take profits after 3-5 days, which exactly aligns with this
• My median gain is 2R - idea is to sell half at this level
• My 75th percentile is 5R - at this point I should be out of 75% of the position - aligns well with what Stockbee is doing and it makes so much sense
• If I hit a huge R multiple early on (based on 90th percentile), take larger than 50% profits, maybe 80% - average holding days is less than 3 days
• Additions to methodology: paying attention to correlation coefficient to remove myself from index moves by trading low correlation stocks and calculating $ ATR on a portfolio level to put into context my average daily $ moves. Given I'm trading 10x higher ATR stocks than the indexes, even if I'm only 30-40% invested, that's like being fully invested in the indexes. This puts these "large" daily $ swings in my portfolio into context and reduces my likelihood of closing out early because of a down day.
• Next weeks: no setups (maybe gold and energy), not interested in trading in such news driven market, 100% cash
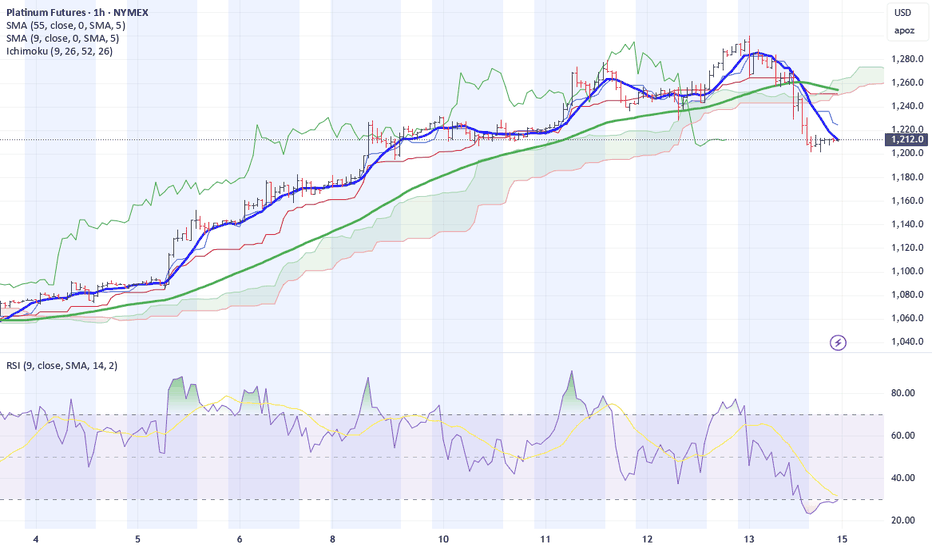
Platinum Market Alert: One-Day Reversal in Play On Friday, the platinum market printed a key day reversal — a classic signal that a short-term correction may be underway.
🔍 In our analysis posted Thursday, we highlighted the 55-hour moving average as good place to place a stop level in a runaway market. Fast forward to now: that level has been decisively broken, along with a drop below the cloud on the hourly chart.
⚠️ This breakdown increases the probability of a near-term correction.
Stay sharp. Manage your risk. Markets are talking — hope that you are listening!
Disclaimer:
The information posted on Trading View is for informative purposes and is not intended to constitute advice in any form, including but not limited to investment, accounting, tax, legal or regulatory advice. The information therefore has no regard to the specific investment objectives, financial situation or particular needs of any specific recipient. Opinions expressed are our current opinions as of the date appearing on Trading View only. All illustrations, forecasts or hypothetical data are for illustrative purposes only. The Society of Technical Analysts Ltd does not make representation that the information provided is appropriate for use in all jurisdictions or by all Investors or other potential Investors. Parties are therefore responsible for compliance with applicable local laws and regulations. The Society of Technical Analysts will not be held liable for any loss or damage resulting directly or indirectly from the use of any information on this site.
BTC BITCOIN Bitcoin buy level on the green structure to watch will be on the 100k and my next buy watch zone will be 97-98k .
Growing institutional participation, including the launch and approval of Bitcoin ETFs is increasing liquidity and legitimizing BTC as an investment asset.
Macroeconomic Environment , Persistent low real interest rates by central banks and concerns about inflation support demand for Bitcoin as a store of value.
Geopolitical uncertainties and currency debasement fears boost Bitcoin’s appeal as a digital gold.
Bitcoin’s network security, hash rate, and active addresses remain robust, underpinning confidence in its decentralized infrastructure.
Continued development in scaling solutions and layer-2 technologies enhances usability.
Increasing regulatory clarity worldwide, including clearer frameworks for crypto exchanges and custodians, reduces uncertainty and encourages adoption.
However, regulatory risks remains a factor that can cause short-term volatility.
#bitcoin #btc
BABA Stock: A Detailed Analysis using Elliott Wave Theory RulesHello Friends,
Welcome to RK_Chaarts,
Let's analyze Ali Baba Group Holdings Limited, also known as BABA, listed on the NYSE. We'll be using the Elliott Waves theory.
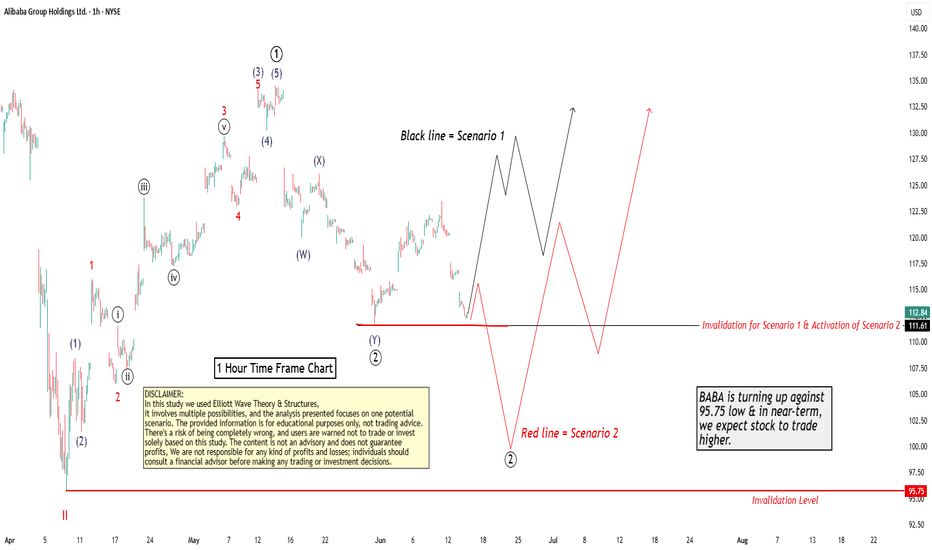
Friends, as we can clearly see, after hitting a low of around $95.75 on 9th April 2025, it started an impulse wave. Within this wave, we've completed intermediate degree blue bracketed (1), (2), (3), (4), (5), and primary degree ((1)) in Black. Currently, we're completing primary degree ((2)), with a low around $111.
If it breaks the level of $111, we'll assume we're still in primary degree ((2)), as marked in scenario 2 on the chart. This means wave ((2)) is unfolding, and wave ((3)) might start after wave ((2)) is complete.
If it doesn't break the $111 level, it's likely that wave ((2)) has completed, and we've started a subdivision of wave ((3)) or its further subdivisions. If it moves further up, following scenario 1 (the black line on the chart), this is a possibility.
According to Elliott Wave theory, wave ((2)) cannot retrace more than 100% of wave ((1)). So, our main invalidation level for this count is $95.75. Yes, BABA is turning up against the 95.75 low, and in the near term, we expect the stock to trade higher.
Somewhere, this stock might move towards $150 or $160 if it doesn't break down below $ 95.75.
I am not Sebi registered analyst.
My studies are for educational purpose only.
Please Consult your financial advisor before trading or investing.
I am not responsible for any kinds of your profits and your losses.
Most investors treat trading as a hobby because they have a full-time job doing something else.
However, If you treat trading like a business, it will pay you like a business.
If you treat like a hobby, hobbies don't pay, they cost you...!
Hope this post is helpful to community
Thanks
RK💕
Disclaimer and Risk Warning.
The analysis and discussion provided on in.tradingview.com is intended for educational purposes only and should not be relied upon for trading decisions. RK_Chaarts is not an investment adviser and the information provided here should not be taken as professional investment advice. Before buying or selling any investments, securities, or precious metals, it is recommended that you conduct your own due diligence. RK_Chaarts does not share in your profits and will not take responsibility for any losses you may incur. So Please Consult your financial advisor before trading or investing.
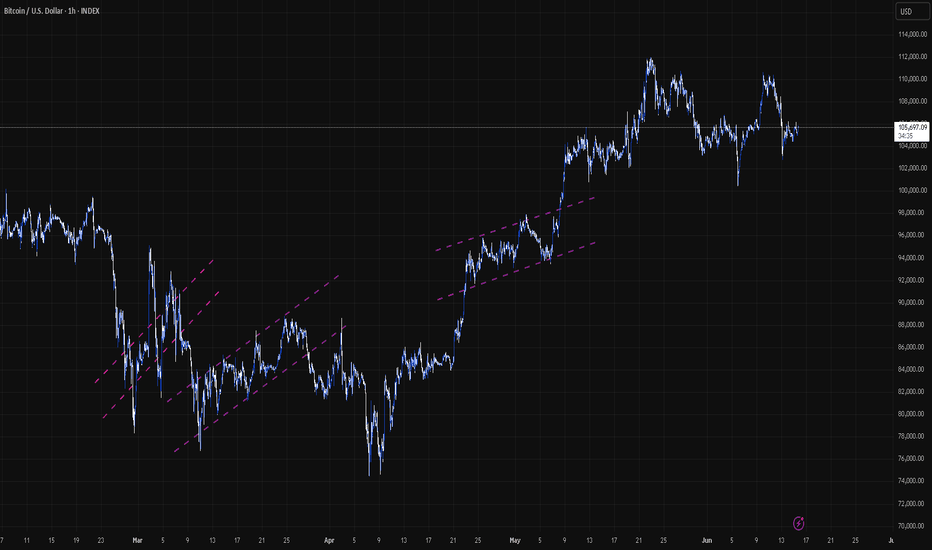
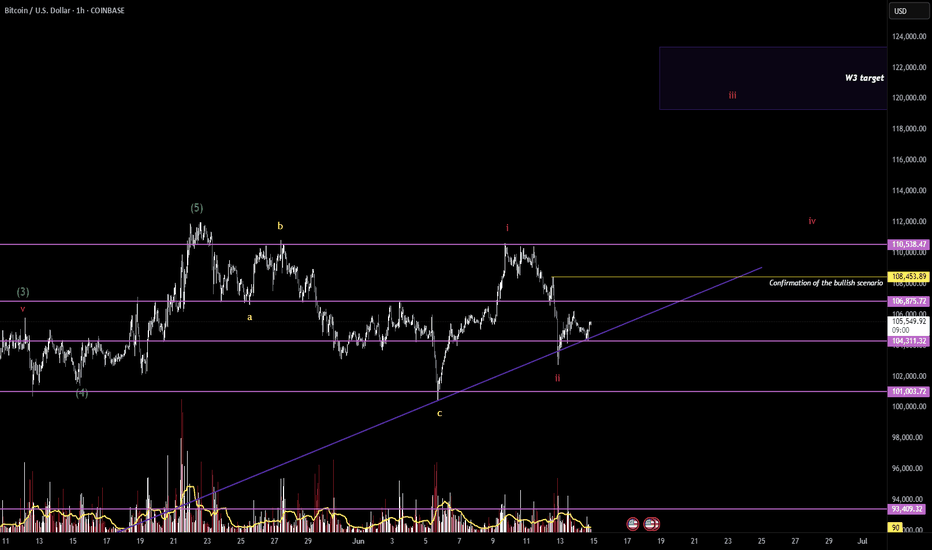
$BTC Weekend Update - June 14Hello Fellow Degenerates,
Bitcoin is holding above 104k helping us a lot when it comes to our bullish scenario, however the bearish scenario still lingers and threatens to destroy all of our hopes, dreams and portfolios.
- We need price to break above 108k to confirm our bullish bias
- A rejection of 106k could bring price to retest 104k and possibly break it, validating our bearish scenario
- Levels to watch: 110.5k, 108.4k, 106.8k, 104.3k, 101k
SILVERThe price of silver is trading around $36.308 per ounce (approximately $1,203 per kilogram), showing modest gains with a slight intraday rise into a new high of 36.770
Year-to-Date Performance: Silver has gained over 14% in 2025 and about 23.6% since the start of the year in kilogram terms, reflecting strong industrial demand and safe-haven buying.
Industrial Demand: Growth in renewable energy sectors, especially solar power and electric vehicles, continues to drive robust demand for silver, which is a key component in photovoltaic cells and electronics.
Geopolitical and Market Factors: Recent geopolitical tensions, such as the Iran-Israel conflict, have supported silver as a safe-haven asset alongside gold, contributing to price strength.
Volatility: While silver has seen strong gains, short-term fluctuations remain, influenced by dollar strength, interest rate expectations, and profit-taking by investors.
silver as undervalued relative to its industrial demand and inflation hedge qualities,so expect continued upward pressure over the medium term .Supply-side risks, including mining disruptions and environmental regulations, may tighten availability and support prices.
Investors should be mindful of potential short-term pullbacks amid profit-taking or shifts in macroeconomic sentiment.
Key Drivers for price rally ,Industrial demand, safe haven, geopolitical tensions Solar energy, EVs, Iran-Israel conflict
In summary: Silver prices are currently strong, supported by industrial demand, geopolitical uncertainty, and safe-haven buying. While short-term volatility persists, the medium-term outlook remains bullish due to supply constraints and growing demand from renewable energy and technology sectors.
#silver#gold
Buy OIL & GOLD, Sell Stocks Indices When Missiles Are Flying!In this Weekly Market Forecast, we will analyze the S&P 500, NASDAQ, DOW JONES, Gold and Silver futures, for the week of June 16-20th.
When missiles start flying in the Middle East, investors become reactively risk averse. Money goes from stocks to safe havens and oil. That's it. Expect oil prices to rise, Gold to reach new highs, and the equity markets to see more sellers than buyers.
This environment may last a few days or a few weeks. Keep an ear to the news.
Enjoy!
May profits be upon you.
Leave any questions or comments in the comment section.
I appreciate any feedback from my viewers!
Like and/or subscribe if you want more accurate analysis.
Thank you so much!
Disclaimer:
I do not provide personal investment advice and I am not a qualified licensed investment advisor.
All information found here, including any ideas, opinions, views, predictions, forecasts, commentaries, suggestions, expressed or implied herein, are for informational, entertainment or educational purposes only and should not be construed as personal investment advice. While the information provided is believed to be accurate, it may include errors or inaccuracies.
I will not and cannot be held liable for any actions you take as a result of anything you read here.
Conduct your own due diligence, or consult a licensed financial advisor or broker before making any and all investment decisions. Any investments, trades, speculations, or decisions made on the basis of any information found on this channel, expressed or implied herein, are committed at your own risk, financial or otherwise.
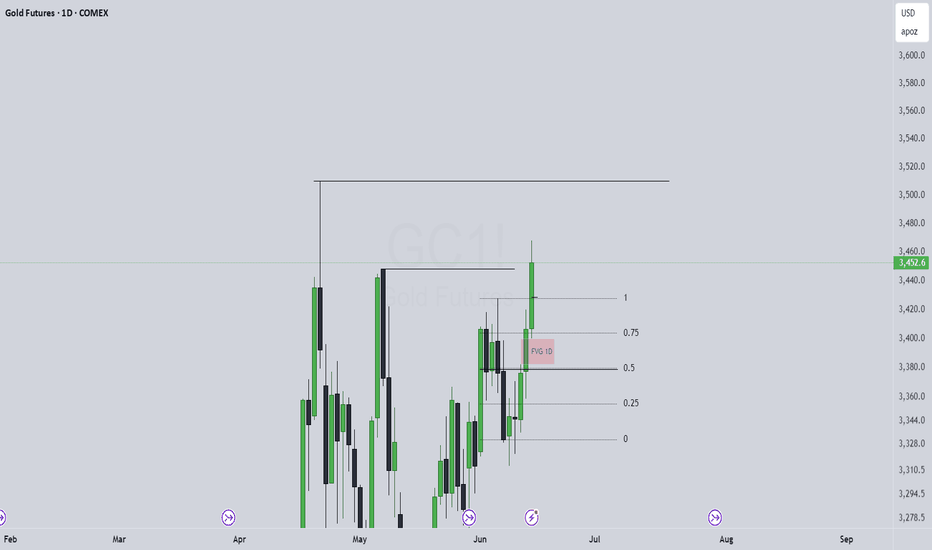
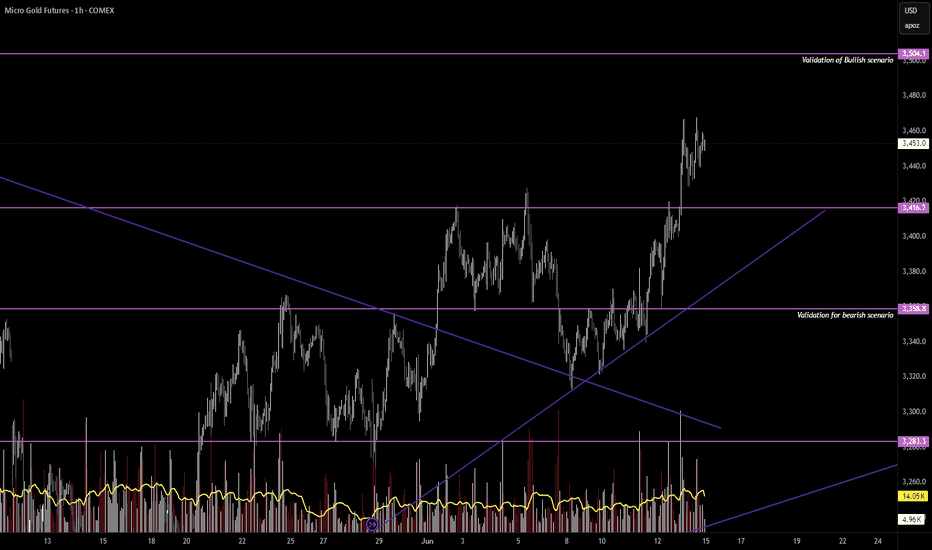
$MGC1(Gold) Weekend Update - June 14Hello Fellow Gamblers,
I hope you're not sinking in your twin size bed thinking about your losses from this week.
I am bringing to you a weekend update on gold, so we can get ready for this week. This video is a little bit longer and my ability to speak becomes worse as time extends, so take your time and get your notes right to prepare for the week.
- 3416.2 needs to hold for more upside. A break below that level can take us towards 3358.8.
- A break below 3358.8 validates our bearish scenario.
- A break above 3504.1 validates our bullish scenario.
- Levels to watch: 3416.2, 3358.8, 3504.1
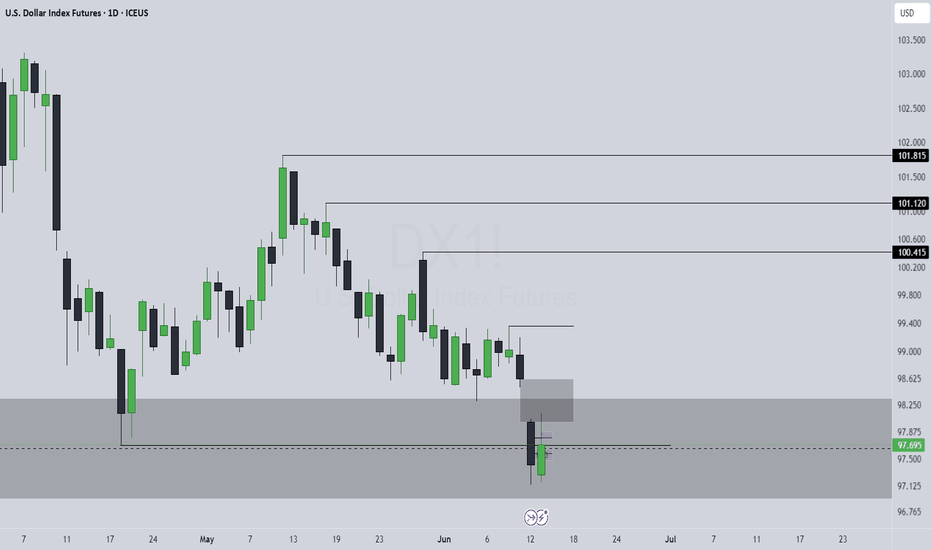
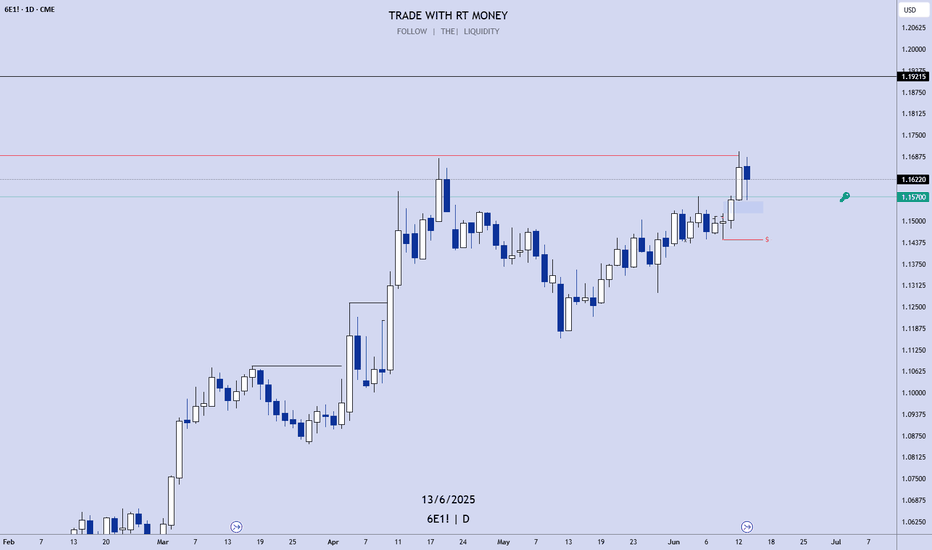
Weekly FOREX Forecast: When Missiles Fly, So Does The US Dollar This is the FOREX futures outlook for the week of Jun 16-20th.
In this video, we will analyze the following FX markets:
USD Index, EUR, GBP, AUD, NZD, CAD, CHF, and JPY.
Middle East tensions are high, missiles flying.... and so will the USD. Look for the USD to
out perform its counterparts during precarious period.
Enjoy!
May profits be upon you.
Leave any questions or comments in the comment section.
I appreciate any feedback from my viewers!
Like and/or subscribe if you want more accurate analysis.
Thank you so much!
Disclaimer:
I do not provide personal investment advice and I am not a qualified licensed investment advisor.
All information found here, including any ideas, opinions, views, predictions, forecasts, commentaries, suggestions, expressed or implied herein, are for informational, entertainment or educational purposes only and should not be construed as personal investment advice. While the information provided is believed to be accurate, it may include errors or inaccuracies.
I will not and cannot be held liable for any actions you take as a result of anything you read here.
Conduct your own due diligence, or consult a licensed financial advisor or broker before making any and all investment decisions. Any investments, trades, speculations, or decisions made on the basis of any information found on this channel, expressed or implied herein, are committed at your own risk, financial or otherwise.
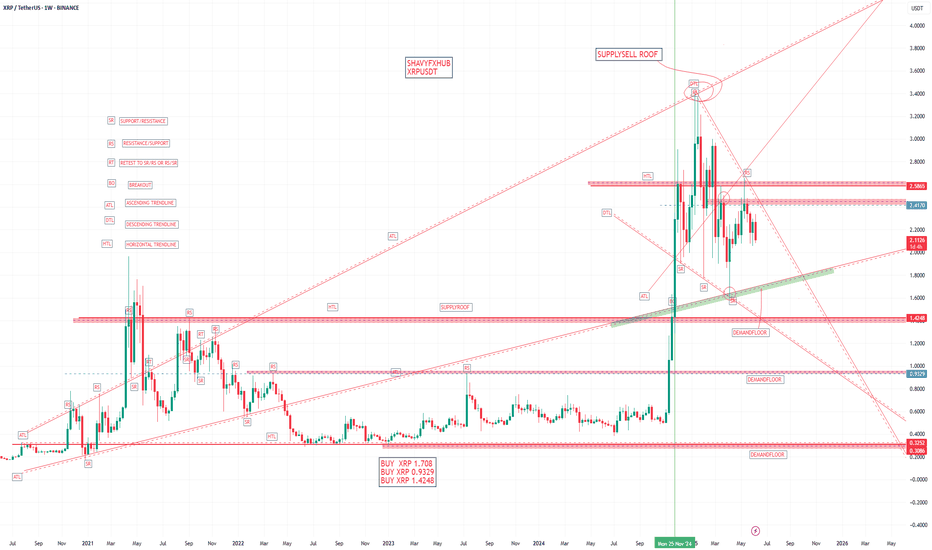
XRPXRP Fundamentals and key buy zone like the 0.9329,1.4248 and 1.708 zone will be watched
1. Regulatory Clarity and Legal Resolution
SEC Lawsuit Resolved: In May 2025, Ripple (the company behind XRP) reached a settlement with the U.S. SEC, reducing its fine and confirming that XRP is not a security for retail investors in the U.S. This has removed a major barrier for institutional adoption and market participation.
Crypto-Friendly Environment: The appointment of a pro-crypto SEC chairman and a more favorable regulatory climate under the current U.S. administration have further boosted confidence in XRP’s legal status and prospects.
2. Institutional and Product Developments
Spot ETF Speculation: There is strong market anticipation for an XRP spot ETF, with major asset managers (like BlackRock and Franklin Templeton) having filed applications. Analysts estimate a high probability of approval by the end of 2025, which could drive significant institutional inflows, similar to what was seen with Bitcoin and Ethereum ETFs.
RippleNet and XRPL Upgrades: Ripple is expanding its network and upgrading the XRP Ledger (XRPL) to support institutional use, including:
Ethereum compatibility (EVM sidechain)
On-chain lending and tokenization of real-world assets
Enhanced compliance and identity features for banks and regulated institutions
Liquidity pools and advanced asset recovery tools
These upgrades are designed to make XRPL a go-to platform for banks and large enterprises.
3. Use Case and Adoption
Cross-Border Payments: XRP is designed for fast, low-cost, and scalable cross-border transactions, positioning it as a competitor to traditional systems like SWIFT.
Partnerships: Ripple has established partnerships with hundreds of financial institutions globally, and is actively targeting the $7.5 trillion daily remittance market.
4. Technical Strength and Market Sentiment
Bullish Technicals: XRP has broken out of bearish patterns and is trading above key technical levels, with strong support from high trading volumes and institutional interest.
Price Predictions: Analyst forecasts for 2025 range from $2.85 (short-term) to $5.50 (year-end), with stretch targets as high as $10–$20 by 2030 if adoption accelerates and an ETF is approved.
5. Risks and Challenges
Market Volatility: XRP, like all cryptocurrencies, remains subject to high volatility and speculative trading.
Overbought Conditions: Technical indicators suggest potential for short-term pullbacks if the market becomes overheated.
Regulatory Delays: While the legal outlook has improved, any delays or rejections of ETF applications could trigger corrections.
Summary Table: XRP Fundamentals (2025)
Legal/Regulatory SEC lawsuit resolved; XRP not a security for retail; pro-crypto policy shift
Institutional Demand High, driven by ETF speculation and RippleNet upgrades
Technology Fast, low-cost, scalable; EVM compatibility; on-chain lending; tokenization
Adoption Growing, strong focus on cross-border payments and financial partnerships
Price Forecasts $2.85–$5.50 (2025), $10–$20 (2030, if adoption/ETF succeed)
Risks Market volatility, ETF approval uncertainty, possible short-term corrections
Conclusion
XRP’s fundamentals in 2025 are the strongest they have been in years, thanks to regulatory clarity, institutional interest, technological upgrades, and real-world adoption in global payments. The prospect of an XRP ETF and Ripple’s push for bank and enterprise integration are key drivers. However, investors should remain aware of volatility and regulatory risks
#xrp #btc #sol
