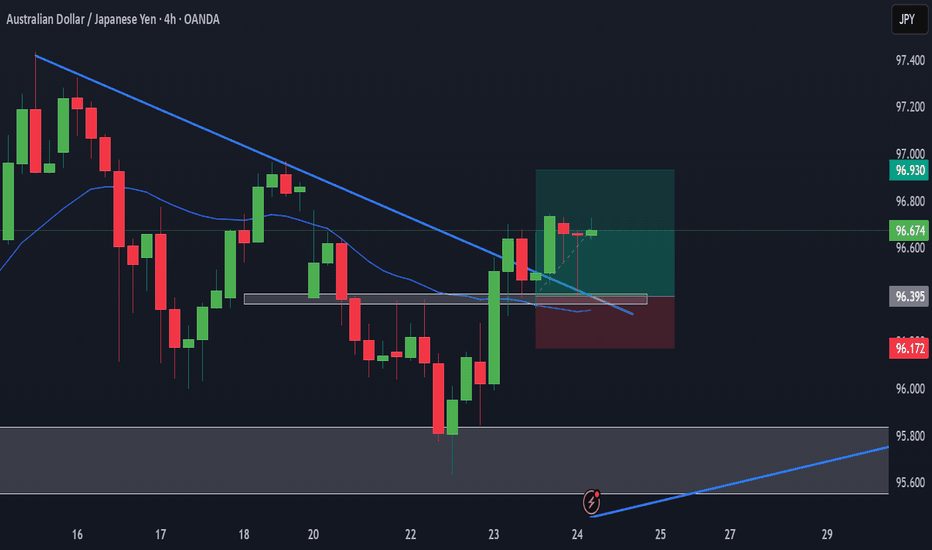
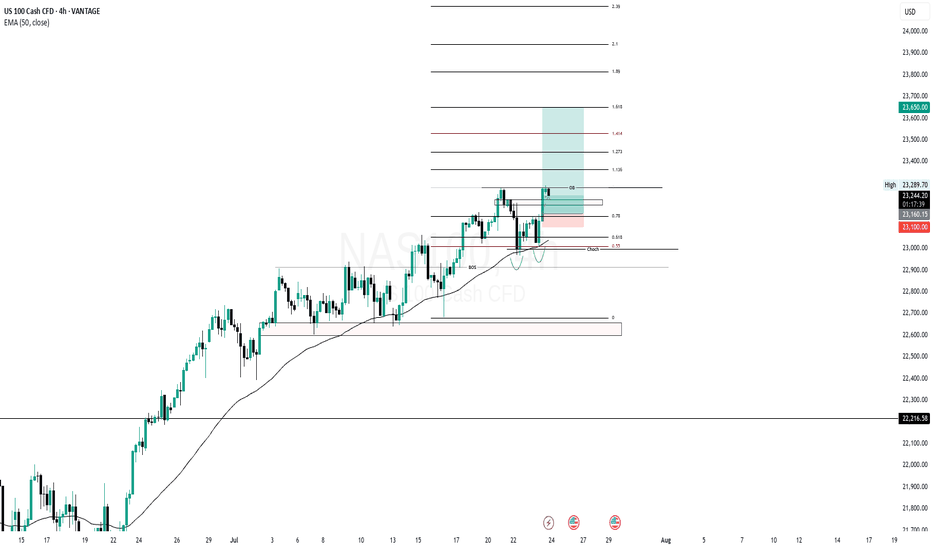
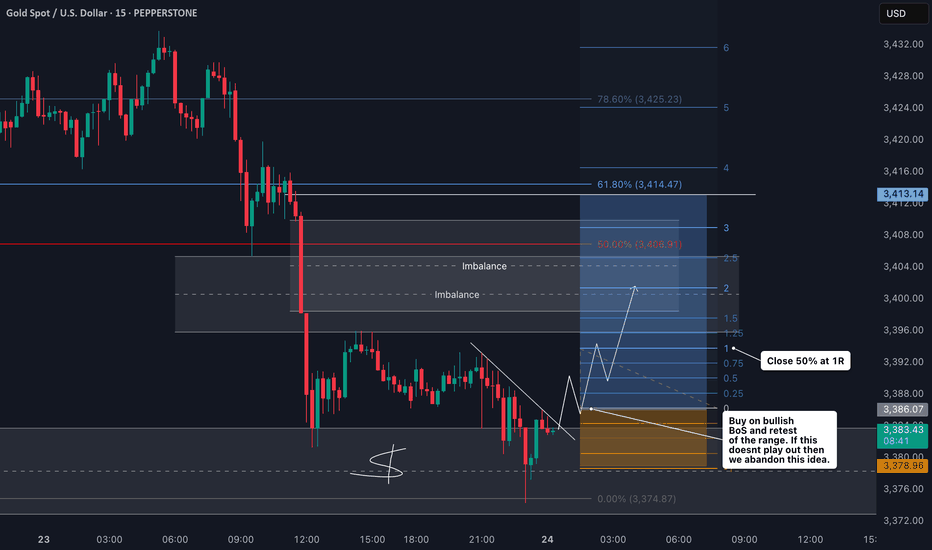
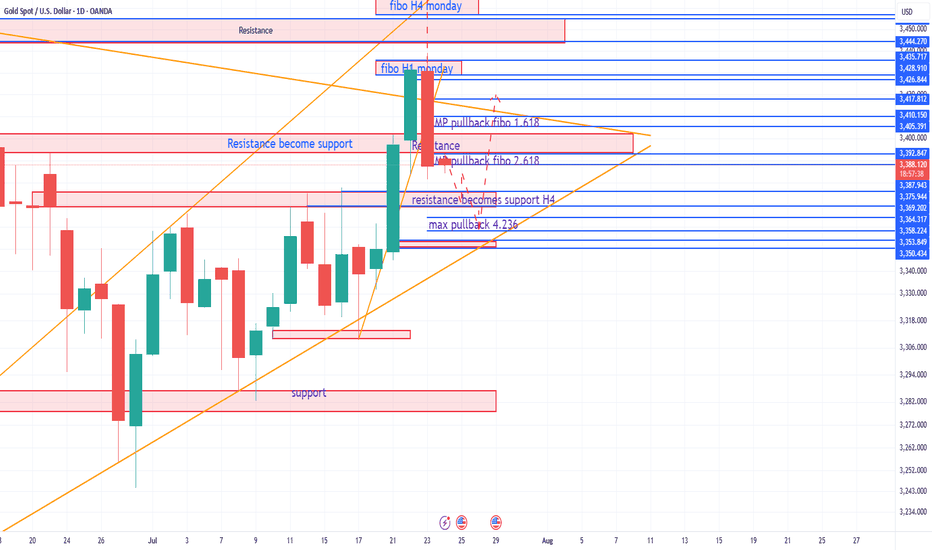
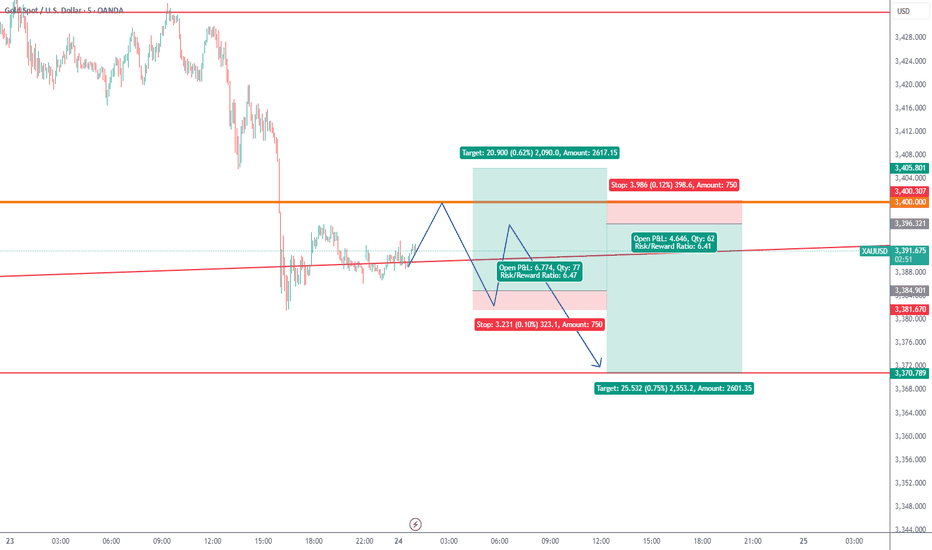
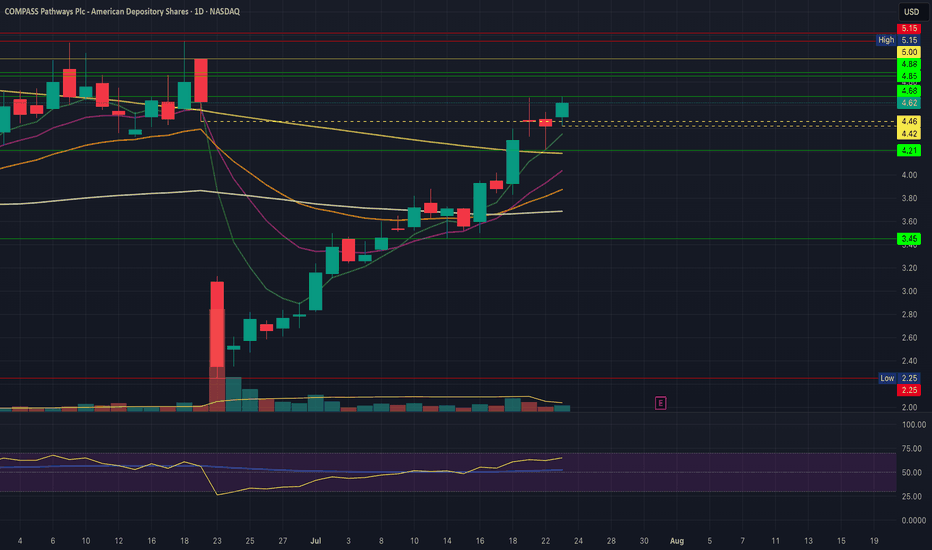
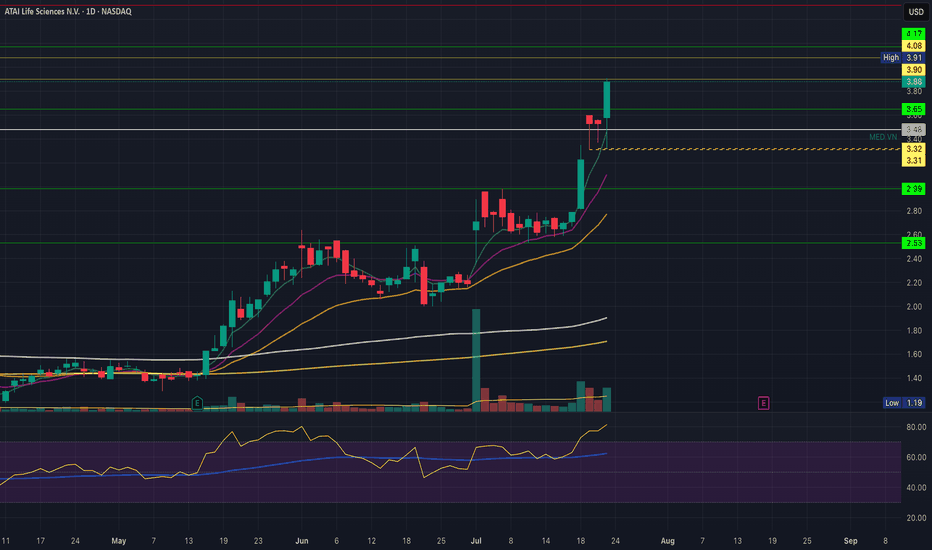
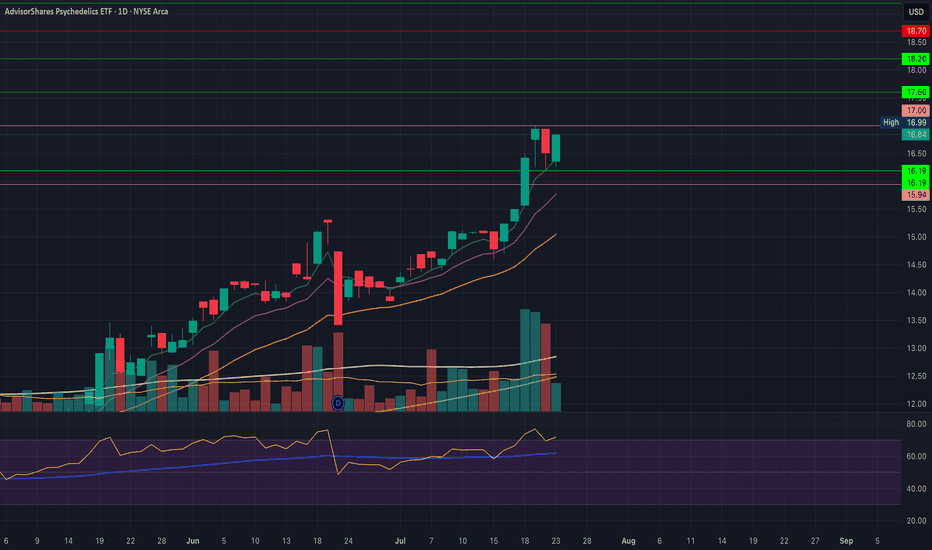
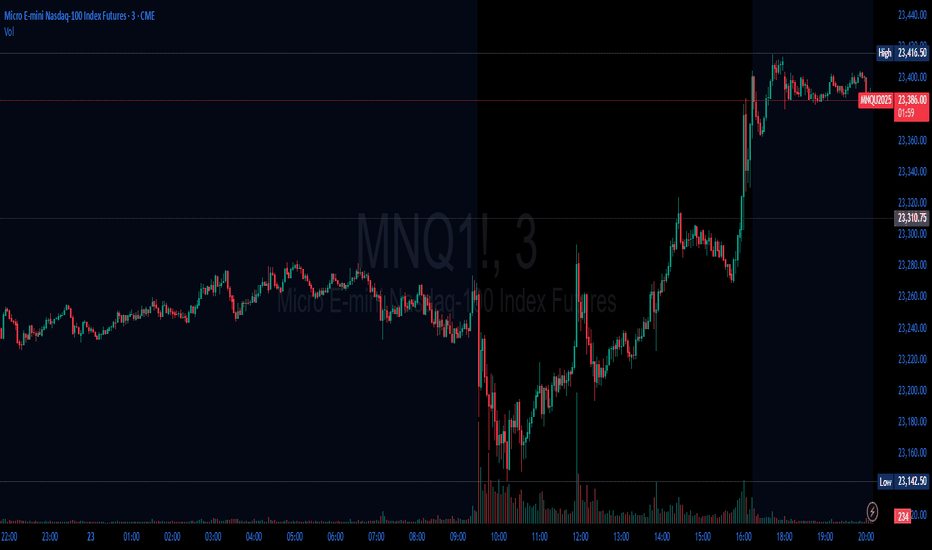
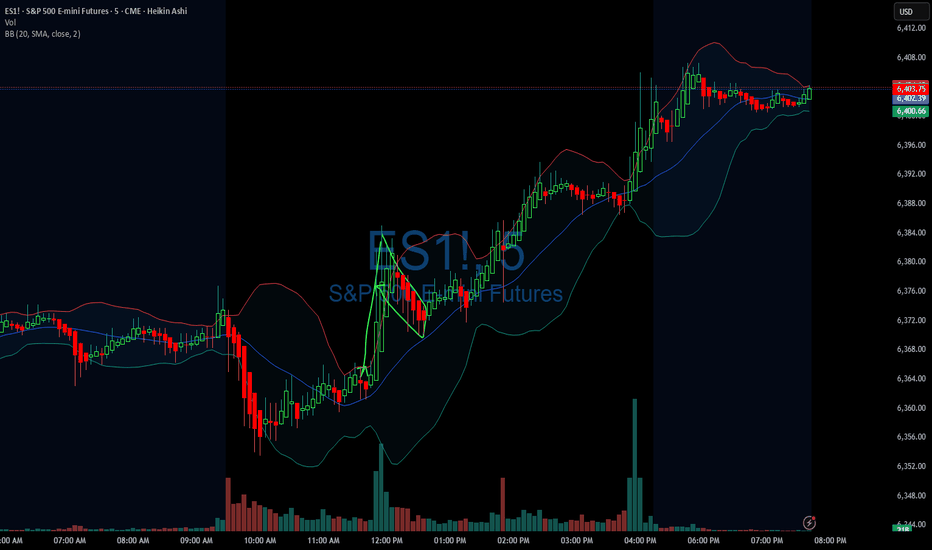
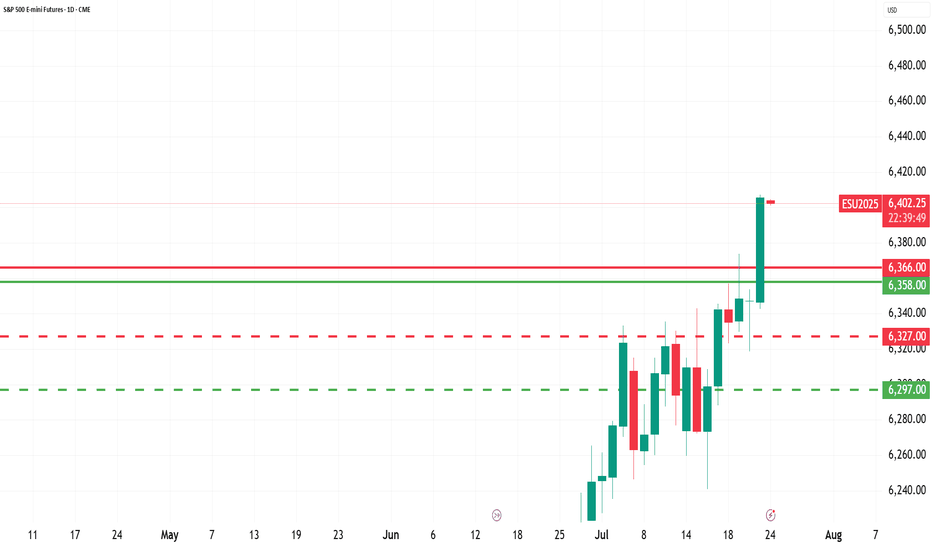
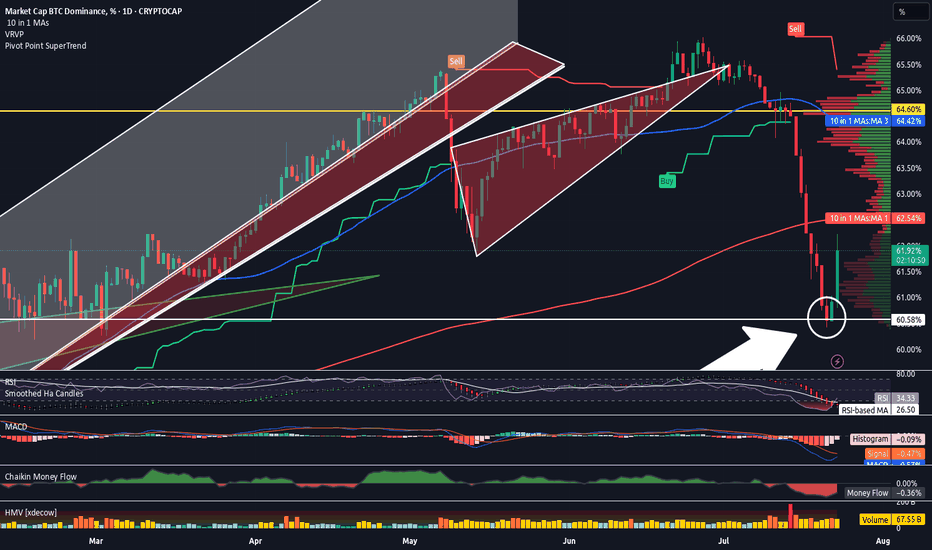
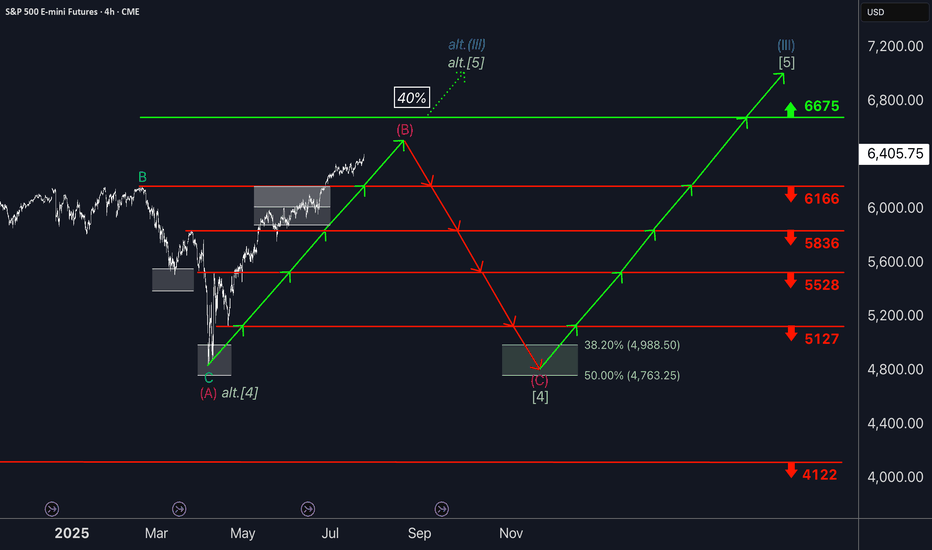
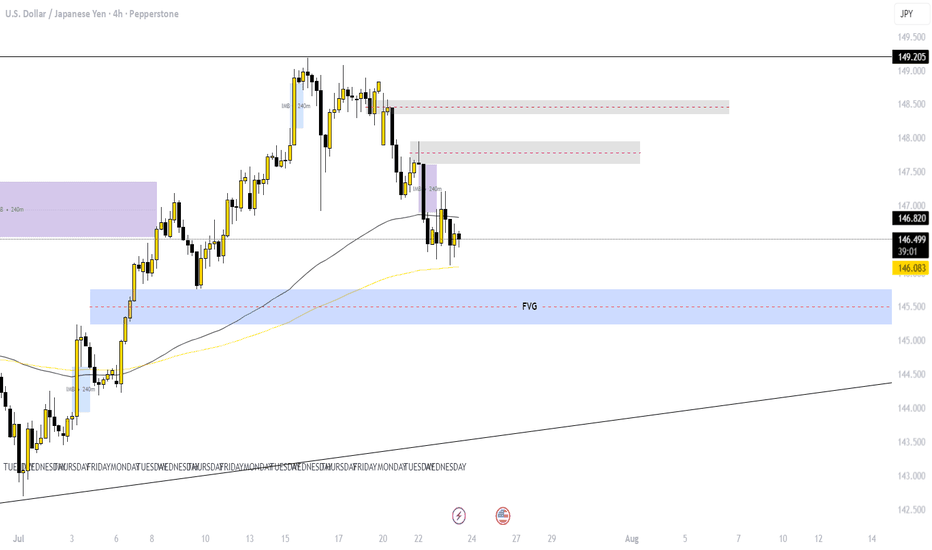
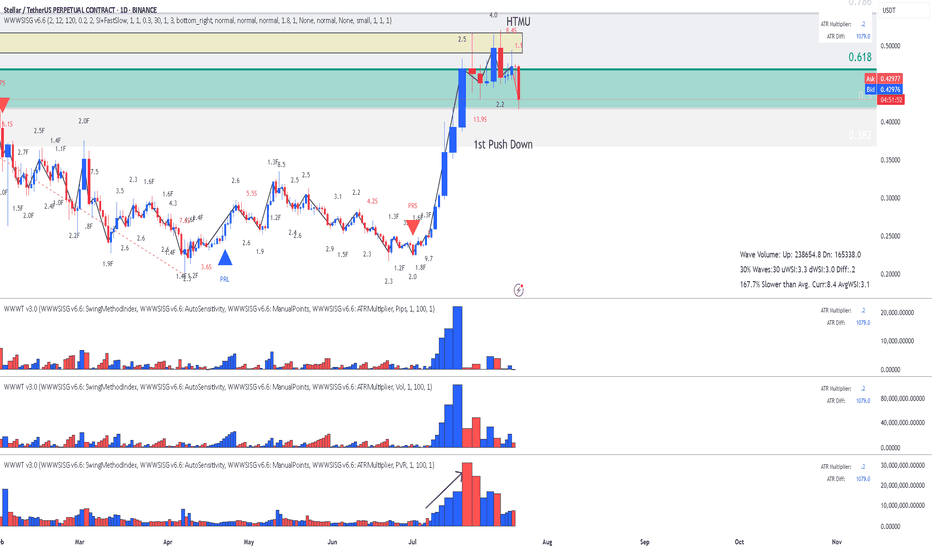
Ethereum set for breakout? Watch this 27-day patternEthereum is forming a 27-day pattern that could trigger a major breakout. After last week's failed move in Bitcoin, Ethereum now sits at a critical level. A breakout above 2741 could signal the start of a big rally, especially if US deregulation news lands. Could this be the beginning of a big move? Watch the full analysis and share your thoughts in the comments.
This content is not directed to residents of the EU or UK. Any opinions, news, research, analyses, prices or other information contained on this website is provided as general market commentary and does not constitute investment advice. ThinkMarkets will not accept liability for any loss or damage including, without limitation, to any loss of profit which may arise directly or indirectly from use of or reliance on such information.
Community ideas
GOLD Relationship Between Gold, Dollar (DXY), Bond Prices, and 10-Year Bond Yields
1. Gold and the Dollar (DXY)
Gold is priced in U.S. dollars, so there is a strong inverse relationship between gold prices and the dollar index (DXY).
When the DXY strengthens, gold becomes more expensive for holders of other currencies, reducing demand and pushing gold prices down.
Recently, gold prices dipped about 0.4% to around $3,294/oz as the DXY shed 0.3%, reflecting a cautious market awaiting U.S.-China trade talks and reacting to stronger U.S. jobs data that tempered expectations of Fed rate cuts.
2. Gold and 10-Year Bond Yields
The 10-year U.S. Treasury yield and gold generally have an inverse relationship. Rising yields increase the opportunity cost of holding non-yielding gold, making bonds more attractive.
However, both gold and bond yields can rise simultaneously during inflationary periods or economic uncertainty, reflecting inflation expectations and safe-haven demand.
Recent data shows yields near 4.5%, with gold holding elevated levels above $3,300 and attempted 3328 before dropping due to inflation concerns and geopolitical risks, despite some downward pressure from rising yields.
3. Gold and Bond Prices
Bond prices move inversely to yields; when yields rise, bond prices fall.
Falling bond prices (rising yields) often signal inflation or risk concerns, which can boost gold as an inflation hedge.
Yet, rising yields also raise the opportunity cost of holding gold, which can cap gold’s upside. This dynamic explains why the correlation between gold and bond yields has weakened recently, sometimes showing near-zero correlation .
4. Macro and Market Drivers
Inflation and Safe-Haven Demand: Persistent inflation and geopolitical tensions (e.g., U.S.-China trade talks) support gold demand despite dollar strength and rising yields.
Central Bank Buying: Central banks remain significant gold buyers, underpinning long-term price support.
Economic Data and Fed Policy: Strong U.S. jobs reports reduce expectations of Fed rate cuts, pushing yields up and dollar strength, which can pressure gold short term.
Conclusion
Gold prices in June 2025 are influenced by a complex interplay of factors: a slightly weaker dollar recently has supported gold, but rising 10-year Treasury yields and falling bond prices exert downward pressure. Inflation concerns and geopolitical risks continue to underpin gold’s appeal as a safe haven and inflation hedge. The usual inverse relationship between gold and bond yields has weakened recently, reflecting evolving market dynamics and the balance between inflation expectations and real yields.
#gold #dollar
EUR/JPY – The Crash Is Loading...Retail just got wiped out again.
Look at this chart — liquidity was taken above the previous highs, exactly where retail traders expected a breakout.
But here’s the truth:
This was never a breakout — it was smart money manipulation.
The market created fake momentum to trap buyers, then swept their stop losses and filled institutional sell orders at premium pricing.
Now the path is set:
Liquidity is taken ✅
No strong continuation after breakout ❌
Perfect rejection candle forming 🧠
Price is likely to retrace all the way to the 162.00 demand zone and even deeper
⚔️ Why You Need to Act Now:
This is a textbook high risk-reward opportunity:
Entry after liquidity sweep
SL tight above the wick
Massive downside room
Smart money already positioned — you should be too
💡 Remember: The market doesn’t move by luck — it moves by manipulation.
Those who understand that… capitalize on it.
Guide: How to Read the Smart Farmer SystemDear Reader , Thank you for tuning in to my first video publication.
This video explains the 3-step signal validation process—helping you quickly and precisely anticipate market intent and liquidity dynamics before taking action.
We do not react to noise; we respond with structured execution because we understand the market’s true game.
Listen to the market— this guide is here to sharpen your journey.
Correction Notice (16:58 timestamp): A slight clarification on the statement regarding signal validation :
SELL signals: The trading price must close BELOW the Price of Control (POC) and Value Average Pricing (VAP) without invalidation occurring in both the confirmation candle and progress candle.
BUY signals: The trading price must close ABOVE the Price of Control (POC) and Value Average Pricing (VAP) without invalidation occurring in both the confirmation candle and progress candle.
Multiple signals indicate liquidity games are actively unfolding, including accumulation, control, distribution, and offloading.
GOLD 3HR CHARTRelationship Between Gold, Dollar (DXY), Bond Prices, and 10-Year Bond Yields
GOLD ,early sell dropped price from 3328.9 to 3304 .the 3304 align with the ascending trendline and currently trading at 3320.break and close of the demand floor will push for more sell to around 3270-3268
1. Gold and the Dollar (DXY)
Gold is priced in U.S. dollars, so there is a strong inverse relationship between gold prices and the dollar index (DXY).
When the DXY strengthens, gold becomes more expensive for holders of other currencies, reducing demand and pushing gold prices down.
Recently, gold prices dipped about 0.4% to around $3,294/oz as the DXY shed 0.3%, reflecting a cautious market awaiting U.S.-China trade talks and reacting to stronger U.S. jobs data that tempered expectations of Fed rate cuts.
2. Gold and 10-Year Bond Yields
The 10-year U.S. Treasury yield and gold generally have an inverse relationship. Rising yields increase the opportunity cost of holding non-yielding gold, making bonds more attractive.
However, both gold and bond yields can rise simultaneously during inflationary periods or economic uncertainty, reflecting inflation expectations and safe-haven demand.
Recent data shows yields near 4.5%, with gold holding elevated levels above $3,300 and attempted 3328 on monday before dropping due to inflation concerns and geopolitical risks, despite some downward pressure from rising yields.
3. Gold and Bond Prices
Bond prices move inversely to yields; when yields rise, bond prices fall.
Falling bond prices (rising yields) often signal inflation or risk concerns, which can boost gold as an inflation hedge.
Yet, rising yields also raise the opportunity cost of holding gold, which can cap gold’s upside. This dynamic explains why the correlation between gold and bond yields has weakened recently, sometimes showing near-zero correlation .
4. Macro and Market Drivers
Inflation and Safe-Haven Demand: Persistent inflation and geopolitical tensions (e.g., U.S.-China trade talks) support gold demand despite dollar strength and rising yields.
Central Bank Buying: Central banks remain significant gold buyers, underpinning long-term price support.
Economic Data and Fed Policy: Strong U.S. jobs reports reduce expectations of Fed rate cuts, pushing yields up and dollar strength, which can pressure gold short term.
Conclusion
Gold prices in June 2025 are influenced by a complex interplay of factors: a slightly weaker dollar recently has supported gold, but rising 10-year Treasury yields and falling bond prices exert downward pressure. Inflation concerns and geopolitical risks continue to underpin gold’s appeal as a safe haven and inflation hedge. The usual inverse relationship between gold and bond yields has weakened recently, reflecting evolving market dynamics and the balance between inflation expectations and real yields.
#gold #dollar
ETH: USD & Stablecoins are ALLIES | Stablecoin SuperCycle Part 2Video Timestamps:
0:00 U.S. Dollar & Stablecoins are now BEST FRIENDS
3:28 Ethereum DOMINATES Stablecoin Market!
4:00 Ethereum Risk & Regression Analysis
5:58 Hong Kong to use Chainlink protocol in CBDC pilot project
7:34 Ethereum Elliott Wave Count + Fibbonaci Work + Bull Market Price Targets
06/09/25 Trade Journal, and Where is the Stock Market going tomoEOD accountability report: +1800
Sleep: 9 hours
Overall health: Good
What was my initial plan?
Bearish going into the market since we had bearish structure, but missed the short at the start of the market. So just waited for gamma levels to hit orr 1 min MOB to be lost before shorting.
Daily Trade recap based on VX Algo System from (9:30am to 2pm)
— 9:30 AM Market Structure flipped bearish on VX Algo X3!
— 10:20 AM VXAlgo YM X1 Buy Signal,
— 11:00 AM Market Structure flipped bullish on VX Algo X3!
— 1:17 PM VXAlgo NQ X1 Sell Signal (triple sell signal by 1:20)
Next day plan--> Above 6000 = Bullish, Under 5990 = Bearish
Video Recaps -->https://tradingview.sweetlogin.com/u/WallSt007/#published-charts
Will the U.S. Dollar Bear go out to lunch and take a break?In this video I go over the case for the U.S. Dollar bear taking a break and price action getting a pullback across the EUR/USD, GBP/USD and USD/JPY.
I took a 42% profit on EUR/USD longs and currently keeping an eye on a short opportunity if weakness starts to creep in on the price action.
Long term, I remain U.S. Dollar bearish across the board however pullbacks are always expected during a macro price move.
If we trade higher, so be it and I will evaluate what the next position will be.
As always, Good Luck & Trade Safe.
GOLD Relationship Between Gold, Dollar (DXY), Bond Prices, and 10-Year Bond Yields
1. Gold and the Dollar (DXY)
Gold is priced in U.S. dollars, so there is a strong inverse relationship between gold prices and the dollar index (DXY).
When the DXY strengthens, gold becomes more expensive for holders of other currencies, reducing demand and pushing gold prices down.
Recently, gold prices dipped about 0.4% to around $3,294/oz as the DXY shed 0.3%, reflecting a cautious market awaiting U.S.-China trade talks and reacting to stronger U.S. jobs data that tempered expectations of Fed rate cuts.
2. Gold and 10-Year Bond Yields
The 10-year U.S. Treasury yield and gold generally have an inverse relationship. Rising yields increase the opportunity cost of holding non-yielding gold, making bonds more attractive.
However, both gold and bond yields can rise simultaneously during inflationary periods or economic uncertainty, reflecting inflation expectations and safe-haven demand.
Recent data shows yields near 4.5%, with gold holding elevated levels above $3,300 and attempted 3328 before dropping due to inflation concerns and geopolitical risks, despite some downward pressure from rising yields.
3. Gold and Bond Prices
Bond prices move inversely to yields; when yields rise, bond prices fall.
Falling bond prices (rising yields) often signal inflation or risk concerns, which can boost gold as an inflation hedge.
Yet, rising yields also raise the opportunity cost of holding gold, which can cap gold’s upside. This dynamic explains why the correlation between gold and bond yields has weakened recently, sometimes showing near-zero correlation .
4. Macro and Market Drivers
Inflation and Safe-Haven Demand: Persistent inflation and geopolitical tensions (e.g., U.S.-China trade talks) support gold demand despite dollar strength and rising yields.
Central Bank Buying: Central banks remain significant gold buyers, underpinning long-term price support.
Economic Data and Fed Policy: Strong U.S. jobs reports reduce expectations of Fed rate cuts, pushing yields up and dollar strength, which can pressure gold short term.
Conclusion
Gold prices in June 2025 are influenced by a complex interplay of factors: a slightly weaker dollar recently has supported gold, but rising 10-year Treasury yields and falling bond prices exert downward pressure. Inflation concerns and geopolitical risks continue to underpin gold’s appeal as a safe haven and inflation hedge. The usual inverse relationship between gold and bond yields has weakened recently, reflecting evolving market dynamics and the balance between inflation expectations and real yields.
#gold #dollar
XAUUSD/BTC / USDJPY forecast 10/06/2025XAUUSD Forecast | VSA & Trend Line Analysis | Gold Price Prediction
In this video, I share my detailed forecast for XAUUSD (Gold vs. USD) using Volume Spread Analysis (VSA) and trend line strategies. Watch as I break down the market structure, identify key levels, and explain the logic behind potential moves in gold.
DOLLARThe relationship between the US dollar (USD), the 10-year Treasury bond yield, and bond prices is tightly interconnected and crucial for global markets.
1. 10-Year Bond Yield and Bond Price
Inverse Relationship:
As the yield on the 10-year Treasury rises, the price of the bond falls, and vice versa. This is because the bond’s coupon payment is fixed; when new bonds are issued with higher yields, existing bonds with lower coupons become less attractive, so their prices drop to compensate.
Recent Movement:
In May and early June 2025, the US 10-year Treasury yield rose from 4.18% to around 4.50%, a move of over 30 basis points, driven by strong economic data and expectations that the Federal Reserve will keep rates higher for longer.
2. 10-Year Bond Yield and the Dollar (DXY)
Direct Relationship:
Generally, when the 10-year Treasury yield rises, the US dollar strengthens. Higher yields attract foreign investment into US assets, increasing demand for USD.
Recent Example:
After the stronger-than-expected May jobs report, the 10-year yield jumped to 4.50% from 4.3% on thursday and the dollar index (DXY) also rose, reflecting investor expectations of prolonged high US rates and robust economic performance.
3. Bond Price and the Dollar
When bond prices fall (and yields rise), it often signals expectations for higher interest rates or inflation, both of which tend to support a stronger dollar as investors seek higher returns in USD assets.
Conversely, when bond prices rise (and yields fall), it can indicate economic uncertainty or expectations of rate cuts, which may weaken the dollar.
Key Takeaway
Rising 10-year Treasury yields lead to falling bond prices and typically a stronger US dollar, as higher yields attract global capital seeking better returns.
This dynamic is especially pronounced when strong US economic data or hawkish Fed expectations are in play, as seen in the recent market reaction to the robust US jobs report.
#dxy#dollar #gold
xauusd weekly analysis
**XAU/USD Weekly Analysis**
*(June 2-13, 2025)*
---
### **LAST WEEK'S PERFORMANCE (June 2-6)**
**Price Action:**
- Weekly decline: **~2%**
- Key levels:
- Resistance: $3,355–$3,381 (61.8% Fibo)
- Support: $3,272–$3,288 (38.2% Fibo)
- Range: $3,291.50 (low) to $3,365 (high)
- Close: Near $3,310–$3,316
**Key Drivers:**
1. **USD Strength**: Fiscal concerns (Senate tax bill debate adding $3.8T debt)
2. **Reduced Safe-Haven Demand**: Trump delayed EU tariffs to July 9
3. **Central Bank Caution**: Market awaited ECB/BoC decisions and U.S. jobs data
---
### **NEXT WEEK OUTLOOK (June 9-13)**
**Critical Technical Levels:**
| **Support** | **Resistance** |
|-------------------|-------------------|
| $3,272–$3,288 | $3,370–$3,375 |
| $3,295 (SMA) | $3,381 (Key Breakout) |
| $3,210–$3,214 | $3,400–$3,434 |
**Fundamental Catalysts:**
1. **Central Banks**:
- ECB Decision (June 12) → Dovish stance = USD strength
- BoC Decision (June 11) → Rate cuts may boost USD
2. **U.S. Data**:
- Non-Farm Payrolls (June 13) → Strong data = fewer Fed rate cuts
3. **Geopolitical Risks**:
- Escalations in Ukraine/Middle East → Safe-haven demand
4. **U.S. Fiscal Policy**: Senate vote on $3.8T tax bill
**Market Sentiment:**
- **Bullish Case**: Break above $3,381 targets $3,500–$3,800
- **Bearish Risks**: Breakdown below $3,272 risks drop to $3,160
---
### **TRADING STRATEGY**
**Key Approaches:**
- **🔺 Long Setup**:
- Entry: Above $3,381
- Target: $3,500
- Stop-loss: $3,320
- **🔻 Short Setup**:
- Entry: Below $3,272
- Target: $3,210
- Stop-loss: $3,310
- **Event Hedging**: Use options around ECB/BoC/NFP events
**Risk Management Note:**
> "Gold's trajectory hinges on USD dynamics and central bank guidance. A weekly close above $3,381 confirms bull trend resumption."
---
### **KEY EVENTS CALENDAR**
| Date | Event | Impact Level |
|------------|---------------------------|--------------|
| June 11 | Bank of Canada Rate Decision | High |
| June 12 | ECB Rate Decision | High |
| June 13 | US Non-Farm Payrolls | Very High |
| Mid-week | US Senate Tax Bill Vote | Moderate-High|
---
**Conclusion:**
Next week presents a binary setup for XAU/USD:
- Break above **$3,381** opens path to $3,500+
- Failure to hold **$3,272** risks correction to $3,210
Prioritize risk management during high-impact events. The long-term uptrend remains intact but short-term direction depends on USD and central bank policy.
for intra day traders and scalpers follow the range zone
Are The Markets Running Out Of Steam? SPY just cant seemed to hold above the 600 psychological level.
Are big players unloading into this positive market strength?
Are we due for a larger pullback?
There's a lot of mixed price action and we just cant seem to make a true breakout.
Some names are underperforming and other names are outperforming.
We remain tactically bullish while trimming keys positions into strength.
Being nimble in this market us key as were seeing large intra day swings.
Short term there is some risk of lower price so we have hedged in some individual names while still remaining bullish.